72
HL Display Annual Report 2008
1HL DispLay ÅrsreDovisning 2007
HL Displayannual report 2008

HL DispLay ÅrsreDovisning 2007 2
3 The year in brief 4 This is HL Display 6 Statement by the CEO 8 Business concept, targets and strategies 11 HL Display operations 12 Core process 1 Market, sales and customer relations 17 Core process 2 Development, launch and product range management 21 Core process 3 production and delivery of goods and services 24 HL Display and the environment 25 Support processes 28 Customer case study 30 The share 32 Risk and sensitivity analysis 33 Nine year summary 33 Definitions 34 Administration report Group 36 Consolidated income statements 37 Consolidated balance sheets 38 Consolidated statement of changes in equity 38 Consolidated cash flow statements Parent Company 39 parent Company’s income statements 40 parent Company’s balance sheets 41 statement of changes in the parent Company’s equity 41 parent Company’s cash flow statements 42 Notes 61 Audit report 62 Corporate governance report 2008 67 Board of Directors 68 Senior executives 69 History 70 Financial information
This annual report has been prepared in swedish and translated into english. in the event of any discrepancies between the swedish and the translation, the former shall have precedence.
Con
tent
s

3HL DispLay ÅrsreDovisning 2007
The year in brief
Net sales decreased to MSEK 1,536 (1,571).Profit before tax was MSEK 136 (155).Earnings per share after tax amounted to SEK 3.11 (3.49, corrected for share split).Equity per share amounted to SEK 17.40 (15.24, corrected for share split) as of 31 December 2008.A 4:1 share split was carried out with record date on 28 April.
Key ratios 2008 2007 2006net sales, MseK 1,536 1,571 1,448operating profit, MseK 130 161 107profit before tax, MseK 136 155 92profit after tax, MseK 96 108 62earnings per share, seK 3.11 3.49 1.97eBiTa margin, % 8.5 10.3 7.4eBT margin, % 8.9 9.8 6.4equity/assets ratio, % 57.3 53.3 44.2equity per share, seK 17.40 15.24 12.50average number of employees 983 968 952
For key ratio definitions, refer to page 33.
The
year
in
brie
fH
L D
ispla
y annual r
eport
20
08
3

HL DispLay ÅrsreDovisning 2007 4
This is HL Display
Where HL Display operatesHL Display has 32 of its own sales companies in 32 countries in Western europe, eastern europe and asia. The five biggest markets are France, sweden, norway, russia and the UK. a further 13 countries are serviced via distributors.
HL Display’s customersHL Display’s business is aimed primarily at three customer segments:– Food retail– non-food retail– Brand manufacturers
HL Display’s product rangeOptishop™
This is HL Display’s range for the retail sector (food and non-food retail). The range consists of items including:– products and solutions that display
goods to consumers in an attractive way. a well laid out merchandising solution makes optimal use of shelf space and stimulates the consumer to make a purchase.
– products and solutions that give consumers all the necessary purchasing information and help them to find their way around the shop quickly.
Brandman™
This is HL Display’s range of products for brand manufacturers, and consists of items including:– products and solutions to guarantee that
brand manufacturers can make the best possible use of their space on shelves in the shop.
– products and solutions to display brand manufacturers’ goods in other parts of the shop, for example floor stands.
HL Display’s biggest customers in each segment:
Food retail Brand manufacturers
ahold (incl. iCa)auchanCarrefourCasinoChampion intermarché Metrosysteme UTescoWal-Mart (asDa)
BaT ColgateDanone Kraft L’oréal Masterfoods nestléphilip Morris procter & gambleUnilever
non-food retail
BaumaxDecathlonDsg retail Ltd
iKeaintergammaMüller
Own sales companies
austria BelgiumBulgaria China (Hong Kong) China (shanghai) the Czech republic Finland France germany Hungary india indonesia Latvia/Lithuania Malaysiathe netherlands norway
poland rumania russia serbia singapore slovakia slovenia south Korea spain swedenswitzerland Taiwan Thailand Turkey the UK Ukraine
Distributors
australiaCanadaDenmarkestoniagreeceicelandireland
israelitalyKazakhstannew Zealandportugalthe Usa
HL Display is a leading international supplier of products and solutions for in-store communication and merchandising to the food and non-food retail sectors. The company is also a leading supplier of products and solutions to brand manufacturers for merchandising on the shelf and in other parts of the store. HL Display was founded in 1954 and the company share was first listed on the Stock Exchange in 1993. The share is now traded on the Nasdaq OMX Small Cap list.
This
is
HL
Dis
play
HL
Dis
pla
y annual r
eport
20
08
4

5HL DispLay ÅrsreDovisning 2007
The value of HL Display’s solutionsFor the food and non-food retail sectors:– Create clearer in-store communication so
that shops avoid losing sales because consumers cannot quickly find what they are looking for in the shop or what products cost.
– Display goods in a way that make shopping simple for the consumer and stimulate purchases.
– Make cost savings possible by rationalising work in the shop. one example is the automatic feeding of products, which means that less time is spent on keeping shelves in order, while at the same time the shelves can quickly be topped up with new products.
For brand manufacturers:– Create an attractive product display both
on the shelf and in other parts of the shop, for example in connection with campaigns. a good merchandising solution stimulates purchases and is at the same time easy to maintain.
– Make it possible to achieve maximum utilisation of the shelf space provided.
HL Display’s factoriesHL Display has seven factories in all. Four of these are in sweden (one of which is co-owned). The rest are in China, the UK and the Usa (co-owned).
Net sales MSEK
0
200
400
600
800
1,000
1,200
1,400
1,600
1,800
20082007200620052004
1,249 1,285
1,4481,571 1,536
Average number of employees
900
920
940
960
980
1,000
20082007200620052004
967
933
952
968
983
Operating profit MSEK
0
20
40
60
80
100
120
140
160
180
20082007200620052004
108
63
107
161
130
The Nordic countries 332Western Europe 706Eastern Europe 350Asia and Australia 132North America 16
Net sales per region MSEK
EBITA margin %
0
2
4
6
8
10
12
20082007200620052004
4.9
Goal 12%
7.4
10.3
8.58.6
This
is
HL
Dis
play
HL
Dis
pla
y annual r
eport
20
08
5

HL DispLay ÅrsreDovisning 2007 6
make better use of what makes HL Display unique in the market: our vast expertise in how to display goods to simplify work in the shop while at the same time increasing its sales, as well as our product development. We must be out with our customers and work with them to identify areas for development and potential for improvement. it is then our job to provide them with solutions for this.
Organisational changesTo further emphasise the importance of sales we have implemented a new organi-sational structure during January 2009. The new, matrix-based, organisation will mean that the area Managers report directly to me, which sends a strong message, not least within our own organisation, about the increased focus on sales. at the same time, the area Managers will be assigned greater responsibilities which includes full responsibility for financials as well as sales for their respective areas.
Efficient businessThe operating profit totalled MseK 130, a drop of 19 per cent compared to the previous year. This corresponds to an eBiTa margin of 8,5 per cent, which i con-sider satisfactory against the background of the sales decrease. it also serves as a clear example of the fact that we have been successful in our work to improve the business as a whole, not least production, which we have been working hard to achieve for several years. HL Display also had zero growth between 2002–2003 and 2004–2005, although in both these cases the lack of growth had a very significant impact on the profit figure. This is not the case this year – proof that our business is now far more efficient.
Continued improvement in gross marginDuring the year there was a positive effect on our profit from an increase in the gross margin and a negative one because operating expenses were too high.
The continued improvement in the gross margin is based on a number of factors in combination. in addition to the measures to improve productivity that we are implementing on an ongoing basis, our
strong position despite turbulent year
2008 has been a year that has been characterised to a great extent by the turbulence in the global financial markets and clear signs of an economic downturn. as far as HL Display is concerned, i can confirm that we face these difficult times as a strong company in good condition. Work in recent years has had a clear emphasis on profitability improvement and we are currently running a far more efficient business than was the case a few years ago. We also have a strong balance sheet with low indebtedness.
Sales trend during the yearsales for 2008 totalled MseK 1,536, a drop of 2 per cent compared to the previous year. in general we can confirm that customers have been more cautious where new investments are concerned. The picture varies greatly between different regions
and countries. in some countries, such as spain and France, we can see clear signs of a more dramatic hold on investments, while this is less evident in scandinavia. growth in norway, for example, reached a high level also in 2008, totalling 11 per cent – a very good outcome in a mature market.
sales for the year have also been negatively affected by a weak development in russia, which in part is due to internal issues. Moreover, the recovery on markets where we had problems in the past, for example germany, has not been as fast as expected.
Improving sales workHaving said that, we must remember that we are the ones who shape much of the success in the market, and we are working continuously to improve our sales work and what we have to offer our customers. at present none of HL Display’s competitors have the same breadth in their product range and an equally well-developed global presence. it is our ambition to achieve growth despite the fact that climate in the market will be tougher for a while. one important element of this is that we must
Sta
tem
ent
by t
he C
EO
HL
Dis
pla
y annual r
eport
20
08
6
7HL DispLay ÅrsreDovisning 2007
new logistical structure with regional ware-houses has resulted in an increase in the average order size. This in turn creates longer production runs, which is an impor-tant precondition for efficient production.
in this column last year i told you about plans to start up production in russia in 2008. We can now confirm that this task has taken much longer than we expected. our aim is that we will be able to start production in russia in 2009, albeit on a smaller scale to begin with.
The significant productivity improve-ments in production mean that we now produce more with fewer machines. as a consequence, we currently face an issue of over-capacity in production, which will be dealt with during 2009.
No cost increases in 2009as far as operating expenses are concerned, it is our long term aim that these expenses, excluding freight, will be less than 30 per cent of sales. They were too high in 2008, corresponding to 35 per cent of sales, which had a negative impact on our profit. The long-term target remains, but is not expected to be reached as long as sales growth is below our target. During 2009, we will focus on keeping operating expenses unchanged in local currencies.
Developments in our various regionsas i mentioned at the beginning, develop-ments in our company vary between the various countries and regions. in the nordic markets we have so far not seen many signs of the economic downturn. sales have grown, thanks largely to a continued healthy trend in norway and Finland.
as far as Western europe is concerned, the sales trend has failed to meet our expectations. We can clearly see that the retail sector is focusing extensively on cost, and is therefore deferring invest-ments. in France for example, which is our biggest single market, there has been no growth for a couple of years. it is, however, pleasing to note that the work on rationali-sation that has been undertaken in France has affected the profit figure, which has now returned to healthy levels. in some markets where we have had problems in the past, such as the UK and Benelux, our determined work is now starting to produce results. in both countries we are starting to see the signs of recovery. We do, however, still have some work to do before we reach the position for which we are striving.
in eastern europe there have been
acquisition targets on our list more readily available. This, combined with HL Display’s good financial facilities for acquisitions, should increase our oportunities to conduct acquisitions in the years ahead.
Continued environmental initiativesin 2008 we have continued our work on reducing the environmental impact created by our business – an important, high-priority area for us. Most of the environmental impact comes from the plastic waste generated in production, and it is therefore natural that we have chosen to concentrate many of our efforts on reducing this. Work is taking place on two fronts. First of all, we are working on improving the production processes so that we minimise the waste actually generated in production. secondly, we are working to develop methods that allow us to reuse the waste directly in our own production.
Outlook for 2009as i sum up 2008, i can confirm that in terms of sales we have been affected by the global economic downturn. yet it is pleasing to note that despite a sales decrease we have been able to retain a good level of profitability. in terms of profits, 2008 was the second best year in HL Display’s history. i would like to thank all employees who have shown tremendous commitment in making it possible for us to develop the company during the year.
at the time of writing, in January 2009, it is still difficult to predict how the market will develop over the year ahead and how this in turn will affect our business. i can however confirm that the picture has grown increas-ingly darker over the past few months.
our financial position is strong and we have implemented a number of measures to retain profitability. at the same time we have clearly set our sights on creating growth, and we have a number of develop-ment projects under way in the company. We must, however, be humble towards the fact that market climate can deteriorate rapidly and that this could have distinct negative effects on our business. This means that we will be paying very close attention to changes in the market climate and are prepared to respond quickly and appropriately if required.
stockholm, January 2009Gérard DubuyManaging Director and Ceo
positive developments in many countries, including in poland and Ukraine. yet the picture for region as a whole is adversely affected by the trend in russia, which was weak in 2008. There was a significant increase in competition in the russian market, which also created more pressure on prices.
as in the nordic countries, we have con-tinued to see a healthy trend in asia. The fact is that December 2008 was the best-ever month for the region. We can see that our competitive strength has improved, not least as a consequence of our setting up local production through the factory in suzhou. sales increased by 15 per cent during the year, which means that the region now accounts for 8 per cent of the group’s total sales.
Product development – a decisive competitive advantageHL Display invests more in product develop-ment than anyone else in our industry. We view this as our most important competitive tool. our ambition is clear: we shall be the player that develops the innovations that become industry standards. in 2008 the aim was to raise the level of innovation in our product development, and this resulted in the launch of several new solutions, including the merchandising solutions sideKick™ and Heroshelf™.
While we are striving to achieve a high level of innovation, our development work is definitely market-driven and is conducted in close collaboration with customers. This ensures that we develop solutions that meet customers’ requirements and needs, and for which there is an immediate demand. in 2009 we will be further increasing the rate of product development, and we have a number of interesting projects under way.
AcquisitionsHL Display has clearly stated its ambition to reinforce both its market position and its range of products and services through acquisitions. We also work very actively on these matters. at the same time i can confirm that this is a long-term process, which is both complex and time-consuming. The potential acquisition targets that we are looking at must satisfy a specification of requirements in both financial and commercial terms.
The change in tempo that we are now seeing in the current economic situation may possibly bring about new possible acquisitions and make some of the
Sta
tem
ent
by t
he C
EO
HL
Dis
pla
y annual r
eport
20
08
7
HL DispLay ÅrsreDovisning 2007 8
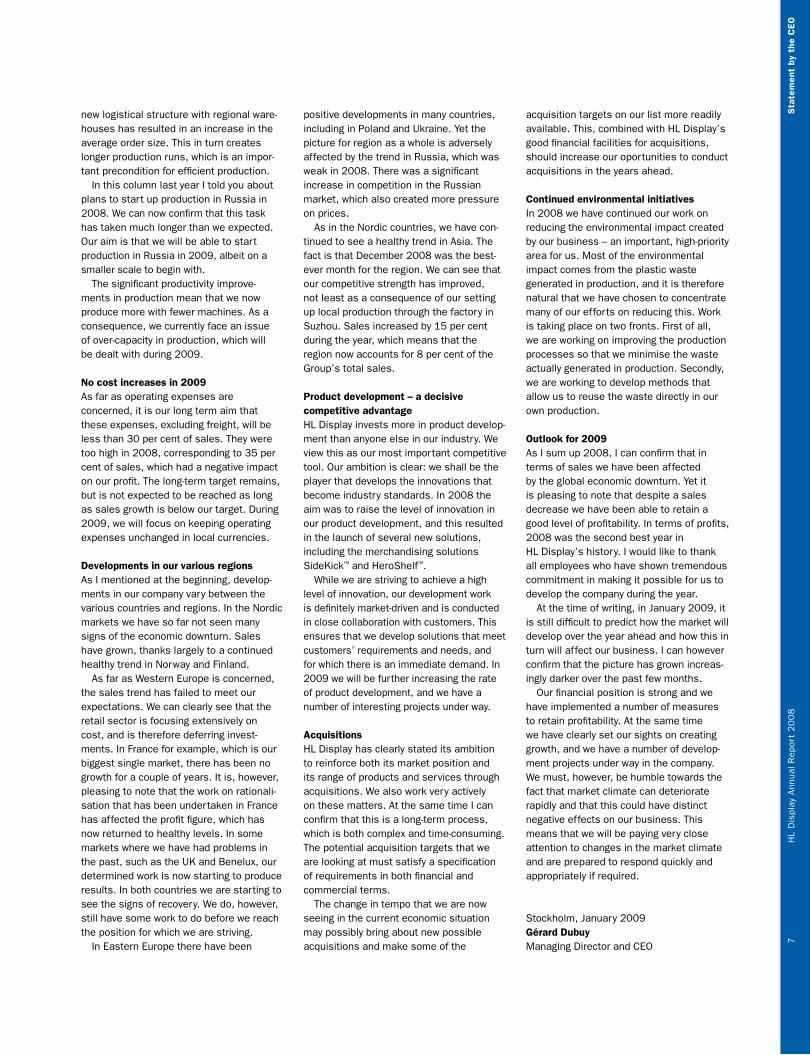
How HL Display works to achieve its financial targets
The profit targetThe profit target shall be achieved by means of growth in volume combined with contin-ued rationalisation measures. For a number of years HL Display has been implementing wide-ranging efficiency improvements in production, with the result that the company now has a healthy gross margin. The aim for the operating expenses, excluding freight, is that these shall represent less than 30 per cent of net sales in the long term.
The growth targetHL Display’s ability to achieve the growth target is affected by a number of parameters. successful product devel-opment and effective sales work are two areas on which HL Display places special emphasis. growth can also be achieved through acquisitions.
it is HL Display’s stated aim that product development shall take place in close collaboration with customers, thus guaranteeing a range of products that best satisfies customers’ needs.
in parallel with this, HL Display works to strengthen its sales work in terms of both process and organisation. one of the funda-mental considerations in the new logistical structure, for example, is that administra-tion and warehousing are moved away from the sales companies so that they can focus exclusively on sales.
in recent years work has focused quite clearly on profitability improvements. in 2008 HL Display has opted to a greater extent than before to supplement this with initiatives aimed at achieving increased growth. During the year the company implemented a programme to identify opportunities, in order to strengthen sales work in future.
HL Display’s objectives and strategies
HL Display’s overall corporate objective is to be a market-leading growth company with good profitability and growth in value for shareholders. Profitability must be prioritised. The overall corporate objective is broken down into two financial targets: a growth target and a profit target.
Business conceptHL Display’s business concept is to increase its customers’ profitability by offering the retail sector and the brand manufacturers cost-efficient products and solutions for in-store communication and merchandising. The focus is on making products and solutions adaptable to customers’ specific needs.
HL Display’s financial targetsHL Display has two long-term financial targets: a profit target and a growth target.
Profit targetan eBiTa margin of at least 12 per cent.
Growth targetorganic growth of 5-10 per cent.
Efficientoperations– optimised
operating expenses
Growth targetOrganic growthof 5-10 per cent
annually
Profit targetAn EBITA marginof 12 per cent
Efficient production– good gross margin
Product development
Strengthenedsales work
HL Display’s work to achieve its financial targets
Bus
ines
s co
ncep
t, t
arget
s an
d st
rate
gie
sH
L D
ispla
y annual r
eport
20
08
8

9HL DispLay ÅrsreDovisning 2007
EBITA margin %
0
2
4
6
8
10
12
20082007200620052004
4.9
Goal 12%
7.4
10.3
8.58.6
Growth %
-4
-2
0
2
4
6
8
10
12
14
20082007200620052004
3
Organic growthGoal for organic growth 5-10%Acquisition
13
8
-2
11
Results in 2008The profit target The eBiTa margin totalled 8.5 per cent compared with 10.3 per cent for 2007. The eBiTa margin was affected positively by the gross margin increasing to 49 per cent, and negatively by a decrease in sales and the fact that operating expenses were too high during 2008. operating expenses totalled 35 per cent of net sales in 2008, compared with 32 per cent in 2007.
The growth targetsales in 2008 fell compared with 2007, totalling MseK 1,536. The prevailing uncer-tainty in the market affected HL Display. This could be seen in the way customers have adopted a more cautious attitude towards new investments and the sales process has become longer. in most cases however, there is no talk of a ban on invest-ment among customers.
»
Operating expences, excludingfreight, in relation to net sales %
29
30
31
32
33
34
35
36
20082007200620052004
34.3
35.4
33.5
31.5
34.8
Bus
ines
s co
ncep
t, t
arget
s an
d st
rate
gie
sH
L D
ispla
y annual r
eport
20
08
9
StrategiesWith a view to achieving the group’s financial targets, HL Display operates on the basis of the following strategies:
HL Display shall:– focus on the company’s core processes
and core products– be perceived as being a natural business
partner by the world’s leading retail com-panies and brand manufacturers
– focus on design and innovation with a view to setting new standards
– continuously rationalise and adapt the organisation according to the market’s requirements and needs
– uphold the corporate culture and its focus on profitable growth
– actively investigate opportunities to strengthen the product range and market position through acquisitions.
The datastrip slimline™ is available in several
different designs and the price labels can
easily be placed next to the relevant product.

HL DispLay ÅrsreDovisning 2007 10
Prioritised areas for HL Displayin its annual report for 2007 HL Display mentioned a number of focus areas for 2008. The table below provides follow-up on these. This is supplemented by a description of how work within each area will be continuing during 2009.
Focus areas for 2008 Results in 2008 Focus areas for 2009
Work on operating expenses will be stepped up. The aim is that operating expenses excluding freight will in due course be less than 30 per cent of net sales.
a project to bring down operating expenses to less than 30 per cent of net sales was launched during the year. The results of this work were adversely affected by a decrese in sales, which meant that operating expenses in relation to net sales rose from 32 to 35 per cent.
The target remains in the long-term, but is not expected to be reached as long as sales growth is below target. During 2009, HL Display will focus on keeping operating expenses unchanged in local currencies.
Continuing work to further increase efficiency in production. greater co-ordination between the production units to improve capacity utilisation and reduce lead times. HL Display plans to start up a new factory in russia in 2008 and to investigate additional needs for local production.
Work on additional efficiency improvements has been successful in 2008, which has increased the gross margin. The startup of the factory in russia has proved to be more complex than expected, which has meant that HL Display have had to adjust the schedule.
Continued rationalisation measures are planned. important issues include the distribution of pro-duction capacity and how to deal with over-capa-city. The aim is that production in russia can start up during 2009. The work within production will be facilitated by the appointment of a dedicated production manager.
The creation of a logistics centre for Central europe is a high priority for HL Display.
all preparatory studies and analyses have been conducted during 2008.
The extension of logistics centres for Central europe will be implemented in stages during 2009.
Focus initiatives in the field of product development towards greater innovation.
a greater focus on innovation has led to several major launches in 2008 and several projects that will be launched in 2009.
Work on focusing initiatives in the field of product development on greater innovation will continue and be supplemented by increased investment in 2009.
greater focus on initiatives in the area of the environment, including in the form of in-house recycling of plastic waste in production.
Work has proceeded with undiminished vigour and good results in 2008. 90 per cent of all pvC waste from the extrusion production process is now recycled, a small amount of which is reused in the company’s own production.
priority will continue to be given to initiatives in the area of the environment, with an emphasis on continuous improvements. in 2009 special emphasis will be placed on improving production processes to significantly reduce raw material waste, and to increase the proportion of waste that is recycled.
HL Display plans to continue to strengthen the company’s product range and market position by means of acquisitions.
HL Display has, during 2008, worked according to an acquisition list with priorities. HL Display has internal resources that are dedicated to matters relating to acquisitions.
HL Display plans to continue to strengthen the company’s product range and market position by means of acquisitions. The current market condi-tions are likely to create increased opportunities, which, in combination with HL Display’s current financial strength, should enable the company to close deals during the coming years.
New focus: HL Display will increase its focus on purchasing to gain economic advantages. a new purchasing strategy is already in place.
Outlook for 2009The Board of HL Display acknowledges that it currently is difficult to predict how the market will develop over the year ahead and how this in turn will affect HL Display. profitability will be prioritised and further
cost control measures are planned. HL Display will continuously monitor the development of market conditions, in order to be able to quickly react to changes if needed.
»
Bus
ines
s co
ncep
t, t
arget
s an
d st
rate
gie
sH
L D
ispla
y annual r
eport
20
08
10

11HL DispLay ÅrsreDovisning 2007
Customer
Core process 3Production and delivery of goodsand services
Core processesHL Display’s core processes manage the entire chain
from purchase to customer cooperation
Support processes
Core process 2Development, launch and product range management
Core process 1Market, sales and customerrelations
Finance
IS/IT
Human Resources
HL Display’s business operations
The next few pages present HL Display’s business operations against the background of three central business processes. These are supplemented by support processes for the whole Group that support the business operations in the three core processes.
Core process 1 involves the market and all market-related activities, such as planning and operational work on sales and customer relations. This includes information about developments in the market, as well as HL Display’s customers and competitors. read more about this on pages 12-16.
Core process 2 involves all activities relat-ing to HL Display’s products and solutions, from product range development and work on launches to product range management and phase-out. it includes information about HL Display’s range of products and solutions and how they are positioned. read more about this on pages 17-20.
Core process 3 involves all activities relating to production, purchasing and logistics. it includes a description of the various production methods in which HL Display specialises. read more about this on pages 21-24.
Support processesThe core processes are supplemented by the three support processes for the whole group that support the business operations in the company. These are:– Finance– is/iT– Human resourcesread more about this on pages 25-27.
HL
Dis
play
ope
rati
ons
HL
Dis
pla
y annual r
eport
20
08
11

HL DispLay ÅrsreDovisning 2007 12
HL Display’s customers include most of the world’s largest food retail chains, non-food retail chains and brand manufacturers. HL Display has a low level of dependence on individual key customers. sales to the 19 biggest customers on a global scale totalled around 30 per cent of sales in 2008.
HL Display’s market and sales work
HL Display’s market strategy is based on a local presence in all important markets through wholly owned subsidiaries. In markets where the company does not have a presence of its own, sales are channelled via distributors. HL Display currently has its own sales companies in 32 countries. A further 13 countries are serviced via distributors.
New organisation reinforces the focus on saleson 1 January 2009 a new, matrix-based organisation came into force at HL Display. The aim is to create shorter paths between the Ceo and the sales companies, and to clearly signal an increased focus on sales throughout the whole business. HL Display’s five area Managers now report directly to the Ceo and have also taken on greater responsibility. They are not only responsible for sales work, but also have full responsibility for management and profits in their regions.
HL Display’s customersHL Display has three prioritised customer segments: food retail, non-food retail and brand manufacturers. The food retail sector is currently by far the biggest customer segment. HL Display is working to increase sales to the non-food retail sector and brand manufacturers. one result of this is a significantly strengthened product range, an important element of work under way to rea-lise the potential that exists for HL Display within these two customer segments.
Cor
e P
roce
ss 1
Mark
et,
sale
s and c
ust
om
er
rela
tions
HL
Dis
pla
y annual r
eport
20
08
12
HL Display’s biggest customers in each segment:
Food retail Brand Manufacturers
ahold (incl. iCa)auchanCarrefourCasinoChampion intermarché Metrosysteme UTescoWal-Mart (asDa)
BaT ColgateDanone Kraft L’oréal Masterfoods nestléphilip Morris procter & gambleUnilever
non-Food retail
BaumaxDecathlonDsg retail Ltd
iKeaintergammaMüller
HL Display’s sales work is channelled primarily through direct sales in local sales companies all over the world. it is HL Display’s ambition to be the custom-ers’ local partners in the task of creating selling retail environments. a strong local presence is an important success factor for HL Display. Most purchases of solutions for in-store communication and merchandising are made locally in each country.
The exceptions are mainly in the customer segment of brand manufacturers. These companies often market the same product in a large number of markets, and merchandising solutions are therefore often procured for several markets at the same time. This is also reflected in HL Display’s work with this customer segment, which is characterised by greater central co-ordination.
Sales per customer segment MSEK
Retail food 630 (2007: 616)Brand manufacturers 287 (2007: 293)Retail non-food 223 (2007: 272)Shop-fitters 155 (2007: 144)Distributors 103 (2007: 115)Other 138 (2007: 131)
HL Display’s solutions for auto-
matic product feeding guarantees
that the products are always
displayed at the front of the shelf.

13HL DispLay ÅrsreDovisning 2007
The competitionHL Display is facing an extremely frag-mented situation as regards competition. at present none of the company’s competitors have the same breadth in their product range and an equally well-developed global presence. HL Display also has sales that are considerably higher than those of its competitors.
80-90 per cent of competitors sell their products in one or two countries. Most of them compete with HL Display in one or
two customer segments and one or two product areas.
This means that there is a large number of competitors. about 150 more or less direct competitors of varying sizes can be identified. The table below shows a summary of the competitive situation facing HL Display.
HL Display’s competition
International players(operations in ≥ 5 markets)
Regional players(operations in 2-4 markets)
Local players(operations in one market)
Examples of competitors
Checkpoint systems (Usa)oechsle (germany)
Kleerex (ireland)Wilson & Brown (poland)
aL-Display (germany)ppe (UK)visioplast (France)
Competitors’ strengths
– Well-developed product range within their niche.
– efficient production process.– Low prices.
– often family companies with a low cost base.
– Flexible production process for small batches.
– good contacts with customers in the region.
– very good customer contacts.– High level of customisation.
HL Display’s competitive advantages
– Total offer that satisfies customer’s total needs.
– offers complete category solutions.– significant investments in
product development create a leading position.
– good relations with the end customer, in contrast to competitors who often work via distributors or agents.
– Total offer that satisfies customer’s total needs.
– offers complete category solutions.– Through its global presence,
HL Display can follow its major customers when they expand and become a preferred supplier.
– Major global retail companies and brand manufacturers value a supplier who can help them in several markets.
– significant investments in product development create a leading position.
Cor
e P
roce
ss 1
Mark
et,
sale
s and c
ust
om
er
rela
tions
HL
Dis
pla
y annual r
eport
20
08
13
Through a clear segmentation the consumers can
quickly find the product they are looking for.
»

HL DispLay ÅrsreDovisning 2007 14
The market
HL Display is represented in 45 countries, primarily in the nordic region, Western and eastern europe, and asia. Market developments usually differ, depending on the region. in general, however, it can be said that HL Display’s market has a strong association with developments in the retail sector, both globally and regionally.
a significant element of HL Display’s sales are made to the after-sales market, in areas such as spare parts and supple-mentary orders. Demand in this area is relatively stable, as shops regularly undergo renovation and rebuilding projects.
Factors that affect demand– HL Display becoming established in new
markets.– The development of and maturity in
markets, leading to demand for more sophisticated solutions.
– The general economic trend, both globally and locally.
– HL Display’s product development.
Factors that affect demand in mature markets– implementation of new retail concepts/
renovation projects.– new trends in shop design.– introduction of new technologies, e.g.
electronic price labels.– Brand manufacturers’ investments in
campaigns in shops to reinforce brands.
Factors that affect demand in growth markets– new shop openings.– Brand manufacturers’ investments in
campaigns in shops to reinforce brands, e.g. to establish a brand in a market.
Market developmentsas mentioned before, HL Display’s market is affected by developments in its custom-ers in the retail sector, both globally and regionally.
The retail sector in 2008 was character-ised by higher inflation in many countries – not least thanks to significant price rises for food – and the global financial concerns that became more prominent during the autumn, after having appeared to be under control as recently as during the summer. This has been followed by clear signs of a global recession. as consumers’ inclination to consume has fallen, the prospects for growth in the retail sector have worsened.
one example of this is the fact that retail trading volumes in the eU fell by 0.2 per cent in november 2008 compared to the same month last year, according to eurostat, the eU’s statistical office.
in the Usa too, there are signs of a drop in the inclination to consume. sales in american retail chains fell by 1.7 per cent in December 2008 compared to the same month in 2007, according to figures issued by the international Council of shopping Centers (isCs).
Difference between sectorsit is, however, important to remember that there is tremendous variation between the various sectors within the retail segment. research conducted in this field indicates that reduced opportunities for consumption and increased food prices tend to have
relatively little effect on the food retail sector compared with, for example, consumer discretionary sectors such as home electronics.
it is possible, on the other hand, that consumption in the food retail sector may be channelled towards the cheaper options that can exist in each product category. it is also possible that food retail segments that focus on price, for example the discount chains, will benefit from a situation in which consumers are trying to cut their consumption costs.
Globalisation a dominant trendinternational expansion is the trend that has had the clearest effect on the retail sector in recent years. This has been the most promi-nent growth strategy for most retail chains. an exception is the american chains, which with their large domestic market have shown less inclination to expand internationally than their european colleagues.
if we look at the biggest european food retail chains, it can be confirmed that 30-40 per cent of sales take place in markets other than the domestic market. The expla-nation of this desire to expand abroad can be found in the highly consolidated, satu-rated domestic markets. Most european markets are currently dominated by a small number of players, and there is limited opportunity to expand.
in 2008 the credit crunch in the Usa became clearly evident in europe. Just as in the Usa, falling house prices in many european countries have meant that house-hold assets have fallen in value, which has had a negative effect on the retail sector. The economic downturn is also a factor in several european markets. even though analysts are uncertain of the precise consequences that this will have, it can be confirmed that the retail sector will probably be affected negatively by the prevailing market climate.
Tougher competition in growth marketsas a consequence of the expansion of the Western european chains, and to some extent also those in the Us, the retail sec-tor in growth markets has been changing
»
»
Cor
e P
roce
ss 1
Mark
et,
sale
s and c
ust
om
er
rela
tions
HL
Dis
pla
y annual r
eport
20
08
14
extensible shelves with trays specially
adapted for spice bottles.

15HL DispLay ÅrsreDovisning 2007
Sales per region Own sales companies
Distributors Market position
Developments during the year
Nordic regionnet sales MseK 332
Finlandnorway sweden
Denmarkiceland
HL Display is the market’s leading supplier of products and solutions for both the retail sector and brand manufacturers.
The sales trend continued to be healthy in the nordic region, despite the prevailing market climate. sales increased by 2 per cent, a trend that was driven above all by Finland and norway.
Western Europenet sales MseK 706
austriaBelgiumFrancegermanythe netherlands spainswitzerland the UK
greeceireland italy portugal
HL Display has a strong position in the market, and the company supplies many of the major retail chains and brand manufacturers. There is, how-ever, tough competition in the market, combined with indications of greater cost awareness among customers. it is HL Display’s ambition to reinforce its market position by focusing more clearly on the areas in which the company has unique conditions and competence. The company has to be, among other things, a sounding board and a natural busi-ness partner for customers in their work to find new solutions that improve product displays and facilitate work in the shop.
sales in the region fell by 7 per cent in 2008. in many markets there are clear indications of a worsening market climate, which has caused customers to focus specifically on cost-cutting mea-sures and to postpone investments.
Eastern Europenet sales MseK 350
Bulgariathe Czech republicHungary Latvia/Lithuaniapoland rumania russia serbia slovakia slovenia Turkey Ukraine
estoniaisrael Kazakhstan
Thanks to the fact that HL Display established operations in many countries in the region at an early stage, HL Display currently enjoys a strong position in the market in both the retail sector and among brand manufacturers.
sales in the region fell by 1 per cent in 2008. There was a very healthy trend in many markets, for example poland and Ukraine. The picture of the region as a whole is, however, adversely affected by the weak trend in russia.
Asia and Australianet sales MseK 132
China (Hong Kong)China (shanghai)indiaindonesia Malaysia singaporesouth Korea Taiwan Thailand
australianew Zealand
HL Display’s position in the market has been significantly reinforced in recent years, partly because the company has increased its com-petitive strength by setting up local production facilities. in 2008 HL Display stepped up its work with brand manufacturers to strengthen its market position in this customer segment.
There continued to be a healthy trend in asia in 2008. sales increased by 15 per cent, thanks to a positive development in most markets in the region.
North Americanet sales MseK 16
Canada Usa
Trion industries is responsible for all sales work in the Us market. at present sales work is targeted exclusively at retail companies. sales in the north american market totalled MseK 16 (19) in 2008.
Cor
e P
roce
ss 1
Mark
et,
sale
s and c
ust
om
er
rela
tions
HL
Dis
pla
y annual r
eport
20
08
15

HL DispLay ÅrsreDovisning 2007 16
rapidly. significant annual increases in gnp and an expanding middle class with greater spending power combined with fragmented markets and the limited emergence of modern retail operations are some of the reasons why retail companies are showing a major interest in these markets. after several years of international expansion, the competition in many growth markets has now increased significantly, and attention is shifting gradually towards new markets. in recent years the Middle east and north africa have emerged as attractive growth markets.
Attractive markets in Asiaindia continues to be one of the most attractive markets for the retail sector, even if a lower rate of growth in national gnp is predicted for the immediate future. For foreign companies, however, india remains a rather problematical market – the result of factors including tough legislation and a poor infrastructure. a so-called “multi-brand retailer”, which includes the food retail chains, may not run its own business in india, but must establish itself according to the franchise model in partnership with a domestic company. Many of the major
The most attractive growth markets (based on a weighting of risk, how attractive the market is, market saturation and time horizon)
1. vietnam2. india3. russia4. China5. egypt
source: The 2008 a.T. Kearney global retail Development index™
chains now have operations in the country, including Wal-Mart and Metro, to name a few.
at the same time local chains such as pantaloon and Trent have expanded rapidly to make sure they are ahead of the foreign players.
Fragmented market in ChinaChina is another market that has attracted tremendous interest for many years. There are now signs that growth in China’s economy is slowing down a little, partly because the rate of growth in its exports to the Us market has slowed down some-what. Forecasts do, however, indicate that growth in gnp will nevertheless exceed 9 per cent. The international chains have
»
quickly become established in the biggest cities, and this expansion has continued on to smaller cities. Carrefour and Wal-Mart are two of the chains that have expanded most quickly in the country. Just as in india, domestic chains are growing quickly, not only in China, but also in many other asian markets. Despite this, the Chinese retail market remains fragmented. even though the chains are growing significantly in the biggest cities, the five biggest food retail chains account for only a few per cent of total food retail sales.
Russia an important marketrussia has been an important growth market for the international retail sector for a number of years. The main reasons for this has been strong economic growth, driven by rising oil and gas prices, combined with a relatively unregulated market and strong consumer demand.
Cities such as st. petersburg and Moscow have for many years been the subject of interest for international retail chains. as the market has become increas-ingly saturated, the chains have started to look for new opportunities in smaller cities and in large industrial regions.
There are now clear indications that growth in the russian economy will slow down, partly because of lower raw material prices, financial crisis and poorer export prospects.
Market trends that affect HL DisplayThe prevailing market climate probably means that the retail sector will focus more on cost savings as one way of maintaining profitability. such a trend may have a nega-tive effect on HL Display if the consequence is that companies postpone investments in HL Display’s area.
The trend towards cross merchandising has been evident for a number of years, and it can now be said to be a natural, accepted way of working in the food retail sector. HL Display leads the way with solutions in this area.
There is a general trend towards creating clarity in the shop to make things easier for the consumer. This creates increased demand in areas such as in-store signage solutions.
During the year in-store aids based on new technology have met with greater interest in some of HL Display’s biggest markets, for example France. examples of this are electronic price labels and digital screens to display advertising messages.
Cor
e P
roce
ss 1
Mark
et,
sale
s and c
ust
om
er
rela
tions
HL
Dis
pla
y annual r
eport
20
08
16
HL Display has a full range of
display hooks for products that
are displayed hanging.

17HL DispLay ÅrsreDovisning 2007
HL Display’s product range
HL Display’s product range for its customers is divided into Optishop™, solutions for the retail sector, and Brandman™, solutions for brand manufacturers.
HL Display offers products and solutions for the retail sector, both food and nonfood, and brand manufacturers who produce goods that can be bought in the shop. These customers each have different needs and requirements. The retail sector is primarily interested in solutions that increase sales or make work in the shop easier, which saves time and money. For their part, brand manufacturers are interested in solutions that help them to build up the brand and make their products visible in the shop. For this reason the retail product range is brought together under the optishop™ brand, and the product range for brand manufacturers under the Brandman™ brand.
Development and management of the product rangeHL Display works very actively on the range of products and solutions that is offered to customers. on a general level, this work can be broken down into three elements.
Firstly, the company invests more than anyone else in the industry in product development in order that it can continuously renew what it has to offer its customers.
secondly, it is crucially important for HL Display to follow up on sales trends at all times and to phase out any products for which there is little demand, in order that the conditions exist for profitable production.
a third element is what is known as value engineering. Here the company systemati-cally reviews the best-selling products and investigates how production processes and material utilisation can be developed in order to improve performance and cut costs.
A stronger product range for brand manufacturersHL Display currently has the market’s broadest ranges of solutions for in-store
communication and merchandising for the retail sector. in 2008 the ambition was to clearly strengthen the product range aimed at brand manufacturers. a number of new solutions were launched, which were very well received by customers. in addition, a new web site, dedicated to the segment, has been launched at www.hlbrandman.com
in 2009 HL Display aims to continue to improve its customised product range for brand manufacturers and to strengthen the product range for the retail sector with new, innovative solutions. a number of develop-ment projects are under way, including the next generation of category solutions.
Positioning of HL Display’s product rangeHL Display shall be a market-leading supplier of solutions for in-store communi-cation and merchandising, and a natural business partner for the retail sector and brand manufacturers as regards boosting the shopping experience for the consumer. What differentiates HL Display from its competitors is, above all:
The level of innovation – HL Display shall be the supplier that develops
the innovations that become industry standards. The company’s product development initiatives are unparalleled in the industry.
Quality – HL Display’s products and solutions are characterised by high quality and functionality.
Competence – HL Display has built up a vast wealth of expertise when it comes to displaying products in shops. HL Display is a natural partner of the retail sector and brand manufacturers when they are fitting out shops or developing new concepts for their shops.
Customer focus – The company’s presence in the customer’s local market guarantees a high level of service. »
Cor
e pr
oces
s 2
Deve
lopm
ent,
launch
and p
roduct
range
manage
ment
HL
Dis
pla
y annual r
eport
20
08
17

HL DispLay ÅrsreDovisning 2007 18
roller Track™ is HL Display’s latest solution for chilled cabinets for dairy products such as milk and yoghurt. The unique feeder system, which is easy to move and can easily be adapted to changes in the planogram, guarantees that products are always displayed at the front of the shelf. increased sales and a halving of the time spent on topping up with new products are just some of the benefits mentioned by food retailers who have installed the systems.
Making the most out of your selling space
Cor
e pr
oces
s 2
Deve
lopm
ent,
launch
and p
roduct
range
manage
ment
HL
Dis
pla
y annual r
eport
20
08
18
Optishop™
HL Display’s product range for the retail sector is found under the optishop brand. This range offers products and solutions for in-store communication and merchandising.
In-store communicationprovides consumers with all necessary purchasing information and helps them to quickly find their way around the shop. Well laid out in-store communication means that shops avoid losing sales because consum-ers cannot quickly find what they are look-ing for in the shop or what products cost.
Merchandising Displays products in a way that makes them attractive to consumers. a well laid out merchandising solution makes optimal use of shelf space and stimulates the consumer to make a purchase. HL Display’s merchandising products also generate cost savings by rationalising work in the shop. one example of this is the automatic feeding of products, which means that less time is spent on keeping shelves in order, while at the same time the shelves can quickly be topped up with new products.

19HL DispLay ÅrsreDovisning 2007
Bring your brand to life
»
Cor
e pr
oces
s 2
Deve
lopm
ent,
launch
and p
roduct
range
manage
ment
HL
Dis
pla
y annual r
eport
20
08
19
Brandman™
The Brandman brand houses HL Display’s product range for brand manufacturers. it offers both individual products and total solutions for Primary placement and Secondary placement.
Primary placementHL Display offers products and solutions to guarantee that brand manufacturers can make the best possible use of their space on shelves in the shop. Category management and shelf management create an attractive product presentation that is easy to maintain. This is combined with point of sale accessories that can, for example, provide the customer with information about the product or solutions that provide support in connection with product launch.
Secondary placementHL Display offers products and solutions to display brand manufacturers’ goods in other parts of the shop. These include product merchandisers, for example customised floor stands, as well as solutions for cross merchandising, i.e. products that are closely associated are displayed together in order to generate extra sales.
The newly developed solution
sideKick™ makes it possible to
create even more sales space
in the store.

HL DispLay ÅrsreDovisning 2007 20
product development
an insight into customers’ requirements and needs is a cornerstone of product development at HL Display. successful product development work starts in col-laboration between product managers and the sales companies, who between them identify new opportunities, for example to improve merchandising or to make work easier in the shop. it is HL Display’s stated ambition that all development shall take place in close collaboration with customers. This makes sure that the company develops solutions that meet customers’ requirements and needs, and for which there is an immediate demand. HL Display invested a total of MseK 28 (38) in product development in 2008, corresponding to 2 (2) per cent of sales.
A clear processTwo years ago HL Display overhauled its product development process with a view to increasing the tempo and cutting lead times in product development work. The company now works with a clearly defined product development process consisting of five
stages, with weekly reporting of non-confor-mities in all projects.
The overall responsibility for the development strategy and deciding which projects are to be undertaken rests with the market council, which includes members of the group’s management team. The product managers then assume responsibility for the project throughout the development phase. The product develop-ment group also includes constructors and designers, as well as factory or production managers, in order to guarantee a prompt start to production when the development of the product has been completed.
Successful projects in 2008in 2008 HL Display had on average around 30 ongoing development projects. 55 projects were completed successfully during the year.
Many of the new products that were launched during the year enjoyed a very positive reception in the market. not least of all sideKick™, a solution that can easily be attached to the side of the end section on shelves – a previously unutilised space. This makes it possible to create even more sales space in the shop.
Concept
– Product-specification
– Market analysis
– Projectapproval
Engineering
– Drawings andtechnical specifications
– Design review
– Tenders for tooling invited
– Investment isapproved
Tooling
– Tool order
– Tooling designapproved
– Final acceptanceof tooling
Industrialisation
– Tooling validated
– Product samplesproduced
– Production parametersvalidated
Market launch
– Launch material
– Full scale launch
HL Display’s product development process
HL Design – HL Display’s own design agencyHL Design, situated in France, is a central resource with tremendous expertise in the field of graphic design, which can be used by all sales companies all over the world. HL Display’s products are customised to a large degree, for example in the form of customised front sections for merchandising solutions. This work involves creative design work to satisfy the strict requirements of graphic design that are specified by, for example, the world’s leading brand manufacturers.
Patent and design protectionThe main purpose of HL Display’s patent strategy is to protect the company’s best-selling products. at the end of 2008 the company had 74 (80) registered patents and 21 (21) patent applications being processed. The number of new patents in 2008 totalled 4 (10).
at the end of the year HL Display had 78 (88) registered protected designs and 5 (3) applications were being processed.
The total cost of patent and design protection in 2008 was MseK 2 (2).
»
Cor
e pr
oces
s 2
Deve
lopm
ent,
launch
and p
roduct
range
manage
ment
HL
Dis
pla
y annual r
eport
20
08
20

21HL DispLay ÅrsreDovisning 2007
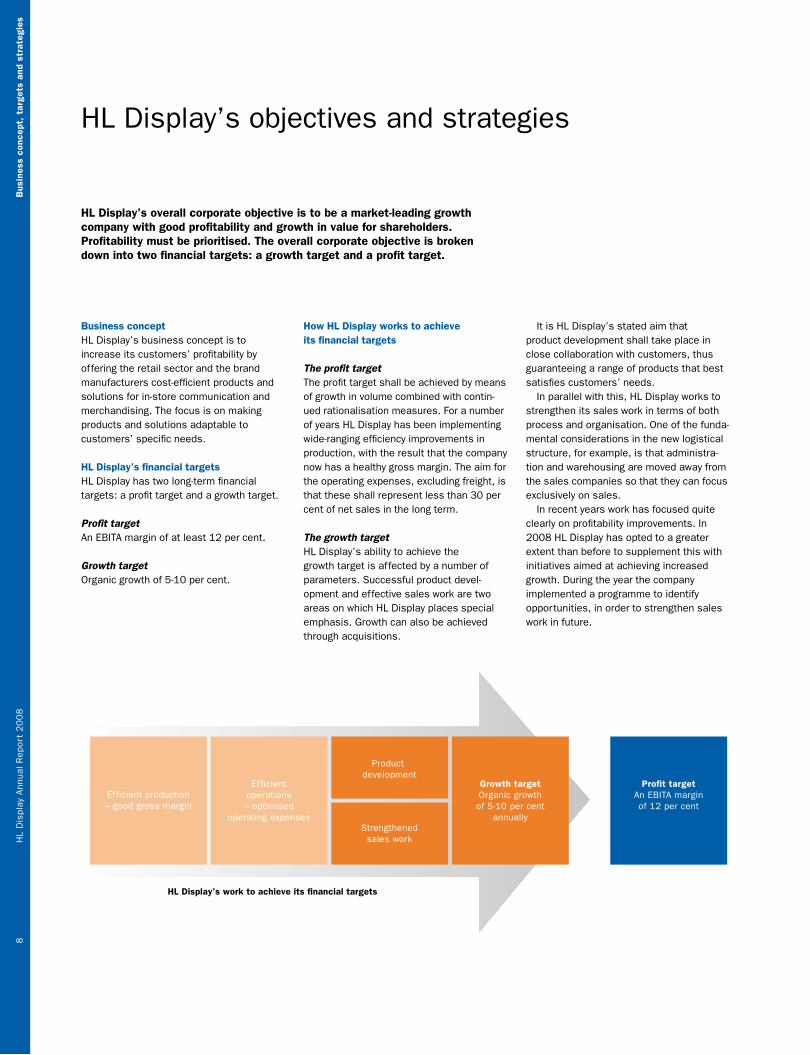
Continued productivity increases in production
HL Display’s production is concentrated on three production methods – extrusion, injection moulding and hot-bending and printing of plastic (the production methods are explained in more detail in the table on page 23). The majority of the production that lies outside these areas is currently performed by subcontractors. HL Display has seven factories in total, four of which are in Sweden.
HL Display’s production is undertaken largely in accordance with the principles of “lean production”. in very simple terms, this can be described as work that focuses on the elements that add value for customers. This includes, among other things, a clear focus on quality and productivity.
Improved productivityWork to improve productivity has contin-ued to be in the spotlight in 2008, which is one important reason why the gross margin increased from 47 to 49 per cent.
at the factory in sundsvall, which is HL Display’s biggest production facility, specialising in both extrusion and injec-tion moulding of plastic, the primary focus areas during the year have been work on raw materials and fine-tuning production processes, thus achieving even more cost-efficient production with bigger orders. During the year the factory changed its raw material supplier and started to use a cheaper raw material in certain products. By adapting the production process, equally good or better quality has been achieved using the cheaper material.
The factory in Karlskoga has undergone a clear process of specialisation, and now focuses on innovative, highly automated injection moulding. as a result of this, the element of production with a high content of manual work has been transferred to
the factory in suzhou. The factory has also been given extra products, as some parts of the product range acquired from Display Team are now manufactured in Karlskoga. This production used to be outsourced to subcontractors.
The factory in Falun has also undergone a distinct change, towards greater special-isation and automation. The factory now specialises in the automated production of hot-bent products with or without printing. »
Cor
e pr
oces
s 3
pro
duct
ion a
nd d
eliv
ery
of
goods
and s
erv
ices
HL
Dis
pla
y annual r
eport
20
08
21
HL DispLay ÅrsreDovisning 2007 22
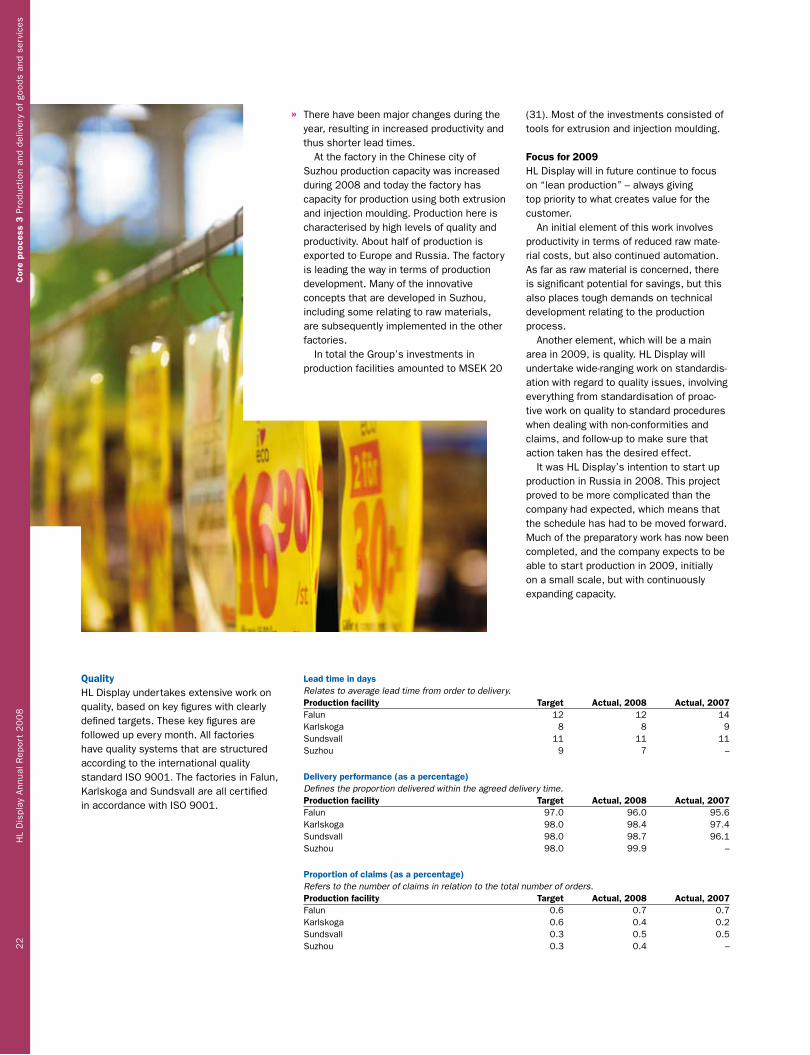
QualityHL Display undertakes extensive work on quality, based on key figures with clearly defined targets. These key figures are followed up every month. all factories have quality systems that are structured according to the international quality standard iso 9001. The factories in Falun, Karlskoga and sundsvall are all certified in accordance with iso 9001.
Lead time in daysRelates to average lead time from order to delivery.Production facility Target Actual, 2008 Actual, 2007Falun 12 12 14Karlskoga 8 8 9sundsvall 11 11 11suzhou 9 7 –
Delivery performance (as a percentage)Defines the proportion delivered within the agreed delivery time.Production facility Target Actual, 2008 Actual, 2007Falun 97.0 96.0 95.6Karlskoga 98.0 98.4 97.4sundsvall 98.0 98.7 96.1suzhou 98.0 99.9 –
Proportion of claims (as a percentage)Refers to the number of claims in relation to the total number of orders.Production facility Target Actual, 2008 Actual, 2007Falun 0.6 0.7 0.7Karlskoga 0.6 0.4 0.2sundsvall 0.3 0.5 0.5suzhou 0.3 0.4 –
There have been major changes during the year, resulting in increased productivity and thus shorter lead times.
at the factory in the Chinese city of suzhou production capacity was increased during 2008 and today the factory has capacity for production using both extrusion and injection moulding. production here is characterised by high levels of quality and productivity. about half of production is exported to europe and russia. The factory is leading the way in terms of production development. Many of the innovative concepts that are developed in suzhou, including some relating to raw materials, are subsequently implemented in the other factories.
in total the group’s investments in production facilities amounted to MseK 20
»
Cor
e pr
oces
s 3
pro
duct
ion a
nd d
eliv
ery
of
goods
and s
erv
ices
HL
Dis
pla
y annual r
eport
20
08
22
(31). Most of the investments consisted of tools for extrusion and injection moulding.
Focus for 2009HL Display will in future continue to focus on “lean production” – always giving top priority to what creates value for the customer.
an initial element of this work involves productivity in terms of reduced raw mate-rial costs, but also continued automation. as far as raw material is concerned, there is significant potential for savings, but this also places tough demands on technical development relating to the production process.
another element, which will be a main area in 2009, is quality. HL Display will undertake wide-ranging work on standardis-ation with regard to quality issues, involving everything from standardisation of proac-tive work on quality to standard procedures when dealing with non-conformities and claims, and follow-up to make sure that action taken has the desired effect.
it was HL Display’s intention to start up production in russia in 2008. This project proved to be more complicated than the company had expected, which means that the schedule has had to be moved forward. Much of the preparatory work has now been completed, and the company expects to be able to start production in 2009, initially on a small scale, but with continuously expanding capacity.

23HL DispLay ÅrsreDovisning 2007
greater professionalism and control of logistics and stock management also cre-ates a standardised way of working, which raises the quality perceived by customers in the form of the same high level of service to all customers. This brings with it greater cost control and a structure that is flexible and supports growth.
During 2008 work focused on fine-tuning the businesses in Tours, France, and Falkenberg, sweden. a lot of work has also been undertaken in russia, where HL Display moved its warehouse to new premises.
HL Display will now take the next step and establish a service centre for Central europe. preliminary studies and analyses are complete, and the company has defined the need for two centres in the region, the first of which will be in Hungary. in early 2009 the countries in the region will be linked, one by one, to the service centre. »
HL Display’s production lines Location Method
Extrusion – High SpeedThe High speed line manufactures datastrips, which can be produced at a high speed.
sundsvall and suzhou
Extrusion a production method that involves molten plastic being forced through a nozzle. The nozzle’s profile determines the form of the product’s cross-section. products are manufactured in strips that are cooled in a water bath and then cut to the required length. Datastrips are one example of products manufactured using this production method.
Extrusion – FlexibleThe Flexible line manufactures mature products – often with several varieties – in which manufacturing is characterised by short batches and quick changeovers.
sundsvall and suzhou
Extrusion – ComplexComplex is used to produce newly developed datastrips as well as strips that combine different materials or functions.
sundsvall and suzhou
Injection moulding – DividersThe primary product is shelf dividers of transparent plastic material that are produced on integrated, robot injection moulding lines.
sundsvall and suzhou
Injection mouldinga production method that involves molten plastic being injected into a hollow mould. The form of the hollow determines the product’s shape. shelf dividers and frames are examples of products manufactured using this method.
Injection moulding – Frames – hi-tech partsKarlskoga undertakes injection moulding of items such as frames with plastic accessories.
Karlskoga
Printing and bendingThe main products are the printing and bending of shelf talkers.
Falun Printing and bending printing of plastic sheets that are in many cases further processed by means of punching, cold-bending or hot-bending.
Assembly lineManual assembly of standard articles and manufacturing of labour-intensive products for europe.
suzhou Assembly assembly is a production method with a high degree of manual labour.
Other productionThe cold/hot-bending of acrylic display stands takes place in shipley in the UK. Metal display hooks are manufactured at a joint venture in Lesjöfors (co-owned with Trion international LLC) and products for the Us market are extruded in Wilkes-Barre, pennsylvania, Usa (also co-owned with Trion).
Cor
e pr
oces
s 3
pro
duct
ion a
nd d
eliv
ery
of
goods
and s
erv
ices
HL
Dis
pla
y annual r
eport
20
08
23
supply Chain Management
supply Chain Management has been given a high priority within HL Display since 2007. This is a long-term commitment, which was further developed in 2008. HL Display’s logistical structure will be based on regional service centres around the world. at pres-ent the company has established service centres in Tours, France, for Western europe, in Falkenberg, sweden, for the nordic and Baltic regions, in singapore for asia and in Moscow, russia, which serves the russian market. The service centre in Falkenberg also has a purchasing function, which has global responsibility for all of the group’s purchases from subcontractors.
in addition to logistics and stock man-agement, ancillary services for adminis-tration and finance have been assigned to these regional service centres. This means that the sales companies can now stream-line their business to focus on sales. This regionalisation creates clear benefits in terms of optimised stock management and cost structure.
HL Display has a wide range of solutions that
displays price and product information next to
the relevant products.
HL DispLay ÅrsreDovisning 2007 24
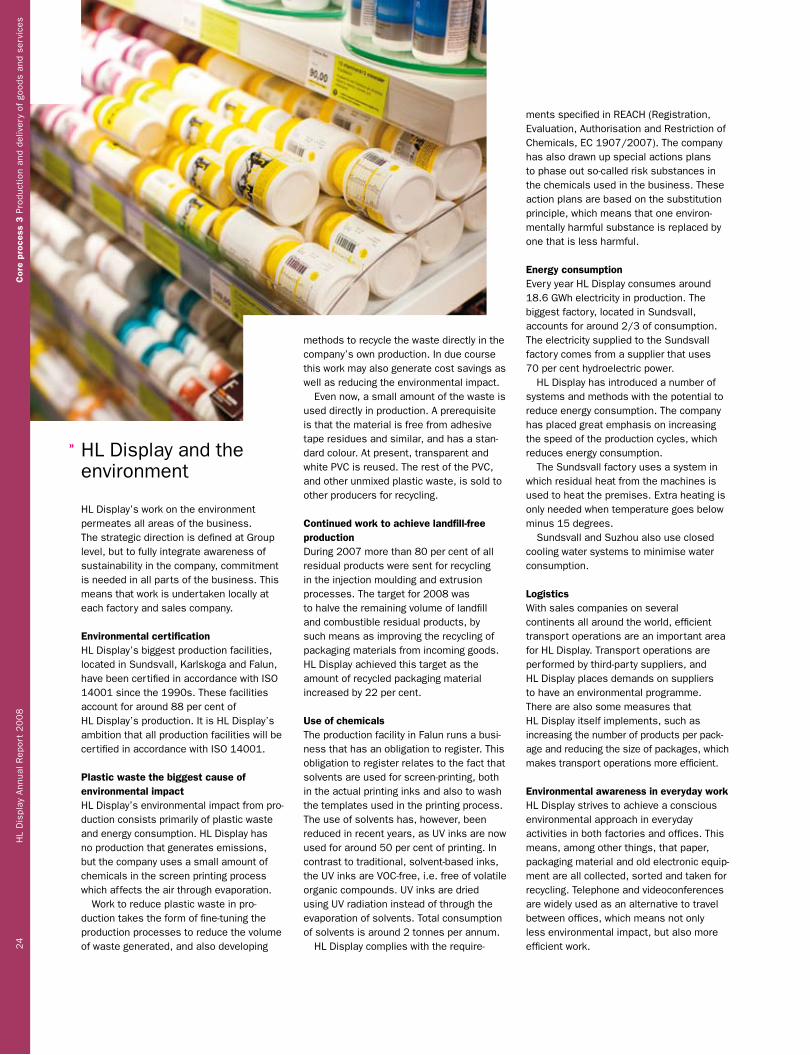
methods to recycle the waste directly in the company’s own production. in due course this work may also generate cost savings as well as reducing the environmental impact.
even now, a small amount of the waste is used directly in production. a prerequisite is that the material is free from adhesive tape residues and similar, and has a stan-dard colour. at present, transparent and white pvC is reused. The rest of the pvC, and other unmixed plastic waste, is sold to other producers for recycling.
Continued work to achieve landfill-free production During 2007 more than 80 per cent of all residual products were sent for recycling in the injection moulding and extrusion processes. The target for 2008 wasto halve the remaining volume of landfill and combustible residual products, by such means as improving the recycling of packaging materials from incoming goods.HL Display achieved this target as the amount of recycled packaging material increased by 22 per cent.
Use of chemicalsThe production facility in Falun runs a busi-ness that has an obligation to register. This obligation to register relates to the fact that solvents are used for screen-printing, both in the actual printing inks and also to wash the templates used in the printing process. The use of solvents has, however, been reduced in recent years, as Uv inks are now used for around 50 per cent of printing. in contrast to traditional, solvent-based inks, the Uv inks are voC-free, i.e. free of volatile organic compounds. Uv inks are dried using Uv radiation instead of through the evaporation of solvents. Total consumption of solvents is around 2 tonnes per annum.
HL Display complies with the require-
ments specified in reaCH (registration, evaluation, authorisation and restriction of Chemicals, eC 1907/2007). The company has also drawn up special actions plans to phase out so-called risk substances in the chemicals used in the business. These action plans are based on the substitution principle, which means that one environ-mentally harmful substance is replaced by one that is less harmful.
Energy consumptionevery year HL Display consumes around 18.6 gWh electricity in production. The biggest factory, located in sundsvall, accounts for around 2/3 of consumption. The electricity supplied to the sundsvall factory comes from a supplier that uses 70 per cent hydroelectric power.
HL Display has introduced a number of systems and methods with the potential to reduce energy consumption. The company has placed great emphasis on increasing the speed of the production cycles, which reduces energy consumption.
The sundsvall factory uses a system in which residual heat from the machines is used to heat the premises. extra heating is only needed when temperature goes below minus 15 degrees.
sundsvall and suzhou also use closed cooling water systems to minimise water consumption.
LogisticsWith sales companies on several continents all around the world, efficient transport operations are an important area for HL Display. Transport operations are performed by third-party suppliers, and HL Display places demands on suppliers to have an environmental programme. There are also some measures that HL Display itself implements, such as in creasing the number of products per pack-age and reducing the size of packages, which makes transport operations more efficient.
Environmental awareness in everyday workHL Display strives to achieve a conscious environmental approach in everyday activities in both factories and offices. This means, among other things, that paper, packaging material and old electronic equip-ment are all collected, sorted and taken for recycling. Telephone and videoconferences are widely used as an alternative to travel between offices, which means not only less environmental impact, but also more efficient work.
HL Display and the environment
HL Display’s work on the environment permeates all areas of the business. The strategic direction is defined at group level, but to fully integrate awareness of sustainability in the company, commitment is needed in all parts of the business. This means that work is undertaken locally at each factory and sales company.
Environmental certificationHL Display’s biggest production facilities, located in sundsvall, Karlskoga and Falun, have been certified in accordance with iso 14001 since the 1990s. These facilities account for around 88 per cent of HL Display’s production. it is HL Display’s ambition that all production facilities will be certified in accordance with iso 14001.
Plastic waste the biggest cause of environmental impactHL Display’s environmental impact from pro-duction consists primarily of plastic waste and energy consumption. HL Display has no production that generates emissions, but the company uses a small amount of chemicals in the screen printing process which affects the air through evaporation.
Work to reduce plastic waste in pro-duction takes the form of fine-tuning the production processes to reduce the volume of waste generated, and also developing
»
Cor
e pr
oces
s 3
pro
duct
ion a
nd d
eliv
ery
of
goods
and s
erv
ices
HL
Dis
pla
y annual r
eport
20
08
24

25HL DispLay ÅrsreDovisning 2007
support processes
is/iT within HL Display
The use of modern information technology plays an important role in HL Display’s work to rationalise its business and processes. The is/iT function (information systems and information technology) within HL Display aims to provide the business with tools that both rationalise and create new opportunities in everyday work. This is combined with a clear focus on cost-efficiency and quality. New IT organisationin 2008 a new iT organisation was intro-duced in HL Display. The company has reviewed its working methods, organisation and agreements. The result is an organisa-tion with reinforced competence in ordering and project management, which is impor-tant because the majority of development, administration, support and operational services are bought in from subcontractors. By clearly specifying requirements and continuously following up, costs and quality are optimised.
Cost savings one important ambition in 2008 was to reduce iT costs. This was achieved by renegotiating agreements and introducing new prioritisation routines for new develop-ments. at the same time, the costs of new developments have been allocated to the group company that placed the order, to increase awareness of iT costs all around the group. all in all, these measures made it possible to cut costs in 2008, with the group’s total iT costs in 2008 amounting to MseK 42 (43). The measures taken are expected to have full effect during 2009. Through a new outsourcing agreement and more efficient internal routines, the ambition is to further reduce iT costs.
Continuing introduction of JeevesHL Display’s iT environment is based on Jeeves, the group’s joint business system. 37 of the group’s 46 companies now work with this joint business system, representing 91 per cent of the group’s sales.
other projects completed during the year include improved tools in the production
and logistics units, for example a new planning system for the factory in Falun. HL Display also introduced a new system for liquidity forecasts and completed work on aaro, the group’s new consolidation tool.
Increased focus on information securityinformation security will be a prioritised area for the isiT function in the year ahead. in 2008 a wide-ranging study was conducted on information security in the group. one of the results of the study, which was conducted in partnership with veriscan, is a clearly defined activity plan with priorities, and this will form the basis of work during 2009.
Finance
The finance and financial administration function at HL Display has five primary areas of responsibility: accounting, internal Banking/Finance, group accounting and investor relations, Controlling/Mis plus acquisitions.
accounting and controlling of multiple legal entities are increasingly coordinated through regional service centres. administrative centres are located in sundsvall, stockholm, Tours (France), singapore and riga (Latvia). HL Display aims at separating controlling from accounting to facilitate strengthened internal control.
ControllingThe regional service centres, as well as the larger individual companies, employ a regional controller who deals with controlling, follow up and Management information systems. in addition there are controllers with the equivalent global responsibility who also work with operational development, often functioning as a link between operations and the iT function.
The task of Controller also includes identifying and introducing efficient working methods and routines into the various group companies, ensuring compliance to internal control guidelines and acting as support to users during the introduction
or development of the Jeeves business system, and other reporting systems, into HL Display subsidiaries.
as a part of the group’s increased focus on acquisitions, a specialist controller at group level is dedicated to this task and is responsible for financial analysis and valuation, as well as project management of the acquisition process and initial integration phase.
TreasuryHL Financial services (HFs) is HL Display’s treasury department and in-house bank. HFs’s responsibilities include management of currency risks and all the financing in the group. HFs is also a service centre for the swedish production companies and the service center in riga, as concerns management of accounts receivable including netting, and for scanning in and e-authorisation of suppliers’ invoices. The majority of the group flows and balances have been concentrated so that a deficit in one currency can be netted against surplus in other currencies. This advanced solution has facilitated amortizations on loans and a substantial decrease in group financing costs.
Accounting and investor relations HL Display places high demands on the quality of accounting in all group companies and that work is conducted in a way that support internal follow-up as well as legal requirements. HL Display has a high level of ambition for its external reporting and makes strenuous efforts to achieve rapid reporting without loss of quality. The basis of its dialogue with the market is transparency and honesty. HL Display was awarded the title stockmarket Company of the year in 2005 and the 2007 annual report won the nasdaq oMX nordic exchange’s competition for the Best annual report, small cap class. The annual reports for 2005 and 2006 have previously won honourable mentions.
Sup
port
pro
cess
esH
L D
ispla
y annual r
eport
20
08
25
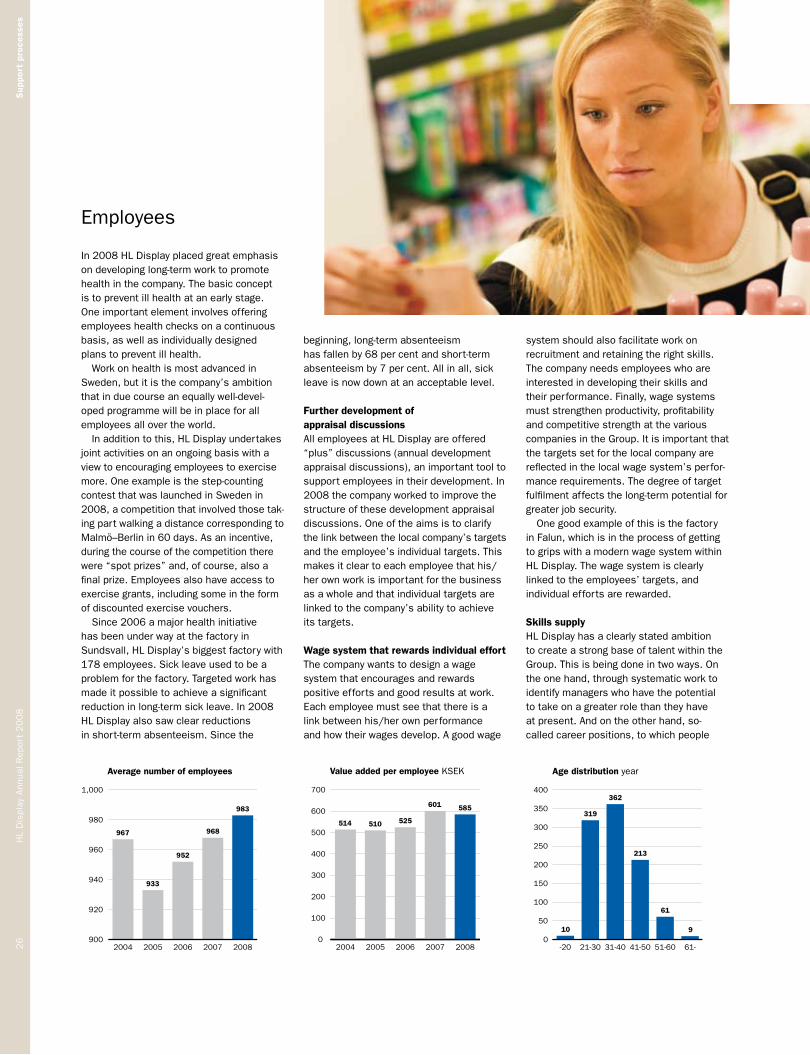
HL DispLay ÅrsreDovisning 2007 26
Average number of employees
900
920
940
960
980
1,000
20082007200620052004
967
933
952
968
983
Value added per employee KSEK
0
100
200
300
400
500
600
700
20082007200620052004
514 510 525
601 585
Age distribution year
0
50
100
150
200
250
300
350
400
61-51-6041-5031-4021-30-20
10
319
362
213
61
9
employees
in 2008 HL Display placed great emphasis on developing long-term work to promote health in the company. The basic concept is to prevent ill health at an early stage. one important element involves offering employees health checks on a continuous basis, as well as individually designed plans to prevent ill health.
Work on health is most advanced in sweden, but it is the company’s ambition that in due course an equally well-devel-oped programme will be in place for all employees all over the world.
in addition to this, HL Display undertakes joint activities on an ongoing basis with a view to encouraging employees to exercise more. one example is the step-counting contest that was launched in sweden in 2008, a competition that involved those tak-ing part walking a distance corresponding to Malmö–Berlin in 60 days. as an incentive, during the course of the competition there were “spot prizes” and, of course, also a final prize. employees also have access to exercise grants, including some in the form of discounted exercise vouchers.
since 2006 a major health initiative has been under way at the factory in sundsvall, HL Display’s biggest factory with 178 employees. sick leave used to be a problem for the factory. Targeted work has made it possible to achieve a significant reduction in long-term sick leave. in 2008 HL Display also saw clear reductions in short-term absenteeism. since the
beginning, long-term absenteeism has fallen by 68 per cent and short-term absenteeism by 7 per cent. all in all, sick leave is now down at an acceptable level.
Further development of appraisal discussionsall employees at HL Display are offered “plus” discussions (annual development appraisal discussions), an important tool to support employees in their development. in 2008 the company worked to improve the structure of these development appraisal discussions. one of the aims is to clarify the link between the local company’s targets and the employee’s individual targets. This makes it clear to each employee that his/her own work is important for the business as a whole and that individual targets are linked to the company’s ability to achieve its targets.
Wage system that rewards individual effortThe company wants to design a wage system that encourages and rewards positive efforts and good results at work. each employee must see that there is a link between his/her own performance and how their wages develop. a good wage
system should also facilitate work on recruitment and retaining the right skills. The company needs employees who are interested in developing their skills and their performance. Finally, wage systems must strengthen productivity, profitability and competitive strength at the various companies in the group. it is important that the targets set for the local company are reflected in the local wage system’s perfor-mance requirements. The degree of target fulfilment affects the long-term potential for greater job security.
one good example of this is the factory in Falun, which is in the process of getting to grips with a modern wage system within HL Display. The wage system is clearly linked to the employees’ targets, and individual efforts are rewarded.
Skills supplyHL Display has a clearly stated ambition to create a strong base of talent within the group. This is being done in two ways. on the one hand, through systematic work to identify managers who have the potential to take on a greater role than they have at present. and on the other hand, so-called career positions, to which people
Sup
port
pro
cess
esH
L D
ispla
y annual r
eport
20
08
26

27HL DispLay ÅrsreDovisning 2007
HL Display’s fundamental values
Target fulfilmentHL Display’s ambitious aims create a result-oriented corporate culture. Targets are set high, and create positive challenges for the company and its employees. Day-to-day activities are characterised by an insistent striving towards target fulfilment.
Trust and respectHL Display also emphasises the importance of open, honest dialogue within the company. showing trust in all employees and an atti-tude that everyone is doing their best for the company combined with a stated policy of maintaining and developing a good, honest business ethic.
Driveproblems must be solved where and when they arise. personal drive is encouraged. The basic idea is that everyone must have the competence and the ability to deal independently with their daily tasks. This is in line with the company’s entrepreneurial heritage.
Commitmentsuccessful managers lead by example by showing commitment in day-to-day activities, while at the same time retain-ing an overall view of the business. The ability to set a good example is an important element of daily management.
Non-prestigiousThe company’s employees are non-prestigious. results are more important than job titles, and the company’s heroes are those involved in day-to-day activities.
Number of years employed %
>24 years 220-24 years 315-19 years 710-14 years 145-9 years 20<5 years 54
Employee categories No. of persons
Production 336Administration and management 118Warehouse 113Product development 28Sales and marketing 379
are recruited if they have the capacity in due course to take on roles with more responsibility.
HL Display also wants as far as possible to promote internal recruitment, and there is a clear trend indicating that the number of internal recruitments has increased in the group primarily where there are clearly defined career paths.
Increased quality in recruitmentDuring the year HL Display devoted considerable energy to increase the quality of recruitment work. The company has concentrated primarily on two areas. First of all, the recruitment process has been defined and clarified for all managers. in parallel with this, they have also been trained in thinking strategically and systematically in their recruitment work. one example of what this means is that managers must avoid a replacement-based approach to recruitment, i.e. replacing a person leaving a position with exactly the same skills and approach. They must instead focus on the company’s targets and what the skills profiles should be to drive the business towards its targets.
secondly, the Human resources function has quality-assured the providers with
which the company works when it comes to recruitment. Clearly defined criteria have been drawn up for the selection of recruitment partners.
Focus for 2009in 2008 HL Display initiated a process to optimise staffing in the sales companies all over the world, and this will also be an important element of work within Human resources in 2009. This work includes analysing what kind of organisation is ideal for each individual company. each position is analysed and evaluated on the basis of what it shall deliver, and this is related to the local company’s targets, strategies and desired cost structure.
in 2009 HL Display will also increase its focus on the employee questionnaire, HL Dialogue, that is completed every other year. a new iT support system has been developed, which will both rationalise implementation and focus the analysis of the questionnaire. at the same time, the ambition is to increase the support provided to managers around the world to develop their businesses on the basis of the results that emerge.
Employee facts
number of employees as of December 31
974
gender structure, % Male 62
Female 38
education level, % University 35
Upper secon-dary school
53
Compulsory school
12
investment in staff training
Total, MseK 2
per employee, KseK
2
Costs related to health promotion activities
per employee, KseK
2
reported incidents Minor 21
serious 3
Sup
port
pro
cess
esH
L D
ispla
y annual r
eport
20
08
27

HL DispLay ÅrsreDovisning 2007 28
Maxi iCa superstore in nacka
Together with Maxi ICA Superstore in Nacka, HL Display has produced new solutions to create an even better store for customers.
The Maxi iCa superstore is iCa’s largest in-store concept. in addition to a wide range of food products there are also books, clothes, household utensils, sports articles, and everything for the garden. The stores are characterised by generous open-ing hours and easy access for customers arriving by car. There are a total of some 60 Maxi iCa superstores throughout sweden.
HL Display has worked in close co operation with iCa for many years, which is in fact HL Display’s largest customer in sweden. iCa has high aspirations for
its store environments, with a distinct ambition to ensure that the customer is always in focus. This means, for example, that they are continuously searching for new solutions to improve in-store communication and product presentation.
and this is very much in evidence at the Maxi iCa superstore in nacka – one of iCa’s prestige stores. The store has an unmis-takable fresh produce profile, with man-ual fish, meat and delicatessen counters, as well as its own bakery. HL Display has developed a variety of different solutions in
close cooperation with store managers and departmental managers, as well as iCa’s business development department and its category managers, to create an attractive store that is easy to navigate.
one of these solutions is a “tasting centre”, which has been established in the middle of the store with flavours from all over the world. There is also an opportunity to be inspired by a large variety of different recipes. The explicit and attractive concepts for pets and health and beauty have also been successful.
– HL Display is sensitive to our needs, and often contributes with inspiration for how we can improve our stores. The solutions HL Display offer help us to increase sales and simplify our work in the store, says Mats nilsson, merchant at Maxi iCa superstore in nacka.
The Maxi iCa superstore in nacka was also one of the first stores to introduce HL Display’s very latest solutions, roller Track™ and Bulk Bins. roller Track™ is a solution for automatic conveying of prod-ucts that Maxi iCa superstore in nacka uses in its dairy department to ensure that the products are continuously exposed in an attractive and explicit way. Bulk Bins are used by departments with nuts and grains, and allow customers to measure up the amounts they want to have.
Many of the solutions that have been developed for Maxi iCa superstore in nacka are also used today in other Maxi stores. HL Display is looking forward to further cooperation with iCa, with a clear emphasis on creating the best possible store environment for customers.
Cus
tom
er c
ase
stud
yH
L D
ispla
y annual r
eport
20
08
28
HL Display’s solutions for sales of goods by
weight allow the consumers themselves to
choose the quantity.

29HL DispLay ÅrsreDovisning 2007
LeaF
Together with confectionery manufacturer LEAF, HL Display produced an adapted merchandising solution to expose trademarks such as Malaco and Läkerol in the newly opened Malmö Arena.
LeaF is a market leading confectionery manufacturer in scandinavia, with a turn-over of seK 1.3 billion. The company offers a wide and varied product range of high-quality confectionery. The trademarks include some of the most popular brands in scandinavia, for example, Läkerol, Malaco and ahlgrens bilar.
HL Display has been cooperating with LeaF for over the last ten years. When LeaF wanted to develop a new in-store solu-tion for its trademarks for several kiosks in the newly built Malmö arena – Malmö’s new multiarena with space for 12,500 to 15,000 persons, depending on the event – the inquiry was sent to HL Display. one important reason was that LeaF knew that with HL Display they would obtain an overall supplier of complete merchandising solutions.
– By engaging HL Display we know we’ll get a reliable supplier who can help up to develop the best possible overall solution for our needs. This was a major advantage, because we also wanted a solution delivered relatively immediately, in time for the opening of the arena, explains Torbjörn Johansson, instore Manager at LeaF.
LeaF was asking for a solution that gives maximum product exposure for the sales areas in the kiosks. another important requirement was that the solution should be mobile so that it could be moved out into the aisles, and therefore further attract the attention of visitors in the arena.
in a very short time HL Display produced a customised store system that focused on functionality and design. The solution con-sisted of interior fittings, as well as product exposure and price information solutions.
Cus
tom
er c
ase
stud
yH
L D
ispla
y annual r
eport
20
08
29
HL Display also designed a specially adapted wheel solution to ensure that the shelves were completely mobile and could quickly and easily be repositioned.
There was a positive response from both Leaf and the Malmö arena. This cooperation with LeaF has subsequently led to smaller variants of the solution being used at arlanda airport in stockholm, the sturup airport in Malmö, and on the viking Line ferries.
The merchandising solution that HL Display developed
for LeaF is completely mobile and could quickly and
easily be repositioned.

HL DispLay ÅrsreDovisning 2007 30
The HL Display share
The HL Display share was listed in 1993 and is currently quoted on the nasdaq oMX small Cap list. as at 31 December 2008 the share capital in HL Display totalled seK 38,673,860, divided among 30,939,088 shares, of which 3,652,096 are class a shares and 27,286,992 class B shares. each share has a quota value of seK 1.25. Class a shares carry one vote and class B shares 1/10 of a vote. all shares provide equal entitlement to a share of the company’s assets and profits.
Share price developmentsince its stock exchange launch, the share’s value has increased by 541 per cent from seK 3.59 (corrected for bonus issues and share split) to seK 23.00 on 31 December 2008. During the same period the siX general index increased by 148 per cent. in 2008 the price decreased by 53 per cent, while the siX general index recorded a decrease of 42 per cent. The highest price paid during the year for the HL Display share was seK 53.50, and the lowest seK 21.90. at the end of 2008 HL Display’s market capitalisation reached MseK 627.
Trade volumesDuring the year 687,621 shares were traded at a value of MseK 51, correspond-ing to a turnover rate of 4.6 per cent.
Liquidity providerHQ Bank aB will act as liquidity provider in the company’s share from January 7, 2009. The intention is to promote liquidity in the share. The agreement means in brief that the liquidity provider will provide bid and offer prices for the HL Display share and undertakes to buy and sell shares at these prices for its own account.
Shareholdersas at 31 December 2008 the number of shareholders was 1,695 (1,791). The propor-tion of institutional shareholders is estimated at 57 (57) per cent of capital and the propor-tion of foreign shareholders is 4 (3) per cent.
Option schemesThere are two option schemes aimed at employees in senior management positions. The option schemes totals 287,252 employee stock options and 256,000 warrants, which represents a total of 1.8
per cent of share capital and 0.9 per cent of votes in HL Display if fully subscribed. if the warrants are fully subscribed, the number of shares will amount to 31,495,088. The warrants have been issued on commercial terms, defined in accordance with the so called Black & scholes valuation model, and the purchase price was paid in cash. Utilisation of subscription rights is not sub-ject to continued employment. The employee stock options have been issued to the Ceo without fee. The entitlement of the Ceo to utilise these options is conditional on his continued employment plus the achievement of certain group goals. The programme has been reported in accordance with iFrs 2.
Dividend policyin the long term the Board is striving to achieve a dividend proportion corre-sponding to 30-50 per cent of the profit per share after tax.
DividendFor the financial year 2008 the Board proposes a dividend of seK 1.38 (1.38) per share, equivalent to 44 (39) per cent of earnings per share after tax.
Share price trends
B-shareSIX General indexNumber of shares traded, thousands (incl. after-hours)
1998 1999 2000 2001 2002 2003 2004 2005 2006 2007 200815
20
40
60
80
100
120
© NASDAQ OMX
200
400
600
800
1,000
Foreign owners 4.3Swedish unit-trusts 19.1Swedish institutions 38.3Swedish private owners 38.3
Shareholder structure %
The
shar
eH
L D
ispla
y annual r
eport
20
08
30

31HL DispLay ÅrsreDovisning 2007
Decided option schemes 1)
Number of Proportion of Number of employee share capital if Proportion of votes Year implemented warrants stock options fully subscribed if fully subscribed Subscription price Exercise period2006 – 287,252 0.97% 0.47% 39.25 2007-01-01--2011-03-312007 256,000 2) – 0.83% 0.40% 56.50 2010-03-01--2010-04-30Total 256,000 287,252 1.80% 0.87%
1) Corrected for share split (4:1) 02-04-2008. 2) on the balance sheet date 196,000 warrants had been acquired by employees.
Ownership structure on 31 December 2008
No. of shares No. of shareholders No. of shares % of shares1 - 500 893 181,832 0.6501 - 2,000 477 544,506 1.82,001 - 10,000 255 1,100,225 3.610,001 - 50,000 42 898,701 2.950,001 - 100,000 5 303,272 1.0100,001 - 23 27,910,552 90.1Total 1,695 30,939,088 100.0
Data per share 1, 2)
2008 2007 2006 2005 2004 2003 2002 2001 2000earnings per share after tax, seK 3.11 3.49 1.97 1.15 1.52 -1.31 1.43 1.81 0.87earnings per share after dilution and tax, seK 3.11 3.48 1.96 1.14 1.51 -1.31 1.43 1.81 0.87Dividend per share, seK 3) 1.38 1.38 0.88 0.75 0.63 0.41 0.41 0.39 0.35Dividend, % of earnings after tax 44.4 39.4 44.5 65.4 23.6 n/a 7.2 5.4 10.1share price end of period, seK 23.00 48.75 46.00 35.25 34.25 27.75 22.75 32.00 18.25equity per share, seK 17.40 15.26 12.53 11.13 10.67 9.53 10.27 9.22 7.77equity per share, after dilution, seK 17.40 15.24 12.50 11.10 10.65 9.51 10.27 9.22 7.77Direct yield, % 6.0 1.8 1.9 2.1 1.8 1.5 1.8 1.2 1.9p/e ratio, 31 December 7.4 14.0 23.4 30.7 22.6 n/a 15.9 17.7 21.0operational cash flow per share, seK 5.44 4.59 3.81 1.15 2.57 1.03 2.16 1.38 0.32
no. of shares 30,939,088 30,939,088 30,908,688 30,755,488 30,755,488 30,755,488 30,755,488 30,755,488 30,755,488Weighted-average no. of shares 30,939,088 30,933,176 30,774,032 30,755,488 30,755,488 30,755,488 30,755,488 30,755,488 30,755,488Weighted- average no. of shares, diluted 30,939,088 30,984,444 30,843,836 30,838,152 30,828,556 30,801,440 30,769,556 30,755,488 30,755,488 1) see page 33 and note 15 for definitions of key ratios. 2) years 2000-2003 not restated according to iFrs. 3) according to the Board’s proposal.
Largest shareholders, 31 December 2008 No. of No. of Total no. Share of No. of Share of A shares B shares of shares capital, % votes votes, %ratos aB 436,864 8,463,416 8,900,280 28.8 1,283,206 20.1The remius family and company 3,215,232 5,571,592 8,786,824 28.4 3,772,391 59.1Lannebo fonder – 3,060,200 3,060,200 9.9 306,020 4.8Didner & gerge mutual fund – 1,965,100 1,965,100 6.4 196,510 3.1Livförsäkringsaktiebolaget skandia – 1,758,448 1,758,448 5.7 175,845 2.8The Jonsson family – 519,800 519,800 1.7 51,980 0.4Unionen – 468,400 468,400 1.5 46,840 0.7aktia sparbank – 400,000 400,000 1.3 40,000 0.6invus investment aB – 331,200 331,200 1.1 33,120 0.5göran Källebo – 321,600 321,600 1.0 32,160 0.5others – 4,427,236 4,427,236 14.2 442,724 7.4Total 3,652,096 27,286,992 30,939,088 100,0 6,380,796 100,0
The
shar
eH
L D
ispla
y annual r
eport
20
08
31

HL DispLay ÅrsreDovisning 2007 32
Sensitivity analysis Effect on netFactor Change profit/loss, MSEKnet sales 1% volume 7.6Decline in the largest market -1% volume -1.0price of pvC 1% 0.9price of polycarbonate 1% 0.1price of electricity 1% 0.1Cost of personnel 1% 4.1interest rates 1 percentage point 0.8Depreciation 1% 0.4euro exchange rate 10 öre 1.4
Raw material sensitivityplastic raw materials constituted 66 per cent of the group’s raw material purchases. The major raw material, pvC, was responsible for 40 per cent the group’s total raw material costs. The price of pvC reached its highest recorded level in september 2008, though the price has decreased during the last months of the year. average price for crude pvC was 7 per cent higher during 2008 than during 2007. HL Display estimates that the downward trend in the price of pvC will continue during the first quarter of 2009, before stabilising and starting to increase during the second half of 2009. Customer agreements are generally renegotiated once annually and price adjustment clauses covering raw material fluctuations are rare in this business. an increase of one per cent in pvC purchasing costs in 2008 would have reduced profit before tax by MseK 0.9. Taken into account the current high volatility in raw materials prices, HL Display purchases raw materials on a monthly basis. in order to decrease raw material price sensitivity, HL Display is successfully developing methods for use of alternative materials.
Currency riskHL Display’s main markets are within the euro area. Consequently the company is exposed to exchange rate fluctuations as production mainly takes place in sweden and invoicing in foreign currencies. invoicing to subsidiaries is carried out in local currency in order to concentrate the group’s currency exposure to sweden. external distributors are invoiced in seK. The currency effects that impact the company’s earnings are the transaction flows in the different cur-
risk and sensitivity analysis
500
600
700
800
900
1,000
1,100
1,200
2008200720062005200420032002
Price of crude PVC EURO/TONNE
Source: ICIS-LOR
Exchange rate EURO/SEK
8.5
9.0
9.5
10.0
10.5
11.0
200820072006200520042003
Source: Riksbanken
Aluminium, steel and wire 1Packaging 6Semi manufactured articles 8Polycarbonate (PC) 3PVC 40Other plastic raw materials 24Tape 7Electricity and cooling water 6Other 5
Raw materials 2008 %
rencies, flow exposure, and recalculation of the foreign subsidiaries’ profit and loss statements and balance sheets, conversion exposure.
Flow exposureFlow exposure is caused partly by invoicing in foreign currencies and partly by purchases in foreign currency or purchases where price is regulated by a currency clause. The swedish krona was weakened in comparison with HL Display’s most important export currencies dur-ing 2008, especially the eUro and the norwegian krona. Compared with 2007, the swedish krona was strengthened in relation to the British pound and remained unchanged, on average, in relation to the russian ruble. 35 per cent of turnover is invoiced in eUro, 7 per cent in gBp, 7 per cent in rUB and 8 per cent in noK. HL Display’s pur-chases that affect exposure primarily consist of overhead expenses for the overseas sales companies and of material purchases whose prices are regulated through a currency clause. HL Display’s general policy is to hedge future cash flows. HL Display’s currency exposure has, as compared to 2007, had a positive effect on operating profit before taxes by MseK 5.9, according to the table below.
Currency’s effect on profit before taxes (as compared to average exchange rate in 2007, MSEK) net sales 18.2Costs goods/services sold -5.6selling expenses -5.7administrative expenses -1.0Development expenses 0.0other operating income/expenses 0.0Total effect of currency exchange rate changes on operating profit 5.9
Conversion exposureThe net value of assets in currencies (equity in subsidiaries) other than the reporting currency (seK) will change according to exchange rate fluctuations. This risk is termed conversion exposure. For more information please refer to note 2.
Financial risks and financial instrumentsFor a description of financial risks, financial instruments used, and financial policy in HL Display, please refer to note 2.
Ris
k a
nd s
ensi
tivi
ty a
naly
sis
HL
Dis
pla
y annual r
eport
20
08
32

33HL DispLay ÅrsreDovisning 2007
nine year summary
Income statement (KSEK) 2008 2007 2006 2005 2004 2003 1) 2002 1) 2001 1) 2000
net sales 1,535,639 1,571,181 1,448,138 1,284,824 1,249,029 1,129,005 1,154,407 1,071,934 873,921 operating profit/loss 130,258 160,540 106,727 62,727 107,753 -3,888 75,967 83,031 47,731 Depreciation 36,123 39,515 44,379 46,798 46,460 47,556 49,231 46,572 40,197 profit/loss before taxes 136,157 154,688 92,254 61,720 92,837 -9,212 65,353 81,831 44,095 Loss from discontinued operations, net after taxes – – – -7,709 -15,950 – – – – Net profit/loss for the year 96,317 108,236 61,874 34,745 46,621 -10,109 43,900 55,513 26,747 Balance sheet (KSEK) non-current assets 202,233 195,644 233,793 241,993 247,637 171,456 193,697 197,742 186,099 Current assets 744,064 696,053 642,768 518,478 519,778 474,088 456,711 436,897 315,701 Total assets 946,297 891,697 876,561 760,471 767,415 645,544 650,408 634,639 501,800 shareholders’ equity 541,853 474,865 387,756 342,329 328,293 292,979 315,821 283,667 238,919 provisions – – – – – 13,876 23,478 26,121 16,997 non-current liabilities 88,780 111,444 129,540 123,083 138,807 66,421 66,444 107,037 84,949 Current liabilities 315,664 305,388 359,265 295,059 300,315 272,268 244,665 217,814 160,935 Shareholders’ equity and liabilities 946,297 891,697 876,561 760,471 767,415 645,544 650,408 634,639 501,800 Key ratios average number of employees 983 968 952 933 967 975 925 855 773 revenue per employee, KseK 1,562 1,623 1,521 1,377 1,292 1,158 1,248 1,254 1,131 eBiTa margin, % 8.5 10.3 7.4 4.9 8.6 -0.3 6.6 7.7 5.5 eBT margin, % 8.9 9.8 6.4 4.8 7.4 -0.8 5.7 7.6 5.0 equity/assets ratio, % 57.3 53.3 44.2 45.0 42.8 45.4 48.6 44.7 47.6 Debt/equity ratio 0.19 0.27 0.52 0.55 0.63 0.49 0.44 0.45 0.42 return on total capital, % 15.6 18.6 13.0 9.5 14.9 -0.2 12.0 16.0 11.0 return on equity after tax, % 19.1 25.2 16.6 10.4 15.0 -3.3 14.6 21.2 11.6 return on capital employed, % 23.0 27.6 19.0 13.5 20.8 -0.3 16.8 23.3 15.5 interest coverage ratio 20.7 16.5 7.4 6.6 6.5 -0.2 6.6 10.2 7.0 net investments, KseK 31,749 70,179 31,662 39,506 64,999 39,344 44,401 47,517 58,099 Cash and cash equivalents, KseK 220,773 177,079 163,244 81,131 112,013 94,840 100,388 65,201 31,328 Development costs, KseK 28,000 37,545 39,070 40,378 42,142 36,958 32,897 30,589 26,902
For key ratios per share, see page 31.
1) years 2000-2003 not restated according to iFrs.
Definitions
Average collection periodaccounts receivables on 31 December divided by net sales increased by 20 per cent vaT (average vaT in the group) multiplied by 365 days.
Capital turnover ratenet sales in relation to average balance sheet total.
Development expensesDevelopment expenses are expenses for production, materials and product development.
Debt/equity ratiointerest bearing liabilities in relation to total equity.
Direct yieldDividend as percentage of share price on 31 December.
Earnings per share after dilutionprofit after tax, attributable to parent company shareholders, divided by the weighted average number of shares after dilution.
Earnings per share after taxprofit after tax, attributable to parent company shareholders, divided by the weighted average number of shares. Corresponds to net Worth as HL Display does not have hidden reserves.
EBITA marginearnings before interest, taxes and amortizations. operating profit added for amortization and impairment of goodwill on consolidation, in relation to net sales.
EBT marginearnings before taxes. profit before taxes in relation to net sales.
Equity/assets ratioequity including minority share in relation to balance sheet total.
Equity per share after dilutionreported equity divided by the weighted average number of shares after dilution.
Equity per sharereported equity divided by the weighted average number of shares.
Interest-bearing net liability/receivableinterest-bearing liabilities less interest-bearing assets.
Interest coverage ratioprofit before taxes plus financial expenses in relation to financial expenses.
Operating cash flow per shareChanges in cash and cash equiva-lents in any given year from operating activities after deduction of interests and tax payments, plus investments in intangible and tangible operational fixed assets, divided by the weighted average number of shares.
P/E ratioshare price on 31 December divided by earnings per share after tax.
Return on capital employedprofit after financial items plus finan-cial expenses in relation to average capital employed. Capital employed is the balance sheet total less non-interest bearing liabilities.
Return on equity after tax profit after tax in relation to average equity. Minority shares have been excluded from both profit and capital.
Return on total capitalprofit before taxes plus financial expenses in relation to average balance sheet total.
Share turnover velocity %share turnover during the year/average Market Cap during period * 250/number of trading days * 100.
Staff turnoverno. of employees that have left the company divided by average number of employees.
Value added per employeeoperating profit plus cost of salaries and social security payments divided by the average number of employees.
Working capitalCurrent assets excluding cash and cash equivalents minus non interest-bearing current liabilities.
1)
Nin
e ye
ar s
umm
ary
HL
Dis
pla
y annual r
eport
20
08
33

HL DispLay ÅrsreDovisning 2007 34
administration report
HL Display aB (publ), Cin 556286-9957, is a swedish, public limited company.
The company has its registered office in stockholm, which is in the process of being changed to nacka; address Cylindervägen 18, se-131 26 naCKa sTranD.
The Group
General information on operationsHL Display is a market leader and international supplier of products and solutions for in-store communication and merchandising to the retail trade. HL Display is a growth company with good profitability and aims to create an increase in value for its shareholders.
Economic climateHL Display has historically shown very little sensitivity to fluctuations in the business cycle. The transition to selling category solutions has implied greater sensitivity to the general economic climate. seasonal variations have a negative impact on HL Display in December and January in that client companies mainly consist of retail trading companies that do not plan for restructuring during the Christmas period.
DemandHL Display’s client structure, with a large number of customers on different markets, means the market risks are well distributed. HL Display produces and delivers directly on the basis of assignments received from customers. Changeover times in production are short and the company have very short lead times, in most case less than two weeks. The development of HL Display towards a larger proportion of specific total solutions for customers means that the size of orders is increasing, and therefore an increasingly high degree of fluctuation in income flows is predicted.
CompetitionHL Display faces global competition at product level, where some inter-national suppliers can offer individual products to several markets. in the area of solutions for merchandising and in-store communication the com-pany faces competition at local level, i.e. in a country or a region. as a global overall supplier, HL Display does not have any direct competitors at present. The needs of retail trade companies for uniform and joint solutions over several markets mean that the risks to which HL Display is exposed are low on mature markets and in relation to large client companies. Because HL Display follows its established customers into new markets, the risks on new markets are also considered to be relatively low.
Manufacturing, products and patents HL Display is a world leader in the production methods most important for the company. new conceptualisation and innovative design have contributed to HL Display establishing a new product standard in large parts of the retail trade. it is therefore not surprising to find that several examples have been noticed of the copying of the company’s product range. HL Display’s patent strategy is primarily to protect best-selling products in the production areas of extrusion and injection moulding.
Political riskspolitical risks consist of legislation, taxation issues and commercial trading policy factors. HL Display is not exposed to any significant political risks.
staffin HL Display there are a large number of key employees with a high level of competence and well-established customer relations. as the company’s expertise shifts further out in the organisation, closer to the customer, it becomes increasingly important to document work with customers in
databases. a CrM system that simplifies this documentation and supports work with customer relations has been introduced in the group. Work with customers takes place in teams, which means that the financial effects of the loss of individual key staff are limited. The average number of employees in HL Display during the year amounted to 983 (968). The number of employees at the end of the year was 974 (972), see also note 8.
Ownership structureHL Display’s share has been listed since 1993 on the small cap list at nasdaq oMX nordic. The number of shareholders as of December 31, 2008 amounted to 1,695 (1,791). The proportion of institutional ownership is estimated to 57 (57) per cent of the capital, and the proportion of foreign owners is 4 (3) per cent. The largest shareholder is ratos aB, with 28.8 per cent of the capital, followed by the remius family with 28.4 per cent. For further information about the HL Display share, see pages 30-31.
Notes to the company’s profits, financial position and cash flow Income statementHL Display has historically not been very affected by fluctuations in the business cycle but this has been the case in the last months of 2008. profitability has, however, remained satisfactory as a result of measures to improve profitability. net sales for the group amounted to MseK 1,536 (1,571) during the year, a reduction of 2 per cent in comparison with 2007. The change in value of the swedish currency in relation to export currencies has in comparison with the previous year had a positive effect on sales of MseK 18.
operating profit for the year was MseK 130 (161), and profit before tax amounted to MseK 136 (155). The change in value of the swedish currency in comparison with the previous year had a positive effect on operating profit to an amount of MseK 6. net interest for the period amounted to MseK -1 (-6), while foreign exchange effects amounted to MseK 7 (0). HL Display’s most important trade currencies are the euro, British pounds and russian rubles.
Balance sheetThe balance sheet total increased by MseK 55, or by 6 per cent. Working capital decreased by MseK 12 and liquidity has been improved. During the period net investments in fixed assets amounted to MseK 32 (70). The capital turnover rate was slightly less, 1.7 (1.8). Depreciation according to plan dur-ing the period amounted to MseK 36 (40). inventories had as of December 31 increased by MseK 34, and constitute 12 per cent (10) of net sales. accounts receivable as of December 31 had decreased by MseK 17. The proportion of accounts receivable in relation to net sales remained unchanged at 18 per cent (18). The average credit period reduced slightly to 54 days (56).
Equityequity in the group amounted as of December 31, 2008 to MseK 542 (475). equity per share amounted to seK 17.40 (15.26). The equity/assets ratio was 57 per cent (53). Long-term liabilities decreased by MseK 22 to MseK 89. Current liabilities increased by MseK 10. The debt/equity ratio decreased to 0.19 (0.27). interest-bearing liabilities amounted as of December 31 to MseK 100 (128), of which current liabilities accounted for MseK 39 (44).
Changes in equity mainly consisted of net profit for year and dividends to shareholders. in 2008 there was a dividend of seK 1.38 per share, in total MseK 42.7. The existing options scheme may lead to changes in equity in 2009-2011, since the options may be converted to shares (for further information, see pages 30-31).
Cash flowThe cash flow statement has been prepared in accordance with the indirect method. The reported cash flow only includes transactions that have led to incoming and outgoing payments. The cash flow from current operations
Adm
inis
trat
ion
repo
rtH
L D
ispla
y annual r
eport
20
08
34

35HL DispLay ÅrsreDovisning 2007
increased in 2008 to MseK 154 (138), primarily as a result of operating receivables. a reduction in operating profit and a higher level of inventories has had a negative effect. The cash flow from investment operations was improved as a result of a reduction in investments to MseK -24 (-68). investments mainly refer to tangible fixed assets such as production equip-ment and tools for new products. The level of investments in the previous year was affected by acquisitions. The cash flow from financial activities amounted to MseK -90 (-57). Dividends were paid to an amount of MseK 43 (27), and loans have been amortised to a net value of MseK 47.
Important events during the financial year, or afterwardsOperationssales on the markets in which HL Display operates has in total been weaker than initially expected. This is mainly explained by a decreased demand due to the uncertainty created by an approaching recession. several markets have developed satisfactory, especially norway and Finland. production efficiency has increased, but operating costs have also increased in relation to net sales. approximately MseK 22 is referable to new subsidiaries and the build up of sales companies on expanding markets. operating profit has decreased by 19 per cent from MseK 161 to 130. The profit margin for the year amounted to 8.9 per cent (9.8).
The two acquisitions completed in Finland in 2007 have been integrated into HL Display’s organisation and product range, and have had a positive contribution to profits for the group. HL Display will continuously investigate opportunities to reinforce the company’s product offering and its market position through additional acquisitions.
raw material prices have, in similarity with last year, remained high. The measures to improve efficiency implemented at the factories have, however, neutralised the negative effects on profit. additional measures are intended to be taken to reduce costs.
in the fourth quarter HL Display expanded the nordic logistics centre in Falkenberg with stocks for the Finnish market, in addition to what was previously coordinated for the swedish and norwegian markets. The logistics centre in Falkenberg also coordinates trading with purchased products. There is still a logistics centre in singapore for asia, and one in France for Western europe. To supplement the new logistics model it remains to establish logistic centres for countries in Central europe. The new logistics structure has resulted in an increase in the size of average orders, which in turn creates longer production series, and which is a prerequisite for efficient production.
Organisational changesa former distributor in Bulgaria has been acquired during the year, and the number of sales companies has therefore increased to 32.
Management changesper sundqvist has been appointed new CFo and will start at HL Display on 1 april, 2009. He succeeds Kent Hertzell, who left the position on 1 november 2008.
Activities in research and developmentproduct development is an important part of HL Display’s expansion strategy. in 2008 the main emphasis has been on innovation and custom-design with the objective of reinforcing the range of products to customers in the category of brand suppliers. Development costs in 2008 amounted to MseK 28 (38).
Information on risks and uncertainty factorsFluctuation in the price of raw materials and exchange rates constitute uncertainty factors, but not significant risks. For a more detailed description of the risks and uncertainty factors facing HL Display, refer to the risk and sensitivity analysis on page 32.
Financial instruments and risk managementFor a description of financial policy, financial instruments and risk manage-ment in HL Display, see note 2.
Environmental informationintensive environmental work has been in progress for several years at all our production plants, see page 24. The screen print works in Falun is subject to statutory reporting as a result of potential environmental impact on the atmosphere. HL Display does not conduct any operations that are subject to authorisation.
Report on the work of the board of directors during the yearFor a report on the work of the board and directors and committees, see the corporate governance report on pages 62-67.
Expectations for future developmentsBusiness objectives The financial objectives of the HL Display group are organic growth of 5-10 per cent a year, and within a few years to achieve an eBiTa margin of at least 12 per cent.
Prospects for 2009 sales in 2009 are estimated to remain at the level in 2008.
Parent company
The parent company has its head office in stockholm and its operations include group services and group management functions. in 2008 the parent company has been relocated to nacka. There is a representation office in suzhou, China. profit after financial items for the parent company amounted to MseK 124 (107).
Remuneration to senior executivesFor information on remuneration to senior executives, see note 8. note 8 also accounts for the guidelines for remuneration to senior executives, as adopted by the 2008 annual general Meeting. The guidelines to be proposed to the 2009 annual general Meeting are unchanged, except that total fixed salary is not stated and that flexible remuneration can have a total maximum according to the following. For 2009, the Ceo will be able to achieve a maxi-mum of 50 per cent of the fixed annual salary. other senior executives the maximum is 25 per cent of the fixed annual salary.
For information on remuneration to senior executives, see note 8.
Options schemesThere were two options schemes in the company at the year-end. one is a warrant scheme covering 256,000 warrants, of which 196,000 have been subscribed by persons in management. if this is utilised in full the new shares will correspond to 0.83 per cent of the total capital stock. The second is an employee options scheme where a maximum of 287,252 options can be utilised by the company’s managing director depending on earnings. if this scheme is utilised in full the new shares will correspond to 0.97 per cent of the total capital stock. For further information, see pages 30-31.
Proposed appropriation of company profit
The board of directors proposes that the available profit of seK 327,800,206 should be allocated as follows:
Dividends; 30,939,088 * seK 1.38 42,695,941Carried forward in a new account 285,104,265Total 327,800,206
For the performance and financial position of the company otherwise, refer to the following income statement and balance sheets, and the notes to the financial statements.
Adm
inis
trat
ion
repo
rtH
L D
ispla
y annual r
eport
20
08
35

HL DispLay ÅrsreDovisning 2007 36
group
Consolidated income statements
KSEK, 1 January-31 December Note 2008 2007net sales 3, 4 1,535,639 1,571,181Cost of goods/services sold -776,269 -833,768Gross profit 759,370 737,413 selling expenses -463,214 -421,685administrative expenses 39 -134,454 -123,533research and development expenses -28,000 -37,545other operating income 6 5,882 11,893other operating expenses 7 -9,326 -6,003Operating profit 8, 9, 10 130,258 160,540 Financial income 11 12,794 4,103Financial expenses 12 -6,895 -9,955Net financial items 5,899 -5,852 Profit before taxes 136,157 154,688 income tax expense 14 -39,840 -46,452Net profit for the year 96,317 108,236 attributable to: The parent company’s shareholders 96,254 107,864Minority interest 63 372 96,317 108,236 earnings per share 15 before dilution (seK) 3.11 3.49 after dilution (seK) 3.11 3.48
Gro
upH
L D
ispla
y annual r
eport
20
08
36

37HL DispLay ÅrsreDovisning 2007
Consolidated balance sheets
KSEK, 31 December Note 2008 2007Assets 4, 16, 17
Non-current assetsintangible assets 5, 18 42,781 35,350property, plant and equipment 19 137,922 138,359participations in associated companies and joint ventures 21 5,000 5,000non-current receivables 22 2,329 2,029Deferred tax asset 14 14,201 14,906Total non-current assets 202,233 195,644 Current assetsinventories 24 187,165 153,585Tax assets 8,892 9,775Trade and other receivables 25 271,025 288,081prepaid expenses and accrued income 26 25,038 26,580other current assets 27 31,171 40,953Cash and cash equivalents 28 220,773 177,079Total current assets 744,064 696,053Total assets 946,297 891,697 Equity and liabilitiesEquity 29 share capital 38,674 38,674reserves -8,887 580retained earnings including net profit for the year 512,066 435,611Total equity 541,853 474,865 Liabilities Non-current liabilitiesinterest-bearing non-current liabilities 2, 31 61,780 84,023other non-current liabilities 607 860pension provisions 32 4,367 3,614Deferred tax liability 14 22,026 22,947Total non-current liabilities 88,780 111,444 Current liabilitiesinterest-bearing current liabilities 2, 31 38,559 44,190Trade and other payables 78,614 94,256Tax liabilities 14,292 13,588other current liabilities 33 49,733 51,824accrued expenses and prepaid income 35 134,466 101,530Total current liabilities 315,664 305,388Total liabilities 404,444 416,832Total equity and liabilities 946,297 891,697 For information about pledged assets and contingent liabilities, see note 36.
Gro
upH
L D
ispla
y annual r
eport
20
08
37

HL DispLay ÅrsreDovisning 2007 38
Consolidated statement of changes in equity
Equity relating to the parent company’s shareholders Retained Minority Total
KSEK Note 29 Share capital Reserves earnings Total interest equityopening balance Jan 1, 2007 38,636 – 346,839 385,475 2,281 387,756Cash flow hedge reserve – 580 – 580 – 580Translation difference – – 2,448 2,448 188 2,636Total changes posted directly to equity – 580 2,448 3,028 188 3,216profit for the year – – 107,864 107,864 372 108,236Total changes in equity, excl. distributions to shareholders – 580 110,312 110,892 560 111,452Dividend – – -27,072 -27,072 – -27,072equity-settled share-based instruments (iFrs 2) – – 460 460 – 460Warrant premiums paid – – 1,615 1,615 – 1,615new share issue through warrants 38 – 616 654 – 654Closing balance Dec 31, 2007 38,674 580 432,770 472,024 2,841 474,865
Equity relating to the parent company’s shareholders Retained Minority Total
KSEK Note 29 Share capital Reserves earnings Total interest equityopening balance Jan 1, 2008 38,674 580 432,770 472,024 2,841 474,865Cash flow hedge reserve – -9,467 – -9,467 – -9,467 Conversions difference – – 21,665 21,665 720 22,385Total changes in equity, excl. distributions to shareholders – -9,467 21,665 12,198 720 12,918profit for the year – – 96,254 96,254 63 96,317Total changes in equity, excl. distributions to shareholders – -9,467 117,919 108,452 783 109,235Dividend – – -42,541 -42,541 – -42,541equity-settled share-based instruments (iFrs 2) – – 294 294 – 294Closing balance Dec 31, 2008 38,674 -8,887 508,442 538,229 3,624 541,853
Consolidated cash flow statements
KSEK 1 January-31 December Note 2008 2007Operating activities operating profit 130,258 160,540Depreciation 36,123 39,515other items not affecting cash flow 37 18,697 -7,948interest received 5,326 4,085interest paid -6,639 -9,072income tax paid -37,155 -38,969Cash flow from operating activities before changes in working capital 146,610 148,151 Cash flow from changes in working capital increase (-)/Decrease (+) in inventories -27,408 -10,676increase (-)/Decrease (+) in operating assets 38,866 3,545increase (-)/Decrease (+) in operating liabilities -3,650 -3,337Net cash flow from operating activities 154,418 137,683 Investing activities investments in property, plant and machinery -27,652 -32,526sale of property 4,247 3,585investments in intangible assets -1,116 -7,145acquisitions of subsidiaries, net effect on liquidity -652 -36,550Change in other financial assets 1,045 5,061Net cash flow from investing activities -24,128 -67,575 Financing activities new share issue, warrant premiums – 2,268Borrowing 2,688 82,662repayment of debt -49,653 -114,483Dividend paid to parent company’s shareholders -42,541 -27,072Net cash flow from financing activities -89,506 -56,625 Net cash flow for the year 40,784 13,483Cash and cash equivalents at beginning of the year 177,079 163,244Foreign exchange differences 2,910 352Cash and cash equivalents at end of the year 220,773 177,079
Gro
upH
L D
ispla
y annual r
eport
20
08
38

39HL DispLay ÅrsreDovisning 2007
parent Company
Parent Company’s income statements
KSEK, 1 January-31 December Note 2008 2007net sales 3, 4 101,254 100,505Cost of services sold -99,843 -96,528Gross profit 1,411 3,977 selling expenses -2,385 -5,964administrative expenses 39 -21,774 -13,035research and development expenses -15,875 -15,105other operating income 6 1,553 6,059other operating expenses 7 – -185Operating loss 8, 9 -37,070 -24,253 Financial income and expenses: income from participations in group companies 11 153,400 128,733income from other securities and receivables that are non-current assets 11 7,882 3,457other interest income and financial income 11 58 394interest and other financial expenses 12 -247 -954Profit before appropriations and taxes 124,023 107,377 appropriations 13 -12,386 -9,848Profit before taxes 111,637 97,529 income tax expense 14 -19 515 -19,142Net profit for the year 92,122 78,387
Par
ent
Com
pany
HL
Dis
pla
y annual r
eport
20
08
39

HL DispLay ÅrsreDovisning 2007 40
Parent Company’s balance sheets
KSEK, December 31 Note 2008 2007Assets Non-current assets intangible assets 18 7,562 10,026property, plant and equipment 19 3,055 321Financial assets participations in group companies 20 80,443 81,528 participations in associated companies and joint ventures 21 12,147 12,147other non-current receivables 22 – 644Total financial assets 92,590 94,319Total non-current assets 103,207 104,666 Current assets Current receivables receivables from group companies 23 367,560 326,532 prepaid expenses and accrued income 26 5,665 8,244 other current assets 27 7,153 5,952Total current assets 380,378 340,728 Cash and cash equivalents 10,048 2,089Total current assets 390,426 342,817Total assets 493,633 447,483 Equity and liabilities Equity 29 Restricted equity share capital (3,652,096 shares class a and 27,286,992 shares class B) 38,674 38,674 statutory reserve 8,010 8,010Unrestricted equity retained earnings 235,678 202,457 net profit for the year 92,122 78,387Total equity 374,484 327,528 Untaxed reserves 30 52,138 39,752 Current liabilities Trade and other payables 7,013 14,011 Liabilities to group and associated companies, joint ventures 34 14,900 32,545 Tax liabilities 7,596 5,531 other current liabilities 18,100 17,053 accrued expenses and prepaid income 35 19,402 11,063Total current liabilities 67,011 80,203Total equity and liabilities 493,633 447,483 Pledged assets and contingent liabilities for the Parent Company KSEK, as at 31 December Note 2008 2007Contingent liabilities 36 213,518 150,325
Par
ent
Com
pany
HL
Dis
pla
y annual r
eport
20
08
40

41HL DispLay ÅrsreDovisning 2007
Statement of changes in the Parent Company’s equity
Restricted equity Unrestricted equity Share Statutory Retained Profit/loss TotalKSEK Note 29 capital reserve earnings for the year equity opening balance Jan 1, 2007 38,636 8,010 238,029 – 284,675group contributions paid – – -11,191 – -11,191Total changes posted directly to equity – – -11 191 – -11 191profit for the year – – – 78,387 78,387Total changes in equity, excl. distributions to shareholders – – -11 191 78,387 67 196equity-settled share-based instruments (iFrs 2) – – 460 – 460new share issue through warrants 38 – 616 – 654Warrant premiums paid – – 1,615 – 1,615Dividend – – -27,072 – -27,072Closing balance Dec 31, 2007 38,674 8,010 202,457 78,387 327,528
Restricted equity Unrestricted equity Share Statutory Retained Profit/loss TotalKSEK Note 29 capital reserve earnings for the year equity opening balance Jan 1, 2008 38,674 8,010 280,844 – 327,528group contributions paid – – -2,919 – -2,919Total changes posted directly to equity – – -2,919 – -2,919profit for the year – – - 92,122 92,122Total changes in equity, excl. distributions to shareholders – – -2,919 92,122 89,203equity-settled share-based instruments (iFrs 2) – – 294 – 294Dividend – – -42,541 – -42,541Closing balance Dec 31, 2008 38,674 8,010 235,678 92,122 374,484
Parent Company’s cash flow statements
KSEK, 1 January-31 December Note 2008 2007Operating activities operating loss -37,070 -24,253Depreciation 3,014 1,757other items not affecting cash flow 37 6,771 1,651interest received 6,968 3,983Dividends received and group contribution 155,859 112,228interest paid -248 -551income tax paid -15,217 -15,013Cash flows from operating activities before change in working capital 120,077 79,802 Cash flow from changes in working capital increase (-)/Decrease (+) in operating assets -37,962 -58,819increase (+)/Decrease (-) in operating liabilities -13,626 -29,139Net cash flow from operating activities 68,489 -8,156 Investing activities investments in property, plant and equipment -3,011 –investments in intangible assets -273 -6,580investments in subsidiaries -4,159 -29,767sale of shares and participations 644 5,000Net cash flow from investing activities -6,799 -31,347 Financing activities new share issue, warrant premiums – 653Dividend paid -42,541 -27,072group contributions paid -11,190 -8,598Net cash flow from financing activities -53,731 -35,017 Net cash flow for the year 7,959 -74,520Cash and cash equivalents at beginning of the year 2,089 76,609Cash and cash equivalents at end of the year 10,048 2,089
Par
ent
Com
pany
HL
Dis
pla
y annual r
eport
20
08
41

HL DispLay ÅrsreDovisning 2007 42
notes
Note 1 Significant accounting principles
Compliance with standards and lawsThe consolidated financial statements have been produced in accordance with the international Financial reporting standards (iFrs) issued by the international accounting standards Board (iasB) and interpretations announced by the international Financial reporting interpretations Committee (iFriC), as approved by the eU. Furthermore the swedish Financial reporting Board’s recommendation rFr 1.1, supplementary accounting rules for groups, have been applied. The group accounting policy stated below has been consistently applied to all periods presented in group financial reports unless otherwise stated.
The parent company applies the same accounting principles as the group expect in the cases specified below in the section entitled “The parent company’s accounting principles”. The annual accounts and consolidated financial statements were approved for publication by the Board on 16 February 2009. The consolidated income statement and balance sheet, and the parent company’s income statement and balance sheet will be presented for adoption at the annual meeting of shareholders on 2 april 2009.
Conditions for drawing up the parent company’s and the Group’s financial statementsThe parent company’s functional currency is swedish kronor. This means that the financial statements are presented in the reporting currency (swedish kronor) rounded to the nearest thousand. assets and liabilities are reported at historical cost, except certain financial assets and liabilities, which are reported at their fair value.
producing the financial statements in accordance with iFrs requires company management to perform evaluations and estimates, and to make assumptions that affect the application of the accounting principles and reported amounts for assets, liabilities, income and expenses. The estimates and assumptions are based on historical experience and a number of other factors that are considered reasonable in the prevailing circumstances. The actual result may deviate from these estimates and evaluations.
The estimates and assumptions are reviewed regularly. Changes from estimates are reported in the period when the change is made and, where applicable, in future periods.
Critical estimates and evaluations by company management in the application of iFrs are described in greater detail in note 41. The accounting principles described below for the group have been applied consistently to all periods presented in the group’s financial statements, unless specified otherwise below. The group’s accounting principles have been applied consistently when consolidating the parent company, subsidiaries, associated companies and joint ventures.
Changes in accounting principlesThe following new standards and interpretations have been applied during the preparation of the financial statements for 2008:
iFriC 11 iFrs 2 – share-based payment, iFriC 12 service Concession arrangements and iFriC 14 ias 19 – The Limit on a Defined Benefit asset has been introduced without any effects on the group’s financial statements.
New IFRS and interpretations that have not yet been appliedThe following new or changed standards will be applied in the financial year starting on July 1, 2009 or later, assuming that they have first been approved by the eU. none of these have been applied in advance for HL Display’s financial statements for 2008.
iFrs 8 operating segments which specifies what an operating segment is and which information should be issued on them in the financial statements, and also changes in ias 1 presentation of Financial statements, will result in some changes in the presentation of the financial statements and that new
designations for the statements are proposed. The changes do not affect the amounts that are reported.
Changes in iFrs 2 share-based payment which among other things clarified which conditions constitute “earning conditions”, changes in ias 27 Consolidated Financial statements in the section Cost of an investment in a subsidiary, which affects reporting of dividends received from subsidiaries, a revised iFrs 3 Business Combinations and related changes in ias 27 Consolidated Financial statements, and iFriC 16 Hedges of a net investment in a Foreign operation may come to influence reported amounts in the event that these circumstances exist or occur in future.
Changes in ias 32 Financial instruments: presentation, ias 39 Financial instruments: recognition and Measurement, iFriC 13 Customer Loyalty programmes, iFriC 15 agreements for the Construction of real estate and iFriC 17 Distributions of non-cash assets to owners do not affect HL Display’s operations or strategy.
Segment reportinga segment is a part of the group that is identifiable in accounting terms and that either supplies goods or services (lines of business), or products or services within a specific economic environment (geographical area), which are exposed to risks and opportunities that are different from other segments. in accordance with ias 14 segment reporting, segment informa-tion is only reported for the group.
HL Display is a distinct niche company with production and sales of a homogenous product range. The products have varying functions, but are designed for the same areas of application (in-store communication and merchandising). The company’s opportunities and risks are on a global market, where the crucial factor for success is to be a supplier to the leading multinational and national retail chains and brand manufacturers (the company’s key accounts). HL Display achieves this by means of global key account management, by being a leader in cost-efficient production, logistics and sales, by being innovative in product development and design, and by offering a broad range of products. HL Display is therefore active solely within one line of business, which is why the primary segment for reporting is the same as reporting for the company as a whole. The geographical regions are reported as secondary segments, see note 4.
Classificationnon-current assets and non-current liabilities essentially consist of amounts that are expected to be recovered or paid after more than twelve months from the balance sheet date. Current assets and current liabilities essentially consist of amounts that are expected to be recovered or paid within twelve months from the balance sheet date.
Consolidation principlesSubsidiariessubsidiaries are companies that are subject to a deciding influence from HL Display aB. a deciding influence means directly or indirectly a right to define a company’s financial and operational strategies with the aim of achieving financial benefits. When assessing whether there is a deciding influence, consideration is given to shares that potentially provide entitlement to vote and that can be used or converted without delay.
subsidiaries are consolidated using the purchase method. This method means that the acquisition of a subsidiary is treated as a transaction in which the group indirectly acquires the subsidiary’s assets and takes on its liabilities. The group acquisition cost is defined by means of an acquisition analysis in connection with the business acquisition. The analysis defines the acquisition cost and the fair value of acquired, identifiable assets and debts and contingent liabilities taken on. a positive difference constitutes group goodwill. a negative difference is reported directly in net income.
subsidiaries’ are consolidated from the date when deciding influence starts until the date it ceases.
Not
esH
L D
ispla
y annual r
eport
20
08
42

43HL DispLay ÅrsreDovisning 2007
Associated companies and joint venturesassociated companies are companies that are not subsidiaries, but where HL Display aB holds, either directly or indirectly, more than 20 per cent of the votes or by some other means has a significant influence on operational and financial control. participations in associated companies are reported in the consolidated financial statements according to the equity method. Joint ventures where HL Display controls more than 50 per cent of the number of votes and holds a deciding influence are consolidated as subsidiaries. Joint ventures where HL Display through partnership agreements with one or more parties, holds a joint, deciding influence over operational and financial control, are consolidated using the proportionate method. The proportionate method means that HL Display’s share of the joint venture companies’ income, expenses, assets and liabilities, is reported on an item by item basis.
Transactions that are eliminated during consolidationinternal group receivables, payables, income and expenses, and unrealised profits/losses arising from transactions between group companies are eliminated in full when the consolidated financial statements are prepared.
Unrealised profits resulting from transactions with associated companies and jointly controlled companies are eliminated to the extent that they correspond to the group’s shareholding in the company. Unrealised losses are eliminated in the same way as unrealised profits, but only to the extent that there is no indication of any impairment losses.
Foreign currencyTransactions in foreign currencyTransactions in foreign currencies are converted to the functional currency at the exchange rate prevailing on the transaction date. Monetary assets and liabilities in foreign currencies are converted to the functional currency at the exchange rate prevailing at the year-end. exchange rate differences that arise from these conversions are reported in the income statement. non-monetary assets and liabilities that are reported at the historical cost are converted at the exchange rate on the transaction date.
Translation of foreign currency financial statementsassets and liabilities in foreign operations, including goodwill and other group surplus and deficit values, are recalculated from the functional currency- of the foreign operations to the group reporting currency, seK (swedish kronor), at the exchange rate prevailing on reporting date. revenues and expenses – in foreign operations are recalculated to seK at an average exchange rate that forms an approximation of the currency exchange rates occurring at each transaction point in time. Translation differences that occur when recalculating currency for foreign operations are reported directly to equity as a translation reserve.
RevenueThe group’s net turnover consists almost exclusively of sale of products. revenues from sale of products are reported in the income statement when extensive risks and benefits that are connected to the ownership of the products have been transferred to the purchaser. revenues from sale of services are reported in the income statement based on the degree of completion of the assignment on the reporting date. The degree of completion is established by calculating the relationship between value delivered and total value of order. revenues are not reported if it is probable that financial advantage will not accrue to the group. sales are reported net after vaT and discounts.
Operating expenses and financial income and expensesOperational leasesCosts in respect of operational leases are reported in the income statement on a linear basis over the leasing term. Benefits received in connection with the signing of an agreement are reported in the income statement on a linear basis over the leasing term.
Financial leasesThe minimum charges are divided between interest expense and repayment of debt. The interest expense is reported over the leasing period so that each accounting period is charged with an amount corresponding to a fixed interest rate for the debt reported during each period. variable charges are reported as expenses in the periods in which they occur.
Financial income and expensesFinancial income and expenses consist of interest income from bank funds, receivables and interest-bearing securities, interest expenses of loans, dividend income, exchange rate differences, unrealised and realised profits from financial investments and derivatives. interest income from receivables and interest expenses from debts are calculated using the effective interest method. The effective interest is the interest that means that the current value of all future payments received and made during the fixed-rate interest term are equal to the reported value of the receivables or debt. Dividend income is reported when the right to receive payment is confirmed.
The group do not capitalise interest on the purchase value of assets as would be possible in some cases according to ias 23.
Income tax expensesincome tax expenses comprise both current and deferred tax expenses. income tax expenses are reported in the income statement, except when an underlying transaction is reported directly to equity, in which case the tax effect is also taken to equity.
Current tax is tax that must be paid or received in respect of the current year, applying the tax rates that have been adopted or effectively adopted as at the year-end, including adjustment of current tax relating to previous periods.
Deferred tax is calculated on the basis of temporary differences between reported and tax values of assets and liabilities. Temporary differences are not taken into account for difference that has occurred on neither first reporting of goodwill nor first reporting of assets and liabilities other than acquisitions where the transaction do not effect either the reported, or the taxable profit/loss, nor is consideration given to temporary differences relating to participations in subsidiaries and associated companies. The valuation of deferred tax is based on how reported values of assets or liabilities are expected to be realised or regulated. Deferred tax is calculated by applying the tax rates and tax rules that have been adopted or effectively adopted as at the year-end.
Deferred tax assets relating to deductible temporary differences and tax loss carryforwards are only reported to the extent it is probable that it will be possible to utilise these. The value of deferred tax assets is reduced when it is no longer considered probable that they can be utilised.
any additional income tax that arises from a dividend is reported at the same time as the dividend is reported as a liability.
Financial instrumentsFinancial instruments reported in the balance sheet include on the assets side cash and cash equivalents, loans receivables, trade receivables and derivatives. Liabilities include trade payables, loan debts and derivatives.
Reporting in and removal from the balance sheeta financial asset or financial liability is reported to the balance sheet when the company becomes a party in accordance with the contractual terms of the instrument. Trade receivables are included in the balance sheet when an invoice has been issued. Liabilities are included when the counterparty has delivered and there is a contractual obligation to pay, even if an invoice has not yet been received. Trade payables are included when an invoice has been received.
a financial asset is removed from the balance sheet when the rights in the agreement have been realised, fall due, or the company loses control over them. The same applies for part of a financial asset. a financial liability is removed from the balance sheet when the obligation in the agreement is honoured or redeemed in any other way. The same applies for part of a financial liability.
a financial asset and a financial liability are offset and the net amount is reported in the balance sheet only if there is a legal right to offset this amount, plus that the intention is to regulate the items at the same time or with a net amount.
The acquisition or divestment of financial assets is reported on the date when the company undertakes to acquire or dispose of the asset.
Classification and valuationa financial instrument is classified at acquisition point depending on the intention of the acquisition. Classification determines how the financial instru-ment is valued after the first accounting occasion which is described below.
Not
esH
L D
ispla
y annual r
eport
20
08
43

HL DispLay ÅrsreDovisning 2007 44
Valuation on first accounting occasionFinancial instruments that are not derivatives are initially reported using the acquisition value, the equivalent of the instrument’s fair value with addition for transaction costs for all financial instruments, except the category that is reported at its fair value via the income statement. These are reported exclusive of transaction costs. The derivative instrument is initially reported at real value meaning that transaction costs are included in the period’s profit/loss.
Cash and cash equivalents consist of cash and immediately available credit balances in banks and corresponding institutes, as well as short maturity investments with a duration from the acquisition date of less than three months that are only exposed to an insignificant risk of value fluctuations.
Valuation after initial reporting– Financial assets and debts valued at their fair value via the income statementThis category is divided into two sub-groups: financial assets/liabilities maintained for trading and other financial assets/liabilities that the company has initially chosen to place in this category according to the Fair value option. HL Display had no assets in this category in 2008 and 2007.
– Loans receivables and trade receivablesLoans receivables and trade receivables are financial assets that do not constitute derivatives with fixed payments or with payments that can be defined, and that are not quoted on an active market. assets in this category are valued at the accrued acquisition cost. The accrued acquisition cost is determined on the basis of the effective interest rate that was calculated on the acquisition date. Trade receivables are reported at the amount that is expected to be received after deductions for impairment losses. HL Display has no loan receivables.
– Investments held until maturityinvestments held until maturity are financial assets that includes securities with payments that are fixed, or that can be defined in advance, with a fixed term, and that the company has an explicit intention and ability to hold until maturity. assets in this category are valued at the accrued acquisition cost. HL Display had no assets in this category in 2008 and 2007.
– Financial assets that can be soldassets in this category are continuously valued at fair value with value changes reported in equity, e.g. cash flow hedge.
Derivatives and hedge accountingHL Display’s derivative instrument has been acquired in order to hedge the risks the group is exposed to due to currency exchange rate fluctuations. Derivative instruments can consist of items such as forward contracts, options and swaps. Derivatives can also include so called embedded derivatives, contractual terms that are embedded into other agreements. HL Display had no embedded derivatives in 2008 and 2007. Derivatives are initially reported at fair value, consequently transaction costs are debited to the period’s income. Then the derivative instruments are valued at fair value and value changes are reported in the manner described below.
profit and losses in respect of hedges are reported in the income statement on the same date as profit and losses are reported for the items hedged. To satisfy the requirements for hedge accounting in accordance with ias 39, there must be an unambiguous link to the hedged item. it is also a requirement that the hedge provides effective protection for the hedged item, that hedging documentation has been drawn up and that the effectiveness can be measured. in the event that the conditions for hedge accounting are no longer satisfied, the derivative instrument is reported at its fair value with the value change in the income statement.
Hedging of net monetary assets investments in foreign subsidiaries (net assets including goodwill) have, to a certain degree, been hedged via the raising of of loans in foreign currency. Hedge accounting is not applied as financial hedging is reflected in the accounting as both the underlying receivable or debt and the hedge instrument are reported at closing date currency exchange rate.
Transaction exposure – cash flow hedgingThe currency forward rates used to hedge future cash flows and forecast sales in foreign currencies are reported in the Balance sheet at fair value.
value changes are taken directly to equity in a hedge reserve until the hedged flow is reported in the income statement, at which point the cumulative value changes of the hedge hits the income statement, were they meet and match the income statement effects of the hedged transaction.
Property, plant and equipmentAssets ownedproperty, plant and equipment are reported as an asset in the balance sheet if it is probable that future financial benefits will accrue to the company and the acquisition cost of the asset can be calculated in a reliable way.
HL Display valuates property, plant and equipment according to the purchase method. property, plant and equipment are reported in the group at the acquisition cost after deductions for cumulative depreciation and possible impairment losses. The acquisition cost includes the purchase price and costs directly attributable to put the asset in place and in a fit state to be used.
The acquisition cost of fixed assets manufactured in-house includes expenses for material, for remuneration of employees plus other manufacturing overheads that may be considered to be attributable to this particular asset.
The reported value of property, plant and equipment is removed from the balance sheet when it is disposed or sold off, or when no future financial bene-fits are expected from use or disposal/sale of the asset. any profit/loss arising from the disposal or retirement of an asset comprises the difference between the sale price and the asset’s reported value with a deduction for direct sales costs. such profit/loss is reported as other operating income/expense.
Leased assetsias 17 is applied for leased assets. Leasing is classified in the consolidated financial statements as either financial or operational leasing. Financial leasing means that the financial risks and benefits associated with ownership are essentially transferred to the lessee; if not, it is a case of operational leasing.
assets that are hired under financial lease agreements have been reported as assets in the consolidated balance sheet. The obligation to pay future leasing charges has been reported as non-current and current liabilities. The leased assets are depreciated according to plan, while lease payments are reported as interest and repayment of debts. operational leasing means that the leasing charge is reported as an expense on a linear basis over the term of the agreement, based on utilisation.
Additional expensesadditional expenses are added to the acquisition cost if it is probable that future financial benefits associated with the asset will accrue to the company and the acquisition cost can be calculated reliably. other additional expenses are reported as a cost in the period when they are incurred.
if the expense relates to the replacement of identified components, or parts thereof, or if a new component has been added, the expense is added to the acquisition cost. any non-depreciated, reported values of replaced components are retired and reported as expenses. repair expenditures are expensed as they occur.
Depreciation principlesDepreciation takes place over the asset’s estimated useful life. There is no depreciation of land. Leased assets are also written off over their estimated lifetime, or if shorter, over the agreed leasing period. The group applies component depreciation. For property, plant and equipment that consist of parts with different utilisation periods, are the estimated useful lives the basis for depreciation.
estimated useful lives:– internal and external surface of business properties 27-40 years– fixed installations, business properties 12-50 years– plant and machinery 5-12 years– equipment, tools, fixtures and fittings 3-7 years– rebuilding of other party’s property 20 years
There is an annual review of depreciation methods and of each asset’s residual value and useful life.
Intangible assetsGoodwillgoodwill represents the difference between the acquisition cost for the business acquisition and the fair value of acquired identifiable assets, assumed debts and contingent liabilities.
Not
esH
L D
ispla
y annual r
eport
20
08
44

45HL DispLay ÅrsreDovisning 2007
Other intangible assets Computer systems and market based assets acquired by the group are reported at acquisition value minus accumulated amortizations (please see below) and impairments (please refer to the section entitled impairment). acquisition value of computer systems constructed or adapted in-house include licenses, costs for remuneration to employees plus consultancy costs that can be considered to be directly connected to the computer system. acquisition value of acquired, market based assets concerns customer agreements and value of customer relationships.
Amortization principlesamortization is reported in the income statement on a linear basis over the estimated useful life of assets, unless such useful life is undefined. goodwill and intangible assets with an undefined useful life are reviewed to ascertain any need for impairment on an annual basis or as soon as there is an indication that the asset in question has been impaired. other intangible assets are amortized from the date on which they become available for use.
The useful life is:– computer systems 4 years– acquired market assets 5 years
Research and developmentexpenditures for development, where the results are used to achieve new or improved products or processes, are capitalised and recognized as an asset in the balance sheet if the product or process is technically and commercially viable and the company has sufficient resources to complete the develop-ment and then use or sell the intangible asset. The reported value includes all directly attributable expenses such as costs of materials and services, salaries and wages and other indirect costs that can be attributed to the asset in a reasonable, consistent way. other development expenditures are reported in the income statement as research and development expenses as they are incurred. in HL Display’s balance sheet capitalised development expenses are reported at acquisition cost minus cumulative depreciation and any impairment losses as tangible non-current assets. The reason is that once a decision has been made on commercial production, product development work essentially consists of designing the production equipment required to manufacture the product.
Inventoriesinventories are valued at the lower of the acquisition cost and the net realisable value. The acquisition cost is calculated as weighted average prices using the first in, first out principle (FiFo) and includes costs incurred in the acquisition and transport to the current location and status. For products manufactured in-house and work in progress the acquisition cost is including a reasonable proportion of indirect manufacturing costs based on normal capacity.
The net realisable value is the estimated sale price in current operations, with a deduction for estimated costs of production and to achieve a sale.
Impairments, recoverable amounts and reversalsThe carrying amounts of the assets are tested at each balance sheet date to assess whether there is any indication of impairment losses.
if there is such an indication, the asset’s recoverable amount is calculated as the higher of fair value less costs to sell and value in use. The value in use is calculated by discounting estimated future cash flows at a discount factor taking the risk-free interest and the risk relating to the specific asset into account.
an asset that is dependent on other assets is attributed to the smallest cashgenerating unit for which independent cash flows can be identified. There is an impairment loss that affects the income statement if the recoverable amount is less than the carrying amount.
if there is a change in the calculations used to determine the recoverable amount, the impairment loss is reversed. However, impairment losses of goodwill are never reversed.
an impairment loss is only reversed if the asset’s reported value after recovery does not exceed the assets value before impairment less any depreciation that would have been performed.
Impairment test of financial assetson each reporting occasion, the company evaluates if there are objective evi-dence that a financial asset needs to be written down in accordance with ias 39.
The recoverable amount of assets belonging to the categories investments
to be held until maturity and loans receivables and trade receivables which are reported to accrued acquisition value are calculated as current value of future cash flow discounted by the effective annual interest rate that applied when the asset was first reported. assets with a brief duration are not discounted. impairment is reported in the income statement.
impairments of investments that are held until maturity or loan and trade receivables that are carried at accrued cost are reversed if a subsequent increase in recoverable amount can be objectively assigned to an event that has occurred after the impairment was performed.
Share capitalDividend is reported as a liability in the parent company once the annual general Meeting of shareholders has approved the proposed dividend.
Earnings per shareCalculation of the earnings per share is based on this year’s profit in the group that is attributable to the parent company’s shareholders and to the weighted average number of shares outstanding during the year. When calculating the earnings per share after dilution, the profit/loss and the average number of shares are adjusted in order to take into consideration the effects of diluted, potential ordinary shares which have arisen from employee stock option programmes.
Employee benefitsDefined contribution pension plansThe following is classified as a defined contribution pension plan: where the size of the employee’s pension is dependent on the fee the company pays to the plan and the capital yield that these fees generate. The employee bears the actuarial risk (i.e. that pension payments will be lower than expected) and the investment risk (i.e. that the invested assets will not be sufficient to provide the expected pension payments). The company’s commitments concerning fees into defined contribution plans are reported as costs in the income statement as they are earned by employees through length of employment period.
Defined benefit pension plansHL Display has defined benefit pension plans for employees in norway, austria, switzerland and France. The group’s net obligation with regard to these plans is calculated separately for each plan by means of an estimate of the future benefits that employees have earned through their employment during both the current period and previous periods; these benefits are discounted to a net present value, and the fair value of any managed assets is deducted. The discount rate is the market rate for government bonds with a corresponding term. The calculation is performed by a qualified actuary using the projected Unit Credit Method.
The Corridor rule will be applied. Consequently, any part of actuarial profits and losses in excess of 10 per cent of the largest commitment’s current value and the plan assets’ fair value is reported over the income statement over the average remaining service period of those covered by the plan. apart from this, actuarial profits/losses are not recognized.
When the calculation leads to an asset for the group, the reported value of the asset is limited to the net result of unreported actuarial losses and unreported costs of employment during earlier periods and the current value of future repayments from the plan or reduced future payments into the plan.
When the benefits in a plan are improved, the proportion of increased ben-efits relating to the employees’ employment during earlier periods is reported as an expense to the income statement on a linear basis, allocated over the average period until the benefits have been earned in full. if the benefits have been earned in full, an expense is reported directly in the income statement.
Severance payCosts for severance pay are reported only if the company is demonstratively obliged, without realistic opportunities to withdraw, by a formal detailed plan to terminate employment before the normal point in time.
Short-term benefitsshort-term benefits to employees are calculated without discounting and reported as a cost when the related services are received.
provisions are reported for anticipated costs for profit sharing and bonus payments when the group has entered into a valid legal or informal under-taking to make such payments as a result of services provided by employees, and it is possible to calculate the extent of the financial undertaking in a reliable fashion.
Not
esH
L D
ispla
y annual r
eport
20
08
45

HL DispLay ÅrsreDovisning 2007 46
Share-based benefitsan employee stock options programme enables employees to acquire shares in the company. The fair value of the allocated options is reported as costs for personnel with an equivalent increase of equity. The fair value is calculated at the point in time when the allocation is made and spread over the vesting period. The fair value of the allocated options is calculated using the Black & scholes formula and the conditions and prerequisites that applied at the point of allocation are taken into consideration. The expense that is reported is the equivalent of the fair value of an estimate of the number of options that are expected to be subscribed. This expense is adjusted in the following periods in order to reflect the actual amount of options earned. However adjustment is not made when a decrease is only caused by the fact that the share price does not achieve the required level for the options to be cashed in.
social costs relating to the employee stock options are written off over the accounting periods during which the services are provided. provisions for social insurance charges are based on the fair value of the options at the reporting date. The fair value is calculated using the same formula as that used when the options were issued.
Provisionsa provision is reported in the balance sheet when the group has a legal or informal obligation as a consequence of a past event, and it is probable that an outflow of financial resources will be required to regulate the obligation, and a reliable estimate of the amount can be made.
Restructuringa provision for restructuring is reported when the group has established and approved a formal restructuring plan, and the restructuring has either commenced or been publicly announced. no provision is made for future operating costs.
Onerus contracta provision for a loss-making contract is reported when the benefits that the group expects to receive from a contract are lower than the unavoidable costs of fulfilling the obligations under the contract.
Non-current assets held for sale and discontinued operationsThe reason why a non-current asset (or a divestment group) is classified as a holding for sale is that its reported value will be recovered primarily through the sale and not through utilisation.
a discontinued operation is a part of a company’s business that represents an independent line of business or a significant business within a geographical region, or is a subsidiary that has been acquired for the sole purpose of being resold.
Contingent liabilitiesa contingent liability is reported when there is a possible commitment originating from a past event but the outflow of resources is contingent on one or more uncertain future events or, when there is a commitment that is not reported as a liability or provision because it is not probable that an outflow or resources will occur.
Events after the balance sheet dateinformation shall be provided concerning significant events that have occurred after the balance sheet date, but prior to the point in time when the financial statements are signed, and that are not of the nature that they will affect the balance sheets and income statements. if significant events have occurred, information will be provided in the Directors’ report or in a separate note.
The parent company’s accounting principlesThe parent company has produced its annual accounts in accordance with the swedish annual accounts act (1995:1554) and the swedish Financial reporting Board’s recommendation rFr 2.1 accounting for Legal entities. in addition statements concerning listed companies issued by the swedish Financial reporting Board have been applied. Under rFr 2.1 the parent company must apply all of the eU-approved iFrs and statements as far as is possible within the framework of the swedish annual accounts act, the law on safeguarding of pension commitments, and with due regard to the relationship between accounting and taxation in the annual accounts for the legal entity. This recommendation specifies which exceptions and additions must be applied with regard to iFrs.
The accounting principles described below for the parent company have been applied consistently for all periods presented in the parent company’s financial statements.
Financial guaranteesThe parent company’s financial guarantee agreement consists of sureties for the benefit of subsidiaries and joint ventures. Financial guarantees mean that a company undertakes to reimburse the owner of a debt instrument for losses this owner may have incurred due to the fact that a stated debtor has not fulfilled payment when due according to contractual agreement. For the reporting of financial guarantee agreements the parent company applies one of the exceptions to regulations permitted by swedish Financial accounting standards Council as compared to regulations in ias 39. This exception concerns the financial guarantee agreement established for the benefit of subsidiaries, joint ventures and associated companies. The parent company reports financial guarantee agreements as provisions for warrantees in the Balance sheet when the company has an undertaking for which payment will probably be required in order to regulate this undertaking.
Group contributions and shareholders’ contributionsHL Display is reporting group contributions and shareholders’ contributions in accordance with the statement issued by the the swedish Financial reporting Board (UFr 2). shareholders’ contributions are reported directly to equity at the recipient and are capitalised as shares and participations by the donor, if no impairment loss prevails.
group contributions are reported according to their financial nature. This means that group contributions issued for the purpose of reducing the group’s total tax expense are reported directly to retained profits, with a deduc-tion for the current tax effect. group contributions that are in substance a divi-dend are reported as a dividend. in this case group contributions received, and their current tax effect, are reported in the income statement and that group contribution issued, and its current tax effect, affects retained profits. a group contribution that is in substance a shareholder contribution is reported, with due consideration of the current tax effect for the recipient, directly to retained profits. The donor reports the group contribution and its current tax effect as an investment in interests in group companies, if no impairment loss prevails.
Leased assetsin the parent company, all leasing agreements are reported according to regulations for operational leasing.
Income tax expensesin the parent company, untaxed reserves plus deferred tax debt are reported. in group accounts, however, untaxed reserves are divided between deferred tax debts and equity.
Note 2 Financial Risks and Financial Policies
The group is exposed to various types of financial risks in its business. Financial risks mean fluctuations in the company’s profits and cash flows as a result of changes in exchange rates or interest rate levels as well as re financing risks and credit risks. HL Display’s financing and financial risks are managed under the control and auspices of the Board. Financing activi-ties are centralised within the subsidiary HL Financial services aB, which acts as an internal bank, with responsibility for financing and managing financial risks. HL Financial services aB’s ultimate objective is to provide cost-efficient financing and to minimise negative effects on the group’s results caused by market fluctuations.
Liquidity risksa liquidity risk means a risk that financing cannot be obtained at all, or only at a significantly increased cost. it is HL Display’s policy to only invest its liquid funds in banks or bank-related institutions. The instruments in which the funds are invested must, if they are not simple cash deposits, be fully liquid so that there is no risk in terms of time or value.
a group wide cash pool for seK, eUr and gBp, gives HL Financial services good control over the group’s liquidity. The credit rating institute soliditet has rated the parent company’s creditworthiness as aaa.
Not
esH
L D
ispla
y annual r
eport
20
08
46

47HL DispLay ÅrsreDovisning 2007
Maturity analysis for financial liabilities GroupKSEK 2008 2007Maturity: Within 1 year 117,173 138,446 1-5 years 61,780 1,424 5- years -– 83,267Total 178,953 223,137
Interest rate riskinterest rate risk is the risk that the value of a financial instrument varies due to changes in market interest rates. an interest rate risk can consist of a change in fair value, a price risk, or changes in cash flow, a cash flow risk. one significant factor that affects the interest rate risk is the fixed-rate interest term. Long fixed-rate interest terms primarily affect the price risk, while shorter fixed-rate interest terms affect the cash flow risk. The group’s interest-bearing liabilities are almost exclusively subject to variable interest rates. HL Display’s policy is to not use interest rate derivatives. The interest rate risk in HL Display is low, as there is a high degree of self-financing. The equity/assets ratio was 57 per cent at the year-end, and the interest-bearing net receivable was MseK 120 (49). net interest expense amounted to MseK -1 (-6). The company’s interest-bearing liabilities at the year-end totalled MseK 100 (128),of which long-term liabilities totalled MseK 62 (84). The average effective interest rate on interest-bearing long-term liabilities was 3.8 per cent and on short-term liabilities 3.1 per cent.
Credit riskThe credit risk within HL Display arises almost exclusively on trade receivables. HL Display experiences a very low level of bad debt losses. The majority of the company’s customers are large, well-established companies that are financially sound and distributed over several geographical markets. The biggest single customer accounts for five per cent of turnover. Most orders are low in value. HL Display controls the risk of bad debts through well defined routines for credit control, debt collection and invoicing of interest on overdue payments. refer to note 25 Trade receivables.
isDa’s (international swaps and Derivatives association) Master agreement is used to settle counterparty risk regarding transactions in derivatives.
Currency risksTransaction exposureHL Display’s transaction exposure relates to purchases and sales in foreign currencies. The policy is to invoice every subsidiary in their local currency. in the event that a country’s currency is not convertible, the subsidiary is invoiced in seK. external distributors are always invoiced in seK and no transaction exposure arises as a result of that. The most important inflow currencies are the eUr, the gBp, the rUB, the noK and the sgD.
Market value of outstanding transaction hedges totalled MseK -8.9 as of 31 December 2008. Hedge accounting is applied and MseK -0.6 is posted to sales in the income statement. The change in the market value of out-standing transaction hedges during the year amounted to MseK -9.5 and is posted directly to equity.
The group’s transaction exposure is divided among the following currencies:
The Group’s net flow in local currencyGroup AmountKSEK 2008 2007eUr 130,210 128,768rUB 51,080 30,916gBp 44,975 61,579noK 44,737 48,637sgD 23,961 11,484
HL Display’s financial policy states that the group should hedge future net flows in foreign currencies that are of significant importance to HL Display. Currently these are euro, British pounds and singapore dollars. each quarter, the group carries out moving 12 month forecasts as a basis for estimating the size of the hedge. as stated in the financial policy, 50-75 per cent of the net flow should be hedged 12 months on and 75-90 per cent hedged 6 months on.
Group Forward Exchange Exchange Exchangecontracts MEUR rate MGBP rate MSGD rate2009 8.5 9.703 2.2 12.336 2.3 4.91
The exchange rate refers to the average contract exchange rate.
The forward contracts used to hedge forecast transactions are classified as cash flow hedges. Hedged cash flows are expected to be realised in the coming 12 months. The hedges were efficient during 2008.
Translation exposureMonetary net assets (equity in subsidiaries) in currencies other than the func-tional currency (seK) will fluctuate according to exchange rate fluctuations. This risk is known as translation exposure. exchange rate gains/losses that occur as a result of recalculation are reported to equity. Foreign monetary net assets in the group are divided primarily among the following currencies:
GroupCurrency AmountKSEK 2008 2007eUr 128,254 116,720gBp 22,647 -7,095rUB 18,185 34,858
To limit the groups’ exposure, the loans, when refinancing, are raised in currencies representing the major net assets, which provides a natural hedge.
Sensitivity analysisa general one per cent change in the market interest rate would mean that the group’s profit before taxes would change by approximately MseK 0.8. it has been calculated that a general o.1 change in the value of the seK against the euro would affect the group’s profit before taxes by approximately MseK 1.4 for 2008. For an explanation of the group’s sensitivity to other factors, see risk and sensitivity analysis on page 32.
Fair valueGroupon the balance sheet date there were financial instruments in the categories trade receivable, trade payable and other liabilities plus derivatives used for hedge accounting. in the item other current assets, group derivatives used for hedge accounting valued at fair value amounting to KseK 9,467, are accounted for. For other financial instruments there is no difference between reported and fair value.
Interest-bearing liabilities as all interest-bearing liabilities have variable interest rates, the carrying amount is considered to reflect the fair value.
Trade receivables and payablesFor trade receivables and payables with an outstanding term of less than one year, the carrying amount is considered to reflect the fair value. There are no trade receivables or payables with a term of more than one year.
Cash flow hedgesCurrency derivatives that are cash flow hedges are valued at fair value.
Parent CompanyThe parent company has no financial instruments at all with a valuation that deviates from their fair value.
Note 3 Distribution of income Income per each significant type of income Group Parent CompanyKSEK 2008 2007 2008 2007net sales product sales 1,500,878 1,519,858 – –installations and other services 34,761 51,323 101,254 100,505Total sales 1,535,639 1,571,181 101,254 100,505 of the parent company’s net sales, KseK 100,958 (99,770) relates to consultancy services sold to group companies.
Not
esH
L D
ispla
y annual r
eport
20
08
47

HL DispLay ÅrsreDovisning 2007 48
Note 4 Segment Reporting HL Display applies ias 14 segment reporting. as a primary basis for segmentation HL Display uses one single, vertically integrated line of business, and as a secondary basis for segmentation it uses geographical markets. HL Display is a distinct niche company with production and sales of a homogenous product range. The products have varying functions, but are designed for the same areas of application (in-store communication and merchandising). The company’s opportunities and risks are on a global market, where the crucial factor for success is to be a supplier to the leading multinational and national retail chains and brand manufacturers (the company’s key accounts). HL Display achieves this by means of global key account management, by being a leader in cost-efficient production, logistics and sales, by being innovative in product development and design, and by offering a broad range of products. Lines of business The lines of business constitute the group’s primary segment. The group consists of one single, vertically integrated line of business.
see pages 36-37 for income statements and balance sheets. Geographical regions Group Western Europe Eastern Europe North America Asia/Australia Nordic region TotalKSEK 2008 2007 2008 2007 2008 2007 2008 2007 2008 2007 2008 2007external income 705,764 757,617 350,029 354,335 15,873 19,206 131,515 114,854 332,458 325,169 1,535,639 1,571,181assets 262,830 259,530 119,864 113,516 11,404 17,675 66,012 78,095 486,187 422,881 946,297 891,697investments 58 2,269 3,567 4,730 1,056 812 6,278 5,997 20,790 56,372 31,749 70,180 Parent Company Western Europe Eastern Europe North America Asia/Australia Nordic region TotalKSEK 2008 2007 2008 2007 2008 2007 2008 2007 2008 2007 2008 2007net sales 4,951 7,546 3,376 4,685 2 – 2,761 1,378 90,164 86,896 101,254 100,505
Note 5 Acquisition of operations
During the year a new subsidiary has been established in Bulgaria, HL Display Bulgaria eooD. HL Display Bulgaria has during the year acquired the opera-tions of the former distributor for HL Display products in Bulgaria. according to preliminary acquisition analyses, goodwill arising from the purchase of net assets as a result of the transaction amounts to MseK 0.3, and other acquired assets to MseK 0.4.
During 2008, the preliminary acquisition analyses concerning the 2007 acquisition of Display Team oy, has been finalized and adjusted for an agree-ment regarding additional purchase price, as well as adjusting the acquired company’s balance sheet to the group’s accounting policies. This has lead to an increase in reported goodwill by MseK 4.0.
Note 6 Other operating income
Group Parent CompanyKSEK 2008 2007 2008 2007exchange rate gains on receivables/liabilities of an operative nature 3,153 839 – –royalty income 428 1,295 428 1,224rental income 1,053 1,304 1,053 1,304Capital gain on sale of non-current assets 241 7,593 – 3,511government grants 72 20 72 20other 935 842 – –Total 5,882 11,893 1,553 6,059
Note 7 Other operating expenses Group Parent CompanyKSEK 2008 2007 2008 2007exchange rate losses on receivables/liabilities of an operative nature -6,848 -782 – –impairments/disposals non-current assets -227 -3,029 – -185Damages – -251 – –other -2,251 -1,941 – –Total -9,326 -6,003 – -185
Note 8 Employees, personnel expenses and remuneration to senior executives Expenses for employee benefits Group KSEK 2008 2007salaries and remuneration etc. 321,911 308,779pension costs defined benefit plans see note 32 2,035 1,405pension costs defined contribution plans 1) 15,379 14,142other social security contributions 77,622 96,490 416,947 420,8161) including premiums to alecta.
Geographical markets geographical regions constitute the group’s secondary segment. The group’s segments are divided into the following geographical regions: the nordic region, Western europe, eastern europe, asia/australia and north america. The business operations in the nordic region, Western europe, eastern europe and asia/australia are run primarily through the group’s own subsidiaries. in north america the business is run through a distributor. The information presented with regard to the segments’ income relates to the geographical regions, grouped according to where the customers are located. some adjustments have been made to the comparative figures in order to better reflect the distribution of income for 2007. information relating to the segments’ assets and investments during the period in non-current assets is based on the geographical regions, grouped according to where the assets are located.
Not
esH
L D
ispla
y annual r
eport
20
08
48

49HL DispLay ÅrsreDovisning 2007
Cont. Note 8 Employees, personnel expenses and remuneration to senior executives
Average number of which of whichof employees 2008 men 2007 menParent Company sweden 45 67% 43 72%Total for Parent Company 45 67% 43 72%
Subsidiaries nordic region 391 67% 412 70% Western europe 237 54% 241 55% eastern europe 143 47% 122 44%asia/australia 158 61% 140 62%north america 9 78% 10 74%Total in subsidiaries 938 61% 925 61%Group total 983 62% 968 62%
2008 2007 Proportion ProportionGender distribution in the executive management of women of womenParent Company The Board 13% 13% senior management 14% 13%Group total The Board 13% 13% senior management 15% 32%
Salaries, other remuneration and social security expenses
2008 2007 Salaries and Social Salaries and SocialKSEK remuneration security exp remuneration security expParent Company 38,403 13,215 29,995 16,775 (of which pension cost) 1) 5,080 4,742Subsidiaries 283,508 81,821 278,784 84,361(of which pension cost) 12,334 10,805 Group total 321,911 95,036 308,779 101,136 (of which pension cost) 2) 17,414 15,547
1) of the parent company’s pension costs KseK 2,292 (1,522) relates to senior executives. The company’s outstanding pension commitments to these people amount to KseK – (–). 2) of the group’s pension costs, KseK 3,531 (2,802) relates to senior executives. The company’s outstanding pension commitments to these people amount to KseK 62 (59). Salaries and other remuneration per country and senior executives etc and other employees 2008 2007 Senior Senior executives Other executives OtherKSEK etc employees etc employeesParent Company sweden 18,285 20,118 11,273 18,722(of which bonus, etc) 1,895 1,058 1,939 –Parent Company total 18,285 20,118 11,273 18,722 (of which bonus, etc) 1,895 1,058 1,939 –
social security expenses 6,292 6,923 6,305 10,470 Subsidiaries Nordic region 7,813 137,091 6,487 140,140(of which bonus, etc) 500 3,308 697 4,413Western Europe 8,471 75,350 8,255 81,137 (of which bonus, etc) 173 5,214 1,292 5,085 Eastern Europe 5,826 25,726 5,245 17,748 (of which bonus, etc) 938 2,360 604 2,100 Asia/Australia 2,688 17,074 1,647 14,655 (of which bonus, etc) 0 2,578 350 2,829 North America 416 3,054 416 3,054(of which bonus, etc) 37 214 37 214Subsidiaries, total 25,214 258,295 22,050 256,734(of which bonus, etc) 1,648 13,674 2,630 14,641Group total 43,499 278,413 33,323 275,456 (of which bonus, etc) 3,543 14,732 4,569 14,641
senior executives comprise the Board (7 people excl Ceo), the group management team (7 people), area Managers (5 people), and chief executives in the group companies (21 people). Total absence through illness as a percentage of normal working hours
Parent Company 2008 2007Men 0.9% 0.9% Women 2.6% 0.8%
age -29 2.3% 1.1% age 30-39 1.4% 1.0%age 50- 2.1% 0.5% Long-term absentees 0.9% 0.4%Total 1.6% 0.9% For information on employee benefits after the end of employment, see note 32 post-employment benefits. Share-based benefits HL Display (aB) has on four occasions (2001, 2002, 2003 and 2007), via its wholly owned subsidiary HL Financial services aB, issued debentures with separable options (warrants), which were sold to senior executives within the group. The purpose of offering warrants is to promote long-term commit-ment to the company and to encourage senior executives to become future shareholders in the company. The term of the warrants is approximately three years, which the Board wishes to be acknowledged as an aim to gain warrant holders’ long-term commitment to the company’s future. The options have been issued on commercial terms, defined in accordance with the Black & scholes model, and the purchase price was paid in cash. Fifty per cent of the purchase price paid is subsidised over a three-year period. Utilisation of sub-scription rights is not subject to continued employment. as allocations have been carried out according to market conditions and no benefit has been gained from these programmes on the balance sheet date, no accounting consequences according to iFrs 2 have arisen. on the balance sheet date only warrants issued during 2007 remained.
There was also an employee stock options programme issued in 2006 and aimed at the Ceo as part of his remuneration agreement when entering upon office. This programme is reported in accordance with iFrs 2.
Outstanding option schemes Year implemented 2007 2006 Totalnumber of options 256,000 300,000 556,000of which acquired 196,000 287,252 484,000proportion of share capital if fully subscribed 0.83 0.97 1.80proportion of votes if fully subscribed 0.40 0.47 0.87subscription price 56.50 39.25 subscription period 2010-03-01 2009-03-31 -2010-04-30 -2011-03-31
Remuneration to senior executivesat the 2008 agM the Board’s proposal for guidelines on remuneration to senior executives was adopted, see page 50.
PrinciplesThe Chairman of the Board and Board members are paid a fee in accordance with the decision of the annual meeting of shareholders. employees’ repre-sentatives and persons operative in the company do not receive a Board fee. remuneration to the Ceo and other senior executives consists of a basic salary, variable benefits (bonus), other benefits, and pension. remuneration to the Ceo also includes an employee stock options scheme as well as a partly subsidised warrant scheme. The other senior executives are the five people who, together with the Ceo and the former deputy Ceo, have constituted group management. For the composition of group management, see page 64.
Not
esH
L D
ispla
y annual r
eport
20
08
49

HL DispLay ÅrsreDovisning 2007 50
Cont. Note 8 Employees, personnel expenses and remuneration to senior executives
Remuneration and other benefits during the year Basic salary/ Flexible Other Pension FinancialKSEK Board fee benefits benefits expense instruments TotalThe Chairman of the Board, anders remius 250 250Jan-ove Hallgren 150 150stig Karlsson 175 175Mats-olof Ljungkvist 190 190Åke Modig 150 150anna ragén 150 150Lars-Åke rydh 150 150The Ceo, gérard Dubuy 3,282 676 83 328 294 4,663The former deputy Ceo, Kent Hertzell 1) 4,539 94 190 1,133 5,956other senior executives (5 people) 5,971 280 315 1,324 7,890Total (14 people) 15,007 1,050 588 2,785 294 19,724
1) including severance payment
Comments on the table other benefits include company car, allowances and subsidy of warrants. The Ceo, the deputy Ceo and other senior executives have defined contribution pension plans. The Ceo has previously had a defined benefit pension plan. The pension expense relates to the expense that affected the profit/loss for the year. For further information about pensions, see note 32. The Chairman of the Board has not received any remuneration other than the Board fee. Option schemes Schemes from previous years Employee stock options 2006/2011 Warrants 2007/2010 KSEK Quantity Quantity Acquisition price The Ceo, gérard Dubuy 287,252 80,000 8.25 The former deputy Ceo, Kent Hertzell – 80 000 8,25 other senior executives – 36,000 8.25Total 287,252 196,000
Pensions The retirement age for all senior executives is 65. Severance payment There is a mutual period of notice of 6 months in force between HL Display and the Ceo. if the company cancels the Ceo’s employment contract, severance pay to the equivalent of 24 monthly salaries will be paid. There is a mutual period of notice of 4-6 months in force between the company and other senior executives in the group.
Loans to senior executives There are no loans to senior executives.
Preparation and decision-making processremuneration to the Ceo and deputy Ceo for the financial year 2008 wasdecided by the Board after being prepared by the remuneration Committee.
remuneration to other senior executives has been decided by the Ceo in consultation with the remuneration Committee. The remuneration Committee has developed principles for decision on salary and other remuneration to senior executives in the group that were decided by the agM (see below). For information about the composition of the remuneration Committee, see page 64.
Guidelines for remuneration to senior management positionsThe following guidelines were approved by the annual general Meeting on 2 april, 2008.
an important part of HL Display’s strategy is to attract and retain key employees. The remuneration offered to holders of senior positions in the company forms a vital component of this strategy.
it is the Board’s perception that a fixed salary, combined with flexible, performance-related remuneration, is an effective means of attracting employees and guiding performance towards the objectives that the Board has defined for the company. By also offering long-term co-ownership in the company, the Board wishes to promote long-term commitment that makes it easier for the company to retain its key employees. The three components of fixed salary, flexible performance-related remuneration and co-ownership shall be viewed as a whole, although the three elements are defined on the basis of different principles.
– The fixed salary shall reflect the employee’s area of responsibility and the complexity of the position. The salary shall be competitive with the fixed salary offered by competitors or other comparable players for an equivalent position. The total salaries for senior management during 2008 will amount to MseK 10.3 excluding social security expenses.
– The flexible performance-related remuneration shall always be linked to measurable targets that are set by the Board. every year the Board shall also decide on a ceiling for the flexible remuneration, either as an absolute amount or as a percentage of the fixed salary. For 2008 the Ceo will be able to achieve a maximum of 40 per cent of the fixed annual salary and a maximum of an additional 40 per cent for the three-year bonus plan that expires in 2008. For two senior executives the maximum is 25 per cent of the fixed annual salary and for three senior executives the maxi-mum is 12.5 per cent of the fixed annual salary. The flexible remuneration is counted as salary that provides entitlement to pension. The maximum outcome of the flexible, performance-related remuneration for 2008 can amount to MseK 3.6 excluding social security expenses.
– Long-term co-ownership for employees aims to encourage employees to share the vision of the company’s owners. it is therefore an important principle of such a scheme that there is an opportunity to share in the increased value of the company’s shares, while also involving a personal risk for those who are participating. another important principle is that the transaction values defined in such schemes are produced objectively using generally accepted methods. The long term incentive programme to acquire warrants was approved by the shareholders at the general meeting 2007. The acquired warrants are subsidized and 50 per cent of the premium will be paid back in equal instalments during a three year period after a deduction of 58 per cent for standard tax. The senior management’s total holdings of shares and warrants in the company at year-end 2007 were 51,200 shares and 496,000 warrants.
HL Display aims to offer contribution-based pension plans. in individual cases other solutions may be applied in accordance with the prevailing collective agreement (the iTp plan). The Board does not approve any other terms of employment that might involve unpredictable future costs for the company. For senior executives who are not resident in sweden, local rules are applied to achieve a pension on corresponding terms.
Not
esH
L D
ispla
y annual r
eport
20
08
50

51HL DispLay ÅrsreDovisning 2007
Note 9 Lease agreements Lease agreements in which the company is the lesseeLease payments that cannot be terminated amounts to: Lease of Machinery and equipment
Finance leases Operating leases Group Group Parent Company KSEK 2008 2007 2008 2007 2008 2007Lease payments – 1,612 17,968 22,647 6,615 6,554 Minimum lease payments Fall due for payment: Within one year – – 16,262 16,365 5,490 6,554Between one year and five years – – 19,331 19,250 4,433 6,554Later than five years – – 870 478 – –Total – – 36,463 36,093 9,923 13,108 Lease of Properties and premises
Finance leases Operating leases Group Group Parent Company KSEK 2008 2007 2008 2007 2008 2007Lease payments 66 4,005 38,728 26,657 1,263 1,480 Minimum lease payments Fall due for payment: Within one year – 66 34,824 24,161 813 1,499Between one year and five years – – 75,349 46,641 4,510 3,089Later than five years – – 52,395 53,496 – –Total – 66 162,568 124,298 5,323 4,588 The group has, for a number of years, rented factory premises in sundsvall and Falkenberg from optimus KB – an associated company. The agreements have previously been reported as financial lease agreements and the premises have been included in the consolidated balance sheet as assets with appurtenant lease liability. as of 1 July, 2007, new lease agreements for the premises was signed whereby the rental agreements no longer are classified as financial lease agreements but instead reported according to the regulations for operational leasing. at the same point in time, the Falkenberg premises were sold.
Note 10 Cost of operations per type of cost GroupKSEK 2008 2007Cost of goods/services sold -776,269 -833,768non-production staff costs -305,184 -294,673Cost of premises -36,641 -29,407Communication costs -15,574 -15,209Depreciation -36,123 -39,515other operating expenses -241,472 -209,962Total -1,411,263 -1,422,534
Note 11 Financial income
Group KSEK 2008 2007interest income 5,173 3,707 net exchange rate changes 7,244 77other financial income 377 319Financial income 12,794 4,103 interest income is largely attributable to bank deposits. Parent Company Profit/loss from participations in Group companiesKSEK 2008 2007Dividends 158,644 129,673impairment losses -5,244 -940Total 153,400 128,733 Parent Company Profit/loss from other securities and receivables Interest income that are non-current assets and similar profit itemsKSEK 2008 2007 2008 2007interest income, group companies 6,479 3,244 – –interest income, others 431 213 58 394net exchange rate changes 972 – – –Total 7,882 3,457 58 394
Note 12 Financial expenses
Group KSEK 2008 2007interest expenses -6,277 -9,193 other financial expenses -618 -762Financial expenses -6,895 -9,955 interest expences are largely attributable to bank loans. Parent Company Interest expenses and similar profit itemsKSEK 2008 2007 interest expenses, group companies -227 -380 interest expenses, others -20 -171net exchange rate changes – -403Total -247 -954
Note 13 Appropriations to untaxed reserves
Parent Company KSEK 2008 2007property, plant and equipment -898 -890Tax allocation reserve, provision -18,407 -17,413Tax allocation reserve, reversal 6,919 8,455Total -12,386 -9,848
Not
esH
L D
ispla
y annual r
eport
20
08
51

HL DispLay ÅrsreDovisning 2007 52
Note 14 Taxes Group Parent CompanyKSEK 2008 2007 2008 2007Current tax expense Current income tax for the year -38,249 -38,957 -17,845 -19,150Current income-tax related to previous years -1,808 -4 -1,670 8Total -40,057 -38,961 -19,515 -19,142 Deferred tax cost (-)/tax income (+) Deferred tax relating to temporary differences 1,680 -2,854 – – Deferred tax income relating to tax loss carryforwards recognised during the year 878 687 – – Deferred tax expense relating to the use of tax loss carryforwards recognised in prior years -2,341 -5,324 – –Total 217 -7,491 – –
Total tax expense in the income statement -39,840 -46,452 -19,515 -19,142
Tax expense/income taken directly to equity Current tax relating to expense/income taken directly to equity (group contributions) – – 1,135 4,352 Deferred tax expense/income in the group and in the parent company is reported in full in the income statement. Reconciliation between profit/loss before taxes and tax expense Group Parent CompanyKSEK 2008 2007 2008 2007profit/loss before taxes 136,157 154,688 111,637 97,529Tax according to swedish tax rate, 28% -38,124 -43,313 -31,258 -27,308adjustment for other tax rates outside sweden 2,179 3,502 – – adjustment of previous years’ current tax -1,808 -4 -1,670 8Tax effect of reassessment of tax loss carryforwards due to changed estimates, tax rates and exchange rates 1,470 -3,321 – – Tax effect of deficits for which tax assets were not taken into account -1,367 -2,241 – – Tax effect of non-taxable dividends – – 15,215 8,653Withholding tax on dividends from subsidiaries -1,248 -171 – – Tax effect of impairment loss of shares in subsidiaries – – -1,468 -263Tax effect of other non-taxable or non-deductible items -942 -904 -334 -232Current tax expense -39,840 -46,452 -19,515 -19,142 Specification of deferred tax assets and liabilities Group Parent CompanyKSEK 2008 2007 2008 2007Tax loss carryforwards 2,966 4,430 – – internal profit in inventories 6,729 7,900 – –other temporary deductible differences 5,975 3,410 – –Deferred tax assets 15,670 15,740 – – Untaxed reserves relating to machinery and equipment -9,434 -9,977 – –Untaxed reserves, tax allocation reserves -13,498 -11,141 – –other temporary taxable differences -563 -2,663 – –Deferred tax liabilities -23,495 -23,781 – –
net deferred tax asset in the balance sheet 14,201 14,906 – –net deferred tax liability in the balance sheet -22,026 -22,947 – –
in the group deferred tax assets totalling KseK 1,907 (670) have been reported, relating to tax loss carryforwards in companies that have reported losses in the last two financial years. These are companies where group contributions and other tax-balancing measures can be used, as well as newly started companies where growth in revenue is prioritized ahead of profitability during a market development phase.
in the group deferred tax assets were not recognised for tax loss carryforwards of KseK 29,778 (24,027). There are no time restrictions or legal obstacles to the potential utilisation of these tax loss carryforwards. no recognised tax loss carryforward have a limited asset-right.
Not
esH
L D
ispla
y annual r
eport
20
08
52

53HL DispLay ÅrsreDovisning 2007
Note 15 Earnings per share Before dilution After dilutionSEK 2008 2007 2008 2007earnings per share 3.11 3.49 3.11 3.48
The calculation of the numerators and denominators used in the above calculations is specified below.
Earnings per share before dilution Calculation of the earnings per share for 2008 was based on the profit for the year attributable to the parent company’s shareholders, totalling KseK 96,254 (107,864) and a weighted average number of outstanding shares in 2008, totalling 30,939,088 (30,933,176).
Earnings per share after dilution Calculation of the earnings per share after dilution for 2008 was based on the profit for the year attributable to the parent company’s shareholders, totalling KseK 96,254 (107,864) and a weighted average number of out-standing shares in 2008, totalling 30,939,088 (30,984,444). Weighted average number of outstanding shares has been calculated as follows:
Weighted average number of outstanding shares, after dilution 2008 2007Weighted average number of shares during the year, before dilution 30,939,088 30,933,176effect of issued warrants – 51,268Weighted average number of shares during the year, after dilution 30,939,088 30,984,444 Instruments that can have a potential dilution effect and changes after the year-end in 2008 the company had an outstanding warrant scheme, the subscriptionprice of which (seK 56.50 per share) exceeded the average price of the shares (seK 40.28 per share). These warrants are therefore not considered to have a dilution effect and have been excluded from the calculation of the profit/loss per share after dilution. if, in future, the stock exchange price of outstanding shares in HL Display rises to a level above the redemption prices, these warrants will cause dilution. also the employee options scheme lacked dilution effect during 2008.
Note 16 Participations in joint ventures
Group The group has 50 per cent holdings in the joint venture companies HL Trion aB and Trion HL LLC, whose primary operations involve production in the field of wire-bending and extrusion respectively.
The group’s share of average number of employees in HL Trion aB was 7, and in Trion HL LLC 9.
The group’s financial statements include the items below, which constitute the group’s ownership of the joint venture companies’ assets, liabilities, income and expenses. KSEK 2008 2007net sales 22,858 27,974expenses -26,970 -30,146Profit/loss before taxes -4,112 -2,172 non-current assets 6,891 7,502Current assets 6,188 10,173Total assets 13,079 17,675 Current liabilities 7,379 5,336non-current liabilities 1,659 3,917Total liabilities 9,038 9,253net assets/net liabilities 4,041 8,422
Note 17 Investment commitments in 2008 the group entered into agreements to acquire non-current assets tothe order of KseK 8,014 (5,734). it is expected that these commitments will be settled during the following financial year.
Note 18 Intangible assets Accumulated acquisition cost Group Parent Company Computer systems Acquired Computer systems developed market developedKSEK in-house assets Goodwill in-houseopening balance 1 January 2007 30,741 – – 16,546acquisitions – 767 23,447 –assets developed in-house 9,287 – – 6,580sales and disposals -11,463 – – -10,957exchange rate differences for the year 44 – -36 –Closing balance 31 December 2007 28,609 767 23,411 12,169
Group Parent Company Computer systems Acquired Computer systems developed market developedKSEK in-house assets Goodwill in-houseopening balance 1 January 2008 28,609 767 23,411 12,169other investments 412 – 4,287 274sales and disposals -429 47 – –acquisitions – 274 – –exchange rate differences for the year 1,173 186 6,097 –Closing balance 31 December 2008 29,765 1,274 33,795 12,443
Group Parent Company Computer systems Acquired Computer systems developed market developedKSEK in-house assets Goodwill in-houseopening balance 1 January 2007 -25,171 – – -11,611sales and disposals 10,915 – – 10,957Depreciation for the year -2,615 -379 – -1,489exchange rate differences for the year -187 – – –Closing balance 31 December 2007 -17,058 -379 – -2,143
Accumulated amortization and impairment losses Group Parent Company Computer systems Acquired Computer systems developed market developedKSEK in-house assets Goodwill in-houseopening balance 1 January 2008 -17,058 -379 – -2,143sales and disposals 429 – – –Depreciation for the year -3,312 -49 – -2,737exchange rate differences for the year -974 -185 -525 –Closing balance 31 December 2008 -20,915 -613 -525 -4,880 Carrying amounts 1 January 2007 5,570 – – 4,93531 December 2007 11,551 388 23,411 10,026 1 January 2008 11,551 388 23,411 10,02631 December 2008 8,850 661 33,270 7,563
Amortization and impairments Amortization is included in the following items in the income statement Group Parent CompanyKSEK 2008 2007 2008 2007Cost of goods sold – -499 – –selling expenses -2,303 -1,062 -1,808 -394administrative expenses -1,050 -1,394 -911 -1,069research and development expenses -9 -39 -18 -26Total -3,361 -2,994 -2,737 -1,489
Not
esH
L D
ispla
y annual r
eport
20
08
53
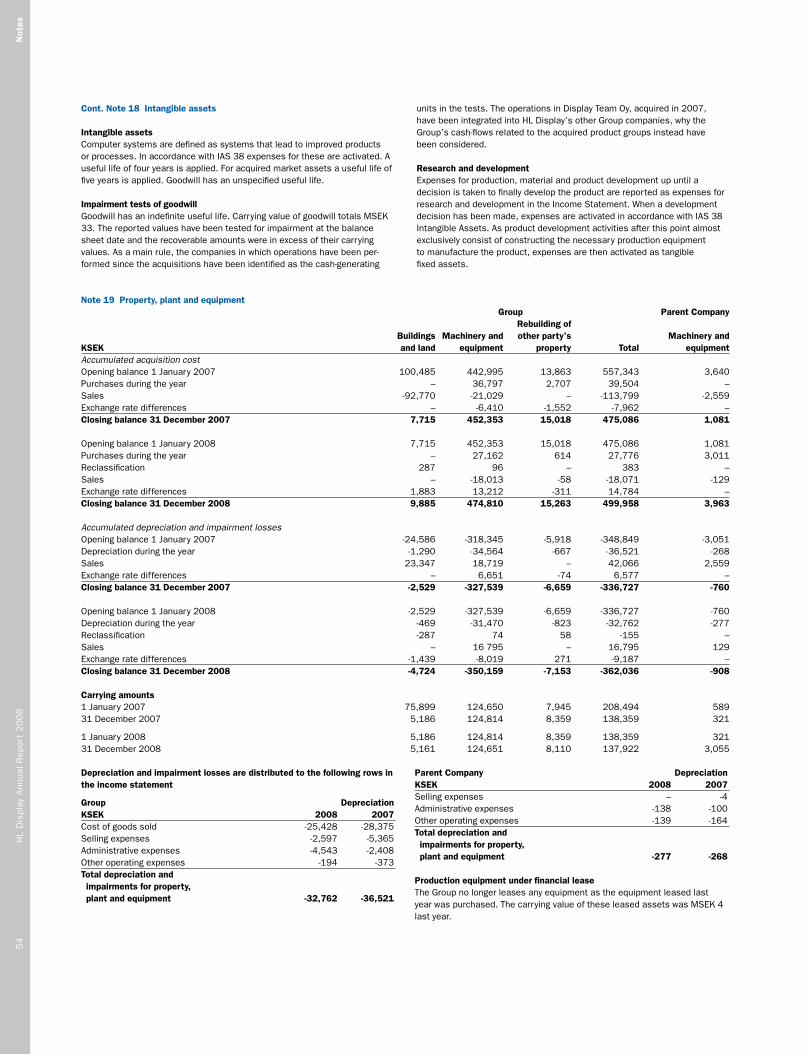
HL DispLay ÅrsreDovisning 2007 54
units in the tests. The operations in Display Team oy, acquired in 2007, have been integrated into HL Display’s other group companies, why the group’s cash-flows related to the acquired product groups instead have been considered. Research and developmentexpenses for production, material and product development up until a decision is taken to finally develop the product are reported as expenses for research and development in the income statement. When a development decision has been made, expenses are activated in accordance with ias 38 intangible assets. as product development activities after this point almost exclusively consist of constructing the necessary production equipment to manufacture the product, expenses are then activated as tangible fixed assets.
Cont. Note 18 Intangible assets
Intangible assetsComputer systems are defined as systems that lead to improved products or processes. in accordance with ias 38 expenses for these are activated. a useful life of four years is applied. For acquired market assets a useful life of five years is applied. goodwill has an unspecified useful life.
Impairment tests of goodwill goodwill has an indefinite useful life. Carrying value of goodwill totals MseK 33. The reported values have been tested for impairment at the balance sheet date and the recoverable amounts were in excess of their carrying values. as a main rule, the companies in which operations have been per-formed since the acquisitions have been identified as the cash-generating
Note 19 Property, plant and equipment Group Parent Company Rebuilding of Buildings Machinery and other party’s Machinery andKSEK and land equipment property Total equipmentAccumulated acquisition cost opening balance 1 January 2007 100,485 442,995 13,863 557,343 3,640purchases during the year – 36,797 2,707 39,504 –sales -92,770 -21,029 – -113,799 -2,559exchange rate differences – -6,410 -1,552 -7,962 –Closing balance 31 December 2007 7,715 452,353 15,018 475,086 1,081 opening balance 1 January 2008 7,715 452,353 15,018 475,086 1,081purchases during the year – 27,162 614 27,776 3,011reclassification 287 96 – 383 –sales – -18,013 -58 -18,071 -129exchange rate differences 1,883 13,212 -311 14,784 –Closing balance 31 December 2008 9,885 474,810 15,263 499,958 3,963
Accumulated depreciation and impairment losses opening balance 1 January 2007 -24,586 -318,345 -5,918 -348,849 -3,051Depreciation during the year -1,290 -34,564 -667 -36,521 -268sales 23,347 18,719 – 42,066 2,559exchange rate differences – 6,651 -74 6,577 –Closing balance 31 December 2007 -2,529 -327,539 -6,659 -336,727 -760 opening balance 1 January 2008 -2,529 -327,539 -6,659 -336,727 -760Depreciation during the year -469 -31,470 -823 -32,762 -277reclassification -287 74 58 -155 –sales – 16 795 – 16,795 129exchange rate differences -1,439 -8,019 271 -9,187 –Closing balance 31 December 2008 -4,724 -350,159 -7,153 -362,036 -908
Carrying amounts 1 January 2007 75,899 124,650 7,945 208,494 58931 December 2007 5,186 124,814 8,359 138,359 321 1 January 2008 5,186 124,814 8,359 138,359 32131 December 2008 5,161 124,651 8,110 137,922 3,055
Depreciation and impairment losses are distributed to the following rows in the income statement
Group DepreciationKSEK 2008 2007Cost of goods sold -25,428 -28,375selling expenses -2,597 -5,365administrative expenses -4,543 -2,408other operating expenses -194 -373Total depreciation and impairments for property, plant and equipment -32,762 -36,521
Parent Company DepreciationKSEK 2008 2007selling expenses – -4administrative expenses -138 -100other operating expenses -139 -164Total depreciation and impairments for property, plant and equipment -277 -268
Production equipment under financial lease The group no longer leases any equipment as the equipment leased last year was purchased. The carrying value of these leased assets was MseK 4 last year.
Not
esH
L D
ispla
y annual r
eport
20
08
54

55HL DispLay ÅrsreDovisning 2007
Note 20 Investments in Group companies
Corporate Capital Number Carrying amount, KSEKDirectly owned Reg. office identity number share, % Votes, % of shares 31-12-2008 31-12-2007Display Team oy espoo 0865289-8 100 100 100 26,655 24,670HL Display Belgium n.v. antwerp 0431.244.677 100 100 1,000 1,265 283HL Display Ceská republika s.r.o prague 65410394 100 100 1 26 26HL Display Deutschland gmbH Langenfeld HrB2713 100 100 1 2,614 2,614HL Display d.o.o. Ljubljana 47556722 100 100 1 93 93HL Display d.o.o. Beograd Beograd sr103831628 100 100 1 5 5HL Display españa s.L Madrid B83488213 100 100 3,814 1,267 1,267HL Display Falun aB Falun 556545-6976 100 100 1,000 100 100HL Display France sas Tours rCsB377988704 100 100 2,500 268 268HL Display Hungaria Budapest 01-09-667938 100 100 1 487 487HL Display inc. Wilkes-Barre 23-2869204 100 100 1 1 1HL Display Latvia sia riga 50003303821 100 100 100 1,522 1,522HL Display Lesjöfors aB Filipstad 556439-7429 100 100 5,000 2,513 2,513HL Display Ltd sti istanbul 428930-376512 100 100 200 1,707 1,707HL Display nordic aB Falkenberg 556446-0557 100 100 1,500 3,383 3,383HL Display norge a/s asker 955437071 100 100 1,100 5,598 5,598HL Display ooo Moscow 7701211771 100 100 1 832 832HL Display pictoria aB Filipstad 556654-4952 100 100 1,000 100 100HL Display polska sp.zo.o Warszaw 521-04-17-996 100 100 200 236 236HL Display product supply aB Falkenberg 556738-6577 100 100 1,000 100 100HL Display regional service Center Bergen op Zoom 20085397 100 100 1,671 100 5,344HL Display srL Bukarest ro14633525 100 100 2,500 103 103HL Display schweiz ag aarau CH-4003018955-6 100 100 100 543 543HL Display (asia) pte Ltd. singapore 200004486H 100 100 1 576 576HL Display slovensko s.r.o. Bratislava 36547662 100 100 1 1,134 1,134HL Display soumi oy Helsinki Fi21185753 100 100 100 93 93HL Display sundsvall aB sundsvall 556124-0481 100 100 1,500 11,125 11,125HL Display (suzhou) Co., Ltd suzhou Qi Du su no. 016307 100 100 1 16,320 15,128HL Display sverige aB stockholm 556351-9528 100 100 1,000 50 50HL Display (UK) Ltd Kirmington 2187037 100 100 10,000 935 935HL Display Ukraine Kiev 09867 100 100 100 223 223HL Display Österreich gmbH Wienna Fn140307i 100 100 1 327 327HL Financial services aB stockholm 556435-0832 100 100 500 128 128sCi L’eclipse Tours rCs414745026 100 100 100 14 14Total 80,443 81,528 Indirectly owned HL Design sasU saint avertin rCs484754379 100 100 37,000HL Display (shanghai) Co Ltd shanghai prC 310230757570910 50 50 2HL Display Hong Kong Ltd Hong Kong 783 663 100 100 2HL Display india pvt Ltd Mumbai 05MH2006FTC164731 100 100 10,000HL Display Karlskoga aB Karlskoga 556457-7202 100 100 1,000HL Display Korea Co Ltd seoul 110111-3042176 100 100 16,800HL Display Malaysia sdn Bhd Kuala Lumpur 569116-0 100 100 2HL Display nederland Bv Bergen op Zoom 30152867 100 100 200HL Display shipley Ltd shipley 256682 100 100 1,000HL Display Taiwan Ltd Taipei 27578266 100 100 1HL Display Thailand Ltd Bangkok 10454600434 100 100 1pT. HL Display indonesia Jakarta 0904.5.51.20945 100 100 100 The group owns 50 per cent of the votes in HL Display (shanghai) Co Ltd. By agreement with the other owner of HL Display (shanghai) Co Ltd. the group has the right to appoint the management group and owns all of the rights to the name, products and product names. HL Display (shanghai) Co Ltd. is therefore consolidated as a subsidiary.
Accumulated impairment losses Parent CompanyKSEK 2008 2007 opening balance -38,198 -37,258 impairment losses -5,244 -940Closing balance 31 December -43,442 -38,198 Carrying amount 80,443 81,528
Acquisition cost Parent CompanyKSEK 2008 2007opening balance 119,726 89,519 Capital contributions paid 3,080 5,344 newly started/acquired companies 1,079 24,863Closing balance 31 December 123,885 119,726
Not
esH
L D
ispla
y annual r
eport
20
08
55

HL DispLay ÅrsreDovisning 2007 56
Note 21 Parent company investments in associated companies and joint ventures Parent Company Acquisition cost KSEK 2008 2007opening balance 12,147 17,147sales – -5,000Closing balance 31 December 12,147 12,147 The parent company’s directly owned holding in associated companies and joint venture companies
2007 Voting and Joint venture company, corp. reg. capital share Carryingno. and registered office as a % amountAssociated companies optimus KB, 916620-1450, stockholm – 5,000Joint ventures – directly owned HL Trion aB, 556539-1637, Filipstad 50% 7,147Joint ventures – indirectly owned Trion HL LLC 50% –Total 12,147
2008 Voting andJoint venture company, corp. reg. capital share Reportedno. and registered office as a % valueAssociated companies optimus KB, 916620-1450, stockholm – 5,000Joint ventures – directly owned HL Trion aB, 556539-1637, Filipstad 50% 7,147Joint ventures – indirectly owned Trion HL LLC 50% –Total 12,147
The group’s holding refer to participations in optimus KB.
Note 22 Other non-current receivables
Group Parent CompanyKSEK 2008 2007 2008 2007Deposits 2,329 1,385 – –other – 644 – 644Total 2,329 2,029 – 644
Note 23 Parent company receivables from Group companies
Acquisition cost Receivables from Group companies KSEK 2008 2007opening balance 326,532 244,848increases 55,926 115,317redemptions -14,898 -33,633Closing balance 31 December 367,560 326,532 at the year-end the parent company had no receivables from associated companies or joint ventures.
Note 24 Inventories Group Parent Company KSEK 2008 2007 2008 2007raw materials and consumables 28,587 25,560 – – Work in progress 1,369 1,693 – – Finished goods and goods for resale 157,151 126,266 – – Work in progress on behalf of third parties 57 66 – – Total 187,165 153,585 – – selling expenses for the group include impairment losses of inventories to the order of MseK 6 (7).
Note 25 Trade receivables
Trade receivables are reported after taking into account anticipated bad debt losses that amounted to KseK 8,327 (4,042) in the group. There were no trade receivables in the parent company. Age analysis, overdue not impaired trade receivables 31-12-2008 31-12-2007Trade receivables not yet due 184,985 187,042overdue trade receivables 0 - 30 days 43,197 57,411overdue trade receivables > 30 days - 90 days 29,791 27,643 overdue trade receivables > 90 days - 180 days 10,958 9,825 overdue trade receivables > 180 days - 360 days 6,346 6,532overdue trade receivables > 360 days 4,075 3,670allowance for credit losses -8,327 -4,042Total 271,025 288,081 Allowance account for credit losses 31-12-2008 31-12-2007opening balance -4,042 -3,331Bad debt losses 383 730provision for anticipated bad debt losses -5,872 -2,143Cancelling of previous year’s provisions 1,204 702Closing balance -8,327 -4,042
Note 26 Prepaid expenses and accrued income
Group Parent CompanyKSEK 2008 2007 2008 2007prepaid expenses: rents 5,790 5,612 115 377 leasing expenses 1,382 1,204 1,109 1,120 insurance expenses 1,569 1,420 600 451 iT support and communication 2,903 3,543 2,313 3,508accrued interest income 494 270 293 172other 12,900 14,531 1,235 2,616Total 25,038 26,580 5,665 8,244
Note 27 Other current assets
Withholding tax concerning dividends from foreign subsidiaries of KseK 3,561 (3,374) is included in the parent company’s other current assets.
Not
esH
L D
ispla
y annual r
eport
20
08
56

57HL DispLay ÅrsreDovisning 2007
Note 30 Untaxed reserves Parent CompanyKSEK 2008 2007Accumulated excess depreciation/amortization
Computer systems opening balance 1 January 2,460 886amortization for the year in excess of plan -386 1,574sales and disposals – –Closing balance 31 December 2,074 2,460 Property, plant and equipment opening balance 1 January -670 14Depreciation for the year in excess of plan 1,284 -684sales and disposals – –Closing balance 31 December 614 -670 Tax allocation reserves appropriations in conjunction with taxation 2003 – 6,919appropriations in conjunction with taxation 2005 2,656 2,656appropriations in conjunction with taxation 2007 10,974 10,974appropriations in conjunction with taxation 2008 17,413 17,413appropriations in conjunction with taxation 2009 18,407 –Closing balance 31 december 49,450 37,962 Total untaxed reserves 52,138 39,752
Note 31 Interest-bearing liabilities This note contains information about the company’s contractual terms in respect of interest-bearing liabilities. For more information about the company’s exposure to interest rate risk and risks of exchange rate changes, refer to note 2. GroupKSEK 2008 2007Non-current liabilities Bank loans 61,261 83,267 other interest-bearing liabilities 519 756Total 61,780 84,023 Current liabilities Bank overdraft facility – 42,337short-term element of bank loans 36,827 1,789short-term element of financial leasing liabilities – 64other interest-bearing liabilities 1,732 –Total 38,559 44,190 Terms and repayment period – Group For information about pledged assets, see note 36. Financial leasing liabilities For information about leasing liabilities, see note 9.
authorised bank overdraft facilities in the group total KseK 134,044 (158,494).
Note 28 Cash and cash equivalents GroupKSEK 2008 2007Cash and bank balance 102,164 75,973Credit balance in group account 118,609 80,997Current investments – 20,109Total according to cash flow statement 220,773 177,079
Note 29 Equity
GroupFor a specification of the group’s equity, see the financial report on page 38.
Share capitalas at 31 December 2008 the registered share capital amounted to seK 38,673,860, comprising 30,939,088 ordinary shares, 3,652,096 of which are class a and 27,286,992 class B. The group has not issued preference shares. Holders of ordinary shares are entitled to a dividend as decided subsequently and are entitled to vote at the annual general Meeting of shareholders with one vote per share for class a shares and 1/10 vote per share for class B shares.
Cash flow hedge reserveThe cash flow hedge reserve of KseK -8,887 constitutes the effective proportion of the cumulative net change in fair value of a cash flow hedging instrument attributable to hedging transactions that have not yet occurred.
Retained earningsretained earnings include profits earned in the parent company and its subsidiaries, associated companies and joint ventures. previous allocations to the statutory reserve are included in this equity item.
Dividendafter closing date the Board has proposed the following dividend. This dividend has yet to be confirmed and there are no income tax consequences.
KSEK 2009 1) 2008 2007Dividend, KseK 42,696 42,541 27,072Dividend per share, seK 1.38 1.38 0.88
1) according to the Board of Directors’ proposal.
Parent CompanyFor a specification of the parent company’s equity, see the financial report on page 41.
Restricted equityrestricted equity may not be reduced through dividends.
Statutory reserveThe purpose of the statutory reserve has been to restrict a portion of the net profit each year of dividend distribution.
Unrestricted equityRetained earningsretained earnings comprises the previous year’s unrestricted equity after any dividend distributions. Together with the profit/loss for the year, it constitutes total unrestricted equity, i.e. the amount available for dividend distribution to the shareholders.
Not
esH
L D
ispla
y annual r
eport
20
08
57

HL DispLay ÅrsreDovisning 2007 58
Note 32 Post-employment benefits
Defined benefit pension plans The group has five defined benefit plans providing remuneration to employees after they retire. in defined benefit plans the payment made to employees and former employees is based on the salary at retirement and the number of years worked. The group bears the risk for ensuring that the promised payments are made. KSEK 2008 2007present value of wholly or partly funded obligations 7,267 8,273Fair value of managed assets -4,392 -5,981Net wholly or partly invested obligations 2,875 2,292present value of unfunded obligations 2,535 1,658Present value of net obligations 5,410 3,950 Unreported actuarial profits (+) and losses (-) -339 -336Net amount in balance sheet relating to defined benefit plans 5,071 3,614 The net amount KseK 5,071 (3,614) is reported in the item pension provisions and accrued expenses KseK 4,367 (3,614) and prepaid income KseK 704 (–) in the consolidated balance sheet. Managed assets consists of investment in mixed funds with the following allocation: 59 per cent in bonds, 16 per cent in shares, 16 per cent in real estate, and 9 per cent other. The net amount is per country: KSEK 2008 2007France 1,500 867norway 2,043 1,988switzerland 702 165austria 826 594Total 5,071 3,614 Changes in the defined benefit obligations: KSEK 2008 2007obligations to defined benefit plans as per 1 January 9,931 4,564Fees paid in -1,909 -190Current service costs plus interest cost 2,175 1,554reclassification – 4,125actuarial gains (+) and losses (-) -1,453 -513exchange rate differences 1,058 391Obligations to defined benefit plans as per 31 December 9,802 9,931 Changes in fair value of managed assets: KSEK 2008 2007Managed assets’ fair value 1 January 5,981 1,206reclassification – 4,426Contribution from employer 711 402payments -2,010 -193expected return on managed assets 251 225actuarial gains (+) and losses (-) -1,458 -236exchange rate differences 918 151Fair value of managed assets 31 December 4,393 5,981
Expense reported to the income statement for defined benefit plans: KSEK 2008 2007Current service cost 1,830 1,261administration cost 98 58interest cost 345 285expected return on managed assets -238 -208actuarial profits (-) and losses (+) – 9Total expense 2,035 1,405Cost of defined contribution plans 15,379 14,142Total cost of remuneration after end of employment 17,414 15,547
The expense is reported in the following rows in the income statement KSEK 2008 2007Cost of goods sold 5,305 4,976selling expenses 9,423 8,102administrative expenses 2,087 1,806research and development costs 599 663Total 17,414 15,547
Assumptions for defined benefit plans The most significant actuarial assumptions as at the year-end (expressed as averages) KSEK 2008 2007Discount rate 31 December 3.43% 3.88%expected return on managed assets 31 December 4.38% 4.38%Future salary increase 2.63% 2.43%Future increase in pensions 2.00% 1.60%expected remaining service, years 18.9 19.6
Commitments for retirement pensions and family pensions for salaried employees in sweden are secured through an insurance policy with alecta. according to a statement issued by the swedish Financial reporting Board, UFr 3, this is a defined benefit plan involving several employers. For the finan-cial year 2008 the company did not have access to information that enabled it to report this plan as a defined benefit plan. The iTp pension plan that is secured through an insurance policy with alecta is therefore reported as a defined contribution plan. This year’s charges for pension policies arranged with alecta total KseK 1,918 (4,435). alecta’s surplus can be distributed to those arranging the insurance and/or the insured parties. at the end of 2008 alecta’s surplus in the form of the collective consolidation level totalled 112 (147) per cent. The collective consolidation level comprises the market value of alecta’s assets as a percentage of insurance commitments, calculated according to alecta’s insurance calculation assumptions, which do not correspond with ias 19. Historical information KSEK 2008 2007 2006 2005present value of benefit-based obligations -9,802 -9,931 -4,564 -3,524Fair value of managed assets 4,393 5,981 1,206 942Deficit in plan -5,409 -3,950 -3,358 -2 582 experience-based adjustments concerning managed assets amounted to KseK 251 (225) for 2008. experience-based adjustments concerning the reported obligations amounted to KseK 740 (73). actual return on managed assets amounted to KseK -1,208 (11).
The estimated payments regarding defined benefits plans for the next year amounts to KseK 447 (924). Defined contribution plans in defined contribution plans the company pays fixed contributions to a separate legal entity and has no obligation to make any further payments. The group’s profit/loss is charged with expenses in line with earnings. Group Parent CompanyKSEK 2008 2007 2008 2007payments to defined contribution plans 15,379 14,142 5,080 4,742
Not
esH
L D
ispla
y annual r
eport
20
08
58

59HL DispLay ÅrsreDovisning 2007
Note 33 Other current liabilities
The item other current liabilities for the group consist of derivatives used for hedge accounting valued at fair value and amounting to KseK -8,887 (580).
Note 34 Liabilities to Group and associated companies, joint ventures
as at year-end, the parent company’s liabilities to group companies amounted to KseK 14,900 (32,545). There were no liabilities to associated companies or joint ventures.
Note 35 Accrued expenses and prepaid income Group Parent CompanyKSEK 2008 2007 2008 2007accrued social security expenses 21,690 16,630 4,495 3,411accrued holiday pay 25,004 25,387 4,204 4,076accrued salaries & wages 28,568 19,190 5,432 –Customer bonuses 12,384 10,944 – –prepaid income 5,167 4,982 – –other accrued expenses 41,653 24,397 5,271 3,576Total 134,466 101,530 19,402 11,063
Note 36 Pledged assets and contingent liabilities a competitor has sued HL Display in court alleging patent infringement. HL Display lost the case in the lower court but has appealed. Management assess that the results of this case will not exert any significant effect on the financial position of the group. Group Parent CompanyKSEK 2008 2007 2008 2007Pledged assets for own liabilities and provisions Corporate mortgages 350 6,490 – –Total pledged assets 350 6,490 – –
Contingent liabilities securities for the benefit of subsidiaries – – 106,010 91,956guarantees issued for the benefit of subsidiaries – – 107,508 55,144securities for the benefit of joint ventures – 1,612 – 3,225Total contingent liabilities – 1,612 213,518 150,325
HL Display aB has, to seB, undertaken that no company in the group will provide guarantees for loans or that the parent company will transfer the ownership of its shares or control of subsidiaries that have credits in this bank without the permission of the bank. in addition the company guarantees that net debt/eBiTDa, measured at the end of every calendar quarter as a moving, 12-month level, will not exceed 2.0 plus that equity/assets ratio will not be less than 35 per cent on every measurement occasion.
Note 37 Cash flow statement
Adjustments for items not included in cash flow Group Parent CompanyKSEK 2008 2007 2008 2007Disposals of non-current assets 227 3,029 – –Costs concerning share-based benefits 294 460 294 460pension provisions 77 152 – –Changes in provisions 375 -5,807 – –Translation difference 11,246 77 – – sale of properties – -7,050 – –provision for bonus 3,303 1,191 3,302 1,191severance pay 3,175 – 3,175 –Total 18,697 -7,948 6,771 1,651
Investments Group Parent CompanyKSEK 2008 2007 2008 2007investments made to retain the capacity level 21,228 54,188 3,284 6,580investments that can be seen to have increased the business’s capacity level 10,521 15,991 – –Total investment 31,749 70,179 3,284 6,580
Note 38 Related party transactions
Related parties Chairman of the Board anders remius and Deputy Ceo Kent Hertzell own, through company, 10 per cent of the shares in XLenT Consulting group. other major owners are Capman through swedestart Tech KB with 33 per cent, erik Fröberg 9 per cent and employees 30 per cent.
XLenT Consulting group is a consultancy company with approximately 200 employees working in customer focused business and iT development, and a turnover of approximately MseK 222. in 2008 XLenT Consulting group invoiced group companies KseK 14,392 (24,555). The group’s debt to XLenT Consulting group totals KseK 3 225 (4,995).
The invoices concern work carried out on management, development and support of the group’s iT network and erp system.
of the parent company’s revenue, KseK 100,958 (99,970) relates to consultancy services sold to group companies. Transactions with key people in a managerial position The company’s Board members and their immediate family members represent 79.2 (79.3) per cent of votes in the company. There are no loans to Board members. For further information, see note 8 employees, personnel expenses and remuneration to senior executives.
Not
esH
L D
ispla
y annual r
eport
20
08
59

HL DispLay ÅrsreDovisning 2007 60
Note 39 Fees to auditors
Group Parent CompanyKSEK 2008 2007 2008 2007KPMG audit engagement 3,481 2,472 593 300audit related counselling 410 507 208 335other engagements – 162 – 162Total KPMG 3,891 3,141 801 797
Other auditors audit engagement 533 128 – –other engagements 627 – – –Total other auditors 1,160 128 – – audit engagement and audit related counselling relate to the audit of the annual accounts and bookkeeping as well as the Board’s and the Ceo’s administration, other tasks that are the duty of the company’s auditor as well as advice or other activities arising from observations during such an audit or the performance of such other tasks. anything else is reported as other engagements.
Note 40 Events after the balance sheet date no significant events after the balance sheet date have occurred in the group or the parent Company. The financial statements were approved for issuing by the Board of the parent company on 16 February 2009.
The Board of Directors and the Managing Director certify that the annual accounts have been prepared in accordance with generally accepted accounting principles and that the consolidated accounts have been prepared in accordance with the international set of accounting standards referred to in regulation (eC) no 1606/2002 of the european parliament and of the Council of 19 July 2002, on the application of international accounting standards. The annual accounts and the consolidated accounts give a true and fair view of the position and profit or loss of the Company and the group. The administration report for the Company and the group gives a
fair review of the development and performance of the business, position and profit or loss of the Company and the group, and describes the principal risks and uncertainties that the Company and the companies in the group face.
The annual accounts and the consolidated accounts as reported above have been approved for publication by the Board on February 16, 2009. The consolidated income statement and balance sheet and the parent company’s income statement and balance sheet will be submitted for adoption at the annual meeting of shareholders on april 2, 2009.
Note 41 Critical estimates and evaluations Company management has discussed with the audit Committe develop-ments, the selection of and information in respect of the group’s critical accounting principles and estimates, as well as the application of these principles and estimates.
Critical evaluations in the application of the Group’s accounting principles Certain critical accounting estimates made in applying the group’s accounting principles are described below. Exposure to foreign currencies Changes in exchange rates can have a relatively major effect on the company as a whole. note 2 contains a detailed analysis of the exposure to foreign currencies and the risks related to changes in exchange rates.
Note 42 Details of the Parent Company HL Display aB is a swedish-registered limited liability company with its registered office in stockholm. The parent company’s shares are quoted on the nasdaq oMX nordic exchange’s small Cap list. The address of head office is Cylindervägen 18, 131 26 nacka strand, sweden. The consolidated financial statements for 2008 comprise the parent company and its subsidiaries, together referred to as the group. The group also includes owned holdings in associated companies and joint ventures.
stockholm, 16 February 2009
anders remiusChairman
Åke Modig anna ragén Jan-ove Hallgren Mats-olof Ljungkvist Member of the Board Member of the Board Member of the Board Member of the Board
Lars-Åke rydh stig Karlsson Magnus Jonsson Kent Mossberg Member of the Board Member of the Board Member of the Board, Member of the Board, employee repr. employee repr.
gérard DubuyMember of the Board,
Managing Director and Ceo
our auditor’s report was submitted on 16 February 2009.
KpMg aB
Åsa Wirén Linder Mattias Johansson authorised authorised public accountant public accountant auditor in charge Joint auditor
Not
esH
L D
ispla
y annual r
eport
20
08
60

61HL DispLay ÅrsreDovisning 2007
audit report
To the annual general Meeting of the shareholders of HL Display aB (publ). Corporate identity number 556286-9957
We have audited the annual accounts, the consolidated accounts, the accounting records and the administration of the Board of Directors and the Managing Director of HL Display aB (publ) for the year 2008. The annual accounts and the consolidated accounts of the company are included in the printed version of this document on pages 34-60. The Board of Directors and the Managing Director are responsible for these accounts and the administration of the com-pany as well as for the application of the annual accounts act when preparing the annual accounts and the application of international financial reporting standards iFrss as adopted by the eU and the annual accounts act when preparing the consolidated accounts. our responsibility is to express an opinion on the annual accounts, the consolidated accounts and the administration based on our audit.
We conducted our audit in accordance with generally accepted auditing standards in sweden. Those standards require that we plan and perform the audit to obtain reasonable assurance that the annual accounts and the consolidated accounts are free of material misstatement. an audit includes examining, on a test basis, evidence supporting the amounts and disclosures in the accounts. an audit also includes assessing the accounting principles used and their application by the Board of Directors and the Managing Director and significant estimates made by the Board of Directors and the Managing Director when preparing the annual accounts and the consolidated accounts as well as evaluating the overall
presentation of information in the annual accounts and the consol-idated accounts. as a basis for our opinion concerning discharge from liability, we examined significant decisions, actions taken and circumstances of the company in order to be able to determine the liability, if any, to the company of any Board member or the Managing Director. We also examined whether any Board member or the Managing Director has, in any other way, acted in contraven-tion of the Companies act, the annual accounts act or the articles of association. We believe that our audit provides a reasonable basis for our opinion set out below.
The annual accounts have been prepared in accordance with the annual accounts act and give a true and fair view of the com-pany’s financial position and results of operations in accordance with generally accepted accounting principles in sweden. The con-solidated accounts have been prepared in accordance with inter-national financial reporting standards iFrss as adopted by the eU and the annual accounts act and give a true and fair view of the group’s financial position and results of operations. The statutory administration report is consistent with the other parts of the annual accounts and the consolidated accounts.
We recommend to the annual general Meeting of shareholders that the income statements and balance sheets of the parent company and the group be adopted, that the profit of the parent company be dealt with in accordance with the proposal in the statutory administration report and that the members of the Board of Directors and the Managing Director be discharged from liability for the financial year.
stockholm, 16 February 2009KpMg aB
Åsa Wirén Linder Mattias Johansson authorised authorised public accountant public accountant auditor in charge Joint auditor
Aud
it r
epor
tH
L D
ispla
y annual r
eport
20
08
61

HL DispLay ÅrsreDovisning 2007 62
Corporate governance at HL Display aB
External control instrumentsThe external control instruments that affect the management of HL Display consist primarily of the swedish Companies act, the swedish annual accounts act, the Listing agreement with nasdaq oMX and the swedish Code of Corporate governance.
Internal control instrumentsThe internal control instruments that affect the management of HL Display consist primarily of the articles of association, which are defined by the shareholders’ general meeting, and the control documents that are defined by the Board of Directors. These include the rules of procedure for the Board, instructions for the Ceo, instructions for Committees appointed by the Board (audit Committee and remuneration Committee), Finance policy, Code of Conduct, equal opportunity policy, etc.
swedish Code of Corporate governance
HL Display applies the swedish Code of Corporate governance and hereby submits the corporate governance report for 2008.
HL Display has been covered by the Code of Corporate governance since 1 July 2008, since when it has been working to introduce the code.
Shareholders’ General MeetingThe shareholders’ exercise their influence over HL Display at the shareholders’ general meeting (annual general meeting or, if necessary, extraordinary general meeting), which is the company’s supreme decision-making body. among other things, at the meeting shareholders appoint the members of the Board and the Chairman of the Board, elect the auditor, decide on changes to the articles of association, adopt the income statement, balance sheet and disposal of the company’s profits, decide on the discharge from liability for the members of the Board and the Ceo, and decide on the fees for the Board and define the principles for remuneration to the Ceo and company management. Decisions at the share-holders’ general meeting are normally made by a simple majority, except in cases where the swedish Companies act prescribes a higher proportion of shares and votes at the shareholders’ general meeting in order for a proposal to be adopted.
HL Display’s annual general meeting is usually held at the beginning of april in stockholm or nacka. The invitation procedure for a shareholders’ general meeting takes place by means of
an announcement in post- och inrikes Tidningar and svenska Dagbladet. The invitation is also posted on the company’s website. shareholders who wish to take part in proceedings at a shareholders’ general meeting and vote for their shares must be registered in the register of shareholders as of five working days before the meeting and register himself/herself and the number of proxies with the company no later than at 16:00 on the date specified in the invitation to the meeting. shareholders who are unable to attend have the opportunity to be represented by a proxy.
The agM in 2008 was held in stockholm on 2 april. Decisions made included a share split and changes to the articles of asso-ciation in accordance with a proposal presented by the Board. 30 shareholders attended, representing 57 per cent of the share capital and 56 per cent of the total number of votes. The minutes from the agM are available for download on HL Display’s website.
The time and venue of the 2009 agM were published on 22 october 2008. on HL Display’s website, under the section on corporate governance, there is information about how and by what time a shareholder must submit a request for a matter to be dealt with at the meeting.
Nomination CommitteeThe agM decides how the nomination Committee shall be appointed. The 2008 agM decided that the company’s Chairman of the Board, in consultation with the company’s major shareholders, should appoint a nomination Committee. The nomination Committee must consist of at least four members, one of whom is the Chairman of the Board. a member who is familiar with the company’s major owners is elected as chairman, although not
CEO
Board of Directors
Shareholders’ General Meeting
Nomination Committee
Audit Committee
Remuneration Committee
Internal control environment
Group management Area Managers
Subsidiares
Auditor
How HL Display is managed
Cor
pora
te G
over
nanc
eH
L D
ispla
y annual r
eport
20
08
62

63HL DispLay ÅrsreDovisning 2007
the Chairman of the Board. if a member already appointed leaves the nomination Committee, the company’s major shareholders must consult to appoint a replacement. The present nomination Committee constitutes the nomination Committee until a new nomination Committee is appointed.
The nomination Committee of HL Display in 2008 consisted of Johan Lannebo, Lannebo Fonder (chairman), anders remius, Chairman of the Board of HL Display, arne Karlsson, Ceo of ratos and Hasse Bjurevad, former Bank Director at nordea. The composition of the nomination Committee was published on 1 september 2008 in a press release and on HL Display’s website.
it is the task of the nomination Committee to:– assess the composition and work of the Board, – draw up a proposal for the agM in respect of the election of the
Board and the Chairman of the Board,– in collaboration with the company’s audit Committee draw up
a proposal for the agM in respect of the election of auditors, if relevant,
– draw up a proposal for the agM in respect of fees to the Board and auditors and
– draw up a proposal for the agM in respect of the chairman of the agM.
since the 2008 agM the nomination Committee has held four meetings, and has also maintained telephone contact between meetings. a report on the work of the nomination Committee will be presented at the 2009 agM. no separate remuneration was paid to the members of the nomination Committee.
The BoardThe members of the Board are appointed by the shareholders at the agM for a period of one year, until the end of the following agM. in accordance with the Code, the Chairman of the Board was also appointed by the 2008 agM. according to the articles of associa-tion, the Board of HL Display shall consist of no fewer than three and no more that eight members, and it is the agM that decides the exact number of Board members. employees are represented on the Board.
in 2008 there were eight Board members elected by the shareholders’ general meeting. There were also two permanent employees’ representatives with one deputy.
The only member elected by the shareholders’ general meet-ing who is an employee of HL Display is the Ceo, gérard Dubuy. all other members elected by the shareholders’ general meeting are considered to be independent in relation to the company. anders remius and stig Karlsson have a position of dependence in respect of the company’s major shareholders. other members elected by the shareholders’ general meeting – Jan-ove Hallgren, Mats-olof Ljungkvist, Åke Modig, anna ragen and Lars-Åke rydh – are consid-ered to be independent in respect of major shareholders. The com-position of the Board is shown in the table below. additional infor-mation about the members of the Board may be found on p. 67.
The work of the Board at HL DisplayThe Chairman of the Board organises and manages the work of the Board to ensure that it is undertaken in accordance with prevailing laws, rules and regulations. it is also the Chairman of the Board’s responsibility to make sure that the work of the Board is assessed
Attendance of the Board member, participation in committees, and remuneration
Audit Committee
Remuneration Committee
Attendance at Board meetings
Attendance at committee
meetingsTotal
remuneration
Anders Remius Chairman of the Board – Chairman 11 of 11 4 of 4 250,000 seK
Gérard Dubuy Board member and Ceo – – 11 of 11 – –
Jan-Ove Hallgren Board member – Member 11 of 11 4 of 4 150,000 seK
Åke Modig Board member – – 11 of 11 – 150,000 seK
Stig Karlsson Board member Member – 10 of 11 4 of 4 175,000 seK
Mats-Olof Ljungkvist Board member Chairman Member 9 of 11 7 of 8 190,000 seK
Anna Ragén Board member – – 10 of 11 – 150,000 seK
Lars-Åke Rydh Board member Member – 9 of 11 2 of 4 150,000 seK
Kent Mossberg Board member * – – 10 of 11 – –
Magnus Jonsson Board member * – – 6 of 11 – –
Henrik Smedlund Deputy member * – – 3 of 11 – –
* appointed by the employees 1,215,000 seK
»
Aud
it r
epor
tH
L D
ispla
y annual r
eport
20
08
63

HL DispLay ÅrsreDovisning 2007 64
every year and that the nomination Committee is provided with the results of this assessment. The Chairman of the Board monitors the business on an ongoing basis in a dialogue with the Ceo and makes sure that the Board receives the information and documen-tation it requires in order for it to be able to perform its work.
The Board held eleven Board meetings during the financial year 2008. The dates of Board meetings are confirmed in connection with the inaugural Board meeting. Certain Board meetings coincide with the dates for financial information. These are the quarterly, half-yearly and year-end accounts. The Board’s work follows an annual presenta-tion plan with special topics and fixed decision-making points.
a normal agenda for a Board meeting contains the following items:– review of the minutes of the previous meeting– Ceo’s status report– Finance– The Board’s background information for decisions– any other business
The Board’s work is regulated by a set of specially drawn up rules of procedure. put briefly, the rules of procedure mean that the Board is responsible for the company’s strategy and organisation, as well as the administration of the company’s affairs. The Board makes sure that the company’s organisation is structured so that bookkeeping, fund management and the company’s financial situation in general are checked in a secure way. The Board checks the company’s and the group’s financial situation on an ongoing basis. This is reported monthly, so that the Board can perform its duty of assessment pursuant to the law, reporting rules and best practice for boards of directors.
The general rule is that the Board deals with matters of significant importance for the group, such as:– strategic plans– Budgets and forecasts– product planning– sales and acquisitions of companies or businesses– purchases and sales of other significant assets
The Ceo participates in all Board meetings, except in connection with matters where there is a conflict of interest, for example when remuneration to the Ceo is confirmed and when the Ceo’s work is being assessed. it is the express wish of the Board to invite a member of HL Display’s management team or from the rest of the organization to each Board meeting in order to give the Board in-depth information about this person’s specific area. in 2008 this took place at seven meetings, and the Board was provided with information about areas including supply chain management, research and development, finance and strategy. representatives of HL Display’s auditor took part at one meeting in 2008.
important matters dealt with in 2008 included:– investment matters– organisational matters– review of the group’s instructions and policies– Follow-up on cost control and investments– Capital structure– establishment of a management development program – Liquidity of the share– assessment of the Board’s composition and work.
The work of the Board in committeesThe Board has set up committees that, in accordance with the
Board’s instructions, deal with certain defined matters and prepare these matters for decisions by the Board. The Board currently has two committees: the remuneration Committee and the audit Committee.
Remuneration CommitteeThe remuneration Committee prepares matters relating to remuneration and terms of employment for company management, and draws up proposals for guidelines on remuneration to the Ceo and senior executives, which the Board submits for a decision by the agM. in light of this, it is also the remuneration Committee’s responsibility to monitor trends in remuneration offered by com-petitors and other comparable players in order to make sure that the company is offering a competitive level of remuneration. The remuneration Committee also draws up recommendations to the Board about how the guidelines on remuneration to senior execu-tives as adopted by the agM shall be implemented in practice.
The Ceo’s remuneration is defined by the Board. remuneration to other senior executives is decided upon by the Ceo in consultation with the remuneration Committee.
The remuneration Committee, which is appointed by the Board, consists of the Chairman of the Board and two Board members who are independent in relation to the company and management. in 2008 the remuneration Committee consisted of Chairman of the Board anders remius and members Jan-ove Hallgren and Mats-olof Ljungkvist.
The remuneration Committee met on four occasions in 2008.
Audit Committeeit is the audit Committee’s task to support the work of the Board to guarantee high quality in three primary areas: internal control, financial reporting and external audit.
This means, among other things, that the committee guarantees effective systems for internal control and a correct assessment of the company’s financial status. it also means that the committee reviews interim reports and the year-end bulletin before they are submitted to the Board and deals with all critical accounting matters, for example accounting and valuation policies applied.
The audit Committee is also an important communication conduit between the Board and the company’s auditors. one of the committee’s tasks is to assist the nomination Committee in preparations for the election of auditors and the recommendation of remuneration to auditors, as well as conducting a dialogue with the auditors about the audit.
The audit Committee in 2008 consisted of Board members Mats-olof Ljungkvist (chairman), stig Karlsson and Lars-Åke rydh.
The audit Committee held meetings on four occasions in 2008. The company’s auditors participated at all meetings. Minutes were kept of all meetings, and the minutes were presented to the Board.
Assessment of the BoardThe Chairman of the Board is responsible for ensuring that the work of the Board is assessed every year and that the nomination Committee is provided with the results of the assessment. The assessment takes the form of an anonymous questionnaire-based survey and interviews, and covers such issues as the Board’s composition, working methods and responsibility. The survey is compiled and assessed by a third party, and the results are presented to the nomination Committee.
»Cor
pora
te G
over
nanc
eH
L D
ispla
y annual r
eport
20
08
64

65HL DispLay ÅrsreDovisning 2007
CEOHL Display’s Ceo, gérard Dubuy, is in charge of day-to-day, operational business. a written set of instructions defines the allocation of responsibility between the Board and the Ceo. The Ceo reports to the Board and presents a special Ceo’s report at each Board meeting, including information about how the business is performing on the basis of the decisions made by the Board. There is additional information about the Ceo on page 68.
Group managementgroup management at HL Display consists of seven members with day-to-day responsibility for various parts of the business. group management has eight scheduled meetings a year. For more infor-mation about the members of group management, see page 68.
Management of subsidiariesHL Display has five area Managers, each responsible for their own region with between two and seven sales companies, who report directly to Ceo gérard Dubuy. each area Manager has total responsibility for profits and sales in his/her own region.
Remuneration to the Board and senior executivesRemuneration to the Boardat the 2008 agM, in accordance with the nomination Committee’s proposal, a total fee to the Board was adopted of a maximum of seK 1,250,000, to be paid in the form of seK 250,000 to the Chairman of the Board and seK 150,000 to each of the other members who are not employed by the company. Within the frame-work of the maximum amount, supplementary remuneration may be paid to members of the remuneration or audit Committee in the event of significant additional work. This supplementary remu-neration may amount to a maximum of seK 50,000 per person, with a grand total of no more than seK 100,000. For 2008 supple-mentary remuneration for committee work will be paid to Mats-olof Ljungkvist (seK 40,000) and stig Karlsson (seK 25,000).
Remuneration to senior executivesat the 2008 agM the Board’s proposal for guidelines on remuneration to senior executives was adopted.
principlesan important part of HL Display’s strategy is to attract and retain key employees. The remuneration offered to holders of senior positions in the company forms a vital component of this strategy.
it is the Board’s perception that a fixed salary, combined with flexible, performance-related remuneration, is an effective means of attracting employees and guiding performance towards the objectives that the Board has defined for the company. By also offering long-term co-ownership in the company, the Board wishes to promote long-term commitment that makes it easier for the company to retain its key employees. The three components of fixed salary, flexible performance-related remuneration and co-ownership shall be viewed as a whole, although the three elements are defined on the basis of different principles.
– The fixed salary shall reflect the employee’s area of respon-sibility and the complexity of the position. The salary shall be competitive with the fixed salary offered by competitors or other
comparable players for an equivalent position. The total salaries for senior management during 2008 will amount to MseK 10.3 excluding social security expenses.
– The flexible performance-related remuneration shall always be linked to measurable targets that are set by the Board. every year the Board shall also decide on a ceiling for the flexible remuneration, either as an absolute amount or as a percentage of the fixed salary. For 2008 the Ceo will be able to achieve a maximum of 40 per cent of the fixed annual salary and a maximum of an additional 40 per cent for the three-year bonus plan that expires in 2008. For two senior executives the maximum is 25 per cent of the fixed annual salary and for three senior executives the maximum is 12.5 per cent of the fixed annual salary. The flexible remuneration is counted as salary that provides entitlement to pension. The maximum outcome of the flexible, performance-related remuneration for 2008 can amount to MseK 3.6 excluding social security expenses.
– Long-term co-ownership for employees aims to encourage employees to share the vision of the company’s owners. it is therefore an important principle of such a scheme that there is an opportunity to share in the increased value of the company’s shares, while also involving a personal risk for those who are participating. another important principle is that the transaction values defined in such schemes are produced objectively using generally accepted methods. The long term incentive programme to acquire warrants was approved by the shareholders at the general meeting 2007. The acquired warrants are subsidized and 50 per cent of the premium will be paid back in equal instalments during a three year period after a deduction of 58 per cent for standard tax. The senior management’s total holdings of shares and warrants in the company at year-end 2007 were 51,200 shares and 496,000 warrants.
HL Display aims to offer defined contribution pension plans. in individual cases other solutions may be applied in accordance with the prevailing collective agreement (the iTp plan). The Board does not approve any other terms of employment that might involve unpredictable future costs for the company. For senior executives who are not resident in sweden, local rules are applied to achieve a pension on corresponding terms.
see note 8, page 50, for information about levels of remuneration for senior executives in 2008.
Information about the auditorThe auditor is appointed by the agM at the suggestion of the nomination Committee. at the 2008 agM the audit company KpMg aB was elected as auditor for the next four-year period. The chief auditor is authorised public accountant Åsa Wirén Linder. For additional information about the auditor, see page 68.
at the agM a decision was also made that remuneration to the auditor should be paid in accordance with an approved invoice. see note 39 for information about remuneration to the auditors.
it is the auditor’s task, on behalf of shareholders, to audit HL Display’s annual accounts and bookkeeping methods, as well as the Board’s and the Ceo’s administration of the company. The chief auditor also submits an auditor’s report to the agM. at the agM shareholders have the opportunity to put questions to the auditor.
Aud
it r
epor
tH
L D
ispla
y annual r
eport
20
08
65

HL DispLay ÅrsreDovisning 2007 66
The Board’s report on internal control in respect of financial reporting
in accordance with the swedish Companies act and the swedish Code of Corporate governance, the Board is responsible for internal control. This description has been drawn up in accordance with the code and is thus limited to internal control in respect of financial reporting. The description does not form part of the formal documents that constitute the annual accounts.
HL Display’s process for internal control aims to make it possible to achieve a reasonable level of certainty with regard to the quality and correctness of financial reporting. it also aims to make sure that reporting is drawn up in accordance with applicable laws and regulations, as well as the requirements of publicly listed companies in sweden.
internal control is usually described in accordance with the framework for internal control issued by Coso (Committee of sponsoring organizations of the Treadway Commission). according to this framework, internal control is described using the following components: control environment, risk assessment, control activities, information and communication, and follow-up.
Control environmentThe basis of internal control in respect of financial reporting includes the organisational and system structure, decision-making paths and allocation of responsibility that are clearly documented and communicated in steering documents, policies and manuals. The Board has adopted a set of rules of procedure to regulate the Board’s responsibility and the Board’s work in committees. The Board has also appointed an audit Committee, which has the task of ensuring that defined principles for financial reporting and inter-nal control are observed, and that ongoing relations are maintained with the company’s auditors. in order to maintain an effective control environment and good internal control, the Board has delegated the practical responsibility to the Ceo and drawn up a set of instructions for the Ceo.
in order to guarantee the quality of financial reporting, the company has produced a number of internal control instruments, consisting primarily of the Finance policy, information policy and Controller guidelines. guidelines have also been defined for issues of business ethics, with a view to clarifying and reinforcing the group’s philosophy and values. These include the Code of Conduct and the equal opportunity policy.
Risk assessmentThe audit Committee is responsible for ensuring that significant financial risks and risks of errors in financial reporting are identified and dealt with. every year a risk assessment is conducted in which risks relating to financial reporting are identified. The risk assessment is checked with the auditor. The risk assessment can, for example, include processes that are essential to the group’s profits and financial position, newly launched or acquired units, as well as geographically remote businesses.
Control activitiesControl activities aim to guarantee correctness and completeness in financial reporting. routines and measures have been drawn
up to deal with significant risks relating to financial reporting that were identified in the risk assessment. There are control activities in the group at both a general level and a more detailed level. For example, there are monthly follow-up meetings between the MDs and controllers of the production companies and the group’s production Director. The company’s five area Managers follow up on the sales companies on an ongoing basis, and then report to the Ceo on a monthly basis. The area Manager also visits the manager of each sales company 3-4 times a year to discuss current issues, and also to check the profits and financial status, and to follow up to make sure that attestation routines are being observed. The Board follows up on the business through monthly reports, in which the Ceo comments on the business’s performance as well as profits and financial status. Measures and activities are been continuously undertaken in order to improve the internal control.
Information and communicationThe Board has adopted an information policy defining what is to be communicated, by whom and how information is to be issued, in order to make sure that external information is correct and complete. in order to ensure effective, correct dissemination of information, both internally and externally, there are guidelines and routines on how financial information is communicated between management and other employees.
information and communication on internal policies, guides and manuals with a bearing on financial reporting may be found on HL Displays intranet, HL net. HL Display’s Controller guidelines is a central steering document on the intranet that is updated on an ongoing basis as and when changes are made.
Follow-upThere is continuous follow-up on internal control. The company’s financial status is dealt with at each Board meeting, where the Board receives comprehensive monthly reports on the financial status and the performance of the business. The Board’s follow-up on internal control in respect of financial reporting is performed primarily through the audit Committee. The audit Committee goes through every interim report and discusses its contents with both the Finance Director and the auditors. every year the external auditors follow up on parts of internal control within the framework of their audit. The auditors report the results of their audit to the audit Committee and group management.
HL Display has no separate internal audit function. The local or regional controllers employed at the subsidiaries have a stated responsibility to report non-conformities to their contact person in the central finance and controller organisation. The central finance and controller organisation was reinforced in 2008 in order to enable one-off measures to be undertaken in specific risk areas. The company’s elected auditor is engaged as required. in view of this, the Board does not consider there to be any need for a separate internal audit function.
Cor
pora
te G
over
nanc
eH
L D
ispla
y annual r
eport
20
08
66

67HL DispLay ÅrsreDovisning 2007
Anders RemiusBorn: 1947.Chairman of the Board.Chairman of the Board since 2006,member of the Board since 1982.education: Financial qualification.Holding: 3,519,816 shares, of which 1,607,616 a-shares.not independent in relation to major owners.
Anna Ragén Born: 1966.Member of the Board since 2008.position: Ceo and group executive of Jubo Mechatronics aB. education: Financial and technical university qualification.other appointments: Board member of innovationsbron aB and Örebro Läns Flygplats aB.Holding: 4,000 sharesindependent member.
Jan-Ove HallgrenBorn: 1943.Member of the Board since 2006.education: secondary school Certificatein Commercial subjects, officer in theregular army for 9 years.positions with the iCa group 1971-2000.Holding: 16,000 shares.independent member.
Magnus JonssonBorn: 1969.employee representative.Member of the Board since 1998.position: Machine operator.education: structural engineering qualification.Holding: –
Deputy member
Henrik SmedlundBorn: 1976.employee representative.position: Machine operator.education: Financial qualification.Holding: –
Gérard DubuyBorn: 1961.Ceo of HL Display aB.Member of the Board since 2006.education: M. sc. economics.Holding: 13,200 shares. 287,252 employee options. 80,000 warrants. not independent in relation to the company.
Åke ModigBorn: 1945.Member of the Board since 2006.education: M. sc. economics.other appointments: Chairman of the Board in engelhardt & Co aB, Magnificent solutions aB and Björneruds gård aB. Member of the Board in spendrups Bryggeri aB, ColopLus aB and ecoclean a/s.Holding: –independent member.
Stig KarlssonBorn: 1952. Member of the Board since 2001.position: industrial advisor, ratos aB.education: M. sc. economics. other appointments: Chairman of the Board in Haendig aB and Haglöfs aB. Member of the Board in DiaB aB, Lagerstedt & Krantz aB and Lindab aB.Holding: –not independent in relation to major owners.
Lars-Åke RydhBorn: 1953.education: M. sc. engineering. Member of the Board since 2008.other appointments: Chairman of the Board in nefab aB, san sac aB, plastprint aB and schuchardt Maskin aB. Board member of nolato aB ,oeM international aB and Handelsbanken region east sweden.Holding: 2,000 shares.independent member.
Kent MossbergBorn: 1957.employee representative.Member of the Board since 1995.position: property Manager.education: engineering qualification.Holding: 5,320 shares.
Board of Directors
Mats-Olof LjungkvistBorn: 1951. Member of the Board since 2007.education: M. sc. economics.other appointments: Chairman of the Board in Hermods aB and Twentyfourseven aB. Member of the Board in Biovitrum aB, sBC sveriges Bostadsrätts Centrum aB, swegro aB, Tema aB and swedsec aB. Holding: 4,000 shares.independent member.
Boa
rd o
f D
irec
tors
HL
Dis
pla
y annual r
eport
20
08
67

HL DispLay ÅrsreDovisning 2007 68
Gérard DubuyManaging DirectorBorn: 1961.employed since: 1995.education: M. sc. economics. Holding: 13,200 shares. 287,252 employee options. 80,000 warrants.
Håkan ErikssonMarketing DirectorBorn: 1966.employed since: 1992.education: M. sc. engineering.Holding: 800 shares. 12,000 warrants.
Birger NilssonDevelopment DirectorBorn: 1961.employed since: 1999.education: M. sc. economics.Holding: 13,200 shares. 12,000 warrants.
senior executives
Staffan ForslundHuman resources DirectorBorn: 1949.employed since: 2000.education: B. sc. economics.Holding: 12,000 warrants.
AuditorKpMg aB stockholm.auditors since 2004.realected at the agM 2008 for the next four-year period.
Åsa Wirén LinderBorn: 1968.auditor in charge and authorised public accountant (Far srs).other assignments: auditor in charge in iBs aB, pricer aB and Tilgin aB.
Elisabeth TylstedtiT DirectorBorn: 1964.employed since: 2007.education: B. sc. economics.Holding: –
Xavier Volpatoproduction DirectorBorn: 1969.employed since: 2007.education: M. sc. economics and MBa.Holding: –
Sen
ior
exec
utiv
esH
L D
ispla
y annual r
eport
20
08
68

69HL DispLay ÅrsreDovisning 2007
History
In 2005 HL Display was awarded the title public Company of the year by the finan-cial newspaper Dagens industri and the swedish shareholders’ association.
At the 2006 annual general Meeting anders remius was succeeded by gèrard Dubuy as Ceo of HL Display. anders remius’ commitment to the company continues, now as the Chairman of the Board.
in 2006 production started up at HL Display’s factory in China, situated in suzhou, to the northwest of shanghai. Local production is a very important step to increase competitiveness in the region.
During 2007 HL Display made two acquisitions in Finland; Display Team, a leading supplier of merchandising solutions to brand manufacturers, and sooni, HL Display’s previous distributor in Finland.
In 2008, HL Display acquired its Bulgarian distributor as well as incorporated sales in Lithuania into the Latvian sales company. The 2007 annual report won the nasdaq oMX’s competition for the best annual report, small-cap company class.
In 1996 a partnership was set up with Trion industries as a means of entry into the american market. international expansion continued in line with the rapid growth of the retail trade. Between the mid-1990s and 1999 sales companies were established in poland, austria, the Czech republic, Latvia, russia and Turkey.
In 2000 and 2001 the number of sales companies in eastern europe was aug-mented with new ones in Ukraine, slovenia and slovakia. During 2000 HL Display also began to look further to the east, towards southeast asia. Many of the company’s customers, such as Carrefour, already had a presence in several major asian markets. it was therefore natural for HL Display to have its own presence in these markets. The first asian company was launched in 2000 in singapore, and it now serves as the hub of HL Display’s activities in the region.
In 2002 and 2003 expansion continued apace in asia, with new companies being established in Hong Kong, Malaysia, Taiwan, Thailand and China.
His
tory
HL
Dis
pla
y annual r
eport
20
08
69
HL Display’s history started in Borlänge, sweden, in 1954 by Harry Lundvall. His first product for shops was a plate stand made of shaped metal wire. in due course, by hot-bending plastic he also produced an item for displaying the price next to the product.
In 1969 Harry’s son Åke Westberg took over the business, which was at the time turning over about seK two million and had five employees.
In 1975 Åke Westberg obtained a patent for the shelf edge strip that he had developed. The HL Datastrip is the product for which HL Display is still best known, and it remains an important part of the product range. The patent was the breakthrough for HL Display. The largest swedish retail chains recognised the benefits of Åke’s solution, and they soon became major customers.
In 1977 Åke Westberg’s daughter Lis remius and her husband anders remius started a sales company that mainly sold products from HL Display’s product range.
In 1986 Lis and anders remius bought HL Display from the investment company parcon, which had acquired the company from Åke Westberg in 1982. They recog-nised a potential in HL Display that they wanted to develop themselves, including the establishment of sales companies in other countries.
International expansion began in 1987. sales abroad had previously been chan-nelled through direct sales and distributors, but now HL Display set up its own sales companies in Belgium and the UK. sales companies were then set up in germany in 1989, and in norway and France in 1990.
At the turn of the year 92/93 the company completed its first company acquisition, with the purchase of Jegab Display. since then HL Display has acquired a number of smaller companies, which have strengthened the product range or added expertise within a specific field of production technology.
In 1993 HL Display was listed on the stockholm stock exchange.

HL DispLay ÅrsreDovisning 2007 70
Financial information
HL Display will publish financial information on the following dates during 2009: extraordinary general Meeting, Drottninggatan 2, stockholm 25/02/2009annual report 2008 week 11annual general Meeting, Factory, nacka strand 02/04/2009interim report 3 month 2009 20/04/2009interim report 6 month 2009 16/07/2009interim report 9 month 2009 21/10/2009
www.hl-display.comall relevant financial information about HL Display is available on the company’s website, www.hl-display.com, under the “investors” tab. The website also provides a comprehensive overview of the company.
interim reports are available in swedish and in english. The website also includes an archive of monthly and interim reports dating back to 1997 and an archive of annual reports dating back to 1996. Financial information can be ordered by using the order form available on the website. it is also possible to subscribe to information from the company.
Distribution of Annual and Interim ReportsHL Display prints and distributes the annual report and the interim report for January-June. These are distributed to all shareholders.
Fina
ncia
l in
form
atio
nH
L D
ispla
y annual r
eport
20
08
70

71HL DispLay ÅrsreDovisning 2007
produced by ir stockholm and HL DisplayDesign: John Blomqvistphotography: Magnus Fondprinting: Wassberg+skotte Tryckeri
HL DispLay ÅrsreDovisning 2007 72
HL DISPLAY AB • CYLINDERVÄGEN 18 • 131 26 NACKA STRAND • SWEDEN • TEL +46 8 683 73 00 • FAX +46 8 683 73 01www.hl-display.com


