66
R.C.S. Luxembourg B 147 223 16, boulevard d’Avranches L-1160 Luxembourg Grand Duchy of Luxembourg HSBC Portfolios Audited Annual Report for the year ended 31 July 2017

R.C.S. Luxembourg B 147 22316, boulevard d’AvranchesL-1160 LuxembourgGrand Duchy of Luxembourg
HSBC PortfoliosAudited Annual Report for the yearended 31 July 2017

No subscription can be received on the basis of financial reports. Subscriptions are only valid if made on the basis of the current Prospectus
accompanied by the latest annual and the most recent semi-annual report, if published thereafter.
Audited report for the year ended 31 July 2017
Table of ContentsGeneral Information 2
Directors’ Report 6
Audit Report 9
Statement of Net Assets 13
Statement of Operations 14
Statement of Changes in Net Assets 15
Statement of Changes in Shares Issued 16
Statistical Information 19
Notes to the Financial Statements 21
Schedules of Investments and Other Net Assets
HSBC Portfolios – World Selection 1 35
HSBC Portfolios – World Selection 2 41
HSBC Portfolios – World Selection 3 49
HSBC Portfolios – World Selection 4 56
HSBC Portfolios – World Selection 5 57
Appendix I – Taxation of the Company (foreign countries) 58
Appendix II – UK SORP Disclosure 59
Appendix III – Fund Holiday Calendar for 2017 62
Appendix IV – Publication of TER (Total Expense Ratio) 63

2
General Information
Directors George Efthimiou (Chairman), Global Chief Operating Officer
HSBC Global Asset Management Limited
78 St James’s Street, London SW1A 1HL, United Kingdom
Dr. Michael Boehm, Chief Operating Officer
HSBC Global Asset Management (Deutschland) GmbH
Königsallee 21/23, 40212 Düsseldorf, Germany
Dean Lam, Managing Director
(Resigned 24 March 2017)
HSBC Bank (Mauritius) Limited, 6th Floor, HSBC Centre,
18 CyberCity, Ebene, Mauritius
Eimear Cowhey, Independent Director
Resident in the Republic of Ireland
Peter Dew, Independent Director
Resident in the United Kingdom
Jean de Courrèges, Independent Director
Resident in Grand Duchy of Luxembourg
John Li, Independent Director
The Directors Office, 19 Rue de Bitbourg, L-1273, Luxembourg,
Grand Duchy of Luxembourg
Joanna Munro, Global Head of Fiduciary Governance
(Resigned 2 August 2017)
HSBC Global Asset Management Limited,
78 St James’s Street, London SW1A 1HL, United Kingdom
Matteo Pardi, Chief Executive Officer
(Appointed with effect from 24 March 2017)
HSBC Global Asset Management (France)
Immeuble “Coeur Défense” - Tour A
110 Esplanade du Général de Gaulle - La Défense 4
75419 Paris, Cedex 08
France
Anthony Jeffs, Head of Product Platforms
(Appointed with effect from 2 August 2017)
HSBC Global Asset Management Limited
78 St James's Street, London SW1A 1HL, United Kingdom

3
General Information (continued)
Registered Office 16, boulevard d’Avranches
L-1160 Luxembourg
Grand Duchy of Luxembourg
Administration Agent,
Depositary Bank,
Paying Agent, Corporate and
Domiciliary Agent, Registrar and
Transfer Agent
HSBC Bank Plc, Luxembourg Branch
16, boulevard d’Avranches
L-1160 Luxembourg
Grand Duchy of Luxembourg
Management Company HSBC Investment Funds (Luxembourg) S.A.
16, boulevard d’Avranches
L-1160 Luxembourg
Grand Duchy of Luxembourg
Auditor PricewaterhouseCoopers, Société coopérative
2, rue Gerhard Mercator, B.P. 1443, L-1014 Luxembourg,
Grand Duchy of Luxembourg
Legal Advisers Elvinger Hoss Prussen, Société anonyme
2, Place Winston Churchill
L-1340 Luxembourg
Grand Duchy of Luxembourg
Investment Adviser HSBC Global Asset Management (UK) Limited
78 St James’s Street
London SW1A 1EJ
United Kingdom
Distributors Global Distributor
HSBC Investment Funds (Luxembourg) S.A.
16, boulevard d’Avranches
L-1160 Luxembourg
Grand Duchy of Luxembourg
Austria and Eastern Europe Distributor
HSBC Trinkaus & Burkhardt AG
Königsallee 21/23
D-40212 Düsseldorf
Germany
Continental Europe Distributor
HSBC Global Asset Management (France)
Immeuble “Coeur Défense” - Tour A
110 Esplanade du Général de Gaulle - La Défense 4
75419 Paris, Cedex 08
France
4
General Information (continued)
Distributors (continued) Hong Kong Representative and Distributor
HSBC Investment Funds (Hong Kong) Limited
HSBC Main Building, 1 Queen’s Road Central
Hong Kong
Jersey Representative and Distributor
HSBC Bank plc, Jersey Branch
HSBC House, Esplanade, St Helier
Jersey JE4 8WP
Channel Islands
Middle East Distributor
HSBC Bank Middle East Limited
HSBC House, Esplanade, St Helier
Jersey JE4 8UB
Channel Islands
Singapore Representative and Distributor
HSBC Global Asset Management (Singapore) Limited
21 Collyer Quay, #06-01 HSBC Building
Singapore 049320
Singapore
United Kingdom Representative and Distributor
HSBC Global Asset Management (UK) Limited
8 Canada Square
London E14 5HQ
United Kingdom
Malta Distributor
HSBC Global Asset Management (Malta) Ltd
80 Mill Street,
Qormi, QRM 3101
Malta
Poland Representative
ProService Agent Transferowy Sp. Z.o.o.
436 Pulawska Street,
Warszawa
Poland
5
General Information (continued)
Note on the risk management
HSBC Investment Funds (Luxembourg) S.A. (the “Management Company”) uses a risk management process that allows monitoring of the risk of
the portfolio positions and their share of the overall risk profile of the portfolios of HSBC Portfolios (the “Company”) at any time. In accordance
with the Law of 17 December 2010 on undertakings for collective investment, as amended (the “2010 Law”), and the applicable regulatory
requirements of the Commission de Surveillance du Secteur Financier (“CSSF”), the Management Company reports to the CSSF on a regular
basis on the risk management process. The Management Company shall monitor, on the basis of appropriate and reasonable methods, that the
Company’s global exposure relating to derivative instruments does not exceed the total net asset value of its portfolio.
For the Company, the Management Company uses the “commitment approach” for the calculation of the global exposure. The “commitment
approach” is based on converting the value of each financial derivative instrument position into the market value of an equivalent position in the
underlying asset of that derivative. Netting and hedging might be considered for derivative financial instruments and their underlying assets. The
sum of these underlying equivalents must not exceed the net asset value of the portfolio.
Statement of changes in the investment portfolio A list, specifying for each portfolio total purchases and sales transacted during the year under review, may be obtained, upon request, at the
registered office of the Company.

6
Directors’ Report
Directors’ Comments The Board of Directors present the Audited Annual Report for HSBC Portfolios (the “Company”) for the year ending 31 July 2017. The Company The Company is a variable capital investment company, incorporated under the laws of the Grand Duchy of Luxembourg and is organized as an
“umbrella” with a number of Portfolios, each of which has their own investment policies and restrictions. At present, the Company has issued shares in 5 Portfolios. During the year, total net assets of the Company increased from USD 2,605.62 million to USD 2,800.83 million at year end.
The Company qualifies as an Undertaking for Collective Investments in Transferable Securities under Directive 2009/65/EC of 13 July 2009, as
amended, and may therefore be offered for sale in European Union Member States, subject to registration in countries other than the Grand Duchy of Luxembourg. In addition, applications to register the Company and its Portfolios may be made in other countries. The Company and its Portfolios
are currently registered for offer and distribution in the Grand Duchy of Luxembourg and in the following jurisdictions: Bahrain, Brunei, France,
Germany, Greece, Guernsey, Hong Kong, Isle of Man, Japan, Jersey, Jordan, Lebanon, Macau, Malta, Oman, Qatar, Singapore, United Arab Emirates, United Kingdom and Vietnam.
Responsibility of the Directors The responsibility of the Directors of the Company is governed exclusively by Luxembourg law. With respect to these financial statements, the
duties of the Directors are governed by general corporate law and the law of 19 December 2002 on, inter alia, the accounting and annual accounts
of undertakings, as amended, and by the law of 17 December 2010, as amended, relating to undertakings for collective investments.
Remuneration Policy HSBC Investment Funds (Luxembourg) S.A. (“HIFL”) has implemented a remuneration policy pursuant to Directive 2014/91/EU of the European
Parliament and of the Council of 23 July 2014 amending Directive 2009/65/EC on the coordination of laws, regulations and administrative
provisions relating to undertakings for collective investment in transferable securities (UCITS) as regards to depositary functions, remuneration policies and sanctions (the “UCITS V Directive”), which was transposed into Luxembourg law on 1 June 2016 by way of the Luxembourg law of
10 May 2016.
The remuneration policy, which has been approved by HIFL’s board of directors, includes measures to avoid conflicts of interest and seeks to
promote sound and effective risk management that neither encourages risk taking which is inconsistent with the risk profile and articles of incorporation of the Company nor impairs compliance with HIFL’s duty to act in the best interest of the Company.
The remuneration policy, which describes how remuneration and benefits are determined, is available at
www.global.assetmanagement.hsbc.com/about-us/governance-structure, or on request from HIFL.
Total amount of remuneration paid by HIFL to its staff during the 12 months period ending 31 July 2017 is as follows:
Fixed remuneration EUR 1,595,351
Variable remuneration EUR 205,088
Number of beneficiaries 17
of which, the disclosure of the fixed and variable remuneration of senior management is:
Fixed remuneration EUR 501,534
Variable remuneration EUR 94,164
Number of beneficiaries 3
The annual review of the remuneration policy, including a review of the existing remuneration structure as well as implementation of the regulatory
requirements and compliance with them, was completed during the period and no irregularities were identified. Furthermore, there were no material
changes made to the remuneration policy in the past financial year.
Corporate Governance Statement
The Board of Directors confirms its adoption of the principles of the ALFI (Association of the Luxembourg Fund Industry) Code of Conduct for Luxembourg Investment Funds.
Annual General Meeting
The next Annual General Meeting of the Company will be held on 24 November 2017.
7
Directors’ Report (continued)
Market review
Overview
The year under review was characterised by a continuing economic recovery in most regions, as well as improving corporate earnings and record-
high stock market gains for many of the world’s major indexes. For the 12 months that ended 31 July 2017, emerging markets soundly
outperformed developed markets, and in regional terms, both developed and emerging economies in Asia were the strongest gainers.
As the period got underway, financial markets around the world had recovered from the shock result of the Brexit referendum – the UK’s decision
to leave the European Union (EU) – although the effect on sterling continued to be drastic, with the currency at one point hitting a 30-year low.
Politics remained at the forefront in the UK throughout the year under review: Article 50 was invoked in March, signalling the official launch of the
Brexit process. Prime Minister Theresa May subsequently called a snap general election in June 2017, a gamble that backfired somewhat as the
Conservatives failed to keep their majority. Brexit negotiations resumed in July and remained contentious.
The year had started with investors concerned about the future viability of the eurozone, in the aftermath of Brexit and as the prominence of euro-
sceptic candidates suggested the possibility of referendums on EU membership in several countries. However, by the end of the first half of 2017,
the region had recorded some of the strongest stock market gains in the world, fuelled by encouraging economic data and the political victory of
centrist, pro-EU candidates in France and the Netherlands.
Following the November 2016 election of Donald Trump in the US, investors anticipated a slate of changes from the new president going into the
new year – which were expected to include protectionist trade measures, healthcare reform and fiscal stimulus policy, such as tax cuts and
increased government spending. This drove developed markets higher, while emerging markets posted losses in the last quarter of 2016, amid
concerns about the potential effects of Trump’s protectionist policies. However, the so-called ‘Trump trade’ did not fully materialise, with the new
administration remaining mired in controversies and failing to pass major legislation, contributing to an emerging markets rally that extended
throughout the first half of 2017. Developed markets also continued to make gains, supported by improving economic growth and corporate
earnings.
In Asia, stock markets posted strong advances over the period, as investors seemed to shake off fears of trade protectionism under President
Trump and were further supported by increased foreign investment, a weaker US dollar and strengthening economic data throughout the region.
Among developed Asian markets, Hong Kong, Japan and Singapore saw solid gains, while emerging Asian markets recorded some of the best
returns seen globally over the 12-month period. In South Korea, a smooth political transition, combined with strong demand for IT/mobile memory
products, boosted shares. Meanwhile, in China, equity markets were boosted by rapid economic expansion. Emerging markets in Latin America
also performed well; despite political upheaval, Brazil began to emerge from a prolonged recession, and several South American nations benefited
from rising commodity prices.
Given the strengthening economic outlook, central banks were on divergent paths for most of the period: some remained accommodative (such
as the Bank of Japan, which maintained its negative interest rates), while the US Federal Reserve (Fed) raised rates three times during the year.
Towards the end of the review period, however, there was increased alignment, with the European Central Bank in particular perceived as
becoming more hawkish, as it discussed plans to wind down its quantitative easing programme. Moreover, the Fed – which had previously
indicated another two hikes would be enacted in the second half of 2017 – softened its tone on rates but said it would soon begin to pay down its
massive $4.5 trillion balance sheet.
8
Directors’ Report (continued)
Market review (continued)
Funds - World Selection Portfolios 1-5
The period started on a strong footing with low market volatility providing support for global financial markets. Global equities gained, as both
earnings expectations and broader risk sentiment were boosted by improving cyclical macro data, renewed policy support and recovering
commodity prices. The fourth quarter of 2016 was defined by the surprise victory of Donald Trump in the US Presidential election, as well as the
second increase in US interest rates since the global financial crisis. Global equities moved higher, supported by further weakness in the pound,
while the sell-off in developed market government bonds continued.
In September, we reduced the global high yield bond overweight position following a period of strong performance. The proceeds were reinvested
in global and emerging market equities in the lower risk Portfolios and US and emerging market equities in the higher risk Portfolios. As a result,
we moved to a slight overweight overall equity position. In addition, we trimmed the underweight position in emerging market debt hard currency.
This was primarily funded from cash. In the final quarter of 2016, we also introduced a new tactical position in global financials due to attractive
valuations and developments in global central bank policy. The position was funded by a reduction of our tactical overweight position in European
equities. Finally in November we further reduced our exposure to global high yield, with the proceeds used to increase the overweight position in
local currency emerging market bonds.
Financial markets continued their positive momentum in the first quarter of 2017. Positive global macroeconomic data and upbeat corporate
earnings supported global equities, which increased 6.91% over the period in dollar terms. Q1 2017 was a positive period for World Selection
Portfolio performance, with all strategies benefitting from positive equity market returns, but weak government bond performance weighed on the
performance of the lower risk portfolios.
The Strategic Asset Allocation was reviewed at the beginning of March 2017. On the tactical basis, the overweight to European equities has been
increased. In hard currency emerging market debt the tactical positioning was changed from underweight to neutral due to relative attractiveness
of emerging markets. In April, a new position in Indian bonds was added to local emerging market debt allocation due to a positive domestic
outlook.
The second quarter of 2017 started in a similar vein to the first one, with robust economic data releases and upbeat earnings reports helping
global equities deliver positive returns in April and May, marking seven consecutive months of positive global equity returns. However, global
equities were little changed in June, with concerns over tightening of global monetary policy being offset by data showing robust economic activity.
The second quarter of 2017 was again a positive period for World Selection Portfolios performance, with all strategies benefitting from moderately
positive equity market returns. Weak government bond returns continued to weigh on the performance of the lower risk portfolios. May saw the
portfolio management team trim and then close the short duration high yield and global financials positions. The short duration high yield trade
was originally opened in order to earn the high carry that high yield bonds offered with a lower duration (interest-rate) risk. As spreads compressed,
the reward available for taking this credit risk declined, and we sold this position at a profit. Our research had indicated that global financials
represented good value and were under-owned by the investment community. Financials benefit when global yield curves rise, and we felt this
was likely, given inflation data and strong economic growth. Having experienced outperformance since putting this trade on in October 2016, our
analysis of the market indicated that this theme had played out and we had less conviction of further gains from the position. We therefore took
the profits from this trade and re-invested the proceeds into equities, with a tilt towards European and Japanese markets.
The review period concluded on a good note, with the upbeat tone continuing in global markets in July. Global equities continued on their upward
trajectory, supported by investor perceptions of a more dovish US Federal Reserve.
PricewaterhouseCoopers, Société coopérative, 2 rue Gerhard Mercator, B.P. 1443, L-1014 Luxembourg T : +352 494848 1, F : +352 494848 2900, www.pwc.lu
Cabinet de révision agréé. Expert-comptable (autorisation gouvernementale n°10028256) R.C.S. Luxembourg B 65 477 - TVA LU25482518
9
Audit report To the Shareholders of HSBC Portfolios Our opinion In our opinion, the accompanying financial statements give a true and fair view of the financial position of HSBC Portfolios and of each of its Portfolios (the “Fund”) as at 31 July 2017, and of the results of their operations and changes in their net assets for the year then ended in accordance with Luxembourg legal and regulatory requirements relating to the preparation and presentation of the financial statements. What we have audited The Fund’s financial statements comprise: the Statement of Net Assets as at 31 July 2017; the Schedule of Investments and Other Net Assets as at 31 July 2017; the Statement of Operations and the Statement of Changes in Net Assets for the year then ended; and the notes to the financial statements, which include a summary of significant accounting policies. Basis for opinion We conducted our audit in accordance with the Law of 23 July 2016 on the audit profession (Law of 23 July 2016) and with International Standards on Auditing (ISAs) as adopted for Luxembourg by the “Commission de Surveillance du Secteur Financier” (CSSF). Our responsibilities under those Law and standards are further described in the “Responsibilities of the “Réviseur d’entreprises agréé” for the audit of the financial statements” section of our report. We believe that the audit evidence we have obtained is sufficient and appropriate to provide a basis for our opinion.

10
We are independent of the Fund in accordance with the International Ethics Standards Board for Accountants’ Code of Ethics for Professional Accountants (IESBA Code) as adopted for Luxembourg by the CSSF together with the ethical requirements that are relevant to our audit of the financial statements. We have fulfilled our other ethical responsibilities under those ethical requirements. Other information The Board of Directors of the Fund is responsible for the other information. The other information comprises the information included in the annual report but does not include the financial statements and our audit report thereon. Our opinion on the financial statements does not cover the other information and we do not express any form of assurance conclusion thereon. In connection with our audit of the financial statements, our responsibility is to read the other information identified above and, in doing so, consider whether the other information is materially inconsistent with the financial statements or our knowledge obtained in the audit, or otherwise appears to be materially misstated. If, based on the work we have performed, we conclude that there is a material misstatement of this other information, we are required to report that fact. We have nothing to report in this regard. Responsibilities of the Board of Directors of the Fund and those charged with governance for the financial statements The Board of Directors of the Fund is responsible for the preparation and fair presentation of the financial statements in accordance with Luxembourg legal and regulatory requirements relating to the preparation and presentation of the financial statements, and for such internal control as the Board of Directors of the Fund determines is necessary to enable the preparation of financial statements that are free from material misstatement, whether due to fraud or error. In preparing the financial statements, the Board of Directors of the Fund is responsible for assessing the Fund’s ability to continue as a going concern, disclosing, as applicable, matters related to going concern and using the going concern basis of accounting unless the Board of Directors of the Fund either intends to liquidate the Fund or to cease operations, or has no realistic alternative but to do so. Those charged with governance are responsible for overseeing the Fund’s financial reporting process.
11
Responsibilities of the “Réviseur d’entreprises agréé” for the audit of the financial statements The objectives of our audit are to obtain reasonable assurance about whether the financial statements as a whole are free from material misstatement, whether due to fraud or error, and to issue an audit report that includes our opinion. Reasonable assurance is a high level of assurance, but is not a guarantee that an audit conducted in accordance with the Law of 23 July 2016 and with ISAs as adopted for Luxembourg by the CSSF will always detect a material misstatement when it exists. Misstatements can arise from fraud or error and are considered material if, individually or in the aggregate, they could reasonably be expected to influence the economic decisions of users taken on the basis of these financial statements. As part of an audit in accordance with the Law of 23 July 2016 and with ISAs as adopted for Luxembourg by the CSSF, we exercise professional judgment and maintain professional scepticism throughout the audit. We also: identify and assess the risks of material misstatement of the financial statements, whether due to
fraud or error, design and perform audit procedures responsive to those risks, and obtain audit evidence that is sufficient and appropriate to provide a basis for our opinion. The risk of not detecting a material misstatement resulting from fraud is higher than for one resulting from error, as fraud may involve collusion, forgery, intentional omissions, misrepresentations, or the override of internal control;
obtain an understanding of internal control relevant to the audit in order to design audit procedures that are appropriate in the circumstances, but not for the purpose of expressing an opinion on the effectiveness of the Fund’s internal control;
evaluate the appropriateness of accounting policies used and the reasonableness of accounting
estimates and related disclosures made by the Board of Directors of the Fund; conclude on the appropriateness of the Board of Directors of the Fund’s use of the going concern
basis of accounting and, based on the audit evidence obtained, whether a material uncertainty exists related to events or conditions that may cast significant doubt on the Fund’s ability to continue as a going concern. If we conclude that a material uncertainty exists, we are required to draw attention in our audit report to the related disclosures in the financial statements or, if such disclosures are inadequate, to modify our opinion. Our conclusions are based on the audit evidence obtained up to the date of our audit report. However, future events or conditions may cause the Fund to cease to continue as a going concern;
evaluate the overall presentation, structure and content of the financial statements, including the
disclosures, and whether the financial statements represent the underlying transactions and events in a manner that achieves fair presentation.
-pwc
We communicate with those charged with governance regarding, among other matters, the plannedscope and timing of the audit and significant audit findings, including any significant deficiencies ininternal control that we identiff during our audit.
Luxembourg, 30 October 2017
13
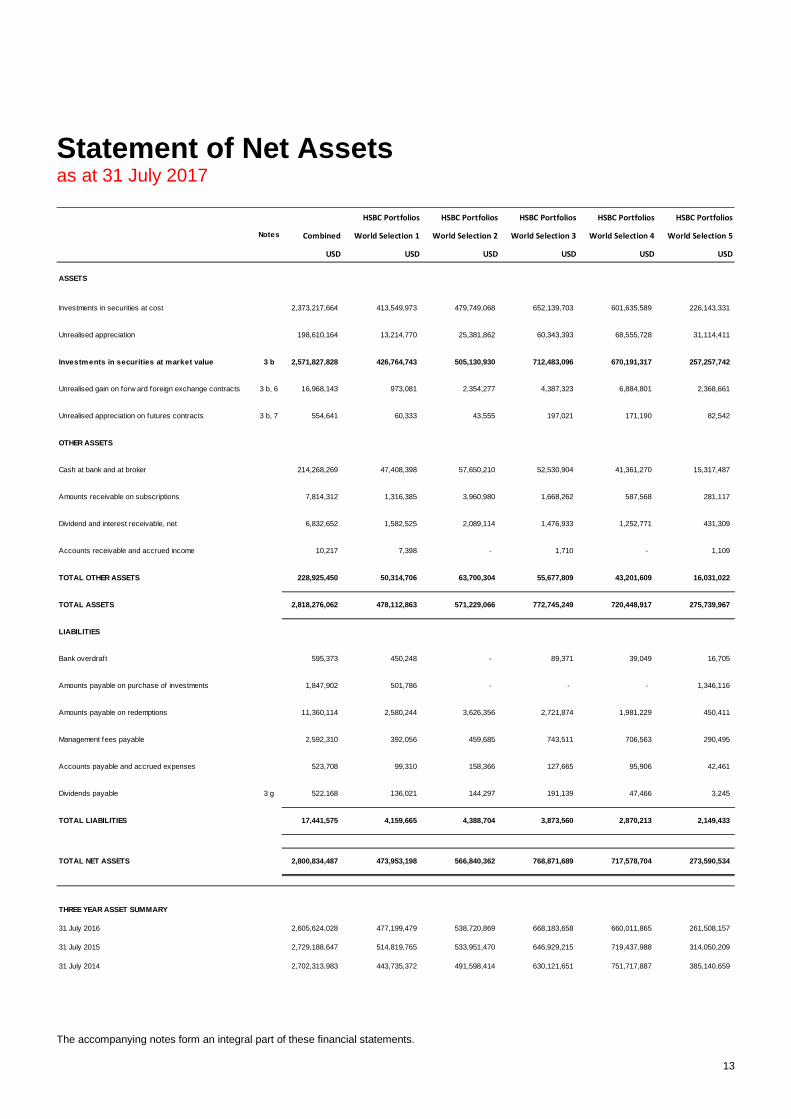
Statement of Net Assetsas at 31 July 2017
The accompanying notes form an integral part of these financial statements.
HSBC Portfolios HSBC Portfolios HSBC Portfolios HSBC Portfolios HSBC Portfolios
Notes Combined World Selection 1 World Selection 2 World Selection 3 World Selection 4 World Selection 5
USD USD USD USD USD USD
ASSETS
Investments in securities at cost 2,373,217,664 413,549,973 479,749,068 652,139,703 601,635,589 226,143,331
Unrealised appreciation 198,610,164 13,214,770 25,381,862 60,343,393 68,555,728 31,114,411
Investments in securities at market value 3 b 2,571,827,828 426,764,743 505,130,930 712,483,096 670,191,317 257,257,742
Unrealised gain on forw ard foreign exchange contracts 3 b, 6 16,968,143 973,081 2,354,277 4,387,323 6,884,801 2,368,661
Unrealised appreciation on futures contracts 3 b, 7 554,641 60,333 43,555 197,021 171,190 82,542
OTHER ASSETS
Cash at bank and at broker 214,268,269 47,408,398 57,650,210 52,530,904 41,361,270 15,317,487
Amounts receivable on subscriptions 7,814,312 1,316,385 3,960,980 1,668,262 587,568 281,117
Dividend and interest receivable, net 6,832,652 1,582,525 2,089,114 1,476,933 1,252,771 431,309
Accounts receivable and accrued income 10,217 7,398 - 1,710 - 1,109
TOTAL OTHER ASSETS 228,925,450 50,314,706 63,700,304 55,677,809 43,201,609 16,031,022
TOTAL ASSETS 2,818,276,062 478,112,863 571,229,066 772,745,249 720,448,917 275,739,967
LIABILITIES
Bank overdraft 595,373 450,248 - 89,371 39,049 16,705
Amounts payable on purchase of investments 1,847,902 501,786 - - - 1,346,116
Amounts payable on redemptions 11,360,114 2,580,244 3,626,356 2,721,874 1,981,229 450,411
Management fees payable 2,592,310 392,056 459,685 743,511 706,563 290,495
Accounts payable and accrued expenses 523,708 99,310 158,366 127,665 95,906 42,461
Dividends payable 3 g 522,168 136,021 144,297 191,139 47,466 3,245
TOTAL LIABILITIES 17,441,575 4,159,665 4,388,704 3,873,560 2,870,213 2,149,433
TOTAL NET ASSETS 2,800,834,487 473,953,198 566,840,362 768,871,689 717,578,704 273,590,534
THREE YEAR ASSET SUMMARY
31 July 2016 2,605,624,028 477,199,479 538,720,869 668,183,658 660,011,865 261,508,157
31 July 2015 2,729,188,647 514,819,765 533,951,470 646,929,215 719,437,988 314,050,209
31 July 2014 2,702,313,983 443,735,372 491,598,414 630,121,651 751,717,887 385,140,659

14
Statement of Operationsfor the year ended 31 July 2017
The accompanying notes form an integral part of these financial statements.
HSBC Portfolios HSBC Portfolios HSBC Portfolios HSBC Portfolios HSBC Portfolios
Notes Combined World Selection 1 World Selection 2 World Selection 3 World Selection 4 World Selection 5
USD USD USD USD USD USD
INCOME
Income from investments 3 c 47,435,242 9,667,021 12,157,401 12,744,679 10,409,944 2,456,197
Deposit interest 65,827 21,508 19,748 13,388 7,445 3,738
TOTAL INCOME 47,501,069 9,688,529 12,177,149 12,758,067 10,417,389 2,459,935
EXPENSES
Management fees 4 a 28,431,814 4,491,675 5,100,223 7,860,153 7,742,546 3,237,217
Operating, administrative and servicing expenses 4 b 5,479,645 1,138,425 1,434,588 1,224,086 1,081,241 601,305
Bank interest and charges 135,279 25,069 30,548 32,565 29,963 17,134
TOTAL EXPENSES 34,046,738 5,655,169 6,565,359 9,116,804 8,853,750 3,855,656
NET OPERATING PROFIT / (LOSS) FOR THE YEAR 13,454,331 4,033,360 5,611,790 3,641,263 1,563,639 (1,395,721)
15
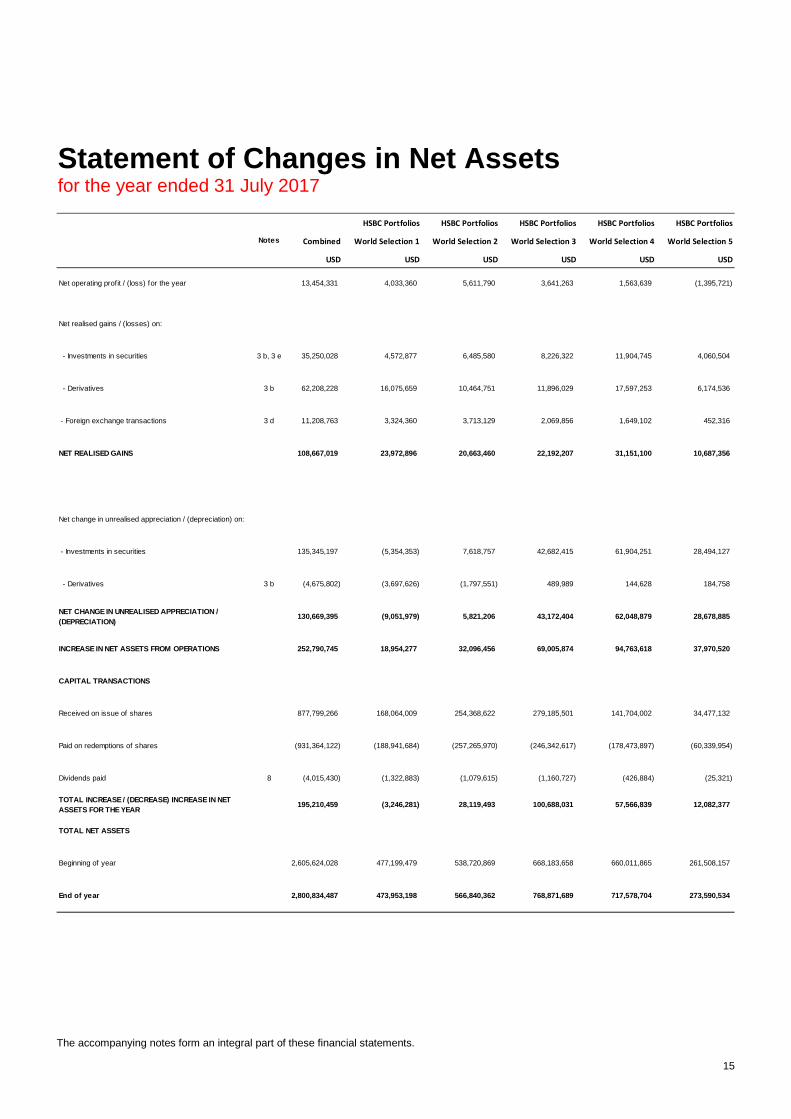
Statement of Changes in Net Assetsfor the year ended 31 July 2017
The accompanying notes form an integral part of these financial statements.
HSBC Portfolios HSBC Portfolios HSBC Portfolios HSBC Portfolios HSBC Portfolios
Notes Combined World Selection 1 World Selection 2 World Selection 3 World Selection 4 World Selection 5
USD USD USD USD USD USD
Net operating profit / (loss) for the year 13,454,331 4,033,360 5,611,790 3,641,263 1,563,639 (1,395,721)
Net realised gains / (losses) on:
- Investments in securities 3 b, 3 e 35,250,028 4,572,877 6,485,580 8,226,322 11,904,745 4,060,504
- Derivatives 3 b 62,208,228 16,075,659 10,464,751 11,896,029 17,597,253 6,174,536
- Foreign exchange transactions 3 d 11,208,763 3,324,360 3,713,129 2,069,856 1,649,102 452,316
NET REALISED GAINS 108,667,019 23,972,896 20,663,460 22,192,207 31,151,100 10,687,356
Net change in unrealised appreciation / (depreciation) on:
- Investments in securities 135,345,197 (5,354,353) 7,618,757 42,682,415 61,904,251 28,494,127
- Derivatives 3 b (4,675,802) (3,697,626) (1,797,551) 489,989 144,628 184,758
NET CHANGE IN UNREALISED APPRECIATION /
(DEPRECIATION)130,669,395 (9,051,979) 5,821,206 43,172,404 62,048,879 28,678,885
INCREASE IN NET ASSETS FROM OPERATIONS 252,790,745 18,954,277 32,096,456 69,005,874 94,763,618 37,970,520
CAPITAL TRANSACTIONS
Received on issue of shares 877,799,266 168,064,009 254,368,622 279,185,501 141,704,002 34,477,132
Paid on redemptions of shares (931,364,122) (188,941,684) (257,265,970) (246,342,617) (178,473,897) (60,339,954)
Dividends paid 8 (4,015,430) (1,322,883) (1,079,615) (1,160,727) (426,884) (25,321)
TOTAL INCREASE / (DECREASE) INCREASE IN NET
ASSETS FOR THE YEAR195,210,459 (3,246,281) 28,119,493 100,688,031 57,566,839 12,082,377
TOTAL NET ASSETS
Beginning of year 2,605,624,028 477,199,479 538,720,869 668,183,658 660,011,865 261,508,157
End of year 2,800,834,487 473,953,198 566,840,362 768,871,689 717,578,704 273,590,534
16
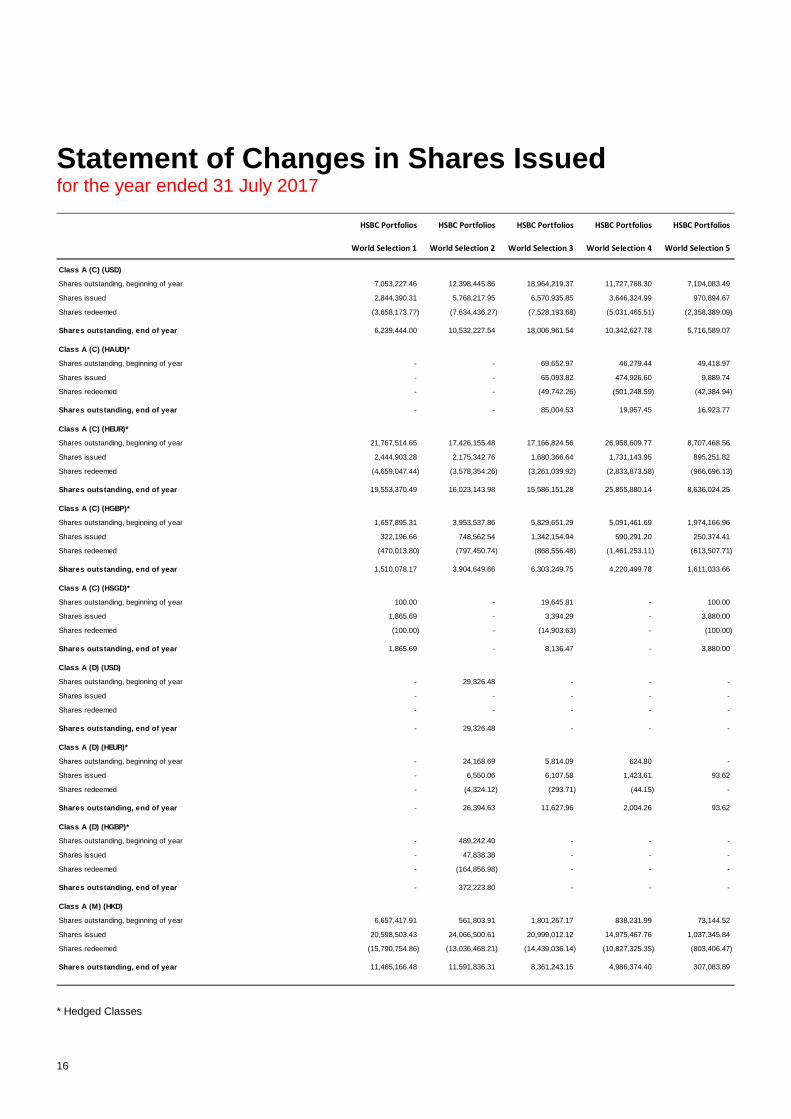
Statement of Changes in Shares Issuedfor the year ended 31 July 2017
* Hedged Classes
HSBC Portfolios HSBC Portfolios HSBC Portfolios HSBC Portfolios HSBC Portfolios
World Selection 1 World Selection 2 World Selection 3 World Selection 4 World Selection 5
Class A (C) (USD)
Shares outstanding, beginning of year 7,053,227.46 12,398,445.86 18,964,219.37 11,727,768.30 7,104,083.49
Shares issued 2,844,390.31 5,768,217.95 6,570,935.85 3,646,324.99 970,894.67
Shares redeemed (3,658,173.77) (7,634,436.27) (7,528,193.68) (5,031,465.51) (2,358,389.09)
Shares outstanding, end of year 6,239,444.00 10,532,227.54 18,006,961.54 10,342,627.78 5,716,589.07
Class A (C) (HAUD)*
Shares outstanding, beginning of year - - 69,652.97 46,279.44 49,418.97
Shares issued - - 65,093.82 474,926.60 9,889.74
Shares redeemed - - (49,742.26) (501,248.59) (42,384.94)
Shares outstanding, end of year - - 85,004.53 19,957.45 16,923.77
Class A (C) (HEUR)*
Shares outstanding, beginning of year 21,767,514.65 17,426,155.48 17,166,824.56 26,958,609.77 8,707,468.56
Shares issued 2,444,903.28 2,175,342.76 1,680,366.64 1,731,143.95 895,251.82
Shares redeemed (4,659,047.44) (3,578,354.26) (3,261,039.92) (2,833,873.58) (966,696.13)
Shares outstanding, end of year 19,553,370.49 16,023,143.98 15,586,151.28 25,855,880.14 8,636,024.25
Class A (C) (HGBP)*
Shares outstanding, beginning of year 1,657,895.31 3,953,537.86 5,829,651.29 5,091,461.69 1,974,166.96
Shares issued 322,196.66 748,562.54 1,342,154.94 590,291.20 250,374.41
Shares redeemed (470,013.80) (797,450.74) (868,556.48) (1,461,253.11) (613,507.71)
Shares outstanding, end of year 1,510,078.17 3,904,649.66 6,303,249.75 4,220,499.78 1,611,033.66
Class A (C) (HSGD)*
Shares outstanding, beginning of year 100.00 - 19,645.81 - 100.00
Shares issued 1,865.69 - 3,394.29 - 3,880.00
Shares redeemed (100.00) - (14,903.63) - (100.00)
Shares outstanding, end of year 1,865.69 - 8,136.47 - 3,880.00
Class A (D) (USD)
Shares outstanding, beginning of year - 29,326.48 - - -
Shares issued - - - - -
Shares redeemed - - - - -
Shares outstanding, end of year - 29,326.48 - - -
Class A (D) (HEUR)*
Shares outstanding, beginning of year - 24,168.69 5,814.09 624.80 -
Shares issued - 6,550.06 6,107.58 1,423.61 93.62
Shares redeemed - (4,324.12) (293.71) (44.15) -
Shares outstanding, end of year - 26,394.63 11,627.96 2,004.26 93.62
Class A (D) (HGBP)*
Shares outstanding, beginning of year - 489,242.40 - - -
Shares issued - 47,838.38 - - -
Shares redeemed - (164,856.98) - - -
Shares outstanding, end of year - 372,223.80 - - -
Class A (M) (HKD)
Shares outstanding, beginning of year 6,657,417.91 561,803.91 1,801,267.17 838,231.99 73,144.52
Shares issued 20,598,503.43 24,066,500.61 20,999,012.12 14,975,467.76 1,037,345.84
Shares redeemed (15,790,754.86) (13,036,468.21) (14,439,036.14) (10,827,325.35) (803,406.47)
Shares outstanding, end of year 11,465,166.48 11,591,836.31 8,361,243.15 4,986,374.40 307,083.89
17
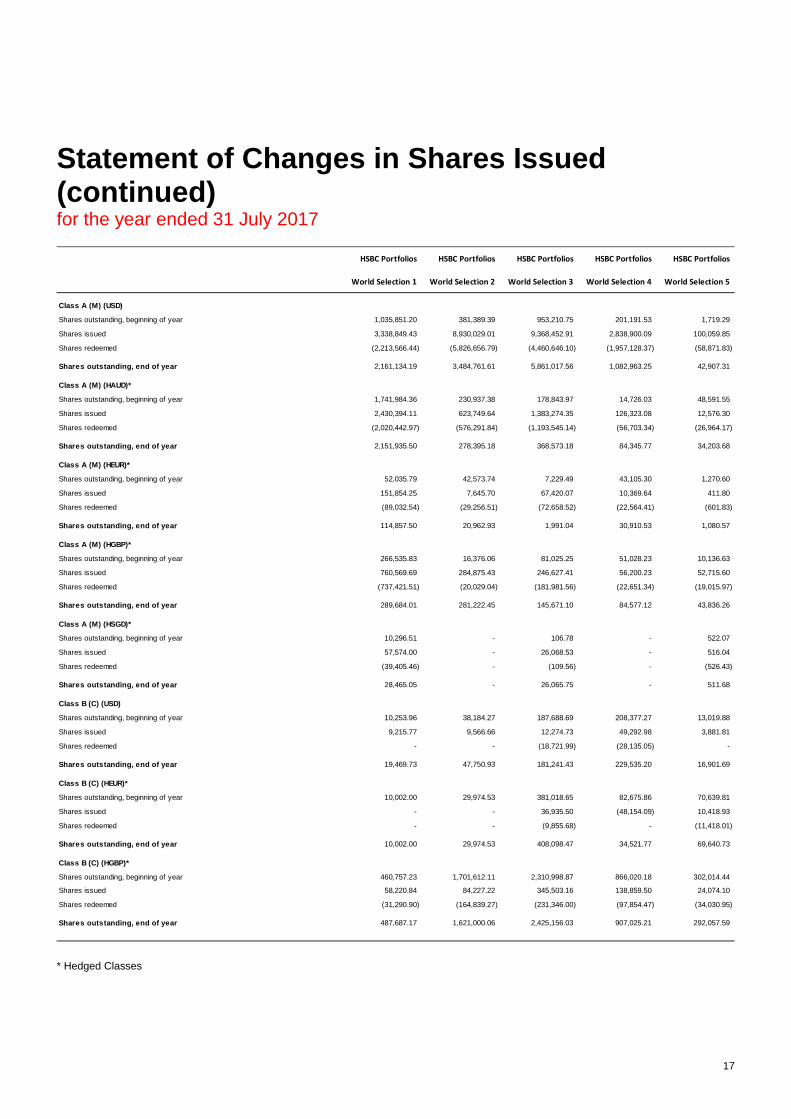
Statement of Changes in Shares Issued(continued)for the year ended 31 July 2017
* Hedged Classes
HSBC Portfolios HSBC Portfolios HSBC Portfolios HSBC Portfolios HSBC Portfolios
World Selection 1 World Selection 2 World Selection 3 World Selection 4 World Selection 5
Class A (M) (USD)
Shares outstanding, beginning of year 1,035,851.20 381,389.39 953,210.75 201,191.53 1,719.29
Shares issued 3,338,849.43 8,930,029.01 9,368,452.91 2,838,900.09 100,059.85
Shares redeemed (2,213,566.44) (5,826,656.79) (4,460,646.10) (1,957,128.37) (58,871.83)
Shares outstanding, end of year 2,161,134.19 3,484,761.61 5,861,017.56 1,082,963.25 42,907.31
Class A (M) (HAUD)*
Shares outstanding, beginning of year 1,741,984.36 230,937.38 178,843.97 14,726.03 48,591.55
Shares issued 2,430,394.11 623,749.64 1,383,274.35 126,323.08 12,576.30
Shares redeemed (2,020,442.97) (576,291.84) (1,193,545.14) (56,703.34) (26,964.17)
Shares outstanding, end of year 2,151,935.50 278,395.18 368,573.18 84,345.77 34,203.68
Class A (M) (HEUR)*
Shares outstanding, beginning of year 52,035.79 42,573.74 7,229.49 43,105.30 1,270.60
Shares issued 151,854.25 7,645.70 67,420.07 10,369.64 411.80
Shares redeemed (89,032.54) (29,256.51) (72,658.52) (22,564.41) (601.83)
Shares outstanding, end of year 114,857.50 20,962.93 1,991.04 30,910.53 1,080.57
Class A (M) (HGBP)*
Shares outstanding, beginning of year 266,535.83 16,376.06 81,025.25 51,028.23 10,136.63
Shares issued 760,569.69 284,875.43 246,627.41 56,200.23 52,715.60
Shares redeemed (737,421.51) (20,029.04) (181,981.56) (22,651.34) (19,015.97)
Shares outstanding, end of year 289,684.01 281,222.45 145,671.10 84,577.12 43,836.26
Class A (M) (HSGD)*
Shares outstanding, beginning of year 10,296.51 - 106.78 - 522.07
Shares issued 57,574.00 - 26,068.53 - 516.04
Shares redeemed (39,405.46) - (109.56) - (526.43)
Shares outstanding, end of year 28,465.05 - 26,065.75 - 511.68
Class B (C) (USD)
Shares outstanding, beginning of year 10,253.96 38,184.27 187,688.69 208,377.27 13,019.88
Shares issued 9,215.77 9,566.66 12,274.73 49,292.98 3,881.81
Shares redeemed - - (18,721.99) (28,135.05) -
Shares outstanding, end of year 19,469.73 47,750.93 181,241.43 229,535.20 16,901.69
Class B (C) (HEUR)*
Shares outstanding, beginning of year 10,002.00 29,974.53 381,018.65 82,675.86 70,639.81
Shares issued - - 36,935.50 (48,154.09) 10,418.93
Shares redeemed - - (9,855.68) - (11,418.01)
Shares outstanding, end of year 10,002.00 29,974.53 408,098.47 34,521.77 69,640.73
Class B (C) (HGBP)*
Shares outstanding, beginning of year 460,757.23 1,701,612.11 2,310,998.87 866,020.18 302,014.44
Shares issued 58,220.84 84,227.22 345,503.16 138,859.50 24,074.10
Shares redeemed (31,290.90) (164,839.27) (231,346.00) (97,854.47) (34,030.95)
Shares outstanding, end of year 487,687.17 1,621,000.06 2,425,156.03 907,025.21 292,057.59
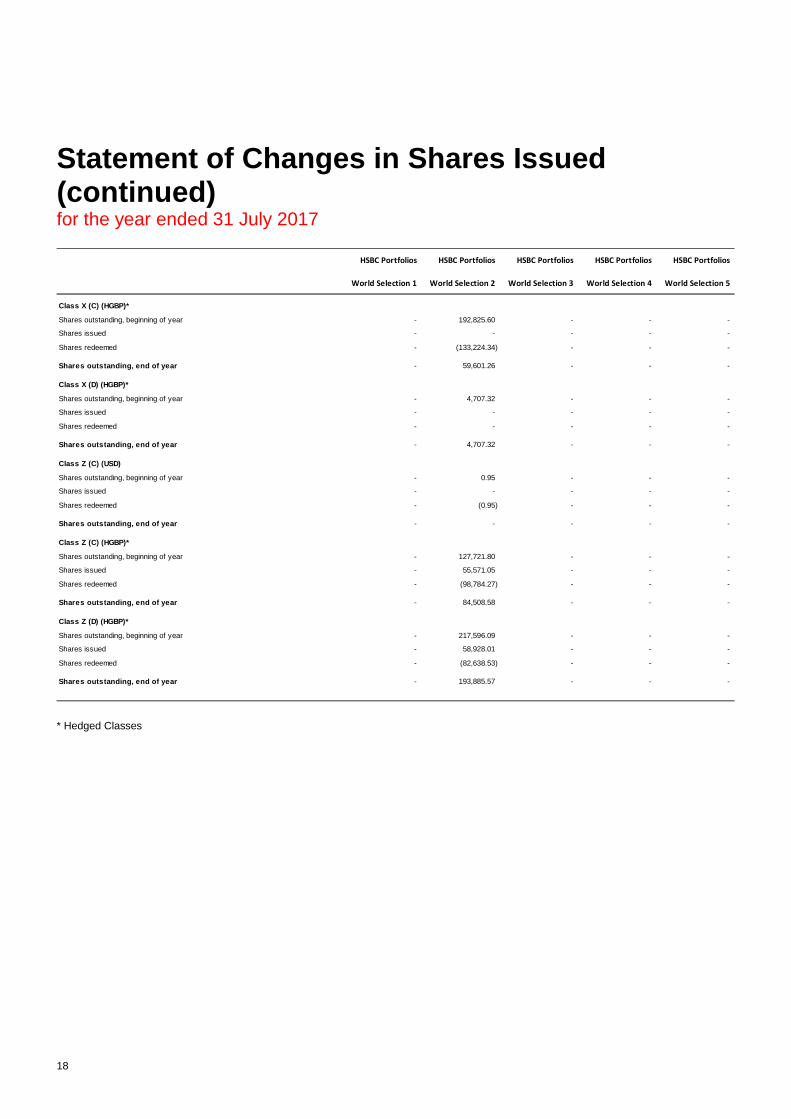
18
Statement of Changes in Shares Issued(continued)for the year ended 31 July 2017
* Hedged Classes
HSBC Portfolios HSBC Portfolios HSBC Portfolios HSBC Portfolios HSBC Portfolios
World Selection 1 World Selection 2 World Selection 3 World Selection 4 World Selection 5
Class X (C) (HGBP)*
Shares outstanding, beginning of year - 192,825.60 - - -
Shares issued - - - - -
Shares redeemed - (133,224.34) - - -
Shares outstanding, end of year - 59,601.26 - - -
Class X (D) (HGBP)*
Shares outstanding, beginning of year - 4,707.32 - - -
Shares issued - - - - -
Shares redeemed - - - - -
Shares outstanding, end of year - 4,707.32 - - -
Class Z (C) (USD)
Shares outstanding, beginning of year - 0.95 - - -
Shares issued - - - - -
Shares redeemed - (0.95) - - -
Shares outstanding, end of year - - - - -
Class Z (C) (HGBP)*
Shares outstanding, beginning of year - 127,721.80 - - -
Shares issued - 55,571.05 - - -
Shares redeemed - (98,784.27) - - -
Shares outstanding, end of year - 84,508.58 - - -
Class Z (D) (HGBP)*
Shares outstanding, beginning of year - 217,596.09 - - -
Shares issued - 58,928.01 - - -
Shares redeemed - (82,638.53) - - -
Shares outstanding, end of year - 193,885.57 - - -
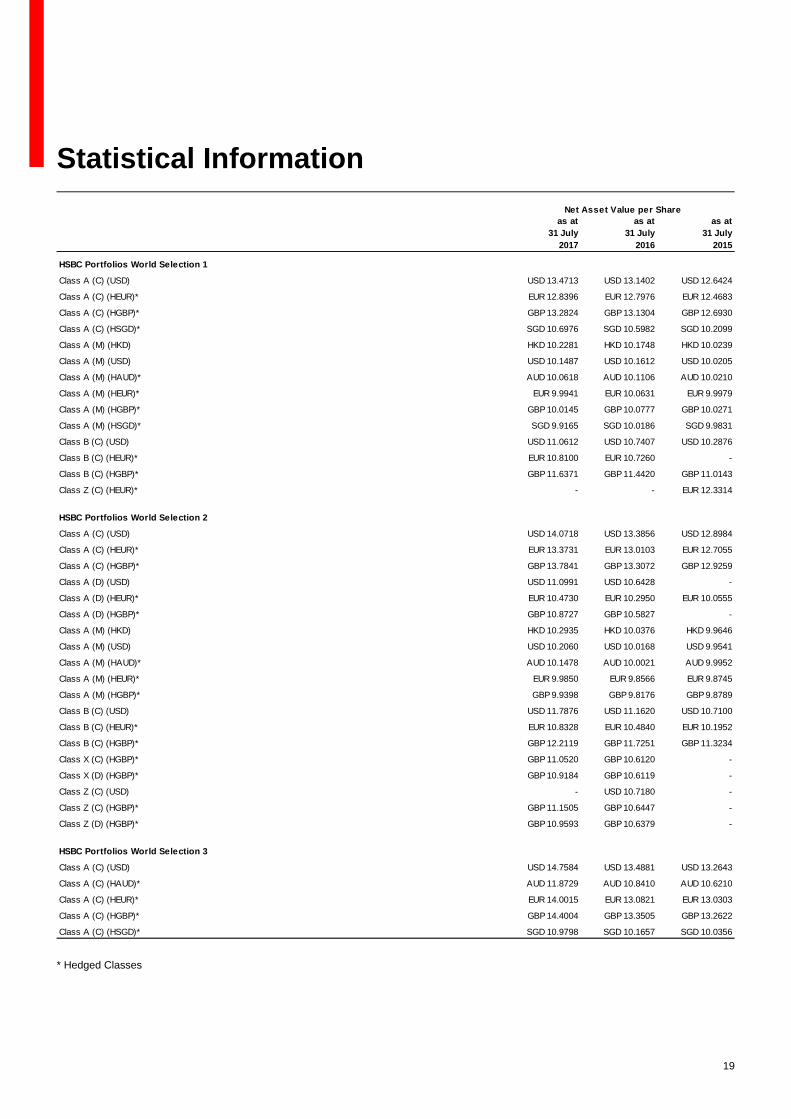
19
Statistical Information
* Hedged Classes
as at
31 July
2017
as at
31 July
2016
as at
31 July
2015
HSBC Portfolios World Selection 1
Class A (C) (USD) USD 13.4713 USD 13.1402 USD 12.6424
Class A (C) (HEUR)* EUR 12.8396 EUR 12.7976 EUR 12.4683
Class A (C) (HGBP)* GBP 13.2824 GBP 13.1304 GBP 12.6930
Class A (C) (HSGD)* SGD 10.6976 SGD 10.5982 SGD 10.2099
Class A (M) (HKD) HKD 10.2281 HKD 10.1748 HKD 10.0239
Class A (M) (USD) USD 10.1487 USD 10.1612 USD 10.0205
Class A (M) (HAUD)* AUD 10.0618 AUD 10.1106 AUD 10.0210
Class A (M) (HEUR)* EUR 9.9941 EUR 10.0631 EUR 9.9979
Class A (M) (HGBP)* GBP 10.0145 GBP 10.0777 GBP 10.0271
Class A (M) (HSGD)* SGD 9.9165 SGD 10.0186 SGD 9.9831
Class B (C) (USD) USD 11.0612 USD 10.7407 USD 10.2876
Class B (C) (HEUR)* EUR 10.8100 EUR 10.7260 -
Class B (C) (HGBP)* GBP 11.6371 GBP 11.4420 GBP 11.0143
Class Z (C) (HEUR)* - - EUR 12.3314
HSBC Portfolios World Selection 2
Class A (C) (USD) USD 14.0718 USD 13.3856 USD 12.8984
Class A (C) (HEUR)* EUR 13.3731 EUR 13.0103 EUR 12.7055
Class A (C) (HGBP)* GBP 13.7841 GBP 13.3072 GBP 12.9259
Class A (D) (USD) USD 11.0991 USD 10.6428 -
Class A (D) (HEUR)* EUR 10.4730 EUR 10.2950 EUR 10.0555
Class A (D) (HGBP)* GBP 10.8727 GBP 10.5827 -
Class A (M) (HKD) HKD 10.2935 HKD 10.0376 HKD 9.9646
Class A (M) (USD) USD 10.2060 USD 10.0168 USD 9.9541
Class A (M) (HAUD)* AUD 10.1478 AUD 10.0021 AUD 9.9952
Class A (M) (HEUR)* EUR 9.9850 EUR 9.8566 EUR 9.8745
Class A (M) (HGBP)* GBP 9.9398 GBP 9.8176 GBP 9.8789
Class B (C) (USD) USD 11.7876 USD 11.1620 USD 10.7100
Class B (C) (HEUR)* EUR 10.8328 EUR 10.4840 EUR 10.1952
Class B (C) (HGBP)* GBP 12.2119 GBP 11.7251 GBP 11.3234
Class X (C) (HGBP)* GBP 11.0520 GBP 10.6120 -
Class X (D) (HGBP)* GBP 10.9184 GBP 10.6119 -
Class Z (C) (USD) - USD 10.7180 -
Class Z (C) (HGBP)* GBP 11.1505 GBP 10.6447 -
Class Z (D) (HGBP)* GBP 10.9593 GBP 10.6379 -
HSBC Portfolios World Selection 3
Class A (C) (USD) USD 14.7584 USD 13.4881 USD 13.2643
Class A (C) (HAUD)* AUD 11.8729 AUD 10.8410 AUD 10.6210
Class A (C) (HEUR)* EUR 14.0015 EUR 13.0821 EUR 13.0303
Class A (C) (HGBP)* GBP 14.4004 GBP 13.3505 GBP 13.2622
Class A (C) (HSGD)* SGD 10.9798 SGD 10.1657 SGD 10.0356
Net Asset Value per Share
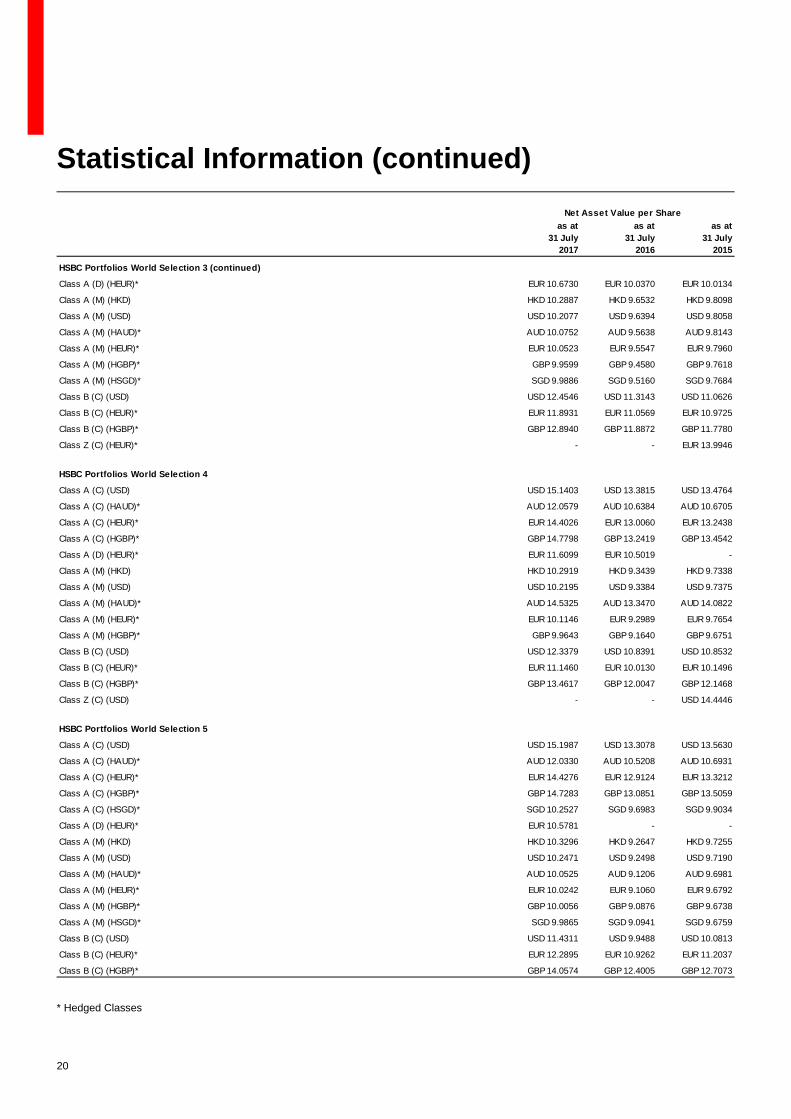
20
Statistical Information (continued)
* Hedged Classes
as at
31 July
2017
as at
31 July
2016
as at
31 July
2015
HSBC Portfolios World Selection 3 (continued)
Class A (D) (HEUR)* EUR 10.6730 EUR 10.0370 EUR 10.0134
Class A (M) (HKD) HKD 10.2887 HKD 9.6532 HKD 9.8098
Class A (M) (USD) USD 10.2077 USD 9.6394 USD 9.8058
Class A (M) (HAUD)* AUD 10.0752 AUD 9.5638 AUD 9.8143
Class A (M) (HEUR)* EUR 10.0523 EUR 9.5547 EUR 9.7960
Class A (M) (HGBP)* GBP 9.9599 GBP 9.4580 GBP 9.7618
Class A (M) (HSGD)* SGD 9.9886 SGD 9.5160 SGD 9.7684
Class B (C) (USD) USD 12.4546 USD 11.3143 USD 11.0626
Class B (C) (HEUR)* EUR 11.8931 EUR 11.0569 EUR 10.9725
Class B (C) (HGBP)* GBP 12.8940 GBP 11.8872 GBP 11.7780
Class Z (C) (HEUR)* - - EUR 13.9946
HSBC Portfolios World Selection 4
Class A (C) (USD) USD 15.1403 USD 13.3815 USD 13.4764
Class A (C) (HAUD)* AUD 12.0579 AUD 10.6384 AUD 10.6705
Class A (C) (HEUR)* EUR 14.4026 EUR 13.0060 EUR 13.2438
Class A (C) (HGBP)* GBP 14.7798 GBP 13.2419 GBP 13.4542
Class A (D) (HEUR)* EUR 11.6099 EUR 10.5019 -
Class A (M) (HKD) HKD 10.2919 HKD 9.3439 HKD 9.7338
Class A (M) (USD) USD 10.2195 USD 9.3384 USD 9.7375
Class A (M) (HAUD)* AUD 14.5325 AUD 13.3470 AUD 14.0822
Class A (M) (HEUR)* EUR 10.1146 EUR 9.2989 EUR 9.7654
Class A (M) (HGBP)* GBP 9.9643 GBP 9.1640 GBP 9.6751
Class B (C) (USD) USD 12.3379 USD 10.8391 USD 10.8532
Class B (C) (HEUR)* EUR 11.1460 EUR 10.0130 EUR 10.1496
Class B (C) (HGBP)* GBP 13.4617 GBP 12.0047 GBP 12.1468
Class Z (C) (USD) - - USD 14.4446
HSBC Portfolios World Selection 5
Class A (C) (USD) USD 15.1987 USD 13.3078 USD 13.5630
Class A (C) (HAUD)* AUD 12.0330 AUD 10.5208 AUD 10.6931
Class A (C) (HEUR)* EUR 14.4276 EUR 12.9124 EUR 13.3212
Class A (C) (HGBP)* GBP 14.7283 GBP 13.0851 GBP 13.5059
Class A (C) (HSGD)* SGD 10.2527 SGD 9.6983 SGD 9.9034
Class A (D) (HEUR)* EUR 10.5781 - -
Class A (M) (HKD) HKD 10.3296 HKD 9.2647 HKD 9.7255
Class A (M) (USD) USD 10.2471 USD 9.2498 USD 9.7190
Class A (M) (HAUD)* AUD 10.0525 AUD 9.1206 AUD 9.6981
Class A (M) (HEUR)* EUR 10.0242 EUR 9.1060 EUR 9.6792
Class A (M) (HGBP)* GBP 10.0056 GBP 9.0876 GBP 9.6738
Class A (M) (HSGD)* SGD 9.9865 SGD 9.0941 SGD 9.6759
Class B (C) (USD) USD 11.4311 USD 9.9488 USD 10.0813
Class B (C) (HEUR)* EUR 12.2895 EUR 10.9262 EUR 11.2037
Class B (C) (HGBP)* GBP 14.0574 GBP 12.4005 GBP 12.7073
Net Asset Value per Share

21
Notes to the Financial Statementsfor the year ended 31 July 2017
1. General Information
The Company was incorporated under the laws of the Grand Duchy of Luxembourg as an investment company (Société d’Investissement à
Capital Variable or “SICAV”) on 21 July 2009 with different compartments (hereafter called a “Portfolio”). Within each Portfolio, various Classes
of Shares may be issued. Each Portfolio consists of securities, cash and other sundry assets and liabilities. The accompanying Financial
Statements present the assets and liabilities of the individual Portfolios and of the Company taken as a whole. The Financial Statements of each
individual Portfolio are expressed in the currency designated in the prospectus for that particular Portfolio and the Financial Statements of the
Company are expressed in US Dollar (“USD”). The financial statements have been prepared in accordance with the format prescribed by the
Luxembourg authorities for Luxembourg investment companies.
The Company is an officially registered investment fund under Part I of the 2010 Law, as amended and qualifies as a UCITS fund under the
amended European directive 2009/65/EC.
The Company seeks to provide a comprehensive range of Portfolios with the purpose of spreading investment risk and satisfying the requirements
of investors seeking to emphasise income, capital conservation and/or capital growth.
The Company offers investors, within the same vehicle, a choice of investments in one or more Portfolios. The Company may issue different
Classes of Shares in one or several Portfolios. Details of the characteristics of such share classes, if and when offered, by one or several Portfolios
will be determined by the directors of the Company (the “Directors” and each a “Director”).
As at 31 July 2017, the Company was comprised of the following Portfolios:
HSBC Portfolios – World Selection 1
HSBC Portfolios – World Selection 2
HSBC Portfolios – World Selection 3
HSBC Portfolios – World Selection 4
HSBC Portfolios – World Selection 5
2. Share Capital
The Company currently offers the following classes of shares:
Class Description
Class A A Shares are available to all investors.
Class B B Shares are available in the United Kingdom and Jersey through specific distributors selected by the Distributor. BShares may be available in other countries through specific distributors selected by the Distributor on application tothe Company.
Class E E Shares will be available in certain countries, subject to the relevant regulatory approval, through specific distributorsselected by the Distributor on application to the Company.
Class S* S Shares are available through distributors selected by the Distributor provided that the investors qualify asinstitutional investors within the meaning of article 174 of the 2010 Law, as amended.
Class X X Shares are available through distributors selected by the Distributor provided that the investors qualify asinstitutional investors within the meaning of article 174 of the 2010 Law, as amended.
Class Z Z Shares are available to investors having entered into a discretionary management agreement with an HSBC Groupentity and to investors subscribing via distributors selected by the Distributor provided that such investors qualify asinstitutional investors within the meaning of article 174 of 2010 Law, as amended.
* Successive issue of Classes S Shares are numbered 1, 2, 3, etc. and respectively referred to as S1, S2, S3 etc. A series of Class S Shares may
be issued in one or more Portfolios and each series may or may not be available in all Portfolios.
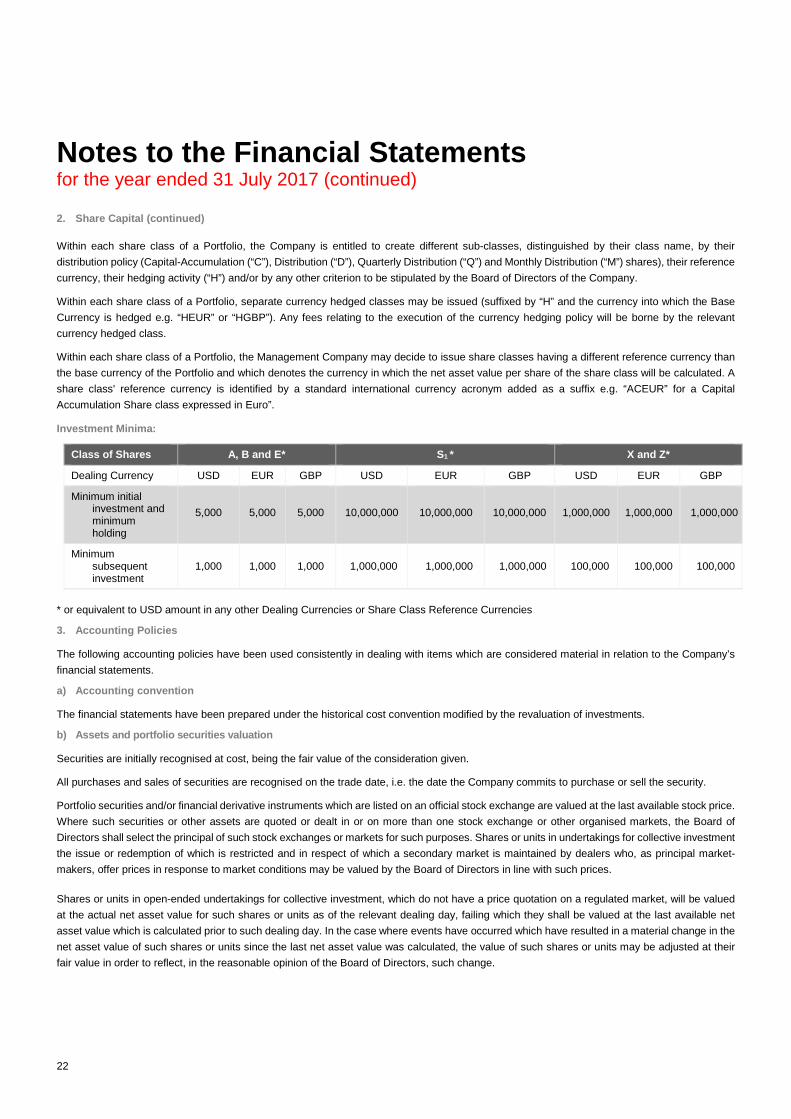
Notes to the Financial Statementsfor the year ended 31 July 2017 (continued)
22
2. Share Capital (continued)
Within each share class of a Portfolio, the Company is entitled to create different sub-classes, distinguished by their class name, by their
distribution policy (Capital-Accumulation (“C”), Distribution (“D”), Quarterly Distribution (“Q”) and Monthly Distribution (“M”) shares), their reference
currency, their hedging activity (“H”) and/or by any other criterion to be stipulated by the Board of Directors of the Company.
Within each share class of a Portfolio, separate currency hedged classes may be issued (suffixed by “H” and the currency into which the Base
Currency is hedged e.g. “HEUR” or “HGBP”). Any fees relating to the execution of the currency hedging policy will be borne by the relevant
currency hedged class.
Within each share class of a Portfolio, the Management Company may decide to issue share classes having a different reference currency than
the base currency of the Portfolio and which denotes the currency in which the net asset value per share of the share class will be calculated. A
share class' reference currency is identified by a standard international currency acronym added as a suffix e.g. “ACEUR” for a Capital
Accumulation Share class expressed in Euro”.
Investment Minima:
* or equivalent to USD amount in any other Dealing Currencies or Share Class Reference Currencies
3. Accounting Policies
The following accounting policies have been used consistently in dealing with items which are considered material in relation to the Company’s
financial statements.
a) Accounting convention
The financial statements have been prepared under the historical cost convention modified by the revaluation of investments.
b) Assets and portfolio securities valuation
Securities are initially recognised at cost, being the fair value of the consideration given.
All purchases and sales of securities are recognised on the trade date, i.e. the date the Company commits to purchase or sell the security.
Portfolio securities and/or financial derivative instruments which are listed on an official stock exchange are valued at the last available stock price.
Where such securities or other assets are quoted or dealt in or on more than one stock exchange or other organised markets, the Board of
Directors shall select the principal of such stock exchanges or markets for such purposes. Shares or units in undertakings for collective investment
the issue or redemption of which is restricted and in respect of which a secondary market is maintained by dealers who, as principal market-
makers, offer prices in response to market conditions may be valued by the Board of Directors in line with such prices.
Shares or units in open-ended undertakings for collective investment, which do not have a price quotation on a regulated market, will be valued
at the actual net asset value for such shares or units as of the relevant dealing day, failing which they shall be valued at the last available net
asset value which is calculated prior to such dealing day. In the case where events have occurred which have resulted in a material change in the
net asset value of such shares or units since the last net asset value was calculated, the value of such shares or units may be adjusted at their
fair value in order to reflect, in the reasonable opinion of the Board of Directors, such change.
Class of Shares A, B and E* S1 * X and Z*
Dealing Currency USD EUR GBP USD EUR GBP USD EUR GBP
Minimum initialinvestment andminimumholding
5,000 5,000 5,000 10,000,000 10,000,000 10,000,000 1,000,000 1,000,000 1,000,000
Minimumsubsequentinvestment
1,000 1,000 1,000 1,000,000 1,000,000 1,000,000 100,000 100,000 100,000

Notes to the Financial Statementsfor the year ended 31 July 2017 (continued)
23
3. Accounting Policies (continued)
b) Assets and portfolio securities valuation (continued)
The financial derivative instruments which are not listed on any official stock exchange or traded on any other organised market are valued in a
reliable and verifiable manner on a daily basis and verified by a competent professional appointed by the Company.
The Financial Statements are presented on the basis of the net asset value calculated on 31 July 2017.
Futures Contracts
Upon entering into a futures contract, the Company is required to deposit with the broker, cash or securities in an amount equal to a certain percentage
of the contract amount which is referred to as the initial margin account. Subsequent payments, referred to as variation margin, are made or received
by each Portfolio periodically and are based on changes in the market value of open futures contracts.
The unrealised appreciation on future contracts is disclosed in the statement of net assets under “Unrealised appreciation on future contracts”. Changes
in the market value of open futures contracts are recorded as Net change in unrealised appreciation/(depreciation) on derivatives in the statement of
changes in net assets. Realised gains or losses, representing the difference between the value of the contract at the time it was opened and the value
at the time it was closed, are reported at the closing or expiration of futures contracts in the statement of changes in net assets under “Net realised
gains/(losses) on derivatives”. Securities deposited as initial margin account are designated in the statement of investments and cash deposited is
recorded under cash at bank and at broker in the statement of net assets. A receivable and/or a payable to brokers for the daily variation margin is also
recorded in the statement of net assets.
Forward Foreign Exchange Contracts
The values of the forward foreign currency exchange contracts are adjusted daily based on the applicable exchange rate of the underlying currency.
Changes in the value of these contracts are recorded as unrealised appreciation or depreciation until the contract settlement date. When the forward
contract is closed, the Portfolio records a realised gain or loss equal to the difference between the value at the time the contract was opened and the
value at the time it was closed.
The unrealised appreciation on forward foreign exchange contracts is disclosed in the statement of net assets under “Unrealised gain on forward foreign
exchange contracts”. Realised gains/(losses) and change in unrealised appreciation/(depreciation) resulting there from are included in the statement of
changes in net assets respectively under “Net realised gains/(losses) on derivatives” and “Net change in Unrealised appreciation/(depreciation) on
derivatives”.
c) Income and Expenses
Interest is accrued on a day-to-day basis. Dividends are accounted for on an ex-dividend basis.
Expenses are recognised on an accrual basis.
d) Foreign Exchange
The cost of investments, income and expenses in currencies other than the Company relevant reporting currency have been recorded at the rate
of exchange ruling at the time of the transaction. The market value of the investments and other assets and liabilities in currencies other than the
relevant reporting currency has been converted at the rates of exchange ruling at the date of these financial statements. The exchange rates used
as at 31 July 2017 are as follows:
USD/AUD 1.25258
USD/CAD 1.25055
USD/DKK 6.30765
USD/EUR 0.84818
USD/GBP 0.75852
USD/HKD 7.81015
USD/JPY 110.49500
USD/SEK 8.08905
USD/SGD 1.35720
Notes to the Financial Statementsfor the year ended 31 July 2017 (continued)
24
3. Accounting Policies (continued)
e) Realised Profit/(Loss) on Sale of Investments
Realised profit/(loss) on sale of investments is the difference between the historical average cost of the investment and the sale proceeds.
f) Segregated Liability
The Company has segregated liability between its Portfolios; meaning, the assets of a Portfolio are exclusively available to satisfy the rights of
shareholders in relation to that Portfolio and the rights of creditors whose claims have arisen in connection with the creation, operation and
liquidation of that Portfolio.
g) Dividends payable
Dividends payable by the Company are recorded on the ex-date.
h) Net Asset Value per Share
The net asset value per share of the Company (the “Net Asset Value per Share”) is calculated by dividing the net assets of the relevant Class ofShares in a Portfolio included in the Statement of Net Assets by the number of Shares of the relevant class in that Portfolio in issue at the year
end.
4. Charges and Expenses
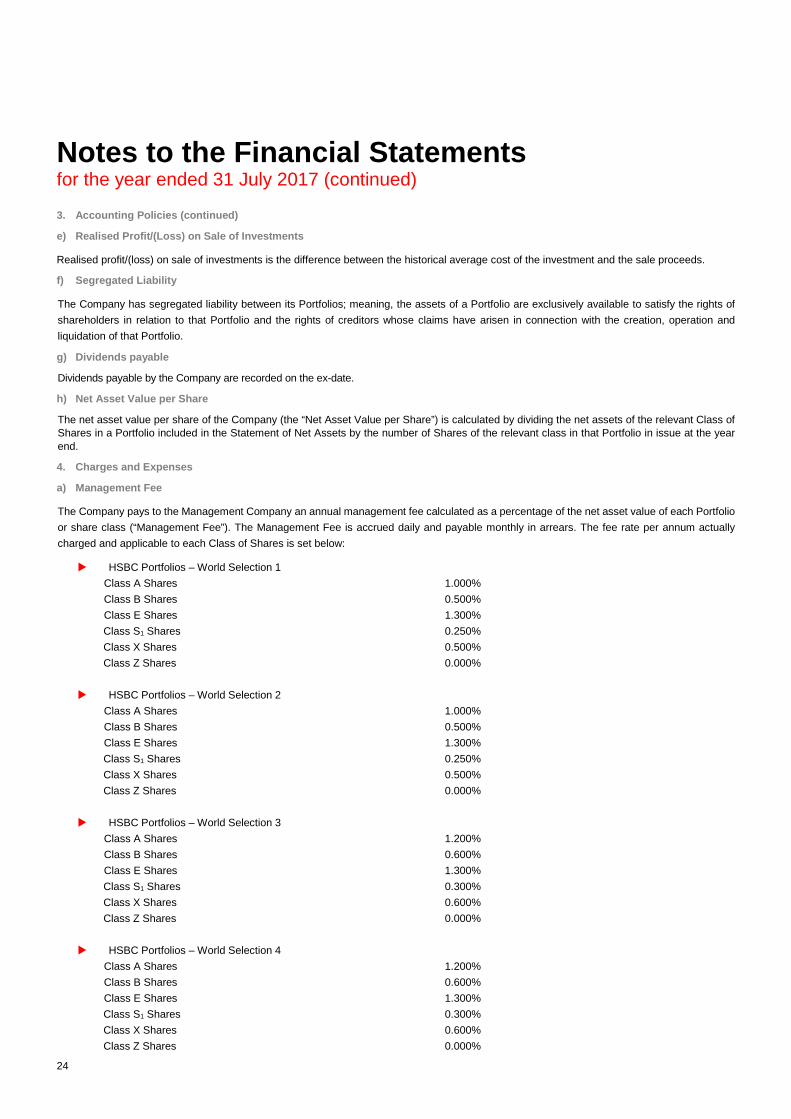
a) Management Fee
The Company pays to the Management Company an annual management fee calculated as a percentage of the net asset value of each Portfolio
or share class (“Management Fee”). The Management Fee is accrued daily and payable monthly in arrears. The fee rate per annum actually
charged and applicable to each Class of Shares is set below:
HSBC Portfolios – World Selection 1
Class A Shares 1.000%
Class B Shares 0.500%
Class E Shares 1.300%
Class S1 Shares 0.250%
Class X Shares 0.500%
Class Z Shares 0.000%
HSBC Portfolios – World Selection 2
Class A Shares 1.000%
Class B Shares 0.500%
Class E Shares 1.300%
Class S1 Shares 0.250%
Class X Shares 0.500%
Class Z Shares 0.000%
HSBC Portfolios – World Selection 3
Class A Shares 1.200%
Class B Shares 0.600%
Class E Shares 1.300%
Class S1 Shares 0.300%
Class X Shares 0.600%
Class Z Shares 0.000%
HSBC Portfolios – World Selection 4
Class A Shares 1.200%
Class B Shares 0.600%
Class E Shares 1.300%
Class S1 Shares 0.300%
Class X Shares 0.600%
Class Z Shares 0.000%

Notes to the Financial Statementsfor the year ended 31 July 2017 (continued)
25
4. Charges and Expenses (continued)
a) Management Fee (continued)
HSBC Portfolios – World Selection 5
Class A Shares 1.300%
Class B Shares 0.650%
Class E Shares 1.300%
Class S1 Shares 0.325%
Class X Shares 0.650%
Class Z Shares 0.000%
The Management Fee covers management, advisory and distribution services provided in relation to the relevant Portfolio of the Company by the
Management Company, the Investment Advisers and the Share Distributors. The Management Company is responsible for discharging, out of
such fee, the fees of the Investment Advisers and the Share Distributors and may pay part of such fee to recognised intermediaries or such other
person as the Management Company may determine, at its discretion.
The Management Company may instruct the Company to pay a portion of the Management Fee directly out of the assets of the Company to any
of such service providers. In such case the Management Fee due to Management Company is reduced accordingly.
The Management Company is also acting as a management company for other investment funds, namely HSBC Global Investment Funds and
HSBC Amanah Funds.
The Company has invested in other HSBC promoted funds, which include the following funds:
HSBC Global Investment Funds - Global Asset Backed Bond “ZC”
HSBC Global Investment Funds - Global Corporate Bond “ZQ”
HSBC Global Investment Funds - Global Emerging Markets Bond “ZQ”
HSBC Global Investment Funds - Global Emerging Markets Local Debt “ZQ”
HSBC Global Investment Funds - Global Government Bond “ZQ”
HSBC Global Investment Funds - Global High Yield Bond “ZQ”
HSBC Global Investment Funds - Global Real Estate Equity “ZQ”
HSBC Global Investment Funds – India Fixed Income “ZD”
HSBC American Index “Institutional Acc”
HSBC Corporate Bond Fund “Institutional Acc”
HSBC European Index “Institutional Acc”
HSBC FTSE All Share Index Acc
HSBC US Dollar Liquidity Fund “Z”
HSBC Japan Index “Institutional Acc”
The management fee rate applicable to the above underlying funds' share classes is nil.
HSBC ESI Worldwide Equity ETF
HSBC Worldwide Equity ETF
The above underlying funds are subject to single fee, referred to as the “Total Expense Ratio” or “TER” which covers all fees and expenses except
transaction charges and taxes or duties for portfolio rebalancing. The maximum TER applicable to each underlying fund is 0.25% per annum.
Notes to the Financial Statementsfor the year ended 31 July 2017 (continued)
26
4. Charges and Expenses (continued)
b) Operating, Administrative and Servicing Expenses
There are certain Operating, administrative and servicing expenses (‘the expenses’) incurred throughout the lifetime of a Portfolio or share class.
These expenses are associated with services rendered to a relevant Portfolio which are overseen by either the Management Company or the
Company. Many of the services are delegated to other service providers who are paid directly by the Company.
Operating, administrative and servicing expenses cover the ongoing depositary fees and safekeeping charges payable to the Depositary Bank
and its correspondent banks, fees for fund accounting and administration services (including domiciliary services) payable to the Administrative
Agent and transfer agency fees for registrar and transfer agency services payable to the Transfer Agent.
Operating, administrative and servicing expenses also cover expenses relating to the Luxembourg asset-based taxe d’abonnement; reasonable
out-of-pocket expenses incurred by the Board of Directors; legal expenses for advice on behalf of the Company; audit fees; ongoing registration
and listing fees (if applicable); the costs of preparing, printing, translating and distributing the Company’s Prospectus, financial reports, statements
and other documents made available directly or through intermediaries to its shareholders. These expenses also cover formation expenses for
current and new Portfolios including initial registration fees (these expenses are amortised over a period not exceeding 5 years from the formation
date of the Portfolio). The only operating expenses which are not covered by the fee rate paid to the management company and which are included
under this caption are ‘hedging fees’ incurred by the respective portfolios for hedging the different share classes.
The Company pays the expenses directly to the service providers and as such the ongoing charge for each share class will vary. The expenses
paid by the Company will not exceed 0.25% of the net assets per annum on a rolling basis of each share class. Where actual expenses exceed
0.25% per annum, the excess will be borne directly by the Management Company or by HSBC Global Asset Management distributors.
The expenses will be accrued daily and will be payable monthly in arrears. The accrual amount will be reviewed each quarter using the previous
12 months’ expenses as an initial basis and amending when necessary.
c) Directors’ Fees, Expenses and Interests
A Director may be a party to, or otherwise interested in, any transaction or arrangement with the Company or in which the Company is interested,
provided that he has disclosed to the other Directors, prior to the conclusion of any such transaction or arrangement, the nature and extent of any
interest of his therein. A Director may vote in respect of any contract or arrangement or any proposal whatsoever in which he has an interest,
having first disclosed such interest. He shall not be disqualified by his office from contracting with the Company. If a Director declares his interest
in any contract which the Company is considering entering into, he may be counted in the quorum of any meeting to consider the contract and
may vote on any resolution to enter into such contract.
The Company pays an annual fee to each of the Independent Directors amounting to EUR 10,000. This amount is paid by the Management
Company through the Operating, administrative and servicing expenses paid by the Company. The amount is accrued with every net asset value
calculation and paid quarterly in arrears. As at 31 July 2017, there were no arrears payable to the Independent Directors.
With effect from 1 October 2015 the Company also pays an annual fee to each of the Independent Directors who are members of the Investment
Performance Working Group, a sub-committee of the Board established to monitor the investment performance and governance and risk profile
of the Company's Portfolios , amounting to EUR1,538. The amount is accrued with every net asset value calculation and paid quarterly in arrears.
As at 31 July 2017, there were no arrears payable to the Independent Directors.
5. Taxation of the Company
The following is based on the Company’s understanding of the law and practice currently in force in the Grand Duchy of Luxembourg and is
subject to changes therein.
The Company is not subject to taxation in Luxembourg on its income, profits or gains.
The Company is not subject to net wealth tax in Luxembourg. No stamp duty, capital duty or other tax will be payable in Luxembourg upon the
issue of the Shares of the Company.
The Portfolios are nevertheless, in principle, subject to a subscription tax (taxe d'abonnement) levied at the rate of 0.05% per annum based on its
NAV at the end of the relevant quarter, calculated and paid quarterly. A reduced subscription tax rate of 0.01% per annum is however applicable
to any Portfolio whose exclusive object is the collective investment in money market instruments, the placing of deposits with credit institutions,
or both. A reduced subscription tax rate of 0.01% per annum is also applicable to any Portfolio or Share Class provided that their shares are only
held by one or more institutional investors within the meaning of article 174 of the 2010 Law, as amended (an “Institutional Investor”).
Notes to the Financial Statementsfor the year ended 31 July 2017 (continued)
27
5. Taxation of the Company (continued)
A subscription tax exemption applies to:
a) The portion of any Portfolio’s assets (prorata) invested in a Luxembourg investment fund or any of its Portfolio to the extent it is subject to the
subscription tax;
b) Any Portfolio (i) whose securities are only held by Institutional Investor(s), and (ii) whose sole object is the collective investment in money
market instruments and the placing of deposits with credit institutions, and (iii) whose weighted residual portfolio maturity does not exceed 90
days, and (iv) that have obtained the highest possible rating from a recognised rating agency. If several Share Classes are in issue in the relevant
Portfolio meeting (ii) to (iv) above, only those Share Classes meeting (i) above will benefit from this exemption;
c) Any Portfolio, whose main objective is the investment in microfinance institutions; and
d) Any Portfolio, (i) whose securities are listed or traded on a stock exchange and (ii) whose exclusive object is to replicate the performance of
one or more indices. If several Share Classes are in issue in the relevant Portfolio meeting (ii) above, only those Share Classes meeting (i) above
will benefit from this exemption.
e) Any Portfolio only held by pension funds and assimilated vehicles.
Withholding tax
Interest and dividend income received by the Company may be subject to non-recoverable withholding tax in the source countries. The Company
may further be subject to tax on the realised or unrealised capital appreciation of its assets in the countries of origin. The Company may benefit
from double tax treaties entered into by Luxembourg, which may provide for exemption from withholding tax or reduction of withholding tax rate.
Distributions made by the Company as well as liquidation proceeds and capital gains derived therefrom are not subject to withholding tax in
Luxembourg.
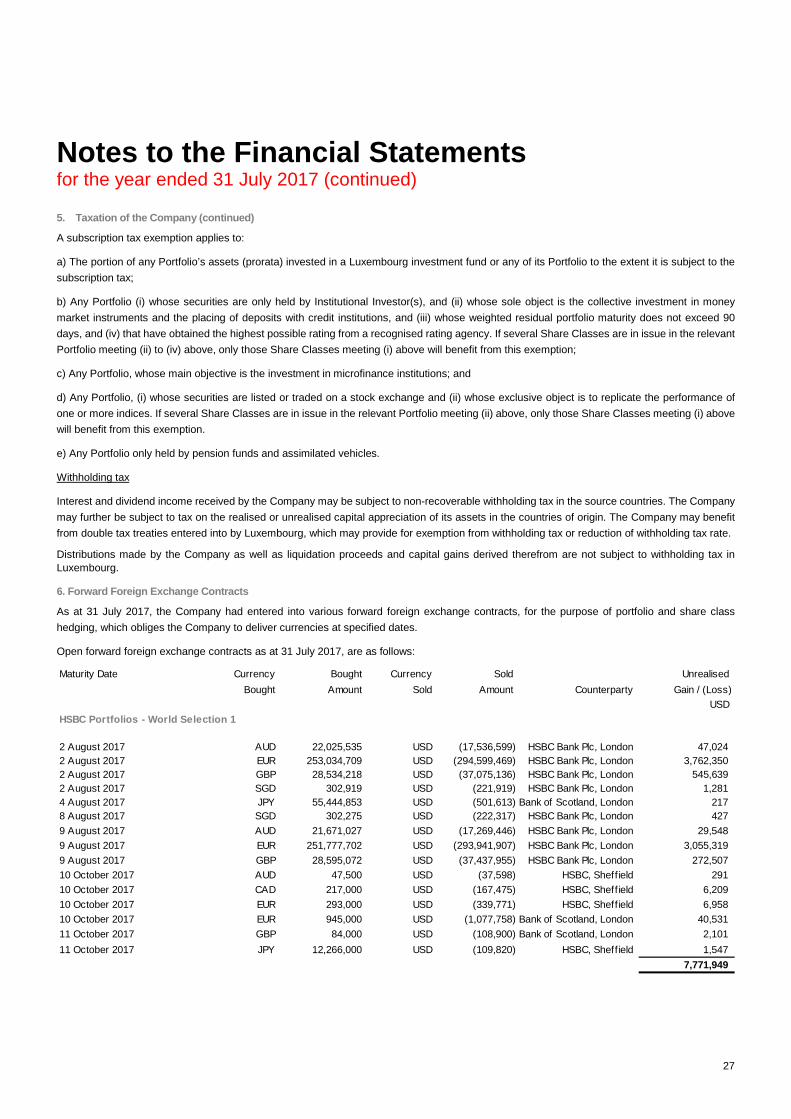
6. Forward Foreign Exchange Contracts
As at 31 July 2017, the Company had entered into various forward foreign exchange contracts, for the purpose of portfolio and share class
hedging, which obliges the Company to deliver currencies at specified dates.
Open forward foreign exchange contracts as at 31 July 2017, are as follows:
Maturity Date Currency Bought Currency Sold Unrealised
Bought Amount Sold Amount Counterparty Gain / (Loss)
USD
HSBC Portfolios - World Selection 1
2 August 2017 AUD 22,025,535 USD (17,536,599) HSBC Bank Plc, London 47,024
2 August 2017 EUR 253,034,709 USD (294,599,469) HSBC Bank Plc, London 3,762,350
2 August 2017 GBP 28,534,218 USD (37,075,136) HSBC Bank Plc, London 545,639
2 August 2017 SGD 302,919 USD (221,919) HSBC Bank Plc, London 1,281
4 August 2017 JPY 55,444,853 USD (501,613)Royal Bank of Scotland, London 217
8 August 2017 SGD 302,275 USD (222,317) HSBC Bank Plc, London 427
9 August 2017 AUD 21,671,027 USD (17,269,446) HSBC Bank Plc, London 29,548
9 August 2017 EUR 251,777,702 USD (293,941,907) HSBC Bank Plc, London 3,055,319
9 August 2017 GBP 28,595,072 USD (37,437,955) HSBC Bank Plc, London 272,507
10 October 2017 AUD 47,500 USD (37,598) HSBC, Sheffield 291
10 October 2017 CAD 217,000 USD (167,475) HSBC, Sheffield 6,209
10 October 2017 EUR 293,000 USD (339,771) HSBC, Sheffield 6,958
10 October 2017 EUR 945,000 USD (1,077,758)Royal Bank of Scotland, London 40,531
11 October 2017 GBP 84,000 USD (108,900)Royal Bank of Scotland, London 2,101
11 October 2017 JPY 12,266,000 USD (109,820) HSBC, Sheffield 1,547
7,771,949

Notes to the Financial Statementsfor the year ended 31 July 2017 (continued)
28
6. Forward Foreign Exchange Contracts (continued)
Maturity Date Currency Bought Currency Sold Unrealised
Bought Amount Sold Amount Counterparty Gain / (Loss)
USD
HSBC Portfolios - World Selection 1 (continued)
2 August 2017 USD 17,552,788 AUD (22,025,535) HSBC Bank Plc, London (30,835)
2 August 2017 USD 295,286,698 EUR (253,034,709) HSBC Bank Plc, London (3,075,121)
2 August 2017 USD 37,347,867 GBP (28,534,218) HSBC Bank Plc, London (272,909)
2 August 2017 USD 222,742 SGD (302,919) HSBC Bank Plc, London (459)
10 October 2017 USD 7,474,083 AUD (9,772,000)Royal Bank of Scotland, London (320,616)
10 October 2017 USD 8,026,019 CAD (10,400,000) HSBC, Sheffield (297,989)
10 October 2017 USD 51,958,990 EUR (45,480,000) HSBC, Sheffield (1,860,919)
11 October 2017 USD 14,592,181 GBP (11,224,000)Royal Bank of Scotland, London (239,647)
11 October 2017 USD 28,454,017 JPY (3,202,500,000) HSBC, Sheffield (622,518)
11 October 2017 USD 503,200 JPY (55,445,000)Royal Bank of Scotland, London (203)
19 October 2017 USD 1,101,131 DKK (7,108,000) UBS, London (30,686)
19 October 2017 USD 1,189,724 SEK (9,960,000) HSBC, Sheffield (46,966)
(6,798,868)
HSBC Portfolios - World Selection 2
2 August 2017 AUD 2,832,117 USD (2,254,255) HSBC Bank Plc, London 6,706
2 August 2017 EUR 214,977,089 USD (250,290,301) HSBC Bank Plc, London 3,196,486
2 August 2017 GBP 83,883,479 USD (108,997,922) HSBC Bank Plc, London 1,597,770
9 August 2017 AUD 2,827,502 USD (2,253,211) HSBC Bank Plc, London 3,855
9 August 2017 EUR 214,712,523 USD (250,669,571) HSBC Bank Plc, London 2,605,533
9 August 2017 GBP 83,885,737 USD (109,826,982) HSBC Bank Plc, London 799,419
10 October 2017 EUR 161,000 USD (184,592) HSBC, Sheffield 5,931
8,215,700
2 August 2017 USD 2,256,996 AUD (2,832,117) HSBC Bank Plc, London (3,965)
2 August 2017 USD 250,874,179 EUR (214,977,089) HSBC Bank Plc, London (2,612,608)
2 August 2017 USD 109,793,408 GBP (83,883,479) HSBC Bank Plc, London (802,284)
10 October 2017 USD 58,288,207 EUR (51,020,000) HSBC, Sheffield (2,087,601)
11 October 2017 USD 21,607,347 GBP (16,620,000)Royal Bank of Scotland, London (354,965)
(5,861,423)
HSBC Portfolios - World Selection 3
2 August 2017 AUD 4,830,249 USD (3,845,755) HSBC Bank Plc, London 10,372
2 August 2017 EUR 222,073,523 USD (258,552,430) HSBC Bank Plc, London 3,302,002
2 August 2017 GBP 122,955,690 USD (159,749,320) HSBC Bank Plc, London 2,360,905
2 August 2017 SGD 348,483 USD (255,247) HSBC Bank Plc, London 1,527
8 August 2017 SGD 349,567 USD (257,099) HSBC Bank Plc, London 494
9 August 2017 AUD 4,723,853 USD (3,764,396) HSBC Bank Plc, London 6,441
9 August 2017 EUR 222,834,061 USD (260,151,190) HSBC Bank Plc, London 2,704,088
9 August 2017 GBP 123,148,216 USD (161,231,186) HSBC Bank Plc, London 1,173,584
10 October 2017 EUR 791,000 USD (908,905)Royal Bank of Scotland, London 27,145
11 October 2017 GBP 35,000 USD (45,423)Royal Bank of Scotland, London 828
9,587,386

Notes to the Financial Statementsfor the year ended 31 July 2017 (continued)
29
6. Forward Foreign Exchange Contracts (continued)
Maturity Date Currency Bought Currency Sold Unrealised
Bought Amount Sold Amount Counterparty Gain / (Loss)
USD
HSBC Portfolios - World Selection 3 (continued)
2 August 2017 USD 3,849,365 AUD (4,830,249) HSBC Bank Plc, London (6,762)
2 August 2017 USD 259,155,582 EUR (222,073,523) HSBC Bank Plc, London (2,698,851)
2 August 2017 USD 160,934,244 GBP (122,955,690) HSBC Bank Plc, London (1,175,981)
2 August 2017 USD 256,246 SGD (348,483) HSBC Bank Plc, London (528)
15 August 2017 USD 3,833,094 EUR (3,284,087) HSBC Bank Plc, London (42,133)
15 August 2017 USD 7,616,883 GBP (5,819,857) HSBC Bank Plc, London (59,847)
10 October 2017 USD 27,190,500 EUR (23,800,000) HSBC, Sheffield (973,832)
11 October 2017 USD 14,742,987 GBP (11,340,000)Royal Bank of Scotland, London (242,129)
(5,200,063)
HSBC Portfolios - World Selection 4
2 August 2017 AUD 1,454,849 USD (1,158,221) HSBC Bank Plc, London 3,227
2 August 2017 EUR 370,269,915 USD (431,092,302) HSBC Bank Plc, London 5,505,529
2 August 2017 GBP 75,575,270 USD (98,190,641) HSBC Bank Plc, London 1,451,141
9 August 2017 AUD 1,467,698 USD (1,169,595) HSBC Bank Plc, London 2,001
9 August 2017 EUR 372,695,255 USD (435,109,038) HSBC Bank Plc, London 4,522,652
9 August 2017 GBP 75,534,500 USD (98,893,166) HSBC Bank Plc, London 719,832
12,204,382
2 August 2017 USD 1,159,411 AUD (1,454,849) HSBC Bank Plc, London (2,037)
2 August 2017 USD 432,097,955 EUR (370,269,915) HSBC Bank Plc, London (4,499,876)
2 August 2017 USD 98,918,960 GBP (75,575,270) HSBC Bank Plc, London (722,822)
15 August 2017 USD 3,564,920 EUR (3,054,323) HSBC Bank Plc, London (39,186)
15 August 2017 USD 7,083,986 GBP (5,412,684) HSBC Bank Plc, London (55,660)
(5,319,581)
HSBC Portfolios - World Selection 5
2 August 2017 AUD 543,882 USD (433,035) HSBC Bank Plc, London 1,161
2 August 2017 EUR 124,283,795 USD (144,699,273) HSBC Bank Plc, London 1,847,971
2 August 2017 GBP 28,123,829 USD (36,539,782) HSBC Bank Plc, London 539,920
2 August 2017 SGD 44,553 USD (32,633) HSBC Bank Plc, London 195
8 August 2017 SGD 44,858 USD (32,992) HSBC Bank Plc, London 63
9 August 2017 AUD 547,737 USD (436,487) HSBC Bank Plc, London 747
9 August 2017 EUR 125,297,861 USD (146,280,992) HSBC Bank Plc, London 1,520,488
9 August 2017 GBP 28,250,496 USD (36,986,821) HSBC Bank Plc, London 269,223
4,179,768
2 August 2017 USD 433,435 AUD (543,882) HSBC Bank Plc, London (762)
2 August 2017 USD 145,036,828 EUR (124,283,795) HSBC Bank Plc, London (1,510,416)
2 August 2017 USD 36,810,718 GBP (28,123,829) HSBC Bank Plc, London (268,984)
2 August 2017 USD 32,761 SGD (44,553) HSBC Bank Plc, London (67)
15 August 2017 USD 1,360,138 EUR (1,165,328) HSBC Bank Plc, London (14,951)
15 August 2017 USD 2,027,086 GBP (1,548,842) HSBC Bank Plc, London (15,927)
(1,811,107)

Notes to the Financial Statementsfor the year ended 31 July 2017 (continued)
30
7. Futures Contracts
As at 31 July 2017, the Company had entered in the following outstanding futures contracts. The margin accounts on these futures contracts are
recognized under the cash at bank and at broker figures in the statement of net assets.
Underlying Number of Currency Commitment Maturity date Unrealised Gain /
contracts (Loss)
USD USD
HSBC Portfolios - World Selection 1
OSE Topix Index 34 JPY 4,986,379 7 September 2017 38,463
E-mini S&P500 10 USD 1,233,437 15 September 2017 19,237
Mini MSCI Emerging Markets Index 91 USD 4,838,242 15 September 2017 279,370
337,070
EUX EURO BUND 23 EUR 4,392,821 7 September 2017 (66,843)
EUX EURO STOXX 50 185 EUR 7,508,613 15 September 2017 (208,300)
CBT US 10Yr Note (68) USD (8,562,156) 20 September 2017 (1,594)
(276,737)
HSBC Portfolios - World Selection 2
OSE Topix Index 41 JPY 6,012,987 7 September 2017 46,382
E-mini S&P500 13 USD 1,603,469 15 September 2017 25,009
Mini MSCI Emerging Markets Index 109 USD 5,795,258 15 September 2017 334,630
406,021
EUX EURO BUND 37 EUR 7,066,711 7 September 2017 (107,531)
EUX EURO STOXX 50 223 EUR 9,050,922 15 September 2017 (251,086)
CBT US 10Yr Note (43) USD (5,414,305) 20 September 2017 (1,680)
LIFFE Long Gilt 1 GBP 166,198 27 September 2017 (2,169)
(362,466)
HSBC Portfolios - World Selection 3
OSE Topix Index 55 JPY 8,066,202 7 September 2017 62,220
E-mini S&P500 16 USD 1,973,500 15 September 2017 30,780
Mini MSCI Emerging Markets Index 144 USD 7,656,120 15 September 2017 442,080
LIFFE Long Gilt (21) GBP (3,490,153) 27 September 2017 45,542
580,622
EUX EURO BUND 16 EUR 3,055,875 7 September 2017 (46,500)
EUX EURO STOXX 50 297 EUR 12,054,368 15 September 2017 (334,406)
CBT US 10Yr Note (129) USD (16,242,915) 20 September 2017 (2,695)
(383,601)
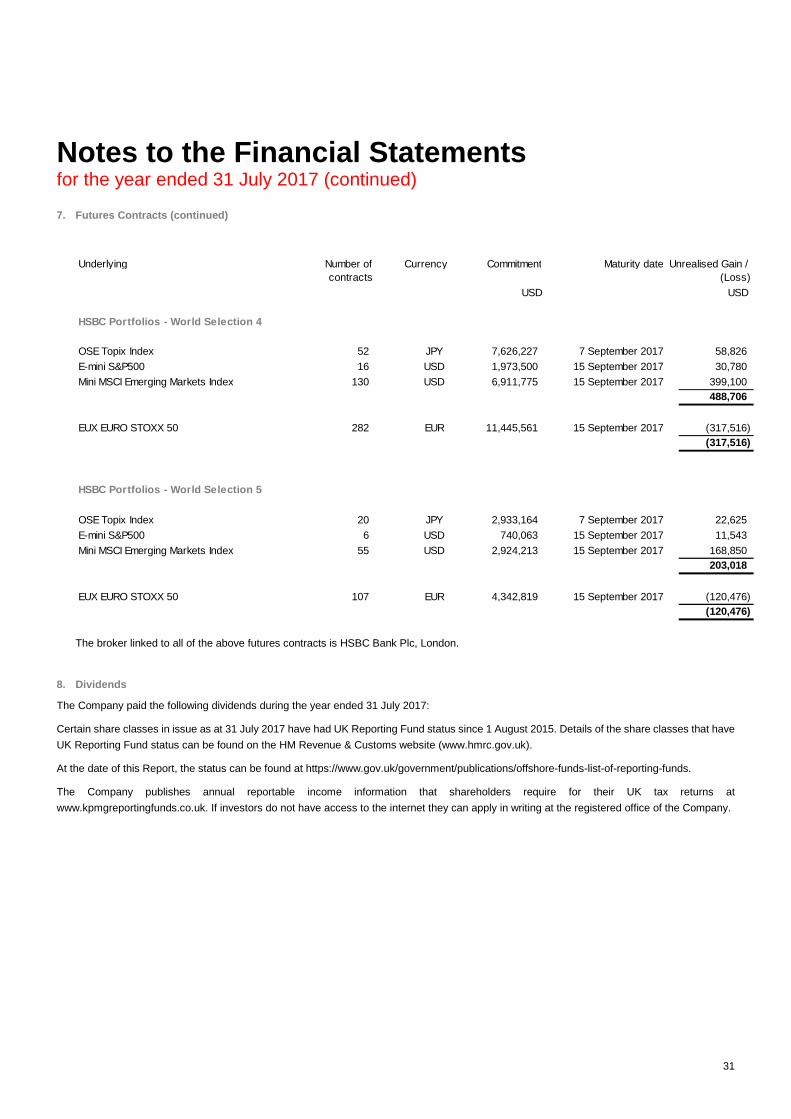
Notes to the Financial Statementsfor the year ended 31 July 2017 (continued)
31
7. Futures Contracts (continued)
The broker linked to all of the above futures contracts is HSBC Bank Plc, London.
8. Dividends
The Company paid the following dividends during the year ended 31 July 2017:
Certain share classes in issue as at 31 July 2017 have had UK Reporting Fund status since 1 August 2015. Details of the share classes that have
UK Reporting Fund status can be found on the HM Revenue & Customs website (www.hmrc.gov.uk).
At the date of this Report, the status can be found at https://www.gov.uk/government/publications/offshore-funds-list-of-reporting-funds.
The Company publishes annual reportable income information that shareholders require for their UK tax returns at
www.kpmgreportingfunds.co.uk. If investors do not have access to the internet they can apply in writing at the registered office of the Company.
Underlying Number of Currency Commitment Maturity date Unrealised Gain /
contracts (Loss)
USD USD
HSBC Portfolios - World Selection 4
OSE Topix Index 52 JPY 7,626,227 7 September 2017 58,826
E-mini S&P500 16 USD 1,973,500 15 September 2017 30,780
Mini MSCI Emerging Markets Index 130 USD 6,911,775 15 September 2017 399,100
488,706
EUX EURO STOXX 50 282 EUR 11,445,561 15 September 2017 (317,516)
(317,516)
HSBC Portfolios - World Selection 5
OSE Topix Index 20 JPY 2,933,164 7 September 2017 22,625
E-mini S&P500 6 USD 740,063 15 September 2017 11,543
Mini MSCI Emerging Markets Index 55 USD 2,924,213 15 September 2017 168,850
203,018
EUX EURO STOXX 50 107 EUR 4,342,819 15 September 2017 (120,476)
(120,476)

Notes to the Financial Statementsfor the year ended 31 July 2017 (continued)
32
8. Dividends (continued)
Currency Aug-
2016
Sep-
2016
Oct-
2016
Nov-
2016
Dec-
2016
Jan-
2017
Feb-
2017
Mar-
2017
Apr-
2017
May-
2017
June-
2017
July-
2017
HSBC Portfolios World Selection 1
A (M) (HKD) USD 0.002392 0.002307 0.002461 0.002640 0.002861 0.002889 0.002910 0.002882 0.002984 0.002897 0.002926 0.003027
A (M) (USD) USD 0.018526 0.017879 0.019073 0.020471 0.022174 0.022403 0.022557 0.022363 0.023154 0.022485 0.022719 0.023471
A (M) (HAUD) USD 0.021155 0.018791 0.019323 0.019796 0.020704 0.022144 0.021741 0.022306 0.020087 0.020576 0.020353 0.020845
A (M) (HEUR) USD 0.012324 0.010391 0.011388 0.008246 0.009597 0.001612 0.010931 0.010401 0.007823 0.007145 0.008662 0.006193
A (M) (HGBP) USD 0.026282 0.020562 0.020203 0.018335 0.018617 0.011363 0.020112 0.019935 0.017653 0.017691 0.017636 0.015704
A (M) (HSGD) USD 0.015963 0.014336 0.013403 0.011151 0.013460 0.014501 0.012549 0.013328 0.013642 0.013292 0.013423 0.012480
HSBC Portfolios World Selection 2
A (D) (USD) USD - - - - 0.089159 - - - - - - -
A (D) (HEUR) USD - - - - 0.110038 - - - - - - -
A (D) (HGBP) USD - - - - 0.124216 - - - - - - -
A (M) (HKD) USD 0.002961 0.002911 0.003127 0.003285 0.003475 0.003458 0.003502 0.003464 0.003464 0.003322 0.003349 0.003424
A (M) (USD) USD 0.022915 0.022544 0.024215 0.025450 0.026908 0.026793 0.027129 0.026853 0.026864 0.025767 0.025978 0.026531
A (M) (HAUD) USD 0.024429 0.022331 0.023189 0.023451 0.024094 0.025466 0.025265 0.025768 0.022884 0.023070 0.022895 0.023327
A (M) (HEUR) USD 0.017278 0.015640 0.017002 0.013586 0.014621 0.006491 0.015724 0.015144 0.011801 0.010765 0.012291 0.009668
A (M) (HGBP) USD 0.031608 0.026291 0.026150 0.024311 0.024188 0.016783 0.025498 0.025220 0.022160 0.021659 0.021573 0.019416
X (D) (HGBP) USD - - - - 0.159570 - - - - - - -
Z (D) (HGBP) USD - - - - 0.204155 - - - - - - -
HSBC Portfolios World Selection 3
A (M) (HKD) USD 0.003100 0.003119 0.003252 0.003342 0.003464 0.003454 0.003496 0.003477 0.003440 0.003274 0.003303 0.003337
A (M) (USD) USD 0.024007 0.024171 0.025195 0.025906 0.026843 0.026778 0.027103 0.026974 0.026690 0.025409 0.025640 0.025873
A (M) (HAUD) USD 0.024821 0.023224 0.023593 0.023456 0.023742 0.025137 0.024976 0.025591 0.022558 0.022604 0.022460 0.022631
A (M) (HEUR) USD 0.018953 0.017936 0.018535 0.014654 0.015076 0.007119 0.016058 0.015606 0.011912 0.010631 0.012102 0.009085
A (M) (HGBP) USD 0.032978 0.028496 0.027455 0.025152 0.024390 0.017221 0.025652 0.025528 0.022121 0.021354 0.021246 0.018685
A (M) (HSGD) USD 0.019795 0.018808 0.017736 0.015095 0.016723 0.017603 0.015850 0.016648 0.016187 0.015411 0.015541 0.014256
A (D) (HEUR) USD - - - - 0.054394 - - - - - - -
HSBC Portfolios World Selection 4
A (M) (HKD) USD 0.003225 0.003308 0.003350 0.003379 0.003443 0.003436 0.003467 0.003456 0.003379 0.003169 0.003212 0.003215
A (M) (USD) USD 0.024997 0.025652 0.025977 0.026215 0.026703 0.026662 0.026901 0.026831 0.026239 0.024612 0.024953 0.024948
A (M) (HAUD) USD 0.036513 0.034848 0.034606 0.033892 0.033884 0.035939 0.035663 0.036609 0.031982 0.031680 0.031602 0.031555
A (M) (HEUR) USD 0.020416 0.019971 0.019760 0.015485 0.015360 0.007560 0.016151 0.015747 0.011669 0.009951 0.011469 0.008127
A (M) (HGBP) USD 0.034201 0.030451 0.028473 0.025757 0.024445 0.017470 0.025543 0.025479 0.021674 0.020431 0.020427 0.017537
HSBC Portfolios World Selection 5
A (M) (HKD) USD 0.002917 0.003091 0.003097 0.003090 0.003100 0.003090 0.003130 0.003126 0.003094 0.002870 0.002922 0.002931
A (M) (USD) USD 0.022588 0.023947 0.023994 0.023948 0.024016 0.023957 0.024259 0.024247 0.024004 0.022267 0.022678 0.022719
A (M) (HAUD) USD 0.023336 0.022708 0.022352 0.021687 0.021447 0.022755 0.022601 0.023300 0.020426 0.020128 0.020089 0.020033
A (M) (HEUR) USD 0.017558 0.017940 0.017465 0.013053 0.012460 0.004677 0.013218 0.012825 0.009125 0.007229 0.008733 0.005413
A (M) (HGBP) USD 0.031104 0.028331 0.026148 0.023066 0.021281 0.014215 0.022339 0.022330 0.018863 0.017464 0.017526 0.014664
A (M) (HSGD) USD 0.018609 0.018558 0.016824 0.013796 0.014788 0.015589 0.013886 0.014688 0.014278 0.013194 0.013402 0.0119410.0243 0.0242 0.024 0.0223 0.0227
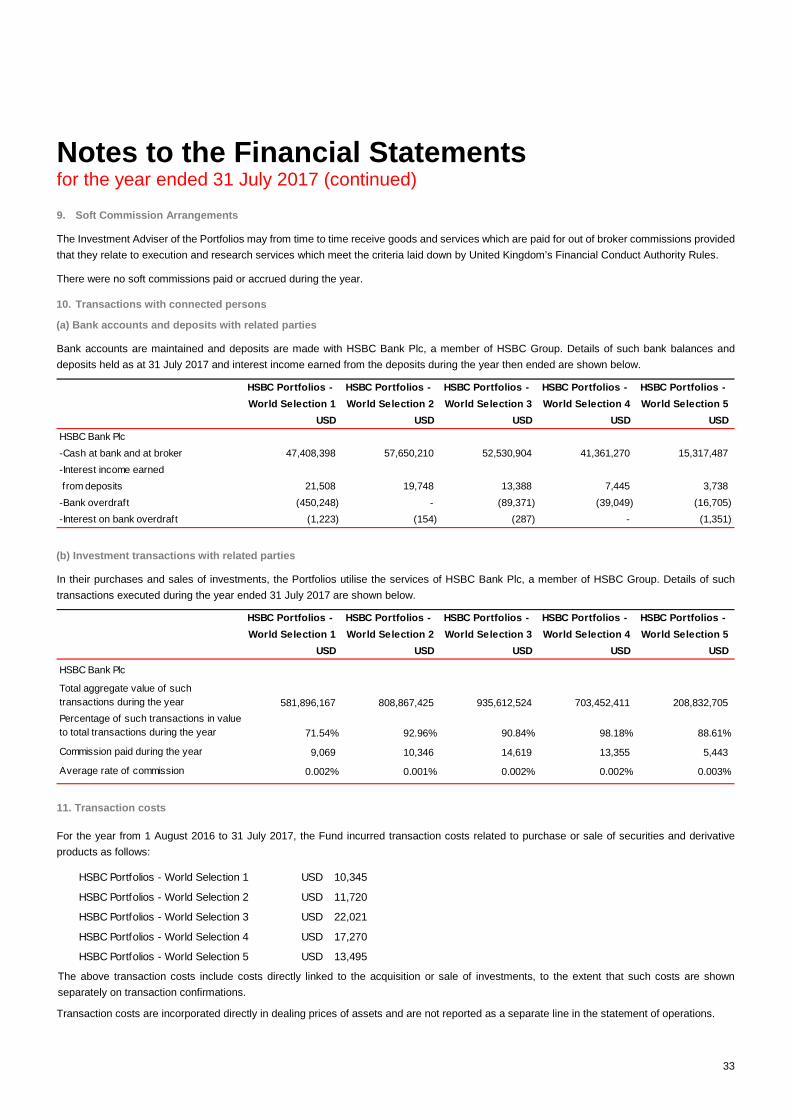
Notes to the Financial Statementsfor the year ended 31 July 2017 (continued)
33
9. Soft Commission Arrangements
The Investment Adviser of the Portfolios may from time to time receive goods and services which are paid for out of broker commissions provided
that they relate to execution and research services which meet the criteria laid down by United Kingdom’s Financial Conduct Authority Rules.
There were no soft commissions paid or accrued during the year.
10. Transactions with connected persons
(a) Bank accounts and deposits with related parties
Bank accounts are maintained and deposits are made with HSBC Bank Plc, a member of HSBC Group. Details of such bank balances and
deposits held as at 31 July 2017 and interest income earned from the deposits during the year then ended are shown below.
(b) Investment transactions with related parties
In their purchases and sales of investments, the Portfolios utilise the services of HSBC Bank Plc, a member of HSBC Group. Details of such
transactions executed during the year ended 31 July 2017 are shown below.
11. Transaction costs
For the year from 1 August 2016 to 31 July 2017, the Fund incurred transaction costs related to purchase or sale of securities and derivative
products as follows:
The above transaction costs include costs directly linked to the acquisition or sale of investments, to the extent that such costs are shown
separately on transaction confirmations.
Transaction costs are incorporated directly in dealing prices of assets and are not reported as a separate line in the statement of operations.
HSBC Portfolios - HSBC Portfolios - HSBC Portfolios - HSBC Portfolios - HSBC Portfolios -
World Selection 1 World Selection 2 World Selection 3 World Selection 4 World Selection 5
USD USD USD USD USD
HSBC Bank Plc
-Cash at bank and at broker 47,408,398 57,650,210 52,530,904 41,361,270 15,317,487
-Interest income earned
from deposits 21,508 19,748 13,388 7,445 3,738
-Bank overdraft (450,248) - (89,371) (39,049) (16,705)
-Interest on bank overdraft (1,223) (154) (287) - (1,351)
HSBC Portfolios - HSBC Portfolios - HSBC Portfolios - HSBC Portfolios - HSBC Portfolios -
World Selection 1 World Selection 2 World Selection 3 World Selection 4 World Selection 5
USD USD USD USD USD
HSBC Bank Plc
Total aggregate value of such
transactions during the year 581,896,167 808,867,425 935,612,524 703,452,411 208,832,705
Percentage of such transactions in value
to total transactions during the year 71.54% 92.96% 90.84% 98.18% 88.61%
Commission paid during the year 9,069 10,346 14,619 13,355 5,443
Average rate of commission 0.002% 0.001% 0.002% 0.002% 0.003%
HSBC Portfolios - World Selection 1 10,345USD
HSBC Portfolios - World Selection 2 11,720USD
HSBC Portfolios - World Selection 3 22,021USD
HSBC Portfolios - World Selection 4 17,270USD
HSBC Portfolios - World Selection 5 13,495USD

Notes to the Financial Statementsfor the year ended 31 July 2017 (continued)
34
12. Global Exposure
The global risk on derivatives has been determined according to the commitment approach during the financial year ended 31 July 2017.
13. Pricing Adjustment
The Directors adopted a Pricing Adjustment Policy on 10 June 2014, details of which are disclosed in section 2.6 (4) “Pricing Adjustment” of the
current Prospectus of the Company.
As at 31 July 2017, the Directors have not implemented this policy and there were no pricing adjustments during the year.
14. Subsequent Events
There were no events subsequent to the annual report date which would require adjustments to or disclosures in these financial statements.

Schedule of Investments and Other Net Assetsas at 31 July 2017
HSBC Portfolios - World Selection 1
Quantity/ Description Market Value Market Value as a Percentage
Face Value USD of Net Assets %
Transferable Securities Admitted to an Official Stock Exchange Listing 177,160,871 37.38
Bonds 177,160,871 37.38
Australia 8,900,946 1.88
1,540,000 Australia (Govt) 2.75% 21/04/2024 1,254,319 0.26
2,000,000 Australia (Govt) 3.25% 21/04/2029 1,669,981 0.35
2,090,000 Australia (Govt) 3.25% 21/10/2018 1,701,014 0.36
300,000 Australia (Govt) 4.5% 21/04/2033 284,457 0.06
1,100,000 Australia (Govt) 5.75% 15/05/2021 996,762 0.21
207,000 Commonwealth Bank of Australia 5.5% 06/08/2019 270,550 0.06
2,000,000 Queensland Treasury 4.75% 07/2025 1,807,154 0.38
88,000 Scentre Group Trust 2.375% 05/11/2019 88,192 0.02
277,000 Scentre Management 1.5% 16/07/2020 338,040 0.07
167,000 Scentre Management 3.75% 03/2027 169,279 0.04
246,000 Sydney Airport Finance 2.75% 23/04/2024 321,198 0.07
Austria 529,522 0.11
207,000 OMV 6.75% VRN PERP 255,646 0.05
207,000 Telekom Finanzmanagement 3.125% 03/12/2021 273,876 0.06
Belgium 2,300,657 0.49
121,000 Anheuser Busch InBev 1.5% 17/03/2025 149,353 0.03
32,000 Anheuser Busch InBev 2% 17/03/2028 39,945 0.01
231,000 Anheuser-Busch InBev 4% 26/04/2018 280,865 0.06
157,000 Anheuser-Busch InBev Worldwide 2.5% 15/07/2022 158,015 0.03
390,000 Belgium (Govt) 1% 22/06/2031 448,667 0.10
102,900 Belgium (Govt) 2.25% 22/06/2023 136,864 0.03
350,000 Belgium (Govt) 2.6% 22/06/2024 477,870 0.10
164,000 Belgium (Govt) 3.75% 22/06/2045 278,544 0.06
200,000 Belgium (Govt) 3.75% 28/09/2020 267,088 0.06
50,000 Belgium (Govt) 4% 28/03/2019 63,446 0.01
Canada 7,942,928 1.68
800,000 Canada (Govt) 0.75% 01/09/2021 618,435 0.13
1,050,000 Canada (Govt) 1.5% 01/06/2026 805,936 0.17
3,500,000 Canada (Govt) 1.75% 01/03/2019 2,819,605 0.60
700,000 Canada (Govt) 2.5% 01/06/2024 582,852 0.12
850,000 Canada (Govt) 2.75% 01/06/2022 713,754 0.15
1,300,000 Canada (Govt) 3.5% 01/12/2045 1,252,010 0.27
1,050,000 Canada (Govt) 5.75% 01/06/2029 1,150,336 0.24
Cayman Islands 287,064 0.06
238,000 Hutchison Whampoa 3.75% VRN PERP 287,064 0.06
Denmark 1,391,356 0.29
223,000 Danske Bank 3.875% VRN 04/10/2023 274,174 0.06
2,100,000 Denmark (Govt) 1.5% 15/11/2023 363,028 0.07
1,300,000 Denmark (Govt) 4% 15/11/2019 227,776 0.05
2,000,000 Denmark (Govt) 4.5% 15/11/2039 526,378 0.11
France 12,733,677 2.69
161,000 AXA 3.941% VRN PERP 210,324 0.04
200,000 Banque Federative Credit Mutuel 2.375% 24/03/2026 246,454 0.05
20,000 BNP Paribas 5.75% 24/01/2022 30,950 0.01
200,000 Bouygues 4% 12/02/2018 240,939 0.05
250,000 BPCE 2.5% 15/07/2019 252,825 0.05
200,000 BPCE 3% 19/07/2024 273,554 0.06
100,000 Casino Guichard Perrachon 3.157% 06/08/2019 128,065 0.03
200,000 Essilor International 1.75% 09/04/2021 249,128 0.05
950,000 France (Govt) 1% 25/05/2019 1,151,759 0.24
800,000 France (Govt) 1.75% 25/5/2023 1,034,974 0.22
1,300,000 France (Govt) 2.5% 25/05/2030 1,792,624 0.38
35

Schedule of Investments and Other Net Assetsas at 31 July 2017 (continued)
HSBC Portfolios - World Selection 1
Quantity/ Description Market Value Market Value as a Percentage
Face Value USD of Net Assets %
France (continued)
900,000 France (Govt) 3% 25/04/2022 1,218,663 0.26
845,000 France (Govt) 4% 25/10/2038 1,450,997 0.31
200,000 GDF Suez 4.75% VRN PERP 264,586 0.06
200,000 Groupe Auchan 3.625% 19/10/2018 246,630 0.05
100,000 Imerys 1.875% 31/03/2028 121,027 0.03
950,000 OAT France 6% 25/10/2025 1,622,410 0.34
207,000 Orange 4.25% VRN PERP 261,453 0.06
200,000 Pernod Ricard 2% 22/06/2020 249,284 0.05
231,000 RCI Banque 2.25% 29/03/2021 291,781 0.06
16,000 RCI Banque 3% 09/05/2019 21,769 -
100,000 RTE Reseau De Transport 1% 19/10/2026 116,555 0.02
100,000 RTE Reseau De Transport 2% 18/04/2036 120,508 0.03
192,000 Saint Gobain 4.5% 30/09/2019 248,951 0.05
200,000 Sanofi 1.75% 10/09/2026 253,249 0.05
100,000 Scor 3% VRN 08/06/2046 127,069 0.03
100,000 Scor 3.625% VRN 27/05/2048 130,429 0.03
200,000 Societe Des Autoroutes Paris Rhin Rhône 2.25% 16/01/2020 248,803 0.05
100,000 Total 3.875% VRN PERP 127,917 0.03
Germany 5,253,176 1.11
254,000 Bayer 3% VRN 01/07/2075 312,336 0.07
500,000 Bundesrepublik Deutschland 1.75% 04/07/2022 647,946 0.14
570,000 Bundesrepublik Deutschland 1.75% 15/02/2024 748,726 0.16
315,000 Bundesrepublik Deutschland 2.5% 15/08/2046 478,415 0.10
600,000 Bundesrepublik Deutschland 3% 04/07/2020 782,317 0.17
540,000 Bundesrepublik Deutschland 4.75% 04/07/2028 918,188 0.19
10,000 Daimler 1.75% 08/11/2017 13,221 -
231,000 Daimler 2% 25/06/2021 290,987 0.06
200,000 Deutsche Bank 1% 18/03/2019 239,618 0.05
450,000 Germany (Govt) 0.25% 02/2027 519,165 0.11
223,000 Vier Gas Transport 3.125% 10/07/2023 302,257 0.06
Ireland 585,725 0.12
207,000 Aquarius & Investments Zurich 4.25% VRN 02/10/2043 284,672 0.06
278,000 GE Capital International Funding 4.418% 15/11/2035 301,053 0.06
Israel 242,333 0.05
225,000 Israel Electric 5% 12/11/2024 242,333 0.05
Italy 8,031,629 1.69
1,000,000 Italy (Govt) 3.75% 01/09/2024 1,353,947 0.29
850,000 Italy (Govt) 4.25% 01/03/2020 1,109,776 0.24
820,000 Italy (Govt) 4.5% 01/03/2024 1,155,453 0.24
1,500,000 Italy (Govt) 4.75% 01/09/2028 2,196,292 0.46
790,000 Italy (Govt) 5% 01/03/2022 1,109,617 0.23
550,000 Italy (Govt) 5% 01/08/2039 858,444 0.18
207,000 Terna 2.875% 16/02/2018 248,100 0.05
Japan 29,579,017 6.24
45,000,000 Japan (Govt) 0.1% 20/06/2020 409,488 0.09
295,000,000 Japan (Govt) 0.1% 20/06/2026 2,683,620 0.56
546,400,000 Japan (Govt) 0.2% 20/03/2019 4,970,437 1.05
10,000,000 Japan (Govt) 0.2% 20/06/2036 84,986 0.02
365,300,000 Japan (Govt) 0.9% 20/03/2022 3,453,597 0.73
416,200,000 Japan (Govt) 1.7% 20/03/2044 4,583,794 0.97
379,700,000 Japan (Govt) 1.8% 20/03/2032 4,173,934 0.88
250,000,000 Japan (Govt) 1.9% 20/09/2023 2,531,868 0.53
571,800,000 Japan (Govt) 2.2% 20/09/2028 6,356,996 1.34
317,000 Mizuho Bank 3.6% 25/09/2024 330,297 0.07
36

Schedule of Investments and Other Net Assetsas at 31 July 2017 (continued)
HSBC Portfolios - World Selection 1
Quantity/ Description Market Value Market Value as a Percentage
Face Value USD of Net Assets %
Luxembourg 948,608 0.20
389,000 Actavis Funding 2.45% 15/06/2019 393,080 0.08
207,000 Glencore Finance Europe 3.375% 30/09/2020 268,262 0.06
200,000 Hannover Finance 5% VRN 30/06/2043 287,266 0.06
Mexico 720,397 0.15
200,000 América Móvil 3.125% 16/07/2022 206,541 0.04
169,000 América Móvil 5.125% VRN 06/09/2073 209,006 0.04
300,000 Kimberly-Clark de Mexico 3.8% 08/04/2024 304,850 0.07
Netherlands 5,790,979 1.22
207,000 ABN Amro Bank 7.125% 06/07/2022 316,863 0.07
200,000 Allianz Finance 5.75% 08/07/2041 280,055 0.06
254,000 BMW Finance 1.625% 17/07/2019 309,386 0.07
18,000 BMW Finance 1.75% 20/11/2017 23,806 -
223,000 Deutsche Telekom International Finance 4.25% 16/03/2020 292,419 0.06
300,000 Dutch (Govt) 5.5% 15/01/2028 528,154 0.11
290,000 EDP Finance BV 3.625% 07/2024 290,348 0.06
124,000 ELM 4.5% VRN PERP 162,589 0.03
140,000 Heineken 1.5% 07/12/2024 172,504 0.04
315,000 ING Bank 2.5% 01/10/2019 318,235 0.07
207,000 KBC Internationale Financieringsmaatschappij 2.125% 10/09/2018 250,354 0.05
271,000 Lyondell Basell Industries 4.625% 26/02/2055 277,286 0.06
116,400 Netherlands (Govt) 1.25% 15/01/2019 141,145 0.03
240,000 Netherlands (Govt) 1.75% 15/7/2023 312,603 0.07
310,000 Netherlands (Govt) 2% 15/07/2024 411,737 0.09
100,000 Netherlands (Govt) 2.75% 15/01/2047 157,512 0.03
100,000 Relx Finance 1.375% 12/05/2026 119,915 0.02
200,000 Repsol International Finance 3.625% 07/10/2021 267,849 0.06
80,000 Teva Pharmaceuticals 3.15% 01/10/2026 76,548 0.02
100,000 Volkswagen 1.125% 10/23 117,967 0.02
100,000 Volkswagen 1.875% 03/2027 117,650 0.02
269,000 Volkswagen Finance Services 3.875% VRN PERP 325,621 0.07
200,000 Vonovia SE 3.125% 25/07/2019 250,825 0.05
207,000 Wolters Kluwer 2.5% 13/05/2024 269,608 0.06
Spain 12,409,314 2.62
200,000 BBVA Senior Finance 2.375% 22/01/2019 244,591 0.05
238,000 Ferrovial Emisiones 3.375% 07/06/2021 314,656 0.07
200,000 Red Électrica Finance 3.875% 25/01/2022 273,554 0.06
100,000 Santander Issuances 3.25% 04/04/2026 127,848 0.03
800,000 Spain (Govt) 1.4% 31/01/2020 981,325 0.21
621,000 Spain (Govt) 2.75% 30/04/2019 771,835 0.16
2,195,000 Spain (Govt) 2.75% 31/10/2024 2,913,556 0.61
870,000 Spain (Govt) 4.4% 31/10/2023 1,260,900 0.27
1,400,000 Spain (Govt) 5.15% 31/10/2028 2,232,561 0.47
610,000 Spain (Govt) 5.15% 31/10/2044 1,047,486 0.22
1,380,000 Spain (Govt) 5.5% 30/04/2021 1,962,903 0.41
200,000 Telefónica Emisiones 3.987% 23/01/2023 278,099 0.06
Sweden 1,480,163 0.31
223,000 Skandinaviska Enskilda 4% 12/09/2022 264,129 0.05
2,500,000 Sweden (Govt) 3.5% 06/2022 360,779 0.08
2,500,000 Sweden (Govt) 2.5% 12/05/2025 355,525 0.07
1,500,000 Sweden (Govt) 5% 01/12/2020 218,494 0.05
1,700,000 Swedish (Govt) 3.5% 03/2039 281,236 0.06
Switzerland 990,920 0.21
500,000 Credit Suisse 3.625% 09/09/2024 519,610 0.11
207,000 UBS 4.75% VRN 12/02/2026 271,098 0.06
200,000 UBS Group Funding 2.65% 01/02/2022 200,212 0.04
United Kingdom 12,035,091 2.54
93,000 Barclays Bank 10% 21/05/2021 158,053 0.03
363,000 Barclays Bank 7.625% 21/11/2022 419,891 0.09
200,000 Barclays PLC 2.75% 08/11/2019 202,599 0.04
223,000 Compass Group 3.125% 13/02/2019 275,851 0.06
100,000 FCE Bank 1.875% 18/04/2019 121,911 0.03
37

Schedule of Investments and Other Net Assetsas at 31 July 2017 (continued)
HSBC Portfolios - World Selection 1
Quantity/ Description Market Value Market Value as a Percentage
Face Value USD of Net Assets %
United Kingdom (continued)
214,000 HSBC Holdings 0.875% 06/09/2024 251,561 0.05
100,000 HSBC Holdings 2.5% 15/03/2027 132,210 0.03
207,000 HSBC Holdings 3.375% VRN 10/01/2024 255,477 0.05
200,000 HSBC Holdings 6% VRN PERP 210,045 0.04
207,000 Mondi Finance 3.375% 28/09/2020 268,312 0.06
288,000 Royal Bank of Scotland 3.875% 12/09/2023 295,675 0.06
300,000 Santander UK Group Holdings 2.35% 10/09/2019 302,486 0.06
200,000 Sky 3.75% 16/09/2024 206,882 0.04
930,000 UK (Govt) 1.25% 22/07/2018 1,237,554 0.26
460,500 UK (Govt) 2.25% 07/09/2023 662,613 0.14
133,900 UK (Govt) 3.25% 22/01/2044 225,824 0.05
670,000 UK (Govt) 3.75% 07/09/2020 977,361 0.21
1,150,000 UK (Govt) 4% 22/01/2060 2,559,605 0.54
1,054,200 UK (Govt) 4.25% 07/12/2027 1,797,024 0.38
560,000 UK Treasury Gilt 2% 07/09/2025 796,836 0.17
184,000 Vodafone Group 4.65% 20/01/2022 258,278 0.06
407,000 WPP Finance 3.75% 19/09/2024 419,043 0.09
United States 65,007,369 13.72
283,000 21st Century Fox America 5.4% 01/10/2043 329,460 0.07
73,000 21st Century Fox America 6.4% 15/12/2035 92,965 0.02
49,000 Abbott Laboratories 3.75% 30/11/2026 50,562 0.01
400,000 Air Products And Chemicals 3.35% 31/07/2024 416,674 0.09
39,000 Altria Group 4.75% 05/05/2021 42,662 0.01
202,000 Altria Group 5.375% 31/01/2044 238,686 0.05
325,000 Amazon.com 4.95% 05/12/2044 382,756 0.08
119,000 American Express 1.55% 22/09/2017 119,019 0.03
415,000 American Express 2.25% 15/08/2019 419,345 0.09
23,000 American Express 7% 19/03/2018 23,778 -
300,000 American Tow 3.55% 07/2027 298,488 0.06
223,000 Amgen 3.875% 15/11/2021 237,378 0.05
230,000 AT&T 5.35% 01/09/2040 242,007 0.05
160,000 Bank of America 1.7% 25/08/2017 160,033 0.03
29,000 Bank of America 2.65% 01/04/2019 29,365 0.01
283,000 Bank of America 3.3% 11/01/2023 290,416 0.06
33,000 Bank of America 4.2% 26/08/2024 34,575 0.01
54,000 Bank of America 5.7% 24/01/2022 61,193 0.01
348,000 Bank of New York Mellon 2.3% 11/09/2019 351,764 0.07
261,000 Branch Banking & Trust 1.35% 01/10/2017 260,956 0.06
250,000 Branch Banking & Trust 3.8% 30/10/2026 264,920 0.06
104,000 Brandywine Operating Partners 4.1% 01/10/2024 104,811 0.02
150,000 Bristol Myers Squibb 1% 15/05/2025 178,162 0.04
428,000 Burlington Northern Santa 4.55% 01/09/2044 474,956 0.10
250,000 Capital One Bank 3.375% 15/02/2023 254,341 0.05
529,000 Capital One Financial 2.95% 23/07/2021 538,480 0.11
154,000 CF Industries 4.5% 01/12/2026 160,282 0.03
212,000 Citigroup 5.5% 13/09/2025 238,750 0.05
60,000 Citigroup 8.125% 15/07/2039 93,054 0.02
95,000 Citigroup Inc 4.75% 05/2046 101,030 0.02
200,000 Coca Cola 1.125% 09/03/2027 235,642 0.05
413,000 Comcast 3.375% 15/02/2025 429,088 0.09
100,000 Comcast Corporation 3.4% 15/07/2046 91,575 0.02
126,000 Conoco Phillips 2.875% 15/11/2021 128,740 0.03
176,000 Continental Resources 4.9% 01/06/2044 151,920 0.03
141,000 CSX 3.4% 01/08/2024 145,893 0.03
283,000 CSX 4.5% 01/08/2054 293,304 0.06
100,000 Devon Energy Corporation 5% 15/06/2045 102,142 0.02
23,000 Dominion Resources 4.45% 15/03/2021 24,681 0.01
119,000 Dominion Resources 5.75% VRN 01/10/2054 129,664 0.03
460,000 Dow Chemical 3.5% 01/10/2024 477,013 0.10
83,000 Duke Energy Pogress 4.15% 01/12/2044 87,633 0.02
38
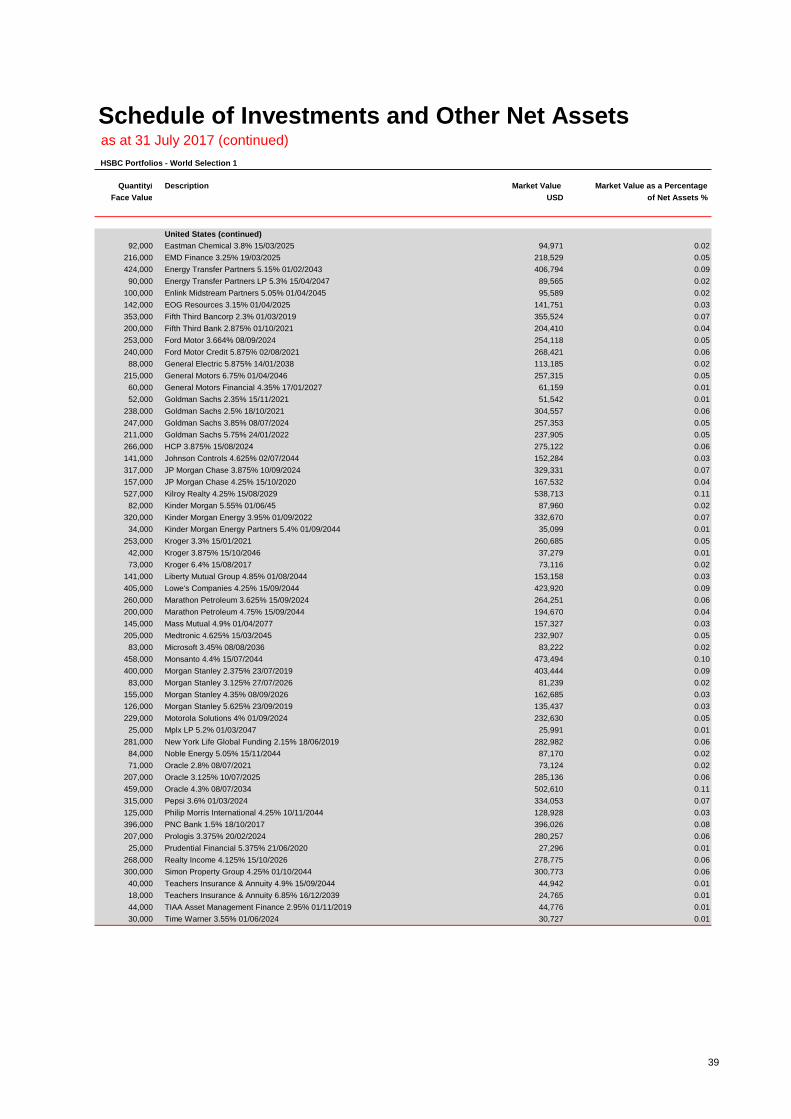
Schedule of Investments and Other Net Assetsas at 31 July 2017 (continued)
HSBC Portfolios - World Selection 1
Quantity/ Description Market Value Market Value as a Percentage
Face Value USD of Net Assets %
United States (continued)
92,000 Eastman Chemical 3.8% 15/03/2025 94,971 0.02
216,000 EMD Finance 3.25% 19/03/2025 218,529 0.05
424,000 Energy Transfer Partners 5.15% 01/02/2043 406,794 0.09
90,000 Energy Transfer Partners LP 5.3% 15/04/2047 89,565 0.02
100,000 Enlink Midstream Partners 5.05% 01/04/2045 95,589 0.02
142,000 EOG Resources 3.15% 01/04/2025 141,751 0.03
353,000 Fifth Third Bancorp 2.3% 01/03/2019 355,524 0.07
200,000 Fifth Third Bank 2.875% 01/10/2021 204,410 0.04
253,000 Ford Motor 3.664% 08/09/2024 254,118 0.05
240,000 Ford Motor Credit 5.875% 02/08/2021 268,421 0.06
88,000 General Electric 5.875% 14/01/2038 113,185 0.02
215,000 General Motors 6.75% 01/04/2046 257,315 0.05
60,000 General Motors Financial 4.35% 17/01/2027 61,159 0.01
52,000 Goldman Sachs 2.35% 15/11/2021 51,542 0.01
238,000 Goldman Sachs 2.5% 18/10/2021 304,557 0.06
247,000 Goldman Sachs 3.85% 08/07/2024 257,353 0.05
211,000 Goldman Sachs 5.75% 24/01/2022 237,905 0.05
266,000 HCP 3.875% 15/08/2024 275,122 0.06
141,000 Johnson Controls 4.625% 02/07/2044 152,284 0.03
317,000 JP Morgan Chase 3.875% 10/09/2024 329,331 0.07
157,000 JP Morgan Chase 4.25% 15/10/2020 167,532 0.04
527,000 Kilroy Realty 4.25% 15/08/2029 538,713 0.11
82,000 Kinder Morgan 5.55% 01/06/45 87,960 0.02
320,000 Kinder Morgan Energy 3.95% 01/09/2022 332,670 0.07
34,000 Kinder Morgan Energy Partners 5.4% 01/09/2044 35,099 0.01
253,000 Kroger 3.3% 15/01/2021 260,685 0.05
42,000 Kroger 3.875% 15/10/2046 37,279 0.01
73,000 Kroger 6.4% 15/08/2017 73,116 0.02
141,000 Liberty Mutual Group 4.85% 01/08/2044 153,158 0.03
405,000 Lowe's Companies 4.25% 15/09/2044 423,920 0.09
260,000 Marathon Petroleum 3.625% 15/09/2024 264,251 0.06
200,000 Marathon Petroleum 4.75% 15/09/2044 194,670 0.04
145,000 Mass Mutual 4.9% 01/04/2077 157,327 0.03
205,000 Medtronic 4.625% 15/03/2045 232,907 0.05
83,000 Microsoft 3.45% 08/08/2036 83,222 0.02
458,000 Monsanto 4.4% 15/07/2044 473,494 0.10
400,000 Morgan Stanley 2.375% 23/07/2019 403,444 0.09
83,000 Morgan Stanley 3.125% 27/07/2026 81,239 0.02
155,000 Morgan Stanley 4.35% 08/09/2026 162,685 0.03
126,000 Morgan Stanley 5.625% 23/09/2019 135,437 0.03
229,000 Motorola Solutions 4% 01/09/2024 232,630 0.05
25,000 Mplx LP 5.2% 01/03/2047 25,991 0.01
281,000 New York Life Global Funding 2.15% 18/06/2019 282,982 0.06
84,000 Noble Energy 5.05% 15/11/2044 87,170 0.02
71,000 Oracle 2.8% 08/07/2021 73,124 0.02
207,000 Oracle 3.125% 10/07/2025 285,136 0.06
459,000 Oracle 4.3% 08/07/2034 502,610 0.11
315,000 Pepsi 3.6% 01/03/2024 334,053 0.07
125,000 Philip Morris International 4.25% 10/11/2044 128,928 0.03
396,000 PNC Bank 1.5% 18/10/2017 396,026 0.08
207,000 Prologis 3.375% 20/02/2024 280,257 0.06
25,000 Prudential Financial 5.375% 21/06/2020 27,296 0.01
268,000 Realty Income 4.125% 15/10/2026 278,775 0.06
300,000 Simon Property Group 4.25% 01/10/2044 300,773 0.06
40,000 Teachers Insurance & Annuity 4.9% 15/09/2044 44,942 0.01
18,000 Teachers Insurance & Annuity 6.85% 16/12/2039 24,765 0.01
44,000 TIAA Asset Management Finance 2.95% 01/11/2019 44,776 0.01
30,000 Time Warner 3.55% 01/06/2024 30,727 0.01
39

Schedule of Investments and Other Net Assetsas at 31 July 2017 (continued)
HSBC Portfolios - World Selection 1
Quantity/ Description Market Value Market Value as a Percentage
Face Value USD of Net Assets %
United States (continued)
318,000 Time Warner Cable 4% 01/09/2021 333,999 0.07
265,000 US (Govt) 0.875% 15/06/2019 262,748 0.06
331,000 US (Govt) 1% 15/03/2019 329,340 0.07
390,000 US (Govt) 1.125% 15/01/2019 388,991 0.08
9,150,000 US (Govt) 1.25% 31/10/2018 9,146,321 1.93
2,020,000 US (Govt) 1.375% 31/05/2020 2,014,700 0.43
7,090,000 US (Govt) 1.875% 31/10/2021 7,163,822 1.51
604,000 US (Govt) 2% 15/08/2025 595,046 0.13
74,000 US (Govt) 2.25% 15/08/2046 64,318 0.01
4,025,000 US (Govt) 2.5% 15/05/2024 4,132,947 0.87
206,000 US (Govt) 3% 15/11/2045 209,822 0.04
4,034,000 US (Govt) 3.375% 15/05/2044 4,407,847 0.93
500,000 US (Govt) 6.125% 15/11/2027 674,593 0.14
427,000 US Bancorp 3.6% 11/09/2024 445,054 0.09
9,533,100 US Treasury 0.375% 01/2027 9,541,272 2.01
3,000,000 US Treasury Note 2.25% 02/2027 2,989,736 0.63
272,000 Verizon Communications 4.272% 15/01/2036 261,246 0.06
14,000 Verizon Communications 4.862% 21/08/2046 13,776 -
283,000 Vulcan Material 4.5% 06/2047 289,982 0.06
162,000 Wal-Mart Stores 5.625% 15/04/2041 210,581 0.04
260,000 Wells Fargo 3.3% 09/09/2024 265,508 0.06
283,000 Wells Fargo 4.1% 03/06/2026 295,332 0.06
315,000 Williams Partners 4.3% 04/03/2024 333,031 0.07
Units of eligible UCITS and UCI's within the meaning of article 41 (1) e
of the Luxembourg Law of 17 December 2010 249,603,872 52.66
Collective Investment Schemes 249,603,872 52.66
Ireland 11,485,495 2.42
429,629 HSBC ESI Worldwide Equity ETF 7,024,434 1.48
821,180 Ishares Fallen Angels High Yield Fund ETF 4,461,061 0.94
Luxembourg 178,900,941 37.75
162,393 HSBC Global Investment Funds - Global Asset Backed Bond "ZC" 22,739,567 4.80
1,986,579 HSBC Global Investment Funds - Global Corporate Bond "ZQ" 21,188,856 4.47
1,531,405 HSBC Global Investment Funds - Global Emerging Markets Bond "ZQ" 16,053,719 3.39
3,343,633 HSBC Global Investment Funds - Global Emerging Markets Local Debt "ZQ" 33,473,113 7.06
4,264,222 HSBC Global Investment Funds - Global Government Bond "ZQ" 43,559,028 9.19
2,064,617 HSBC Global Investment Funds - Global High Yield Bond "ZQ" 21,595,897 4.56
1,851,312 HSBC Global Investment Funds - Global Real Estate Equity "ZQ" 19,233,277 4.06
91,565 HSBC Global Investment Funds - India Fixed Income "ZD" 1,057,484 0.22
United Kingdom 59,217,436 12.49
26,419,556 FTSE All World Index "Institutional Acc" 53,081,252 11.20
1,437,000 HSBC Corporate Bond Fund "Institutional Acc" 6,136,184 1.29
Total Investments 426,764,743 90.04
Other Net Assets 47,188,455 9.96
Net Assets 473,953,198 100.00
40

Schedule of Investments and Other Net Assetsas at 31 July 2017 (continued)
HSBC Portfolios - World Selection 2
Quantity/ Description Market Value Market Value as a Percentage
Face Value USD of Net Assets %
Transferable Securities Admitted to an Official Stock Exchange Listing 181,894,809 32.09
Bonds 181,894,809 32.09
Australia 4,770,645 0.85
1,293,000 Australia & New Zealand 2.25% 13/06/2019 1,304,508 0.23
100,000 BHP Billiton Finance 4.3% 25/09/2042 163,548 0.03
100,000 BHP Billiton Finance 6.5% VRN 22/10/2077 152,240 0.03
423,000 Commonwealth Bank of Australia 5.5% 06/08/2019 552,863 0.10
140,000 Macquarie Bank 3.5% 18/12/2020 198,947 0.04
182,000 Scentre Group Trust 2.375% 05/11/2019 182,397 0.03
178,000 Scentre Management 1.375% 22/03/2023 215,961 0.04
564,000 Scentre Management 1.5% 16/07/2020 688,283 0.12
500,000 Scentre Management 3.75% 03/2027 506,825 0.09
100,000 Scentre Management 3.875% 16/07/2026 149,620 0.03
502,000 Sydney Airport Finance 2.75% 23/04/2024 655,453 0.11
Austria 1,082,067 0.19
423,000 OMV 6.75% VRN PERP 522,406 0.09
423,000 Telekom Finanzmanagement 3.125% 03/12/2021 559,661 0.10
Belgium 3,084,189 0.54
332,000 Anheuser Busch InBev 1.5% 17/03/2025 409,794 0.07
108,000 Anheuser Busch InBev 2% 17/03/2028 134,815 0.02
262,000 Anheuser-Busch 1.75% 03/2025 344,554 0.06
321,000 Anheuser-Busch 2.25% 05/2029 416,927 0.07
212,000 Anheuser-Busch 2.85% 05/2037 278,476 0.05
670,000 Anheuser-Busch InBev 4% 26/04/2018 814,632 0.14
319,000 Anheuser-Busch InBev Worldwide 2.5% 15/07/2022 321,062 0.06
300,000 KBC Groep 1.875% VRN 11/03/2027 363,929 0.07
Canada 1,839,589 0.32
811,000 Royal Bank of Canada 2.2% 23/09/2019 817,472 0.14
1,013,000 Toronto-Dominion Bank 2.25% 25/09/2019 1,022,117 0.18
Cayman Islands 836,521 0.15
244,000 Alibaba Group Holding 3.125% 28/11/2021 250,331 0.05
486,000 Hutchison Whampoa 3.75% VRN PERP 586,190 0.10
Channel Islands 926,267 0.16
300,000 Credit Suisse 1.25% 14/04/2022 363,441 0.06
350,000 Delphi Automotive 1.5% 10/03/2025 413,488 0.07
132,000 Delphi Automotive 1.6% 15/09/2028 149,338 0.03
China 254,755 0.04
250,000 Industrial and Commercial Bank of China 3.231% 13/11/2019 254,755 0.04
Denmark 1,649,754 0.29
392,000 Carlsberg Breweries 3.375% 13/10/2017 465,510 0.08
655,000 Danske Bank 3.875% VRN 04/10/2023 805,309 0.14
300,000 ISS Global 2.125% 02/12/2024 378,935 0.07
Finland 139,870 0.02
100,000 Pohjola Bank 2.5% 20/05/2022 139,870 0.02
France 14,469,733 2.56
200,000 Air Liquide Finance 0.375% 18/04/2022 237,328 0.04
329,000 AXA 3.941% VRN PERP 429,793 0.08
153,000 AXA VRN PERP 223,731 0.04
400,000 Banque Federative Credit Mutuel 2.375% 24/03/2026 492,907 0.09
300,000 Banque Federative Credit Mutuel 3% 21/05/2024 388,872 0.07
22,000 BNP Paribas 5.75% 24/01/2022 34,045 0.01
450,000 Bouygues 4% 12/02/2018 542,114 0.10
41

Schedule of Investments and Other Net Assetsas at 31 July 2017 (continued)
HSBC Portfolios - World Selection 2
Quantity/ Description Market Value Market Value as a Percentage
Face Value USD of Net Assets %
France (continued)
431,000 BPCE 2.5% 15/07/2019 435,870 0.08
600,000 BPCE 3% 19/07/2024 820,662 0.14
464,000 BPCE 4.875% 01/04/2026 494,534 0.09
100,000 Cap Gemini 1.75% 01/07/2020 123,079 0.02
100,000 Casino Guichard Perrachon 3.157% 06/08/2019 128,065 0.02
400,000 Credit Agricole London 1.25% 14/04/2026 479,929 0.08
100,000 Électricité de France 6% VRN PERP 140,262 0.02
400,000 Essilor International 1.75% 09/04/2021 498,255 0.09
100,000 GDF Suez 4.625% VRN PERP 137,644 0.02
600,000 GDF Suez 4.75% VRN PERP 793,756 0.14
300,000 Groupe Auchan 3.625% 19/10/2018 369,946 0.07
400,000 Imerys 1.875% 31/03/2028 484,107 0.09
423,000 Orange 4.25% VRN PERP 534,273 0.09
114,000 Orange 5.75% VRN PERP 167,488 0.03
154,000 Orange 8.125% 20/11/2028 315,112 0.06
700,000 Pernod Ricard 2% 22/06/2020 872,495 0.15
470,000 RCI Banque 2.25% 29/03/2021 593,668 0.10
17,000 RCI Banque 3% 09/05/2019 23,130 -
360,000 RCI Banque 3.25% 25/04/2018 482,145 0.09
200,000 RTE Reseau De Transport 1% 19/10/2026 233,111 0.04
100,000 RTE Reseau de Transport 1.625% 27/11/2025 123,773 0.02
300,000 RTE Reseau De Transport 2% 18/04/2036 361,524 0.06
392,000 Saint Gobain 4.5% 30/09/2019 508,274 0.09
300,000 Sanofi 1.75% 10/09/2026 379,874 0.07
300,000 Scor 3% VRN 08/06/2046 381,207 0.07
200,000 Scor 3.625% VRN 27/05/2048 260,857 0.05
400,000 Societe Des Autoroutes Paris Rhin Rhône 2.25% 16/01/2020 497,607 0.09
600,000 Total 2.25% VRN PERP 722,581 0.13
100,000 Total 3.875% VRN PERP 127,918 0.02
110,000 Total Capital International 2.25% 09/06/2022 153,093 0.03
375,000 WPP Finance 2.25% 22/09/2026 476,704 0.08
Germany 4,939,415 0.87
517,000 Bayer 3% VRN 01/07/2075 635,738 0.11
100,000 Bayerische Landesbank 1.25% 20/12/2021 132,881 0.02
200,000 Daimler 1% 20/12/2019 263,732 0.05
11,000 Daimler 1.75% 08/11/2017 14,543 -
470,000 Daimler 2% 25/06/2021 592,052 0.11
100,000 Daimler 2.375% 16/12/2021 138,315 0.02
120,000 Daimler 2.75% 04/12/2020 166,658 0.03
300,000 Deutsche Bank 1% 18/03/2019 359,427 0.06
300,000 Deutsche Bank 1.875% 02/2020 399,496 0.07
195,000 Deutsche Wohnen 1.375% 24/07/2020 238,560 0.04
800,000 Eurogrid 1.5% 18/04/2028 950,973 0.17
100,000 Munich Ruckvers 6.625% VRN 26/05/2042 159,244 0.03
655,000 Vier Gas Transport 3.125% 10/07/2023 887,796 0.16
Ireland 1,828,292 0.32
423,000 Aquarius & Investments Zurich 4.25% VRN 02/10/2043 581,721 0.10
300,000 CRH Finance 3.125% 03/04/2023 403,722 0.07
566,000 GE Capital International Funding 4.418% 15/11/2035 612,936 0.11
120,000 GE Capital UK Funding 5.875% 18/01/2033 229,913 0.04
42
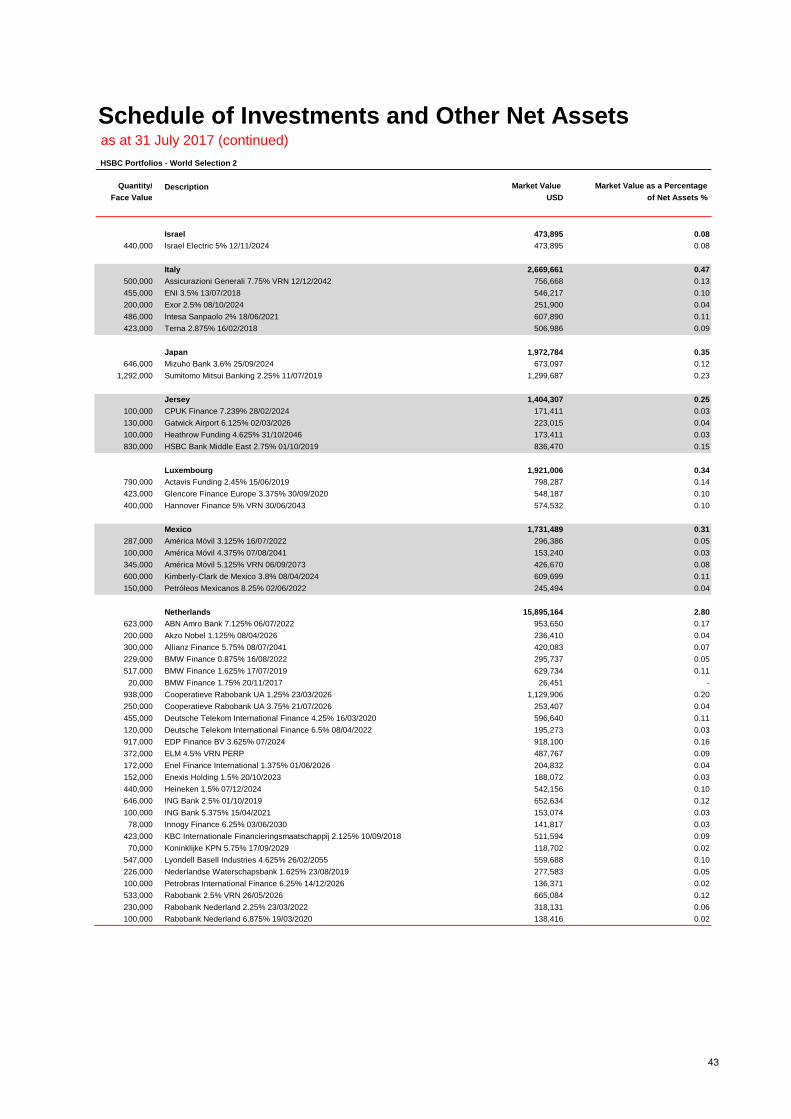
Schedule of Investments and Other Net Assetsas at 31 July 2017 (continued)
HSBC Portfolios - World Selection 2
Quantity/ Description Market Value Market Value as a Percentage
Face Value USD of Net Assets %
Israel 473,895 0.08
440,000 Israel Electric 5% 12/11/2024 473,895 0.08
Italy 2,669,661 0.47
500,000 Assicurazioni Generali 7.75% VRN 12/12/2042 756,668 0.13
455,000 ENI 3.5% 13/07/2018 546,217 0.10
200,000 Exor 2.5% 08/10/2024 251,900 0.04
486,000 Intesa Sanpaolo 2% 18/06/2021 607,890 0.11
423,000 Terna 2.875% 16/02/2018 506,986 0.09
Japan 1,972,784 0.35
646,000 Mizuho Bank 3.6% 25/09/2024 673,097 0.12
1,292,000 Sumitomo Mitsui Banking 2.25% 11/07/2019 1,299,687 0.23
Jersey 1,404,307 0.25
100,000 CPUK Finance 7.239% 28/02/2024 171,411 0.03
130,000 Gatwick Airport 6.125% 02/03/2026 223,015 0.04
100,000 Heathrow Funding 4.625% 31/10/2046 173,411 0.03
830,000 HSBC Bank Middle East 2.75% 01/10/2019 836,470 0.15
Luxembourg 1,921,006 0.34
790,000 Actavis Funding 2.45% 15/06/2019 798,287 0.14
423,000 Glencore Finance Europe 3.375% 30/09/2020 548,187 0.10
400,000 Hannover Finance 5% VRN 30/06/2043 574,532 0.10
Mexico 1,731,489 0.31
287,000 América Móvil 3.125% 16/07/2022 296,386 0.05
100,000 América Móvil 4.375% 07/08/2041 153,240 0.03
345,000 América Móvil 5.125% VRN 06/09/2073 426,670 0.08
600,000 Kimberly-Clark de Mexico 3.8% 08/04/2024 609,699 0.11
150,000 Petróleos Mexicanos 8.25% 02/06/2022 245,494 0.04
Netherlands 15,895,164 2.80
623,000 ABN Amro Bank 7.125% 06/07/2022 953,650 0.17
200,000 Akzo Nobel 1.125% 08/04/2026 236,410 0.04
300,000 Allianz Finance 5.75% 08/07/2041 420,083 0.07
229,000 BMW Finance 0.875% 16/08/2022 295,737 0.05
517,000 BMW Finance 1.625% 17/07/2019 629,734 0.11
20,000 BMW Finance 1.75% 20/11/2017 26,451 -
938,000 Cooperatieve Rabobank UA 1.25% 23/03/2026 1,129,906 0.20
250,000 Cooperatieve Rabobank UA 3.75% 21/07/2026 253,407 0.04
455,000 Deutsche Telekom International Finance 4.25% 16/03/2020 596,640 0.11
120,000 Deutsche Telekom International Finance 6.5% 08/04/2022 195,273 0.03
917,000 EDP Finance BV 3.625% 07/2024 918,100 0.16
372,000 ELM 4.5% VRN PERP 487,767 0.09
172,000 Enel Finance International 1.375% 01/06/2026 204,832 0.04
152,000 Enexis Holding 1.5% 20/10/2023 188,072 0.03
440,000 Heineken 1.5% 07/12/2024 542,156 0.10
646,000 ING Bank 2.5% 01/10/2019 652,634 0.12
100,000 ING Bank 5.375% 15/04/2021 153,074 0.03
78,000 Innogy Finance 6.25% 03/06/2030 141,817 0.03
423,000 KBC Internationale Financieringsmaatschappij 2.125% 10/09/2018 511,594 0.09
70,000 Koninklijke KPN 5.75% 17/09/2029 118,702 0.02
547,000 Lyondell Basell Industries 4.625% 26/02/2055 559,688 0.10
226,000 Nederlandse Waterschapsbank 1.625% 23/08/2019 277,583 0.05
100,000 Petrobras International Finance 6.25% 14/12/2026 136,371 0.02
533,000 Rabobank 2.5% VRN 26/05/2026 665,084 0.12
230,000 Rabobank Nederland 2.25% 23/03/2022 318,131 0.06
100,000 Rabobank Nederland 6.875% 19/03/2020 138,416 0.02
43

Schedule of Investments and Other Net Assetsas at 31 July 2017 (continued)
HSBC Portfolios - World Selection 2
Quantity/ Description Market Value Market Value as a Percentage
Face Value USD of Net Assets %
Netherlands (continued)
480,000 Relx Finance 1.375% 12/05/2026 575,592 0.10
400,000 Repsol International Finance 3.625% 07/10/2021 535,698 0.09
200,000 Swiss Reinsurance Company 2.6% VRN PERP 243,026 0.04
270,000 Teva Pharmaceuticals 3.15% 01/10/2026 258,350 0.05
800,000 Unilever 1% 03/06/2023 967,757 0.17
200,000 Volkswagen 1.125% 10/23 235,933 0.04
300,000 Volkswagen 1.875% 03/2027 352,949 0.06
549,000 Volkswagen Finance Services 3.875% VRN PERP 664,557 0.12
100,000 Volkswagen Financial Services 2.25% 04/2025 131,989 0.02
500,000 Vonovia SE 3.125% 25/07/2019 627,063 0.11
423,000 Wolters Kluwer 2.5% 13/05/2024 550,938 0.10
South Korea 224,160 0.04
224,000 Hyundai Capital 3% 03/2022 224,160 0.04
Spain 4,146,696 0.73
700,000 BBVA Senior Finance 2.375% 22/01/2019 856,068 0.15
686,000 Ferrovial Emisiones 3.375% 07/06/2021 906,950 0.16
400,000 Red Électrica Finance 3.875% 25/01/2022 547,108 0.10
600,000 Santander Issuances 3.25% 04/04/2026 767,087 0.13
300,000 Telefónica Emisiones 1.46% 13/04/2026 357,828 0.06
400,000 Telefónica Emisiones 3.987% 23/01/2023 556,198 0.10
100,000 Telefónica Emisiones 5.289% 09/12/2022 155,457 0.03
Sweden 2,408,927 0.43
455,000 Skandinaviska Enskilda 4% 12/09/2022 538,918 0.10
1,542,000 Svenska Handelsbanken 2.25% 17/06/2019 1,555,354 0.27
300,000 Teliasonera 1.625% 23/02/2035 314,655 0.06
Switzerland 3,789,432 0.67
717,000 Credit Suisse 1.375% 29/11/2019 873,848 0.15
181,000 Credit Suisse 3% 27/05/2022 254,790 0.04
1,218,000 Credit Suisse 3.625% 09/09/2024 1,265,770 0.22
423,000 UBS 4.75% VRN 12/02/2026 553,983 0.10
230,000 UBS Group Funding 1.25% 01/09/2026 269,736 0.05
367,000 UBS Group Funding 2.65% 01/02/2022 367,389 0.07
200,000 UBS Group Funding 3% 15/04/2021 203,916 0.04
United Kingdom 21,868,354 3.86
150,000 Affinity Water Finance 5.875% 13/07/2026 261,527 0.05
250,000 Astrazeneca 3.375% 16/11/2025 256,885 0.04
100,000 Aviva 6.625% VRN 03/06/2041 152,211 0.03
130,000 B.A.T. International Finance 7.25% 12/03/2024 225,641 0.04
243,000 Barclays Bank 10% 21/05/2021 412,976 0.07
398,000 Barclays Bank 7.625% 21/11/2022 460,377 0.08
254,000 Barclays PLC 2.75% 08/11/2019 257,301 0.05
167,000 Barclays Plc 3.125% 01/2024 232,006 0.04
250,000 Barclays PLC 5.25% 17/08/2045 284,399 0.05
130,000 BG Energy Capital 6.5% VRN 30/11/2072 174,492 0.03
243,000 BP Capital Markets 1.177% 12/08/2023 311,677 0.05
100,000 BP Capital Markets 2.03% 2/2025 133,366 0.02
486,000 BP Capital Markets 3.83% 06/10/2017 577,266 0.10
455,000 British Telecommunications 1.125% 10/06/2019 548,676 0.10
100,000 BUPA Finance 5% 08/12/2026 151,865 0.03
170,000 Circle Anglia Social Hsg 7.25% 12/11/2038 383,563 0.07
100,000 Compass Group 2% 07/2029 129,815 0.02
455,000 Compass Group 3.125% 13/02/2019 562,836 0.10
300,000 FCE Bank 1.528% 09/11/2020 368,589 0.07
204,000 FCE Bank 1.875% 18/04/2019 248,698 0.04
125,000 Glaxo Smith Kline Capital 6.375% 09/03/2039 263,070 0.05
100,000 Hammerson 7.25% 21/04/2028 186,429 0.03
429,000 HSBC Holdings 0.875% 06/09/2024 504,297 0.09
44
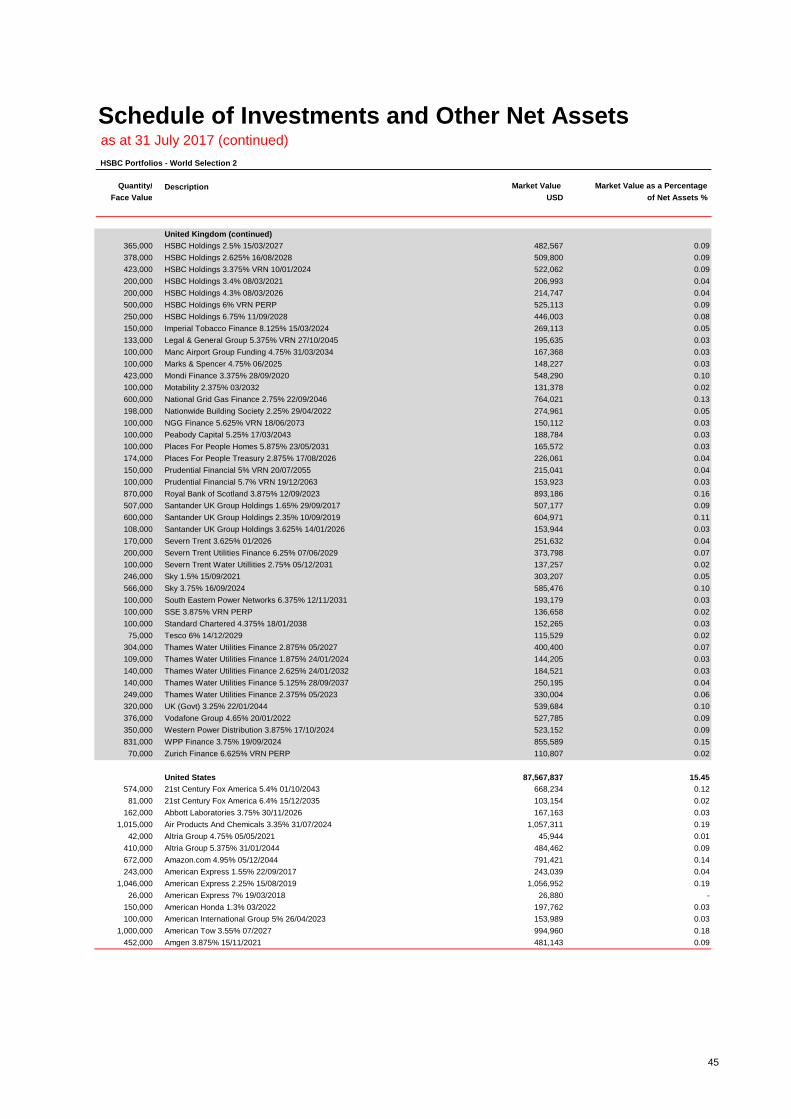
Schedule of Investments and Other Net Assetsas at 31 July 2017 (continued)
HSBC Portfolios - World Selection 2
Quantity/ Description Market Value Market Value as a Percentage
Face Value USD of Net Assets %
United Kingdom (continued)
365,000 HSBC Holdings 2.5% 15/03/2027 482,567 0.09
378,000 HSBC Holdings 2.625% 16/08/2028 509,800 0.09
423,000 HSBC Holdings 3.375% VRN 10/01/2024 522,062 0.09
200,000 HSBC Holdings 3.4% 08/03/2021 206,993 0.04
200,000 HSBC Holdings 4.3% 08/03/2026 214,747 0.04
500,000 HSBC Holdings 6% VRN PERP 525,113 0.09
250,000 HSBC Holdings 6.75% 11/09/2028 446,003 0.08
150,000 Imperial Tobacco Finance 8.125% 15/03/2024 269,113 0.05
133,000 Legal & General Group 5.375% VRN 27/10/2045 195,635 0.03
100,000 Manc Airport Group Funding 4.75% 31/03/2034 167,368 0.03
100,000 Marks & Spencer 4.75% 06/2025 148,227 0.03
423,000 Mondi Finance 3.375% 28/09/2020 548,290 0.10
100,000 Motability 2.375% 03/2032 131,378 0.02
600,000 National Grid Gas Finance 2.75% 22/09/2046 764,021 0.13
198,000 Nationwide Building Society 2.25% 29/04/2022 274,961 0.05
100,000 NGG Finance 5.625% VRN 18/06/2073 150,112 0.03
100,000 Peabody Capital 5.25% 17/03/2043 188,784 0.03
100,000 Places For People Homes 5.875% 23/05/2031 165,572 0.03
174,000 Places For People Treasury 2.875% 17/08/2026 226,061 0.04
150,000 Prudential Financial 5% VRN 20/07/2055 215,041 0.04
100,000 Prudential Financial 5.7% VRN 19/12/2063 153,923 0.03
870,000 Royal Bank of Scotland 3.875% 12/09/2023 893,186 0.16
507,000 Santander UK Group Holdings 1.65% 29/09/2017 507,177 0.09
600,000 Santander UK Group Holdings 2.35% 10/09/2019 604,971 0.11
108,000 Santander UK Group Holdings 3.625% 14/01/2026 153,944 0.03
170,000 Severn Trent 3.625% 01/2026 251,632 0.04
200,000 Severn Trent Utilities Finance 6.25% 07/06/2029 373,798 0.07
100,000 Severn Trent Water Utillities 2.75% 05/12/2031 137,257 0.02
246,000 Sky 1.5% 15/09/2021 303,207 0.05
566,000 Sky 3.75% 16/09/2024 585,476 0.10
100,000 South Eastern Power Networks 6.375% 12/11/2031 193,179 0.03
100,000 SSE 3.875% VRN PERP 136,658 0.02
100,000 Standard Chartered 4.375% 18/01/2038 152,265 0.03
75,000 Tesco 6% 14/12/2029 115,529 0.02
304,000 Thames Water Utilities Finance 2.875% 05/2027 400,400 0.07
109,000 Thames Water Utilities Finance 1.875% 24/01/2024 144,205 0.03
140,000 Thames Water Utilities Finance 2.625% 24/01/2032 184,521 0.03
140,000 Thames Water Utilities Finance 5.125% 28/09/2037 250,195 0.04
249,000 Thames Water Utilities Finance 2.375% 05/2023 330,004 0.06
320,000 UK (Govt) 3.25% 22/01/2044 539,684 0.10
376,000 Vodafone Group 4.65% 20/01/2022 527,785 0.09
350,000 Western Power Distribution 3.875% 17/10/2024 523,152 0.09
831,000 WPP Finance 3.75% 19/09/2024 855,589 0.15
70,000 Zurich Finance 6.625% VRN PERP 110,807 0.02
United States 87,567,837 15.45
574,000 21st Century Fox America 5.4% 01/10/2043 668,234 0.12
81,000 21st Century Fox America 6.4% 15/12/2035 103,154 0.02
162,000 Abbott Laboratories 3.75% 30/11/2026 167,163 0.03
1,015,000 Air Products And Chemicals 3.35% 31/07/2024 1,057,311 0.19
42,000 Altria Group 4.75% 05/05/2021 45,944 0.01
410,000 Altria Group 5.375% 31/01/2044 484,462 0.09
672,000 Amazon.com 4.95% 05/12/2044 791,421 0.14
243,000 American Express 1.55% 22/09/2017 243,039 0.04
1,046,000 American Express 2.25% 15/08/2019 1,056,952 0.19
26,000 American Express 7% 19/03/2018 26,880 -
150,000 American Honda 1.3% 03/2022 197,762 0.03
100,000 American International Group 5% 26/04/2023 153,989 0.03
1,000,000 American Tow 3.55% 07/2027 994,960 0.18
452,000 Amgen 3.875% 15/11/2021 481,143 0.09
45

Schedule of Investments and Other Net Assetsas at 31 July 2017 (continued)
HSBC Portfolios - World Selection 2
Quantity/ Description Market Value Market Value as a Percentage
Face Value USD of Net Assets %
United States (continued)
100,000 Amgen 4% 13/09/2029 150,602 0.03
200,000 Apple 3.05% 31/07/2029 290,558 0.05
150,000 Apple 3.6% 31/07/2042 231,353 0.04
431,000 Apple 4.45% 06/05/2044 471,281 0.08
350,000 AT&T 2.6% 17/12/2029 429,348 0.08
100,000 AT&T 5.2% 18/11/2033 159,725 0.03
470,000 AT&T 5.35% 01/09/2040 494,536 0.09
150,000 AT&T 7% 30/04/2040 292,249 0.05
327,000 Bank of America 1.7% 25/08/2017 327,067 0.06
345,000 Bank of America 1.875% 10/01/2019 418,641 0.07
32,000 Bank of America 2.65% 01/04/2019 32,403 0.01
575,000 Bank of America 3.3% 11/01/2023 590,068 0.11
67,000 Bank of America 4.2% 26/08/2024 70,197 0.01
59,000 Bank of America 5.7% 24/01/2022 66,859 0.01
150,000 Bank of America 7% 31/07/2028 282,834 0.05
709,000 Bank of New York Mellon 2.3% 11/09/2019 716,668 0.13
529,000 Branch Banking & Trust 1.35% 01/10/2017 528,910 0.09
700,000 Branch Banking & Trust 3.8% 30/10/2026 741,776 0.13
210,000 Brandywine Operating Partners 4.1% 01/10/2024 211,637 0.04
300,000 Bristol Myers Squibb 1% 15/05/2025 356,325 0.06
872,000 Burlington Northern Santa 4.55% 01/09/2044 967,667 0.17
325,000 Capital One Bank 3.375% 15/02/2023 330,644 0.06
1,077,000 Capital One Financial 2.95% 23/07/2021 1,096,300 0.19
461,000 CF Industries 4.5% 01/12/2026 479,807 0.09
235,000 Citigroup 4.375% 02/11/2018 292,873 0.05
430,000 Citigroup 5.5% 13/09/2025 484,257 0.09
66,000 Citigroup 8.125% 15/07/2039 102,359 0.02
285,000 Citigroup Inc 4.75% 05/2046 303,089 0.05
1,065,000 Coca Cola 1.125% 09/03/2027 1,254,794 0.22
837,000 Comcast 3.375% 15/02/2025 869,605 0.15
267,000 Comcast Corporation 3.4% 15/07/2046 244,505 0.04
501,000 Comerica 3.8% 22/07/2026 508,748 0.09
261,000 Conoco Phillips 2.875% 15/11/2021 266,677 0.05
359,000 Continental Resources 4.9% 01/06/2044 309,883 0.06
287,000 CSX 3.4% 01/08/2024 296,960 0.05
574,000 CSX 4.5% 01/08/2054 594,899 0.10
285,000 Devon Energy Corporation 5% 15/06/2045 291,103 0.05
350,000 Discovery Communications 1.9% 19/03/2027 398,154 0.07
25,000 Dominion Resources 4.45% 15/03/2021 26,827 -
243,000 Dominion Resources 5.75% VRN 01/10/2054 264,775 0.05
1,140,000 Dow Chemical 3.5% 01/10/2024 1,182,163 0.21
171,000 Duke Energy Pogress 4.15% 01/12/2044 180,544 0.03
190,000 Eastman Chemical 3.8% 15/03/2025 196,136 0.03
1,293,000 Ebay 2.875% 01/08/2021 1,315,628 0.23
438,000 EMD Finance 3.25% 19/03/2025 443,129 0.08
1,050,000 Energy Transfer Partners 5.15% 01/02/2043 1,007,391 0.18
269,000 Energy Transfer Partners LP 5.3% 15/04/2047 267,699 0.05
226,000 Enlink Midstream Partners 5.05% 01/04/2045 216,032 0.04
288,000 EOG Resources 3.15% 01/04/2025 287,496 0.05
273,000 FedEx 4.55% 01/04/2046 289,961 0.05
718,000 Fifth Third Bancorp 2.3% 01/03/2019 723,134 0.13
304,000 Fifth Third Bank 2.875% 01/10/2021 310,703 0.05
529,000 Ford Motor 3.664% 08/09/2024 531,338 0.09
488,000 Ford Motor Credit 5.875% 02/08/2021 545,789 0.10
177,000 General Electric 5.875% 14/01/2038 227,656 0.04
432,000 General Motors 6.75% 01/04/2046 517,024 0.09
179,000 General Motors Financial 4.35% 17/01/2027 182,456 0.03
46

Schedule of Investments and Other Net Assetsas at 31 July 2017 (continued)
HSBC Portfolios - World Selection 2
Quantity/ Description Market Value Market Value as a Percentage
Face Value USD of Net Assets %
United States (continued)
300,000 Goldman Sachs 2% 27/07/2023 373,980 0.07
155,000 Goldman Sachs 2.35% 15/11/2021 153,636 0.03
486,000 Goldman Sachs 2.5% 18/10/2021 621,911 0.11
502,000 Goldman Sachs 3.85% 08/07/2024 523,041 0.09
100,000 Goldman Sachs 4.25% 29/01/2026 150,116 0.03
232,000 Goldman Sachs 5.75% 24/01/2022 261,582 0.05
1,154,000 HCP 3.875% 15/08/2024 1,193,576 0.21
287,000 Johnson Controls 4.625% 02/07/2044 309,969 0.05
1,306,000 JP Morgan Chase 3.875% 10/09/2024 1,356,803 0.24
172,000 JP Morgan Chase 4.25% 15/10/2020 183,539 0.03
250,000 Key Bank 2.5% 15/12/2019 253,599 0.04
1,078,000 Kilroy Realty 4.25% 15/08/2029 1,101,959 0.19
169,000 Kinder Morgan 5.55% 01/06/45 181,284 0.03
650,000 Kinder Morgan Energy 3.95% 01/09/2022 675,737 0.12
70,000 Kinder Morgan Energy Partners 5.4% 01/09/2044 72,263 0.01
513,000 Kroger 3.3% 15/01/2021 528,582 0.09
125,000 Kroger 3.875% 15/10/2046 110,949 0.02
80,000 Kroger 6.4% 15/08/2017 80,127 0.01
287,000 Liberty Mutual Group 4.85% 01/08/2044 311,747 0.05
820,000 Lowe's Companies 4.25% 15/09/2044 858,306 0.15
528,000 Marathon Petroleum 3.625% 15/09/2024 536,633 0.09
410,000 Marathon Petroleum 4.75% 15/09/2044 399,074 0.07
434,000 Mass Mutual 4.9% 01/04/2077 470,897 0.08
422,000 Medtronic 4.625% 15/03/2045 479,447 0.08
322,000 Metropolitan Life Global Funding I 3% 10/01/2023 329,420 0.06
376,000 Microsoft 3.125% 06/12/2028 532,772 0.09
259,000 Microsoft 3.45% 08/08/2036 259,694 0.05
167,000 Microsoft 4.2% 03/11/2035 183,682 0.03
1,133,000 Monsanto 4.4% 15/07/2044 1,171,329 0.21
800,000 Morgan Stanley 2.375% 23/07/2019 806,888 0.14
250,000 Morgan Stanley 3.125% 27/07/2026 244,696 0.04
317,000 Morgan Stanley 4.35% 08/09/2026 332,717 0.06
400,000 Morgan Stanley 5.375% 10/08/2020 546,483 0.10
256,000 Morgan Stanley 5.625% 23/09/2019 275,173 0.05
467,000 Motorola Solutions 4% 01/09/2024 474,402 0.08
80,000 Mplx LP 5.2% 01/03/2047 83,172 0.01
309,000 New York Life Global Funding 2.15% 18/06/2019 311,180 0.05
174,000 Noble Energy 5.05% 15/11/2044 180,567 0.03
143,000 Oracle 2.8% 08/07/2021 147,278 0.03
423,000 Oracle 3.125% 10/07/2025 582,669 0.10
1,183,000 Oracle 4.3% 08/07/2034 1,295,397 0.23
1,399,000 Pepsi 3.6% 01/03/2024 1,483,619 0.26
1,025,000 Philip Morris International 1.875% 15/01/2019 1,028,096 0.18
261,000 Philip Morris International 4.25% 10/11/2044 269,202 0.05
1,317,000 PNC Bank 1.5% 18/10/2017 1,317,086 0.23
423,000 Prologis 3.375% 20/02/2024 572,699 0.10
27,000 Prudential Financial 5.375% 21/06/2020 29,479 0.01
547,000 Realty Income 4.125% 15/10/2026 568,992 0.10
1,309,000 Roche Holding 2.875% 29/09/2021 1,344,984 0.24
309,000 S&P Global 4.4% 15/02/2026 334,459 0.06
700,000 Simon Property Group 3.5% 01/09/2025 718,200 0.13
612,000 Simon Property Group 4.25% 01/10/2044 613,576 0.11
2,110,000 Target 2.3% 26/06/2019 2,139,023 0.38
81,000 Teachers Insurance & Annuity 4.9% 15/09/2044 91,007 0.02
34,000 Teachers Insurance & Annuity 6.85% 16/12/2039 46,778 0.01
88,000 TIAA Asset Management Finance 2.95% 01/11/2019 89,551 0.02
33,000 Time Warner 3.55% 01/06/2024 33,799 0.01
646,000 Time Warner Cable 4% 01/09/2021 678,500 0.12
47
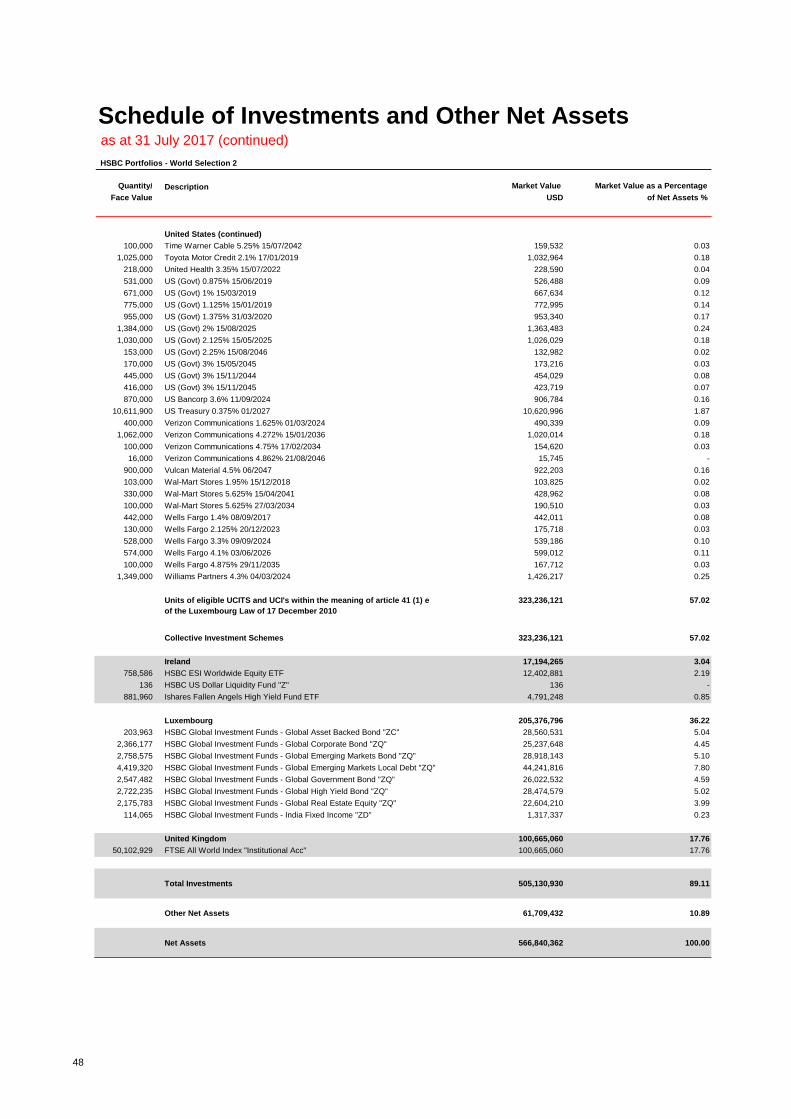
Schedule of Investments and Other Net Assetsas at 31 July 2017 (continued)
HSBC Portfolios - World Selection 2
Quantity/ Description Market Value Market Value as a Percentage
Face Value USD of Net Assets %
United States (continued)
100,000 Time Warner Cable 5.25% 15/07/2042 159,532 0.03
1,025,000 Toyota Motor Credit 2.1% 17/01/2019 1,032,964 0.18
218,000 United Health 3.35% 15/07/2022 228,590 0.04
531,000 US (Govt) 0.875% 15/06/2019 526,488 0.09
671,000 US (Govt) 1% 15/03/2019 667,634 0.12
775,000 US (Govt) 1.125% 15/01/2019 772,995 0.14
955,000 US (Govt) 1.375% 31/03/2020 953,340 0.17
1,384,000 US (Govt) 2% 15/08/2025 1,363,483 0.24
1,030,000 US (Govt) 2.125% 15/05/2025 1,026,029 0.18
153,000 US (Govt) 2.25% 15/08/2046 132,982 0.02
170,000 US (Govt) 3% 15/05/2045 173,216 0.03
445,000 US (Govt) 3% 15/11/2044 454,029 0.08
416,000 US (Govt) 3% 15/11/2045 423,719 0.07
870,000 US Bancorp 3.6% 11/09/2024 906,784 0.16
10,611,900 US Treasury 0.375% 01/2027 10,620,996 1.87
400,000 Verizon Communications 1.625% 01/03/2024 490,339 0.09
1,062,000 Verizon Communications 4.272% 15/01/2036 1,020,014 0.18
100,000 Verizon Communications 4.75% 17/02/2034 154,620 0.03
16,000 Verizon Communications 4.862% 21/08/2046 15,745 -
900,000 Vulcan Material 4.5% 06/2047 922,203 0.16
103,000 Wal-Mart Stores 1.95% 15/12/2018 103,825 0.02
330,000 Wal-Mart Stores 5.625% 15/04/2041 428,962 0.08
100,000 Wal-Mart Stores 5.625% 27/03/2034 190,510 0.03
442,000 Wells Fargo 1.4% 08/09/2017 442,011 0.08
130,000 Wells Fargo 2.125% 20/12/2023 175,718 0.03
528,000 Wells Fargo 3.3% 09/09/2024 539,186 0.10
574,000 Wells Fargo 4.1% 03/06/2026 599,012 0.11
100,000 Wells Fargo 4.875% 29/11/2035 167,712 0.03
1,349,000 Williams Partners 4.3% 04/03/2024 1,426,217 0.25
Units of eligible UCITS and UCI's within the meaning of article 41 (1) e
of the Luxembourg Law of 17 December 2010
323,236,121 57.02
Collective Investment Schemes 323,236,121 57.02
Ireland 17,194,265 3.04
758,586 HSBC ESI Worldwide Equity ETF 12,402,881 2.19
136 HSBC US Dollar Liquidity Fund "Z" 136 -
881,960 Ishares Fallen Angels High Yield Fund ETF 4,791,248 0.85
Luxembourg 205,376,796 36.22
203,963 HSBC Global Investment Funds - Global Asset Backed Bond "ZC" 28,560,531 5.04
2,366,177 HSBC Global Investment Funds - Global Corporate Bond "ZQ" 25,237,648 4.45
2,758,575 HSBC Global Investment Funds - Global Emerging Markets Bond "ZQ" 28,918,143 5.10
4,419,320 HSBC Global Investment Funds - Global Emerging Markets Local Debt "ZQ" 44,241,816 7.80
2,547,482 HSBC Global Investment Funds - Global Government Bond "ZQ" 26,022,532 4.59
2,722,235 HSBC Global Investment Funds - Global High Yield Bond "ZQ" 28,474,579 5.02
2,175,783 HSBC Global Investment Funds - Global Real Estate Equity "ZQ" 22,604,210 3.99
114,065 HSBC Global Investment Funds - India Fixed Income "ZD" 1,317,337 0.23
United Kingdom 100,665,060 17.76
50,102,929 FTSE All World Index "Institutional Acc" 100,665,060 17.76
Total Investments 505,130,930 89.11
Other Net Assets 61,709,432 10.89
Net Assets 566,840,362 100.00
48
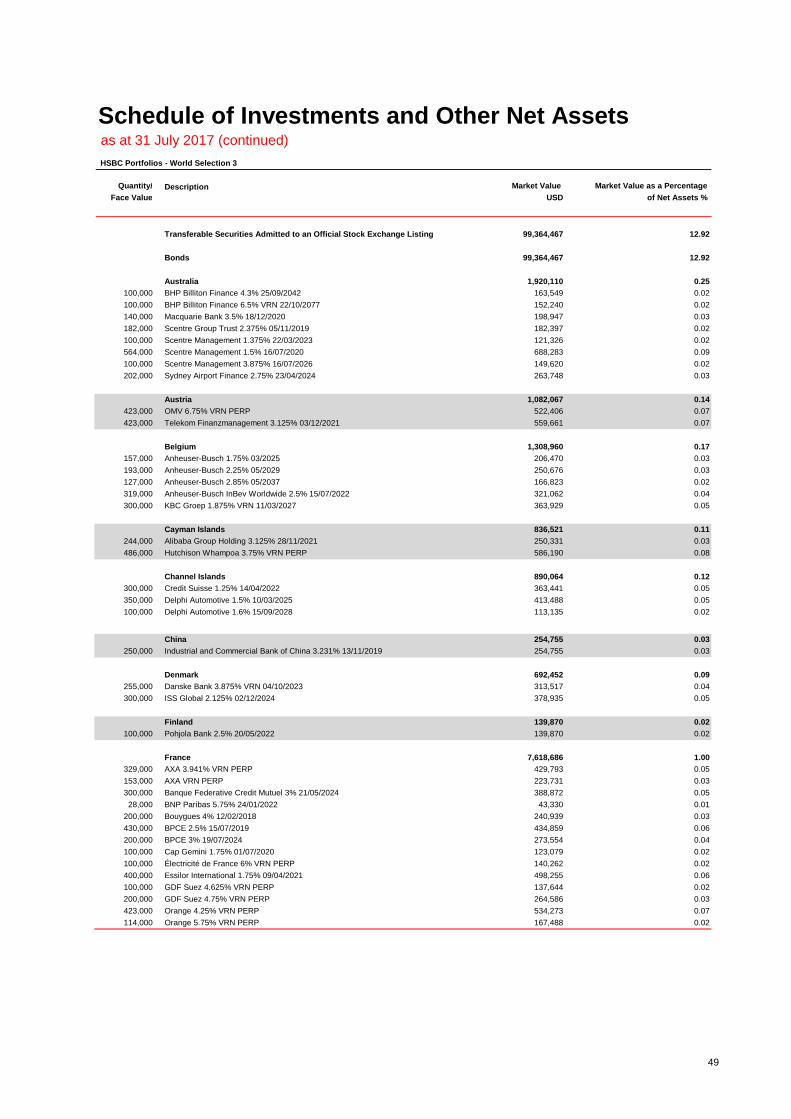
Schedule of Investments and Other Net Assetsas at 31 July 2017 (continued)
HSBC Portfolios - World Selection 3
Quantity/ Description Market Value Market Value as a Percentage
Face Value USD of Net Assets %
Transferable Securities Admitted to an Official Stock Exchange Listing 99,364,467 12.92
Bonds 99,364,467 12.92
Australia 1,920,110 0.25
100,000 BHP Billiton Finance 4.3% 25/09/2042 163,549 0.02
100,000 BHP Billiton Finance 6.5% VRN 22/10/2077 152,240 0.02
140,000 Macquarie Bank 3.5% 18/12/2020 198,947 0.03
182,000 Scentre Group Trust 2.375% 05/11/2019 182,397 0.02
100,000 Scentre Management 1.375% 22/03/2023 121,326 0.02
564,000 Scentre Management 1.5% 16/07/2020 688,283 0.09
100,000 Scentre Management 3.875% 16/07/2026 149,620 0.02
202,000 Sydney Airport Finance 2.75% 23/04/2024 263,748 0.03
Austria 1,082,067 0.14
423,000 OMV 6.75% VRN PERP 522,406 0.07
423,000 Telekom Finanzmanagement 3.125% 03/12/2021 559,661 0.07
Belgium 1,308,960 0.17
157,000 Anheuser-Busch 1.75% 03/2025 206,470 0.03
193,000 Anheuser-Busch 2.25% 05/2029 250,676 0.03
127,000 Anheuser-Busch 2.85% 05/2037 166,823 0.02
319,000 Anheuser-Busch InBev Worldwide 2.5% 15/07/2022 321,062 0.04
300,000 KBC Groep 1.875% VRN 11/03/2027 363,929 0.05
Cayman Islands 836,521 0.11
244,000 Alibaba Group Holding 3.125% 28/11/2021 250,331 0.03
486,000 Hutchison Whampoa 3.75% VRN PERP 586,190 0.08
Channel Islands 890,064 0.12
300,000 Credit Suisse 1.25% 14/04/2022 363,441 0.05
350,000 Delphi Automotive 1.5% 10/03/2025 413,488 0.05
100,000 Delphi Automotive 1.6% 15/09/2028 113,135 0.02
China 254,755 0.03
250,000 Industrial and Commercial Bank of China 3.231% 13/11/2019 254,755 0.03
Denmark 692,452 0.09
255,000 Danske Bank 3.875% VRN 04/10/2023 313,517 0.04
300,000 ISS Global 2.125% 02/12/2024 378,935 0.05
Finland 139,870 0.02
100,000 Pohjola Bank 2.5% 20/05/2022 139,870 0.02
France 7,618,686 1.00
329,000 AXA 3.941% VRN PERP 429,793 0.05
153,000 AXA VRN PERP 223,731 0.03
300,000 Banque Federative Credit Mutuel 3% 21/05/2024 388,872 0.05
28,000 BNP Paribas 5.75% 24/01/2022 43,330 0.01
200,000 Bouygues 4% 12/02/2018 240,939 0.03
430,000 BPCE 2.5% 15/07/2019 434,859 0.06
200,000 BPCE 3% 19/07/2024 273,554 0.04
100,000 Cap Gemini 1.75% 01/07/2020 123,079 0.02
100,000 Électricité de France 6% VRN PERP 140,262 0.02
400,000 Essilor International 1.75% 09/04/2021 498,255 0.06
100,000 GDF Suez 4.625% VRN PERP 137,644 0.02
200,000 GDF Suez 4.75% VRN PERP 264,586 0.03
423,000 Orange 4.25% VRN PERP 534,273 0.07
114,000 Orange 5.75% VRN PERP 167,488 0.02
49

Schedule of Investments and Other Net Assetsas at 31 July 2017 (continued)
HSBC Portfolios - World Selection 3
Quantity/ Description Market Value Market Value as a Percentage
Face Value USD of Net Assets %
France (continued)
54,000 Orange 8.125% 20/11/2028 110,494 0.01
300,000 Pernod Ricard 2% 22/06/2020 373,927 0.05
470,000 RCI Banque 2.25% 29/03/2021 593,667 0.08
22,000 RCI Banque 3% 09/05/2019 29,933 -
50,000 RCI Banque 3.25% 25/04/2018 66,965 0.01
100,000 RTE Reseau de Transport 1.625% 27/11/2025 123,773 0.02
392,000 Saint Gobain 4.5% 30/09/2019 508,274 0.07
300,000 Sanofi 1.75% 10/09/2026 379,874 0.05
300,000 Scor 3% VRN 08/06/2046 381,207 0.05
100,000 Scor 3.625% VRN 27/05/2048 130,429 0.02
400,000 Societe Des Autoroutes Paris Rhin Rhône 2.25% 16/01/2020 497,607 0.06
200,000 Total 2.25% VRN PERP 240,860 0.03
100,000 Total 3.875% VRN PERP 127,918 0.02
110,000 Total Capital International 2.25% 09/06/2022 153,093 0.02
Germany 1,764,859 0.23
517,000 Bayer 3% VRN 01/07/2075 635,739 0.08
130,000 Daimler 1% 20/12/2019 171,426 0.02
15,000 Daimler 1.75% 08/11/2017 19,831 0.01
120,000 Daimler 2.75% 04/12/2020 166,658 0.02
200,000 Deutsche Bank 1.875% 02/2020 266,330 0.04
100,000 Munich Ruckvers 6.625% VRN 26/05/2042 159,244 0.02
255,000 Vier Gas Transport 3.125% 10/07/2023 345,631 0.04
Ireland 2,137,177 0.28
423,000 Aquarius & Investments Zurich 4.25% VRN 02/10/2043 581,721 0.08
300,000 CRH Finance 3.125% 03/04/2023 403,722 0.05
565,000 GE Capital International Funding 4.418% 15/11/2035 611,853 0.08
120,000 GE Capital UK Funding 5.875% 18/01/2033 229,912 0.03
287,000 Johnson Controls 4.625% 02/07/2044 309,969 0.04
Israel 473,895 0.06
440,000 Israel Electric 5% 12/11/2024 473,895 0.06
Italy 251,900 0.03
200,000 Exor 2.5% 08/10/2024 251,900 0.03
Jersey 567,837 0.07
100,000 CPUK Finance 7.239% 28/02/2024 171,411 0.02
130,000 Gatwick Airport 6.125% 02/03/2026 223,015 0.03
100,000 Heathrow Funding 4.625% 31/10/2046 173,411 0.02
Luxembourg 1,919,996 0.25
789,000 Actavis Funding 2.45% 15/06/2019 797,277 0.10
423,000 Glencore Finance Europe 3.375% 30/09/2020 548,187 0.07
400,000 Hannover Finance 5% VRN 30/06/2043 574,532 0.08
Mexico 1,141,157 0.15
287,000 América Móvil 3.125% 16/07/2022 296,386 0.04
100,000 América Móvil 4.375% 07/08/2041 153,241 0.02
600,000 Kimberly-Clark de Mexico 3.8% 08/04/2024 609,699 0.08
50,000 Petróleos Mexicanos 8.25% 02/06/2022 81,831 0.01
50
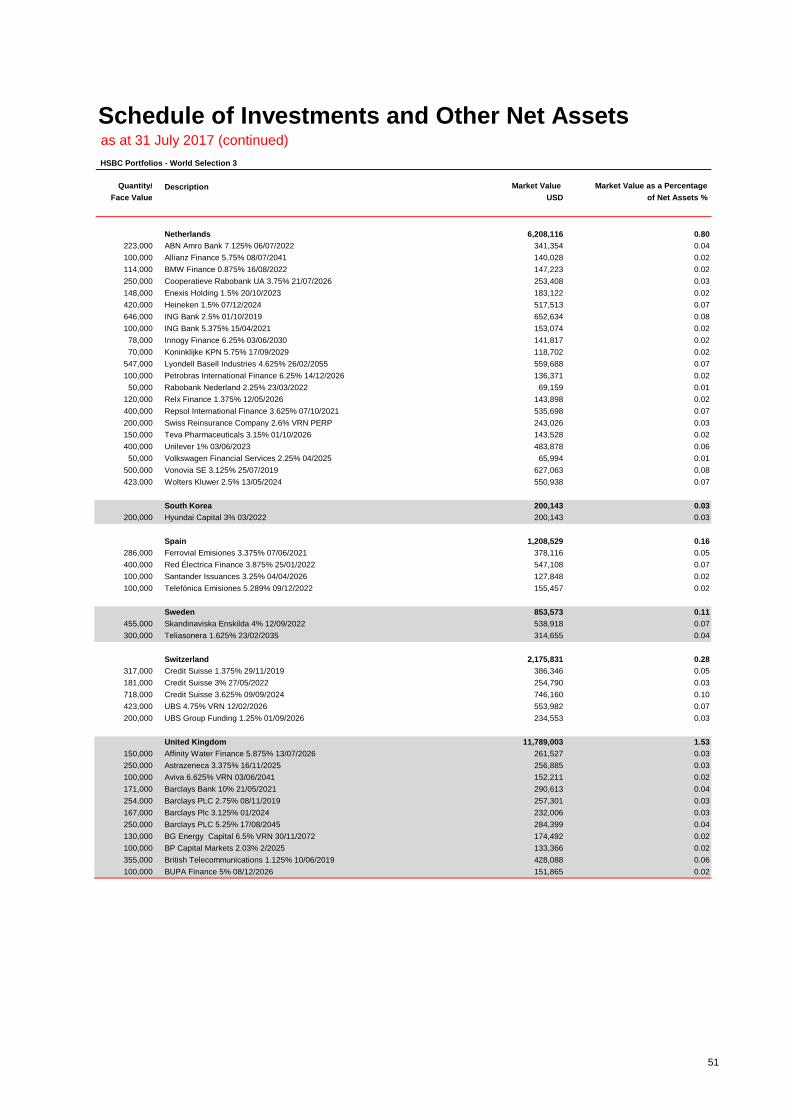
Schedule of Investments and Other Net Assetsas at 31 July 2017 (continued)
HSBC Portfolios - World Selection 3
Quantity/ Description Market Value Market Value as a Percentage
Face Value USD of Net Assets %
Netherlands 6,208,116 0.80
223,000 ABN Amro Bank 7.125% 06/07/2022 341,354 0.04
100,000 Allianz Finance 5.75% 08/07/2041 140,028 0.02
114,000 BMW Finance 0.875% 16/08/2022 147,223 0.02
250,000 Cooperatieve Rabobank UA 3.75% 21/07/2026 253,408 0.03
148,000 Enexis Holding 1.5% 20/10/2023 183,122 0.02
420,000 Heineken 1.5% 07/12/2024 517,513 0.07
646,000 ING Bank 2.5% 01/10/2019 652,634 0.08
100,000 ING Bank 5.375% 15/04/2021 153,074 0.02
78,000 Innogy Finance 6.25% 03/06/2030 141,817 0.02
70,000 Koninklijke KPN 5.75% 17/09/2029 118,702 0.02
547,000 Lyondell Basell Industries 4.625% 26/02/2055 559,688 0.07
100,000 Petrobras International Finance 6.25% 14/12/2026 136,371 0.02
50,000 Rabobank Nederland 2.25% 23/03/2022 69,159 0.01
120,000 Relx Finance 1.375% 12/05/2026 143,898 0.02
400,000 Repsol International Finance 3.625% 07/10/2021 535,698 0.07
200,000 Swiss Reinsurance Company 2.6% VRN PERP 243,026 0.03
150,000 Teva Pharmaceuticals 3.15% 01/10/2026 143,528 0.02
400,000 Unilever 1% 03/06/2023 483,878 0.06
50,000 Volkswagen Financial Services 2.25% 04/2025 65,994 0.01
500,000 Vonovia SE 3.125% 25/07/2019 627,063 0.08
423,000 Wolters Kluwer 2.5% 13/05/2024 550,938 0.07
South Korea 200,143 0.03
200,000 Hyundai Capital 3% 03/2022 200,143 0.03
Spain 1,208,529 0.16
286,000 Ferrovial Emisiones 3.375% 07/06/2021 378,116 0.05
400,000 Red Électrica Finance 3.875% 25/01/2022 547,108 0.07
100,000 Santander Issuances 3.25% 04/04/2026 127,848 0.02
100,000 Telefónica Emisiones 5.289% 09/12/2022 155,457 0.02
Sweden 853,573 0.11
455,000 Skandinaviska Enskilda 4% 12/09/2022 538,918 0.07
300,000 Teliasonera 1.625% 23/02/2035 314,655 0.04
Switzerland 2,175,831 0.28
317,000 Credit Suisse 1.375% 29/11/2019 386,346 0.05
181,000 Credit Suisse 3% 27/05/2022 254,790 0.03
718,000 Credit Suisse 3.625% 09/09/2024 746,160 0.10
423,000 UBS 4.75% VRN 12/02/2026 553,982 0.07
200,000 UBS Group Funding 1.25% 01/09/2026 234,553 0.03
United Kingdom 11,789,003 1.53
150,000 Affinity Water Finance 5.875% 13/07/2026 261,527 0.03
250,000 Astrazeneca 3.375% 16/11/2025 256,885 0.03
100,000 Aviva 6.625% VRN 03/06/2041 152,211 0.02
171,000 Barclays Bank 10% 21/05/2021 290,613 0.04
254,000 Barclays PLC 2.75% 08/11/2019 257,301 0.03
167,000 Barclays Plc 3.125% 01/2024 232,006 0.03
250,000 Barclays PLC 5.25% 17/08/2045 284,399 0.04
130,000 BG Energy Capital 6.5% VRN 30/11/2072 174,492 0.02
100,000 BP Capital Markets 2.03% 2/2025 133,366 0.02
355,000 British Telecommunications 1.125% 10/06/2019 428,088 0.06
100,000 BUPA Finance 5% 08/12/2026 151,865 0.02
51
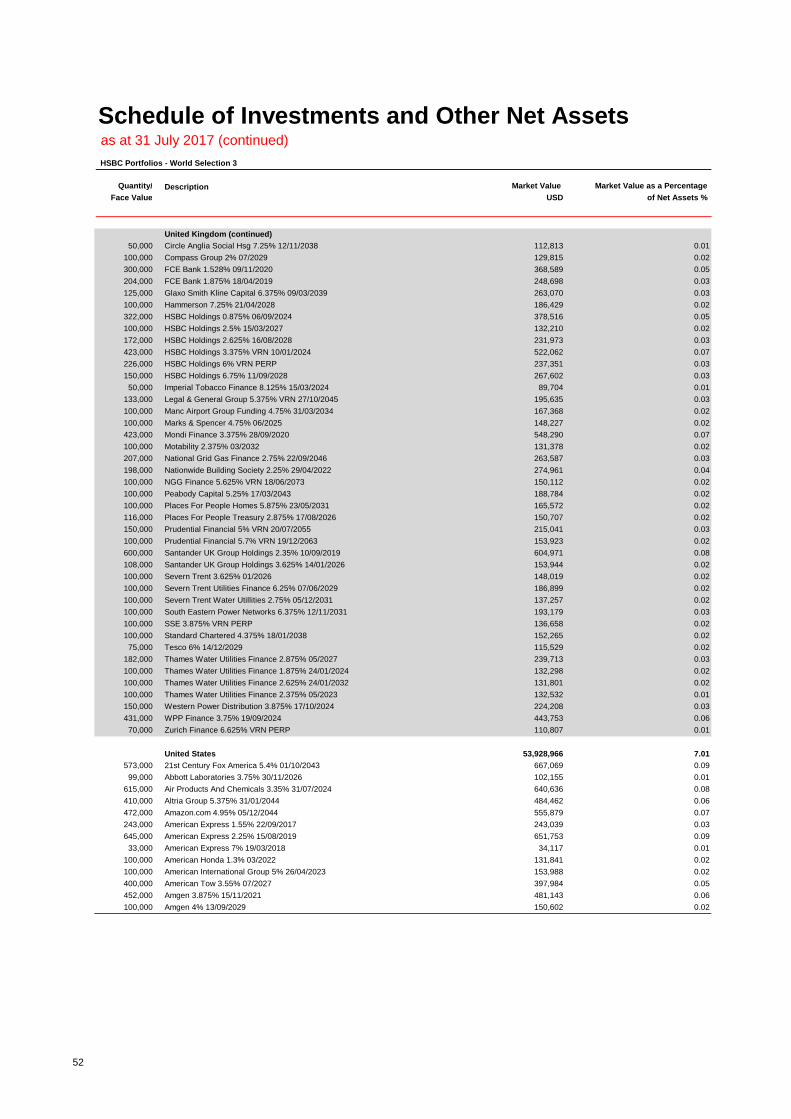
Schedule of Investments and Other Net Assetsas at 31 July 2017 (continued)
HSBC Portfolios - World Selection 3
Quantity/ Description Market Value Market Value as a Percentage
Face Value USD of Net Assets %
United Kingdom (continued)
50,000 Circle Anglia Social Hsg 7.25% 12/11/2038 112,813 0.01
100,000 Compass Group 2% 07/2029 129,815 0.02
300,000 FCE Bank 1.528% 09/11/2020 368,589 0.05
204,000 FCE Bank 1.875% 18/04/2019 248,698 0.03
125,000 Glaxo Smith Kline Capital 6.375% 09/03/2039 263,070 0.03
100,000 Hammerson 7.25% 21/04/2028 186,429 0.02
322,000 HSBC Holdings 0.875% 06/09/2024 378,516 0.05
100,000 HSBC Holdings 2.5% 15/03/2027 132,210 0.02
172,000 HSBC Holdings 2.625% 16/08/2028 231,973 0.03
423,000 HSBC Holdings 3.375% VRN 10/01/2024 522,062 0.07
226,000 HSBC Holdings 6% VRN PERP 237,351 0.03
150,000 HSBC Holdings 6.75% 11/09/2028 267,602 0.03
50,000 Imperial Tobacco Finance 8.125% 15/03/2024 89,704 0.01
133,000 Legal & General Group 5.375% VRN 27/10/2045 195,635 0.03
100,000 Manc Airport Group Funding 4.75% 31/03/2034 167,368 0.02
100,000 Marks & Spencer 4.75% 06/2025 148,227 0.02
423,000 Mondi Finance 3.375% 28/09/2020 548,290 0.07
100,000 Motability 2.375% 03/2032 131,378 0.02
207,000 National Grid Gas Finance 2.75% 22/09/2046 263,587 0.03
198,000 Nationwide Building Society 2.25% 29/04/2022 274,961 0.04
100,000 NGG Finance 5.625% VRN 18/06/2073 150,112 0.02
100,000 Peabody Capital 5.25% 17/03/2043 188,784 0.02
100,000 Places For People Homes 5.875% 23/05/2031 165,572 0.02
116,000 Places For People Treasury 2.875% 17/08/2026 150,707 0.02
150,000 Prudential Financial 5% VRN 20/07/2055 215,041 0.03
100,000 Prudential Financial 5.7% VRN 19/12/2063 153,923 0.02
600,000 Santander UK Group Holdings 2.35% 10/09/2019 604,971 0.08
108,000 Santander UK Group Holdings 3.625% 14/01/2026 153,944 0.02
100,000 Severn Trent 3.625% 01/2026 148,019 0.02
100,000 Severn Trent Utilities Finance 6.25% 07/06/2029 186,899 0.02
100,000 Severn Trent Water Utillities 2.75% 05/12/2031 137,257 0.02
100,000 South Eastern Power Networks 6.375% 12/11/2031 193,179 0.03
100,000 SSE 3.875% VRN PERP 136,658 0.02
100,000 Standard Chartered 4.375% 18/01/2038 152,265 0.02
75,000 Tesco 6% 14/12/2029 115,529 0.02
182,000 Thames Water Utilities Finance 2.875% 05/2027 239,713 0.03
100,000 Thames Water Utilities Finance 1.875% 24/01/2024 132,298 0.02
100,000 Thames Water Utilities Finance 2.625% 24/01/2032 131,801 0.02
100,000 Thames Water Utilities Finance 2.375% 05/2023 132,532 0.01
150,000 Western Power Distribution 3.875% 17/10/2024 224,208 0.03
431,000 WPP Finance 3.75% 19/09/2024 443,753 0.06
70,000 Zurich Finance 6.625% VRN PERP 110,807 0.01
United States 53,928,966 7.01
573,000 21st Century Fox America 5.4% 01/10/2043 667,069 0.09
99,000 Abbott Laboratories 3.75% 30/11/2026 102,155 0.01
615,000 Air Products And Chemicals 3.35% 31/07/2024 640,636 0.08
410,000 Altria Group 5.375% 31/01/2044 484,462 0.06
472,000 Amazon.com 4.95% 05/12/2044 555,879 0.07
243,000 American Express 1.55% 22/09/2017 243,039 0.03
645,000 American Express 2.25% 15/08/2019 651,753 0.09
33,000 American Express 7% 19/03/2018 34,117 0.01
100,000 American Honda 1.3% 03/2022 131,841 0.02
100,000 American International Group 5% 26/04/2023 153,988 0.02
400,000 American Tow 3.55% 07/2027 397,984 0.05
452,000 Amgen 3.875% 15/11/2021 481,143 0.06
100,000 Amgen 4% 13/09/2029 150,602 0.02
52

Schedule of Investments and Other Net Assetsas at 31 July 2017 (continued)
HSBC Portfolios - World Selection 3
Quantity/ Description Market Value Market Value as a Percentage
Face Value USD of Net Assets %
United States (continued)
150,000 Apple 3.6% 31/07/2042 231,353 0.03
100,000 AT&T 5.2% 18/11/2033 159,725 0.02
470,000 AT&T 5.35% 01/09/2040 494,536 0.07
150,000 AT&T 7% 30/04/2040 292,249 0.04
40,000 Bank of America 2.65% 01/04/2019 40,504 0.01
574,000 Bank of America 3.3% 11/01/2023 589,042 0.08
67,000 Bank of America 4.2% 26/08/2024 70,197 0.01
76,000 Bank of America 5.7% 24/01/2022 86,123 0.01
150,000 Bank of America 7% 31/07/2028 282,834 0.04
210,000 Brandywine Operating Partners 4.1% 01/10/2024 211,637 0.03
300,000 Bristol Myers Squibb 1% 15/05/2025 356,325 0.05
600,000 Burlington Northern Santa 4.55% 01/09/2044 665,826 0.09
308,000 CF Industries 4.5% 01/12/2026 320,565 0.04
430,000 Citigroup 5.5% 13/09/2025 484,257 0.06
84,000 Citigroup 8.125% 15/07/2039 130,276 0.02
190,000 Citigroup Inc 4.75% 05/2046 202,059 0.03
535,000 Coca Cola 1.125% 09/03/2027 630,343 0.08
837,000 Comcast 3.375% 15/02/2025 869,605 0.11
500,000 Comerica 3.8% 22/07/2026 507,733 0.07
261,000 Conoco Phillips 2.875% 15/11/2021 266,677 0.04
359,000 Continental Resources 4.9% 01/06/2044 309,883 0.04
573,000 CSX 4.5% 01/08/2054 593,863 0.08
185,000 Devon Energy Corporation 5% 15/06/2045 188,962 0.02
250,000 Discover Bank 2.6% 13/11/2018 252,296 0.03
350,000 Discovery Communications 1.9% 19/03/2027 398,154 0.05
32,000 Dominion Resources 4.45% 15/03/2021 34,339 -
243,000 Dominion Resources 5.75% VRN 01/10/2054 264,775 0.03
740,000 Dow Chemical 3.5% 01/10/2024 767,369 0.10
171,000 Duke Energy Pogress 4.15% 01/12/2044 180,544 0.02
438,000 EMD Finance 3.25% 19/03/2025 443,129 0.06
672,000 Energy Transfer Partners 5.15% 01/02/2043 644,730 0.08
179,000 Energy Transfer Partners LP 5.3% 15/04/2047 178,135 0.02
229,000 Enlink Midstream Partners 5.05% 01/04/2045 218,900 0.03
288,000 EOG Resources 3.15% 01/04/2025 287,496 0.04
717,000 Fifth Third Bancorp 2.3% 01/03/2019 722,127 0.09
304,000 Fifth Third Bank 2.875% 01/10/2021 310,703 0.04
487,000 Ford Motor Credit 5.875% 02/08/2021 544,671 0.07
177,000 General Electric 5.875% 14/01/2038 227,656 0.03
432,000 General Motors 6.75% 01/04/2046 517,024 0.07
120,000 General Motors Financial 4.35% 17/01/2027 122,317 0.02
104,000 Goldman Sachs 2.35% 15/11/2021 103,085 0.01
486,000 Goldman Sachs 2.5% 18/10/2021 621,911 0.08
201,000 Goldman Sachs 3.85% 08/07/2024 209,425 0.03
100,000 Goldman Sachs 4.25% 29/01/2026 150,116 0.02
297,000 Goldman Sachs 5.75% 24/01/2022 334,870 0.04
738,000 HCP 3.875% 15/08/2024 763,310 0.10
806,000 JP Morgan Chase 3.875% 10/09/2024 837,353 0.11
220,000 JP Morgan Chase 4.25% 15/10/2020 234,759 0.03
250,000 Key Bank 2.5% 15/12/2019 253,599 0.03
777,000 Kilroy Realty 4.25% 15/08/2029 794,269 0.10
169,000 Kinder Morgan 5.55% 01/06/45 181,284 0.02
650,000 Kinder Morgan Energy 3.95% 01/09/2022 675,737 0.09
70,000 Kinder Morgan Energy Partners 5.4% 01/09/2044 72,263 0.01
513,000 Kroger 3.3% 15/01/2021 528,582 0.07
83,000 Kroger 3.875% 15/10/2046 73,670 0.01
287,000 Liberty Mutual Group 4.85% 01/08/2044 311,747 0.04
53
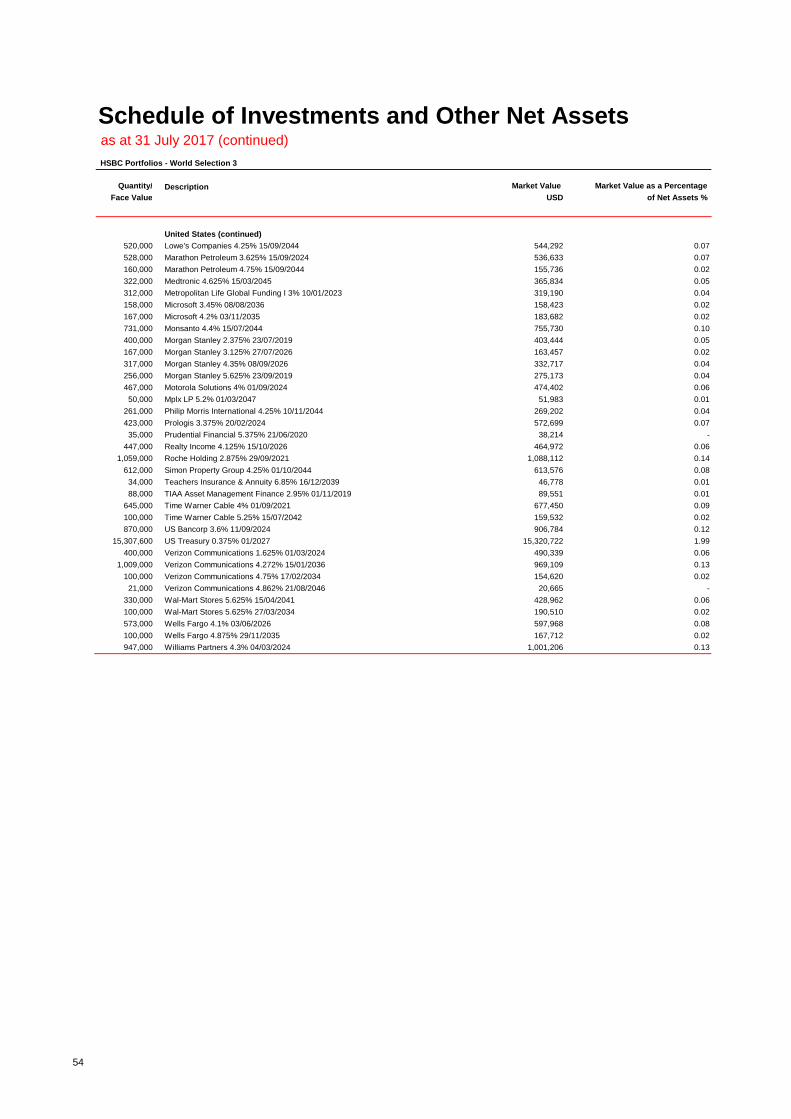
Schedule of Investments and Other Net Assetsas at 31 July 2017 (continued)
HSBC Portfolios - World Selection 3
Quantity/ Description Market Value Market Value as a Percentage
Face Value USD of Net Assets %
United States (continued)
520,000 Lowe's Companies 4.25% 15/09/2044 544,292 0.07
528,000 Marathon Petroleum 3.625% 15/09/2024 536,633 0.07
160,000 Marathon Petroleum 4.75% 15/09/2044 155,736 0.02
322,000 Medtronic 4.625% 15/03/2045 365,834 0.05
312,000 Metropolitan Life Global Funding I 3% 10/01/2023 319,190 0.04
158,000 Microsoft 3.45% 08/08/2036 158,423 0.02
167,000 Microsoft 4.2% 03/11/2035 183,682 0.02
731,000 Monsanto 4.4% 15/07/2044 755,730 0.10
400,000 Morgan Stanley 2.375% 23/07/2019 403,444 0.05
167,000 Morgan Stanley 3.125% 27/07/2026 163,457 0.02
317,000 Morgan Stanley 4.35% 08/09/2026 332,717 0.04
256,000 Morgan Stanley 5.625% 23/09/2019 275,173 0.04
467,000 Motorola Solutions 4% 01/09/2024 474,402 0.06
50,000 Mplx LP 5.2% 01/03/2047 51,983 0.01
261,000 Philip Morris International 4.25% 10/11/2044 269,202 0.04
423,000 Prologis 3.375% 20/02/2024 572,699 0.07
35,000 Prudential Financial 5.375% 21/06/2020 38,214 -
447,000 Realty Income 4.125% 15/10/2026 464,972 0.06
1,059,000 Roche Holding 2.875% 29/09/2021 1,088,112 0.14
612,000 Simon Property Group 4.25% 01/10/2044 613,576 0.08
34,000 Teachers Insurance & Annuity 6.85% 16/12/2039 46,778 0.01
88,000 TIAA Asset Management Finance 2.95% 01/11/2019 89,551 0.01
645,000 Time Warner Cable 4% 01/09/2021 677,450 0.09
100,000 Time Warner Cable 5.25% 15/07/2042 159,532 0.02
870,000 US Bancorp 3.6% 11/09/2024 906,784 0.12
15,307,600 US Treasury 0.375% 01/2027 15,320,722 1.99
400,000 Verizon Communications 1.625% 01/03/2024 490,339 0.06
1,009,000 Verizon Communications 4.272% 15/01/2036 969,109 0.13
100,000 Verizon Communications 4.75% 17/02/2034 154,620 0.02
21,000 Verizon Communications 4.862% 21/08/2046 20,665 -
330,000 Wal-Mart Stores 5.625% 15/04/2041 428,962 0.06
100,000 Wal-Mart Stores 5.625% 27/03/2034 190,510 0.02
573,000 Wells Fargo 4.1% 03/06/2026 597,968 0.08
100,000 Wells Fargo 4.875% 29/11/2035 167,712 0.02
947,000 Williams Partners 4.3% 04/03/2024 1,001,206 0.13
54
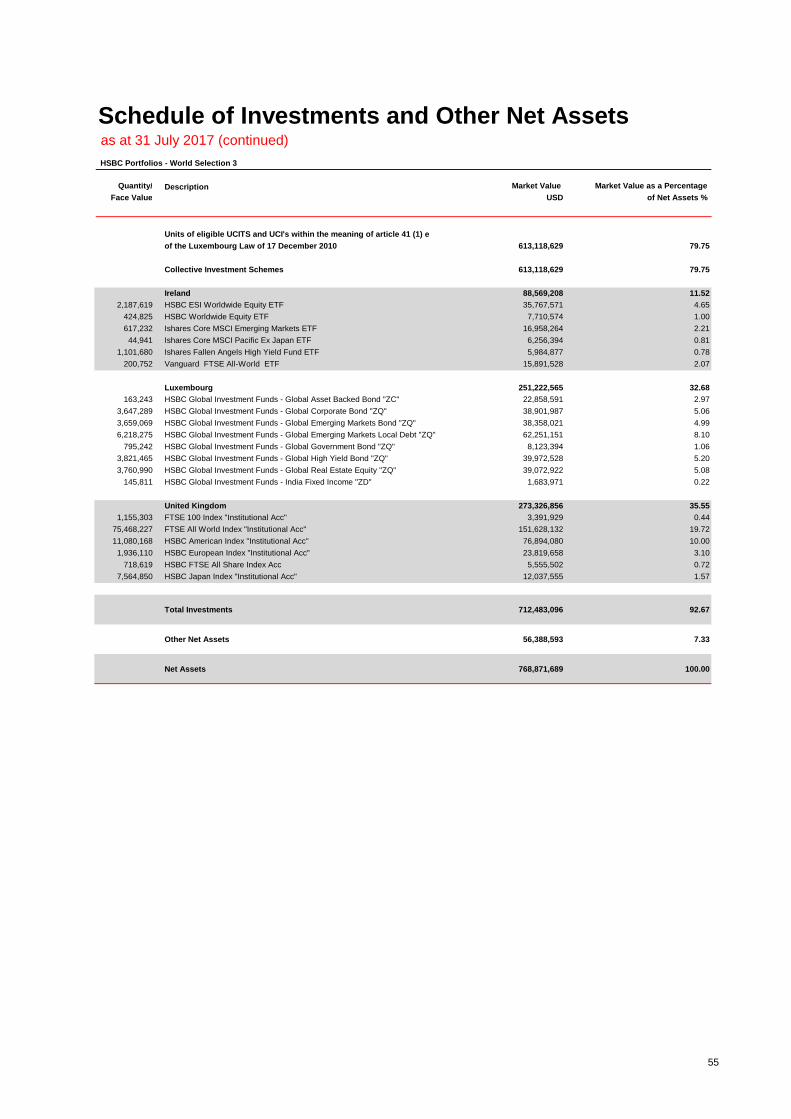
Schedule of Investments and Other Net Assetsas at 31 July 2017 (continued)
HSBC Portfolios - World Selection 3
Quantity/ Description Market Value Market Value as a Percentage
Face Value USD of Net Assets %
Units of eligible UCITS and UCI's within the meaning of article 41 (1) e
of the Luxembourg Law of 17 December 2010 613,118,629 79.75
Collective Investment Schemes 613,118,629 79.75
Ireland 88,569,208 11.52
2,187,619 HSBC ESI Worldwide Equity ETF 35,767,571 4.65
424,825 HSBC Worldwide Equity ETF 7,710,574 1.00
617,232 Ishares Core MSCI Emerging Markets ETF 16,958,264 2.21
44,941 Ishares Core MSCI Pacific Ex Japan ETF 6,256,394 0.81
1,101,680 Ishares Fallen Angels High Yield Fund ETF 5,984,877 0.78
200,752 Vanguard FTSE All-World ETF 15,891,528 2.07
Luxembourg 251,222,565 32.68
163,243 HSBC Global Investment Funds - Global Asset Backed Bond "ZC" 22,858,591 2.97
3,647,289 HSBC Global Investment Funds - Global Corporate Bond "ZQ" 38,901,987 5.06
3,659,069 HSBC Global Investment Funds - Global Emerging Markets Bond "ZQ" 38,358,021 4.99
6,218,275 HSBC Global Investment Funds - Global Emerging Markets Local Debt "ZQ" 62,251,151 8.10
795,242 HSBC Global Investment Funds - Global Government Bond "ZQ" 8,123,394 1.06
3,821,465 HSBC Global Investment Funds - Global High Yield Bond "ZQ" 39,972,528 5.20
3,760,990 HSBC Global Investment Funds - Global Real Estate Equity "ZQ" 39,072,922 5.08
145,811 HSBC Global Investment Funds - India Fixed Income "ZD" 1,683,971 0.22
United Kingdom 273,326,856 35.55
1,155,303 FTSE 100 Index "Institutional Acc" 3,391,929 0.44
75,468,227 FTSE All World Index "Institutional Acc" 151,628,132 19.72
11,080,168 HSBC American Index "Institutional Acc" 76,894,080 10.00
1,936,110 HSBC European Index "Institutional Acc" 23,819,658 3.10
718,619 HSBC FTSE All Share Index Acc 5,555,502 0.72
7,564,850 HSBC Japan Index "Institutional Acc" 12,037,555 1.57
Total Investments 712,483,096 92.67
Other Net Assets 56,388,593 7.33
Net Assets 768,871,689 100.00
55
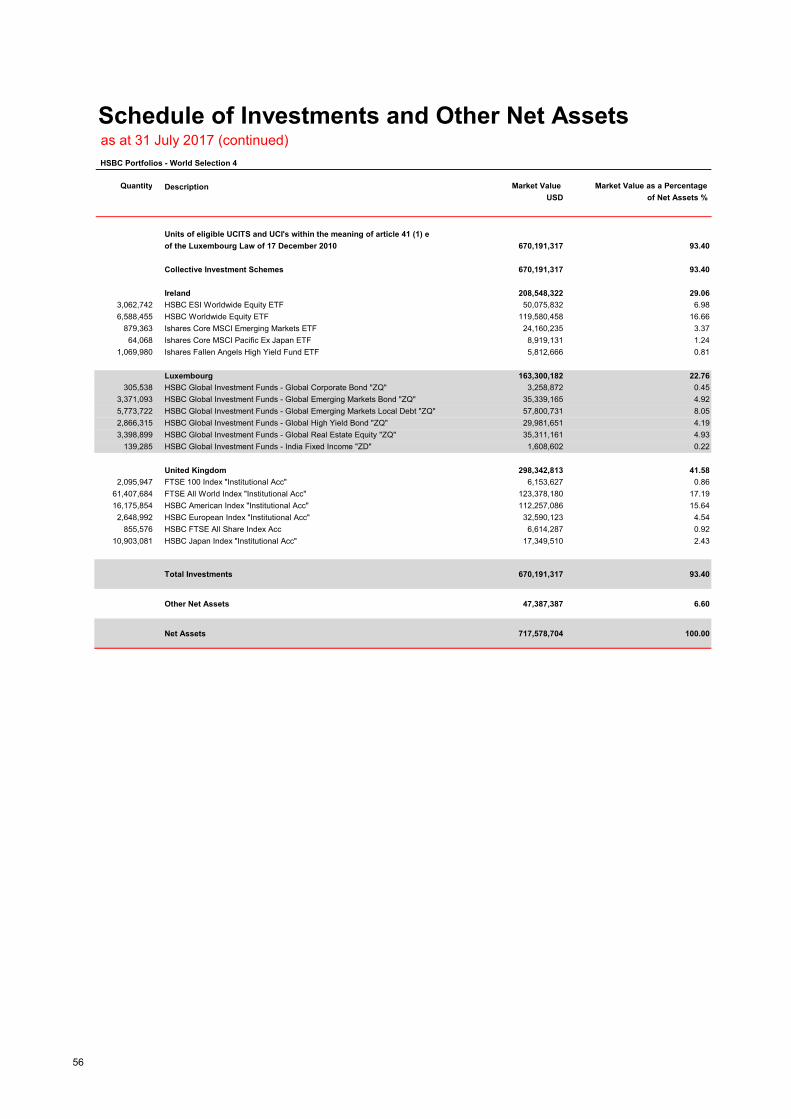
Schedule of Investments and Other Net Assetsas at 31 July 2017 (continued)
HSBC Portfolios - World Selection 4
Quantity Description Market Value Market Value as a Percentage
USD of Net Assets %
Units of eligible UCITS and UCI's within the meaning of article 41 (1) e
of the Luxembourg Law of 17 December 2010 670,191,317 93.40
Collective Investment Schemes 670,191,317 93.40
Ireland 208,548,322 29.06
3,062,742 HSBC ESI Worldwide Equity ETF 50,075,832 6.98
6,588,455 HSBC Worldwide Equity ETF 119,580,458 16.66
879,363 Ishares Core MSCI Emerging Markets ETF 24,160,235 3.37
64,068 Ishares Core MSCI Pacific Ex Japan ETF 8,919,131 1.24
1,069,980 Ishares Fallen Angels High Yield Fund ETF 5,812,666 0.81
Luxembourg 163,300,182 22.76
305,538 HSBC Global Investment Funds - Global Corporate Bond "ZQ" 3,258,872 0.45
3,371,093 HSBC Global Investment Funds - Global Emerging Markets Bond "ZQ" 35,339,165 4.92
5,773,722 HSBC Global Investment Funds - Global Emerging Markets Local Debt "ZQ" 57,800,731 8.05
2,866,315 HSBC Global Investment Funds - Global High Yield Bond "ZQ" 29,981,651 4.19
3,398,899 HSBC Global Investment Funds - Global Real Estate Equity "ZQ" 35,311,161 4.93
139,285 HSBC Global Investment Funds - India Fixed Income "ZD" 1,608,602 0.22
United Kingdom 298,342,813 41.58
2,095,947 FTSE 100 Index "Institutional Acc" 6,153,627 0.86
61,407,684 FTSE All World Index "Institutional Acc" 123,378,180 17.19
16,175,854 HSBC American Index "Institutional Acc" 112,257,086 15.64
2,648,992 HSBC European Index "Institutional Acc" 32,590,123 4.54
855,576 HSBC FTSE All Share Index Acc 6,614,287 0.92
10,903,081 HSBC Japan Index "Institutional Acc" 17,349,510 2.43
Total Investments 670,191,317 93.40
Other Net Assets 47,387,387 6.60
Net Assets 717,578,704 100.00
56

Schedule of Investments and Other Net Assetsas at 31 July 2017 (continued)
HSBC Portfolios - World Selection 5
Quantity Description Market Value Market Value as a Percentage
USD of Net Assets %
Units of eligible UCITS and UCI's within the meaning of article 41 (1) e
of the Luxembourg Law of 17 December 2010 257,257,742 94.03
Collective Investment Schemes 257,257,742 94.03
Ireland 104,295,824 38.12
1,383,977 HSBC ESI Worldwide Equity ETF 22,628,024 8.27
2,116,592 HSBC Worldwide Equity ETF 38,416,145 14.04
528,617 Ishares Core MSCI Emerging Markets ETF 14,523,594 5.31
39,607 Ishares Core MSCI Pacific Ex Japan ETF 5,513,829 2.02
92,599 Ishares Core S&P 500 ETF 21,843,178 7.98
252,380 Ishares Fallen Angels High Yield Fund ETF 1,371,054 0.50
Luxembourg 32,556,931 11.90
238,186 HSBC Global Investment Funds - Global Emerging Markets Bond "ZQ" 2,496,904 0.91
1,236,102 HSBC Global Investment Funds - Global Emerging Markets Local Debt "ZQ" 12,374,617 4.53
358,835 HSBC Global Investment Funds - Global High Yield Bond "ZQ" 3,753,413 1.37
1,341,034 HSBC Global Investment Funds - Global Real Estate Equity "ZQ" 13,931,997 5.09
United Kingdom 120,404,987 44.01
564,167 FTSE 100 Index "Institutional Acc" 1,656,375 0.61
16,945,917 FTSE All World Index "Institutional Acc" 34,047,147 12.44
6,805,731 HSBC American Index "Institutional Acc" 47,230,365 17.26
1,621,161 HSBC European Index "Institutional Acc" 19,944,885 7.29
813,378 HSBC FTSE All Share Index Acc 6,288,066 2.30
7,062,474 HSBC Japan Index "Institutional Acc" 11,238,149 4.11
Total Investments 257,257,742 94.03
Other Net Assets 16,332,792 5.97
Net Assets 273,590,534 100.00
57
58
Appendix I (Unaudited Additional Disclosures)– Taxation of the Company (foreign countries)
The following summary is based on the Company’s understanding of the law and practice currently in force in the in other jurisdictions and is
subject to changes therein.
United Kingdom
On the basis that the Company is not resident in the United Kingdom for tax purposes it should not be subject to United Kingdom corporation tax
on its income and capital gains.
In many markets the Company, as a foreign investment fund, may be subject to non-recoverable tax on income and gains (either by withholding
or direct assessment) in relation to the investment returns it realizes from its holdings of shares and securities in those markets. Where practicable
the Company will make claims under the relevant double tax treaties and domestic law of the countries concerned in order to minimize the impact
of local taxation on the investment return and to obtain the best return for its shareholders. Those claims will be made on the basis of the
Company’s understanding of the validity of such claims given the information available from the Company’s custodians, external advisers and
other sources as` to the interpretation and application of the relevant legal provisions by the tax authorities in the country concerned.
The Company will seek to provide for tax on capital gains where it considers that it is more likely than not that the tax will be payable, given the
advice and information available to the Company at the date concerned. However, any provision held may be insufficient to cover, or be in excess
of, any final liability.
The Company will seek to claim concessionary tax treatment and account for tax on a best efforts basis, given the tax law and practice at that
date. Any change in tax law or practice in any country where the Company is registered, marketed or invested could affect the value of the
Company’s investments in the affected country.
In particular, where retrospective changes to tax law or practice are applied by the legislature or tax authorities in a particular country these may
result in a loss for current Shareholders in the affected sub fund. The Company does not offer any warranty as to the tax position of returns from
investments held in a particular market nor of the risk of a retrospective assessment to tax in a particular market or country.
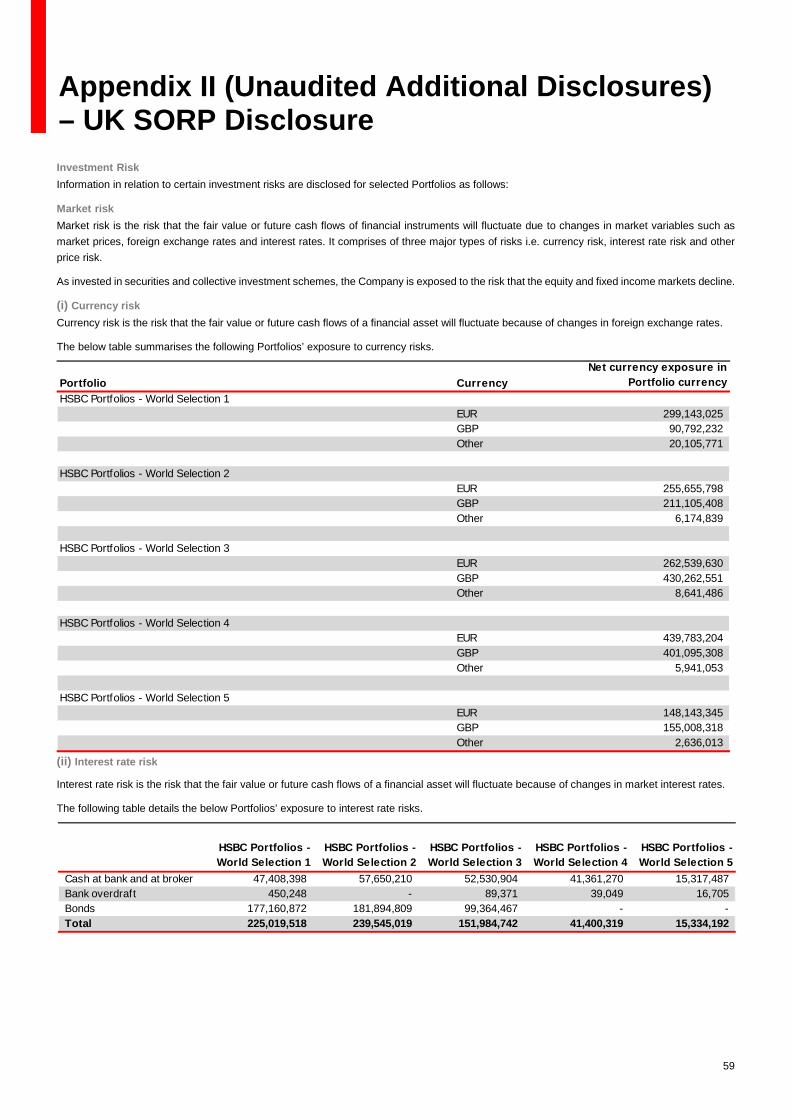
59
Appendix II (Unaudited Additional Disclosures)– UK SORP Disclosure
Investment Risk
Information in relation to certain investment risks are disclosed for selected Portfolios as follows:
Market risk
Market risk is the risk that the fair value or future cash flows of financial instruments will fluctuate due to changes in market variables such as
market prices, foreign exchange rates and interest rates. It comprises of three major types of risks i.e. currency risk, interest rate risk and other
price risk.
As invested in securities and collective investment schemes, the Company is exposed to the risk that the equity and fixed income markets decline.
(i) Currency risk
Currency risk is the risk that the fair value or future cash flows of a financial asset will fluctuate because of changes in foreign exchange rates.
The below table summarises the following Portfolios’ exposure to currency risks.
(ii) Interest rate risk
Interest rate risk is the risk that the fair value or future cash flows of a financial asset will fluctuate because of changes in market interest rates.
The following table details the below Portfolios’ exposure to interest rate risks.
Portfolio Currency
Net currency exposure in
Portfolio currency
HSBC Portfolios - World Selection 1
EUR 299,143,025
GBP 90,792,232
Other 20,105,771
HSBC Portfolios - World Selection 2
EUR 255,655,798
GBP 211,105,408
Other 6,174,839
HSBC Portfolios - World Selection 3
EUR 262,539,630
GBP 430,262,551
Other 8,641,486
HSBC Portfolios - World Selection 4
EUR 439,783,204
GBP 401,095,308
Other 5,941,053
HSBC Portfolios - World Selection 5
EUR 148,143,345
GBP 155,008,318
Other 2,636,013
HSBC Portfolios -
World Selection 1
HSBC Portfolios -
World Selection 2
HSBC Portfolios -
World Selection 3
HSBC Portfolios -
World Selection 4
HSBC Portfolios -
World Selection 5
Cash at bank and at broker 47,408,398 57,650,210 52,530,904 41,361,270 15,317,487
Bank overdraft 450,248 - 89,371 39,049 16,705
Bonds 177,160,872 181,894,809 99,364,467 - -
Total 225,019,518 239,545,019 151,984,742 41,400,319 15,334,192
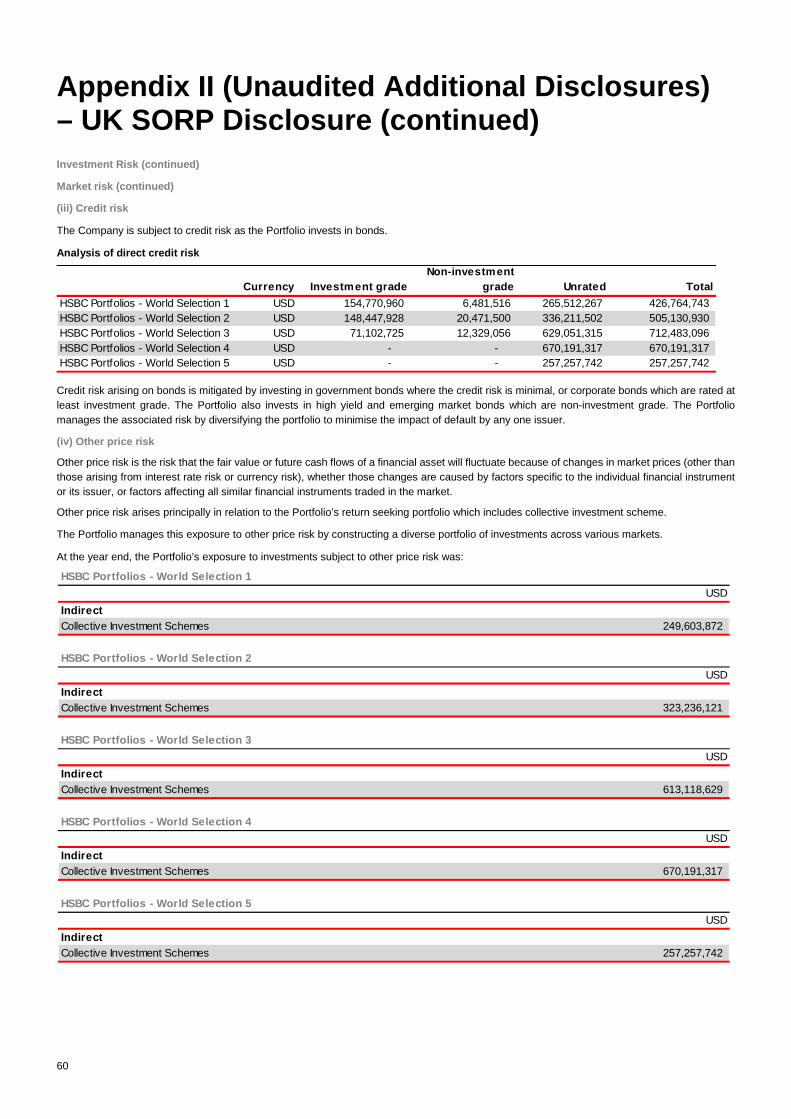
60
Appendix II (Unaudited Additional Disclosures)– UK SORP Disclosure (continued)
Investment Risk (continued)
Market risk (continued)
(iii) Credit risk
The Company is subject to credit risk as the Portfolio invests in bonds.
Analysis of direct credit risk
Credit risk arising on bonds is mitigated by investing in government bonds where the credit risk is minimal, or corporate bonds which are rated at
least investment grade. The Portfolio also invests in high yield and emerging market bonds which are non-investment grade. The Portfolio
manages the associated risk by diversifying the portfolio to minimise the impact of default by any one issuer.
(iv) Other price risk
Other price risk is the risk that the fair value or future cash flows of a financial asset will fluctuate because of changes in market prices (other than
those arising from interest rate risk or currency risk), whether those changes are caused by factors specific to the individual financial instrument
or its issuer, or factors affecting all similar financial instruments traded in the market.
Other price risk arises principally in relation to the Portfolio’s return seeking portfolio which includes collective investment scheme.
The Portfolio manages this exposure to other price risk by constructing a diverse portfolio of investments across various markets.
At the year end, the Portfolio’s exposure to investments subject to other price risk was:
Currency Investment grade
Non-investment
grade Unrated Total
HSBC Portfolios - World Selection 1 USD 154,770,960 6,481,516 265,512,267 426,764,743
HSBC Portfolios - World Selection 2 USD 148,447,928 20,471,500 336,211,502 505,130,930
HSBC Portfolios - World Selection 3 USD 71,102,725 12,329,056 629,051,315 712,483,096
HSBC Portfolios - World Selection 4 USD - - 670,191,317 670,191,317
HSBC Portfolios - World Selection 5 USD - - 257,257,742 257,257,742
HSBC Portfolios - World Selection 1
USD
Indirect
Collective Investment Schemes 249,603,872
HSBC Portfolios - World Selection 2
USD
Indirect
Collective Investment Schemes 323,236,121
HSBC Portfolios - World Selection 3
USD
Indirect
Collective Investment Schemes 613,118,629
HSBC Portfolios - World Selection 4
USD
Indirect
Collective Investment Schemes 670,191,317
HSBC Portfolios - World Selection 5
USD
Indirect
Collective Investment Schemes 257,257,742
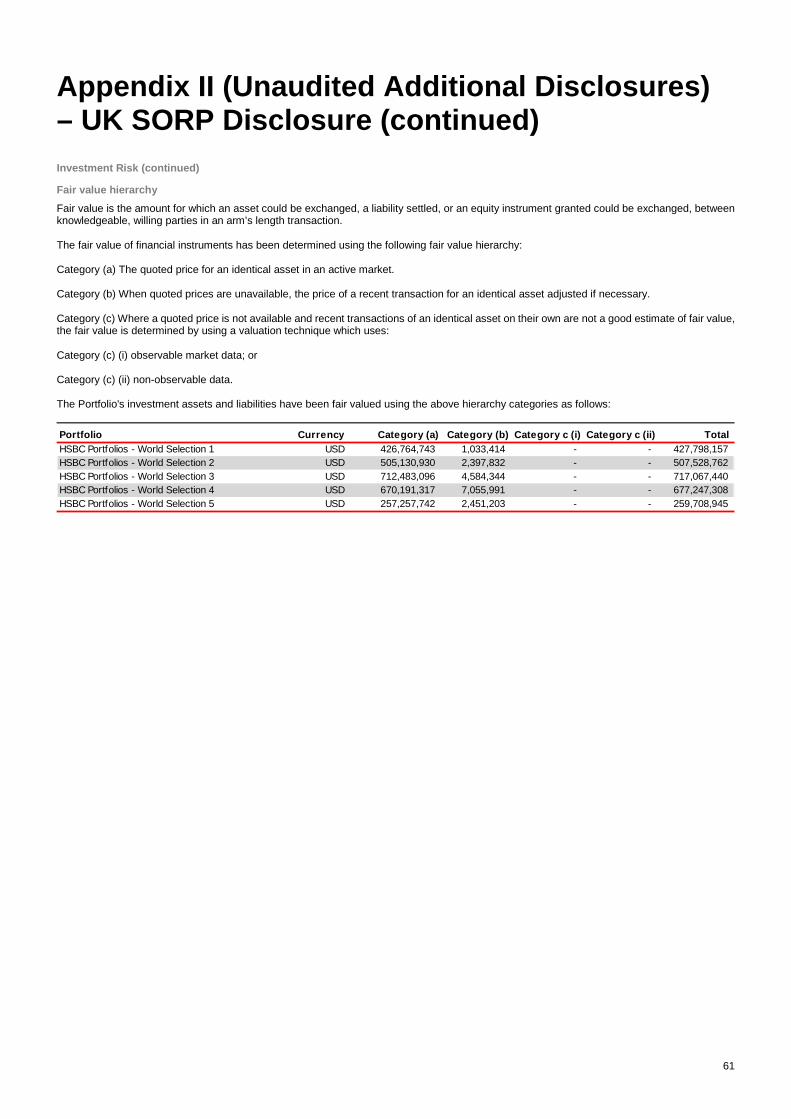
61
Appendix II (Unaudited Additional Disclosures)– UK SORP Disclosure (continued)
Investment Risk (continued)
Fair value hierarchy
Fair value is the amount for which an asset could be exchanged, a liability settled, or an equity instrument granted could be exchanged, betweenknowledgeable, willing parties in an arm’s length transaction.
The fair value of financial instruments has been determined using the following fair value hierarchy:
Category (a) The quoted price for an identical asset in an active market.
Category (b) When quoted prices are unavailable, the price of a recent transaction for an identical asset adjusted if necessary.
Category (c) Where a quoted price is not available and recent transactions of an identical asset on their own are not a good estimate of fair value,the fair value is determined by using a valuation technique which uses:
Category (c) (i) observable market data; or
Category (c) (ii) non-observable data.
The Portfolio's investment assets and liabilities have been fair valued using the above hierarchy categories as follows:
Portfolio Currency Category (a) Category (b) Category c (i) Category c (ii) Total
HSBC Portfolios - World Selection 1 USD 426,764,743 1,033,414 - - 427,798,157
HSBC Portfolios - World Selection 2 USD 505,130,930 2,397,832 - - 507,528,762
HSBC Portfolios - World Selection 3 USD 712,483,096 4,584,344 - - 717,067,440
HSBC Portfolios - World Selection 4 USD 670,191,317 7,055,991 - - 677,247,308
HSBC Portfolios - World Selection 5 USD 257,257,742 2,451,203 - - 259,708,945

62
Appendix III (Unaudited Additional Disclosures)– Fund Holiday Calendar for 2017
All Portfolios have holidays on:
all Saturdays and Sundays
and on the following dates :
2-Jan14-Apr17-Apr1-May25-May29-May5-Jun23-Jun15-Aug28-Aug1-Nov22-Dec25-Dec26-Dec29-Dec
UKLuxembourg, UKLuxembourg, UKLuxembourg, UKLuxembourgUKLuxembourgLuxembourgLuxembourgUKLuxembourgUKLuxembourg, UKLuxembourg, UKUK
Shareholders who deal through the Company’s local distributor or representative should note that there will be no dealing for the shares ofthe Company in the jurisdiction in which such distributor or representative operates on a day which is not a business day in such jurisdiction.
The Company will determine the fund holiday calendar according to the latest market information obtained by the Company from time to time.
Shareholders can obtain the latest fund holiday calendar of the Company from the registered office of the Company or from the Company’s
local distributor or representative.

63
Appendix IV (Unaudited Additional Disclosures)– Publication of TER (Total Expense Ratio)
The Total Expense Ratio (“TER”) has been computed by the Administrator as required per the Swiss Funds & Asset Management Association
guidelines on the calculation and disclosure of the TER of collective investment schemes. The actual expenses incurred during the year are
annualised and calculated as a percentage of the average Asset Under Management of the share class for the year. The TER also includes the
percentage corresponding to passive hedging fees.
Synthetic TER, which includes the TER percentage of the underlying fund of funds held in the Portfolio, is also computed by the Administrator.
Total Expense Ratio (%) for the active Portfolios and share classes for the year ended 31 July 2017:
HSBC Portfolios HSBC Portfolios HSBC Portfolios HSBC Portfolios HSBC Portfolios
World Selection 1 World Selection 2 World Selection 3 World Selection 4 World Selection 5
Class A (C) USD 1.30 1.30 1.44 1.43 1.50
Class A (C) (HAUD) - - 1.60 1.55 1.67
Class A (C) (HEUR) 1.36 1.41 1.50 1.44 1.56
Class A (C) (HGBP) 1.36 1.41 1.50 1.44 1.56
Class A (C) (HSGD) 1.38 - 1.59 - 1.56
Class A (D) (USD) - 1.25 - - -
Class A (D) (HEUR) - 1.41 1.60 1.59 1.63
Class A (D) (HGBP) - 1.31 - - -
Class A (M) (USD) 1.35 1.36 1.54 1.53 1.63
Class A (M) (HKD) 1.34 1.37 1.54 1.53 1.59
Class A (M) (HAUD) 1.40 1.42 1.61 1.59 1.66
Class A (M) (HEUR) 1.41 1.41 1.57 1.59 1.68
Class A (M) (HGBP) 1.40 1.42 1.60 1.60 1.67
Class A (M) (HSGD) 1.41 - 1.64 - 1.60
Class B (C) (USD) 0.84 0.84 0.83 0.82 0.90
Class B (C) (HEUR) 0.90 0.90 0.99 0.93 0.90
Class B (C) (HGBP) 0.85 0.90 0.89 0.88 0.90
Class X (C) (HGBP) - 0.90 - - -
Class X (D) (HGBP) - 0.90 - - -
Class Z (C) (HGBP) - 0.40 - - -
Class Z (D) (HGBP) - 0.40 - - -

HSBC Global Asset Management, the sponsor of HSBC Portfolios, is the asset management specialist of the HSBC Group and operates through HSBC Bank plc and itssubsidiaries.
HSBC Global Asset Management is the trading name of HSBC Global Asset Management Limited. HSBC Global Asset Management is established at 8 Canada Square,London E14 5HQ, United Kingdom, which is its registered office.
© Copyright. HSBC Global Asset Management Limited 2017. All Rights Reserved 14846/0608


