33
Human Population Growth
| Date post: | 25-Dec-2015 |
| Category: |
Documents |
| Upload: | gerard-miles |
| View: | 220 times |
| Download: | 0 times |

Human Population Growth
Factors Affecting Human Population Size
• Births• Deaths• Migrations
– Immigration: individuals moving into a pop.– Emigration: individuals moving out of a pop.
• Population Change= (births+immigration)-(deaths+emigration)
**When births and immigration is greater than deaths and emigration, the population will increase
http://www.youtube.com/watch?v=4BbkQiQyaYchttp://www.youtube.com/watch?
v=sc4HxPxNrZ0&feature=related
World Population
• Rate of annual pop change is expressed as a percentage: birth rate-death rate
10• The U.S. had a birth rate of 14.6 live births per 1,000
population in one year, compared to India’s birth rate of 22.2 in that same year. The death rate in that year for the U.S. was 8.3 deaths per 1,000, compared to India’s rate of 6.4. Calculate the population growth rates (%) for both countries.– U.S. 14.6-8.3= 0.6%
10 – India 22.2-6.4 = 1.6%
10
World Population
• Exponential growth has not disappeared, but its occurring at a slower rate
• Between 1963 and 2002, the population rose from 3.2 to 6.2 billion
• 79 million people were added in 2002, compared to 69 million in 1963 when the world’s pop growth rate was at its highest
Human Population Growth over Time
Before agricultural revolution: 1-3 million humans, hunter/gatherers, Earth Wisdom-natural cycles serve as models for human behavior
8000 BCE-5000BCE: ~50 million humans, increases due to agricultural revolution
5000 BCE-1 BCE: ~200 million humans, Frontier Worldview-undeveloped land as a hostile wilderness to be conquered, exploited resources
0 BCE-1300 CE: ~500 million humans
1300-1650 CE: ~600 million humans, plagues reduced population growth rate
Human Population Growth over Time
• 1650-present: ~7 billion humans, reductions in death rates, increase medical technology, Planetary Management-as we are the planet’s most important species, we are in charge of earth, we will develop new resources so should not worry about using them sustainably
• Present-2050: ~9 billion (?), Earth Wisdom-resources are limited so should be conserved, we should encourage sustainable use of resources because the earth exists for all nature
Fertility Rates
• Replacement Level Fertility- # of children that a couple needs to have in order to replace themselves (2.1 in developed countries/2.5 in developing countries)
• Total Fertility Rate (TFR)-an estimate of the # of children a woman will have during childbearing years (based on the previous year)
United States Historical Trend in Total Fertility Rate
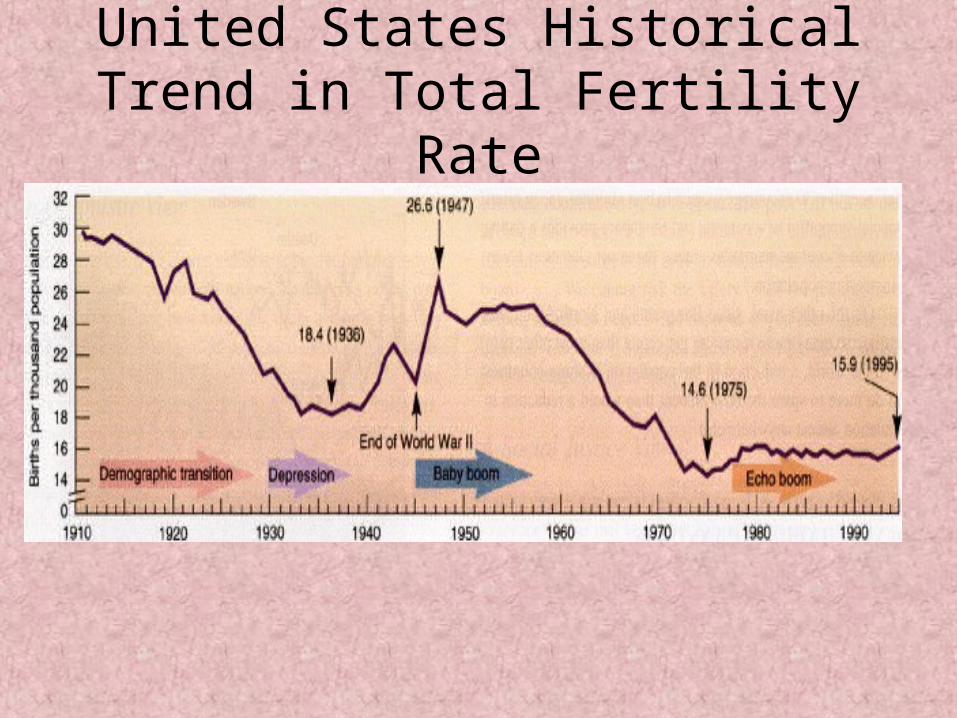
• 1910-1930: birth rates dropped due to urbanization
• 1930’s: stayed low because of the Great Depression
• 1940’s: rising again• 1957: TFR=3.7 children/woman, highest• 1946-1964: Baby Boom• 1965-1977: Baby Bust • 1977-2000: Echo Boom
United States Historical Trend in Total Fertility Rate
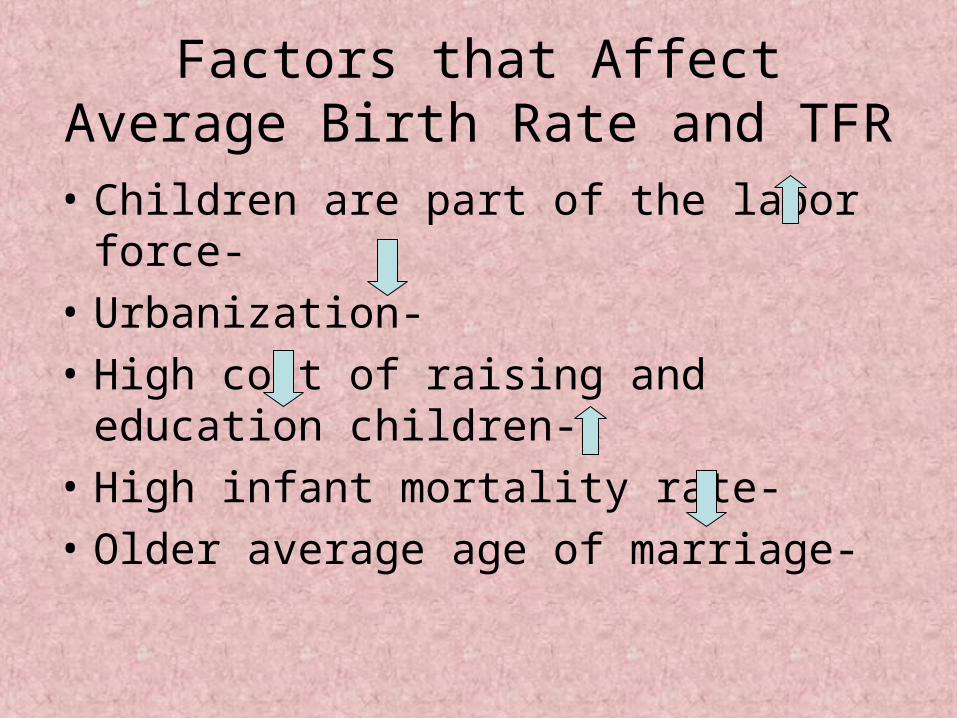
Factors that Affect Average Birth Rate and TFR
• Children are part of the labor force-
• Urbanization-
• High cost of raising and education children-
• High infant mortality rate-
• Older average age of marriage-
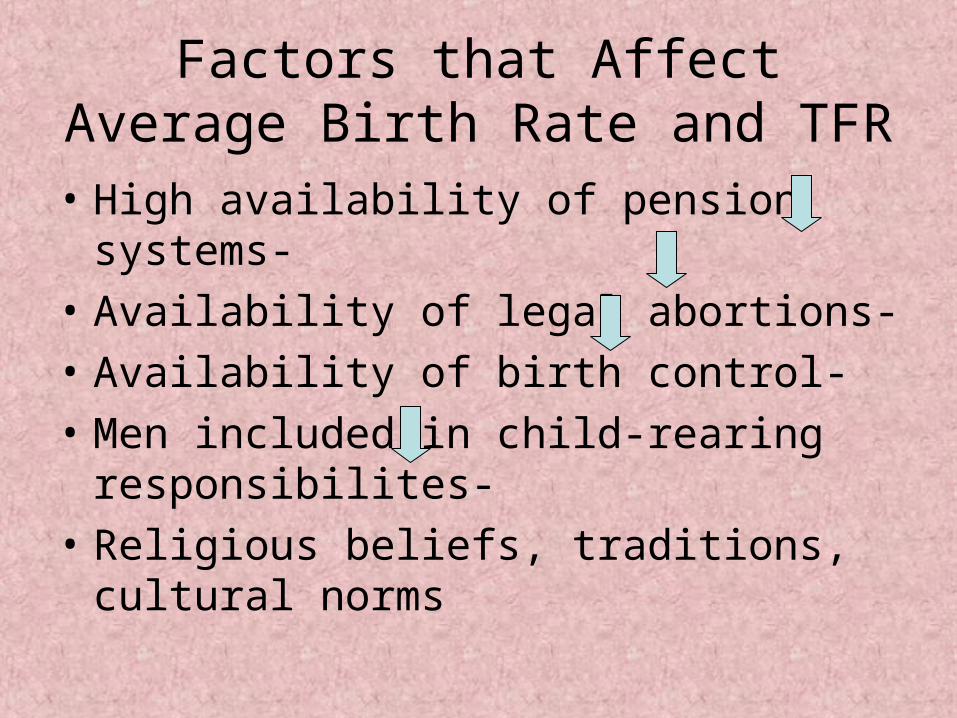
Factors that Affect Average Birth Rate and TFR
• High availability of pension systems-
• Availability of legal abortions-
• Availability of birth control-
• Men included in child-rearing responsibilites-
• Religious beliefs, traditions, cultural norms
Factors That Decrease Death Rates
• Increased food supply and distribution
• Better nutrition
• Medical improvements
• Increased sanitation
• Better water supply**
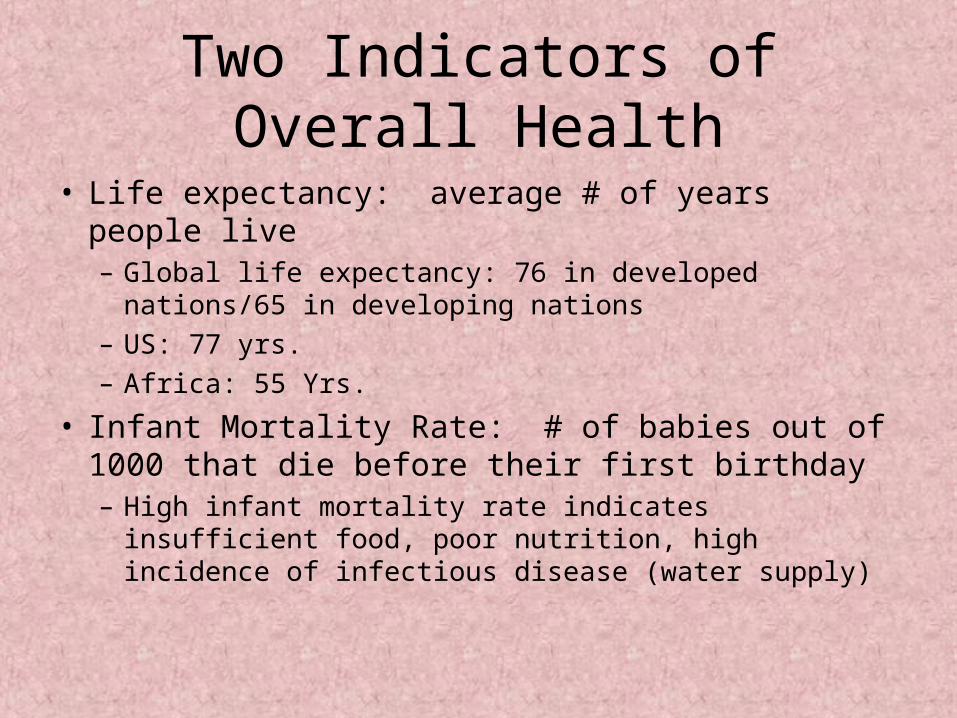
Two Indicators of Overall Health
• Life expectancy: average # of years people live– Global life expectancy: 76 in developed nations/65 in
developing nations– US: 77 yrs.– Africa: 55 Yrs.
• Infant Mortality Rate: # of babies out of 1000 that die before their first birthday– High infant mortality rate indicates insufficient food,
poor nutrition, high incidence of infectious disease (water supply)
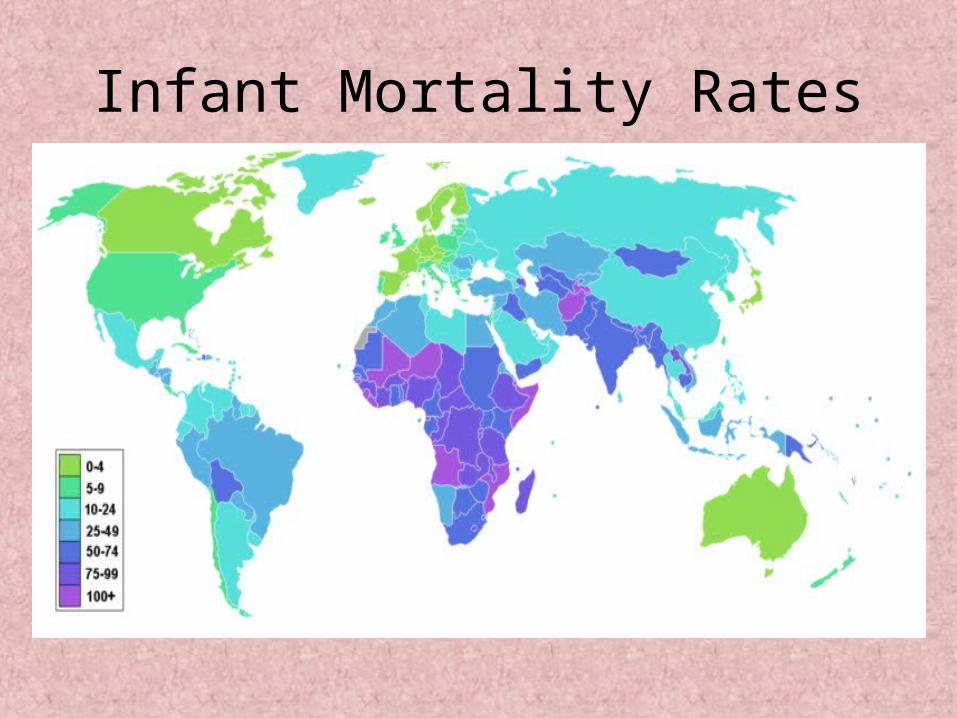
Infant Mortality Rates
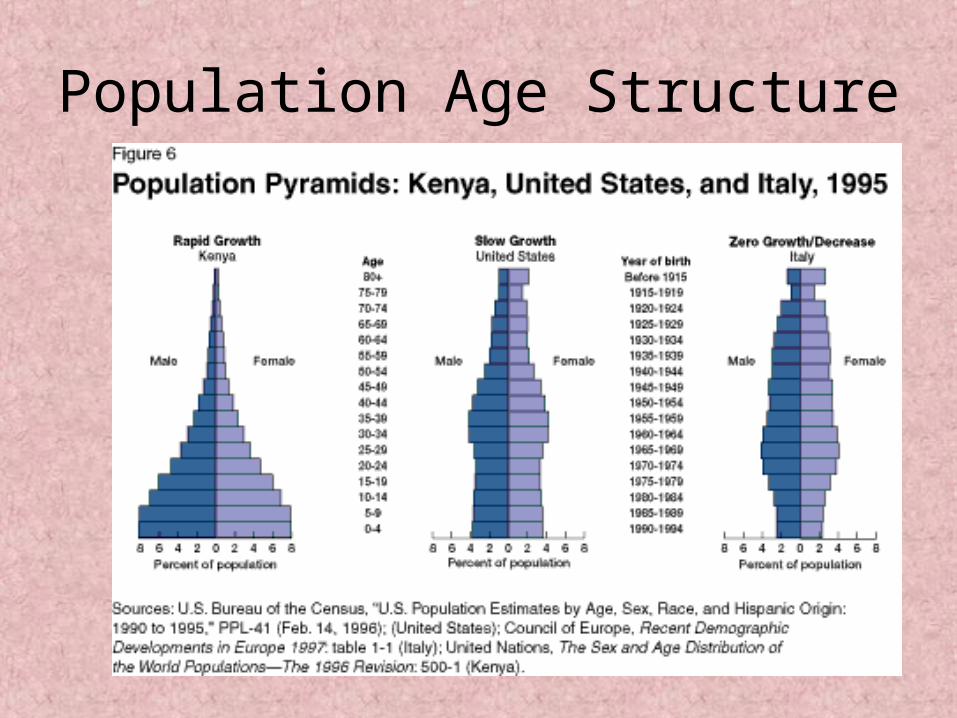
Population Age Structure
• The proportion of the pop of each sex at each age level; used to make pop and economic projections
• Age levels:– Prereproductive (0-14)– Reproductive (15-44)– Post reproductive (45 and up)
• Age structure affects population growth– Countries with a wide base (lots of people below 15)
will increase in size if death rate stays the same
Population Age Structure
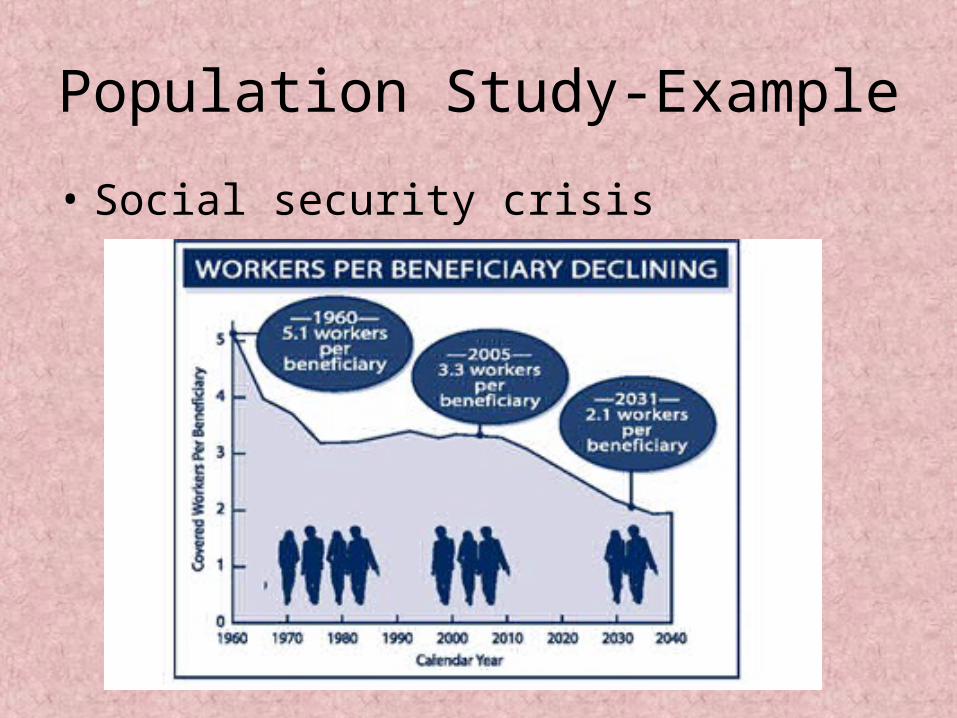
Population Study-Example
• Social security crisis
Populations Affected by Immigration
• U.S.
• Canada
• Australia
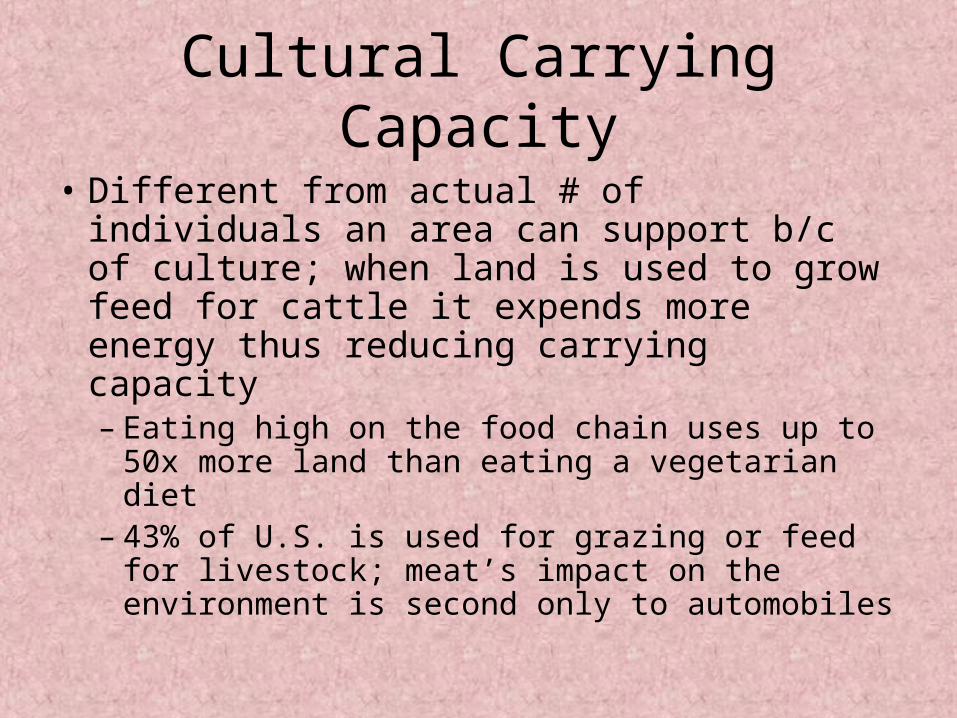
Cultural Carrying Capacity
• Different from actual # of individuals an area can support b/c of culture; when land is used to grow feed for cattle it expends more energy thus reducing carrying capacity– Eating high on the food chain uses up to 50x
more land than eating a vegetarian diet– 43% of U.S. is used for grazing or feed for
livestock; meat’s impact on the environment is second only to automobiles
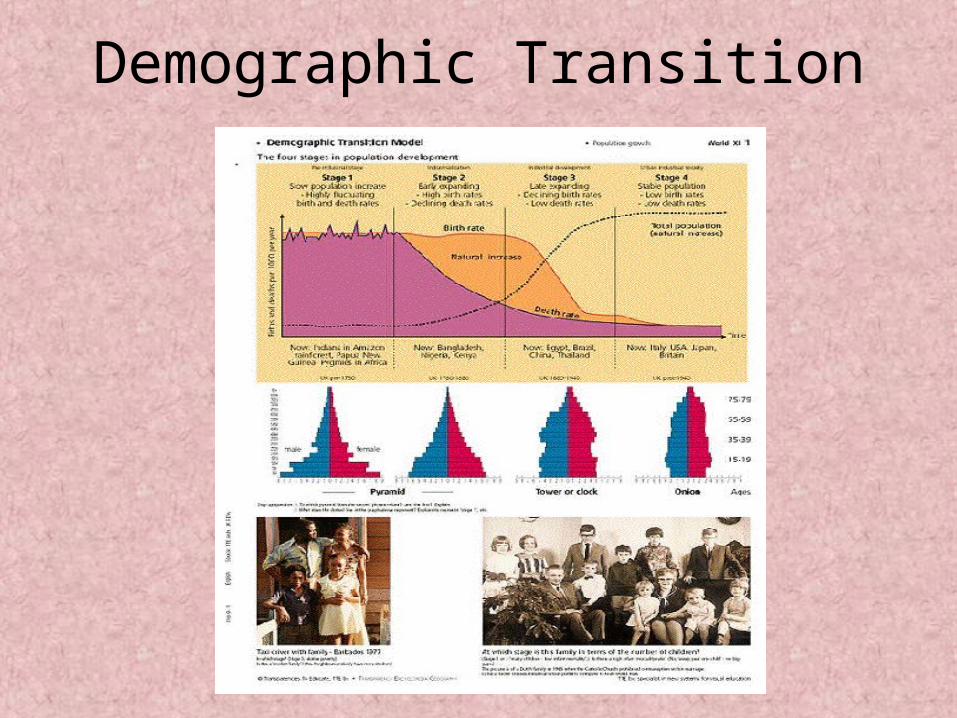
Demographic Transition
• Demography: study of human population
• As countries become industrialized first death rates, but then birth rates decline
• Four Stages– Preindustrial Stage– Tansitional Stage– Industrial Stage– Postindustrial Stage
Preindustrial Stage
• Little population growth because of harsh conditions
• High birth AND death rates
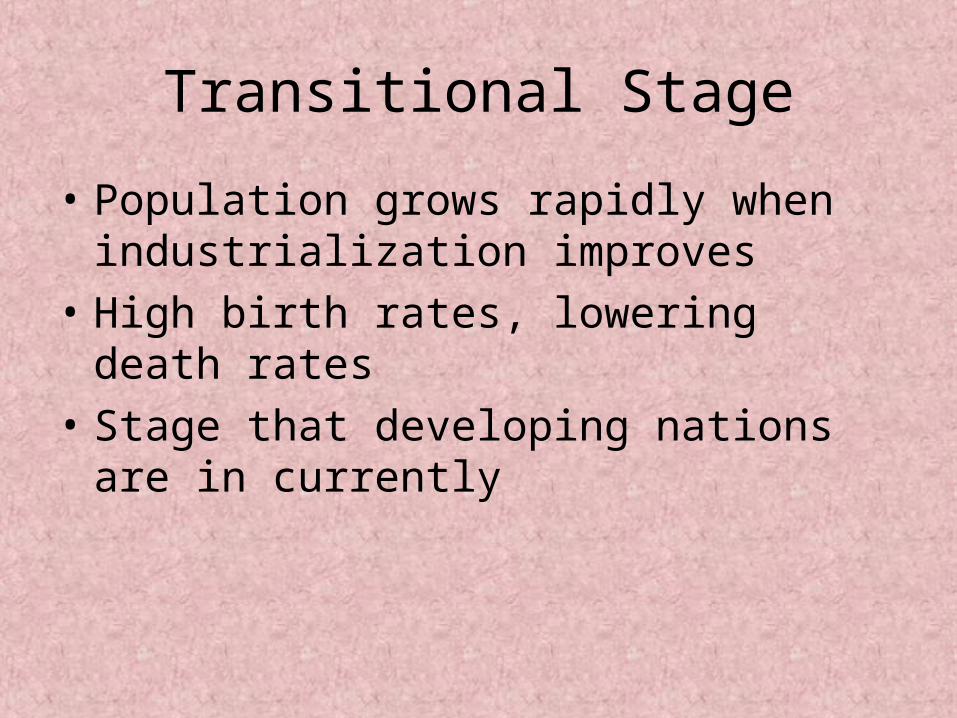
Transitional Stage
• Population grows rapidly when industrialization improves
• High birth rates, lowering death rates
• Stage that developing nations are in currently
Industrial Stage
• Population growth slows as birth rates drop and eventually approach death rates
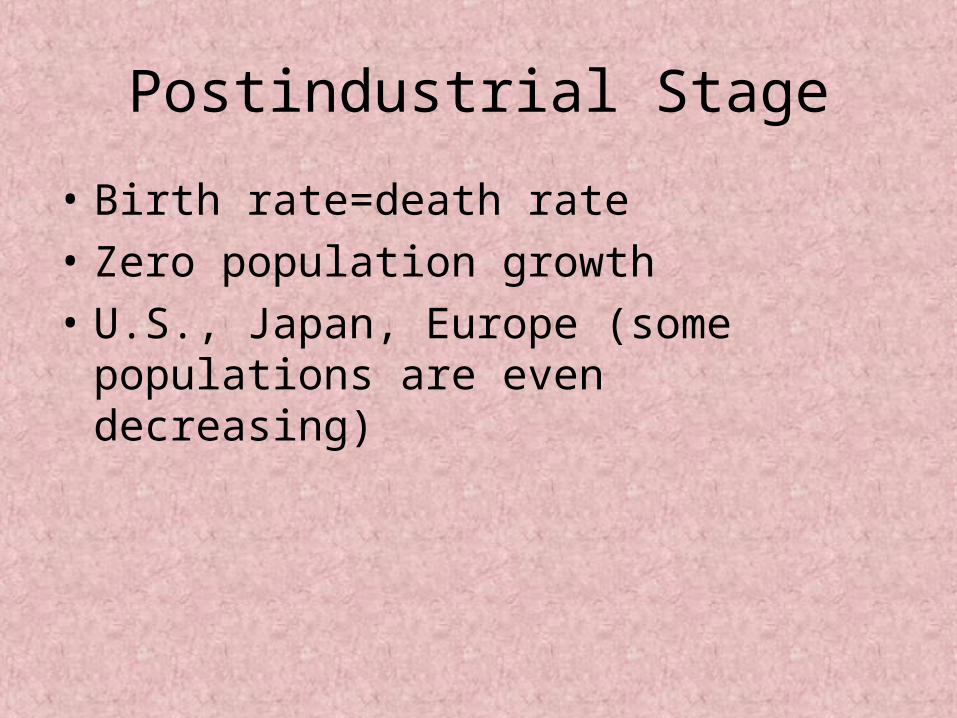
Postindustrial Stage
• Birth rate=death rate
• Zero population growth
• U.S., Japan, Europe (some populations are even decreasing)
Demographic Transition
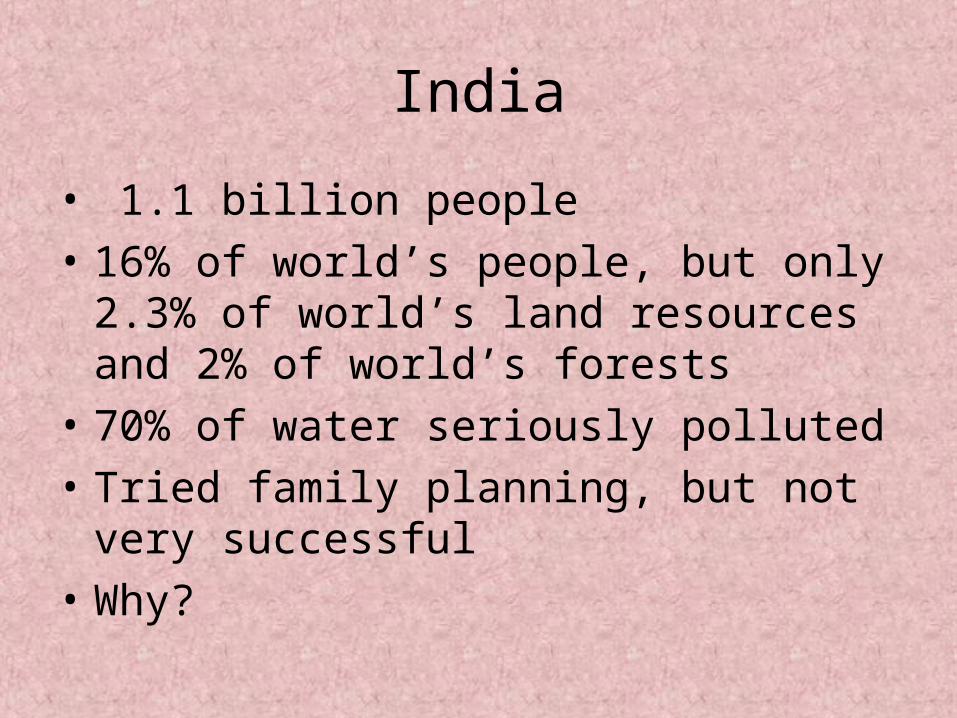
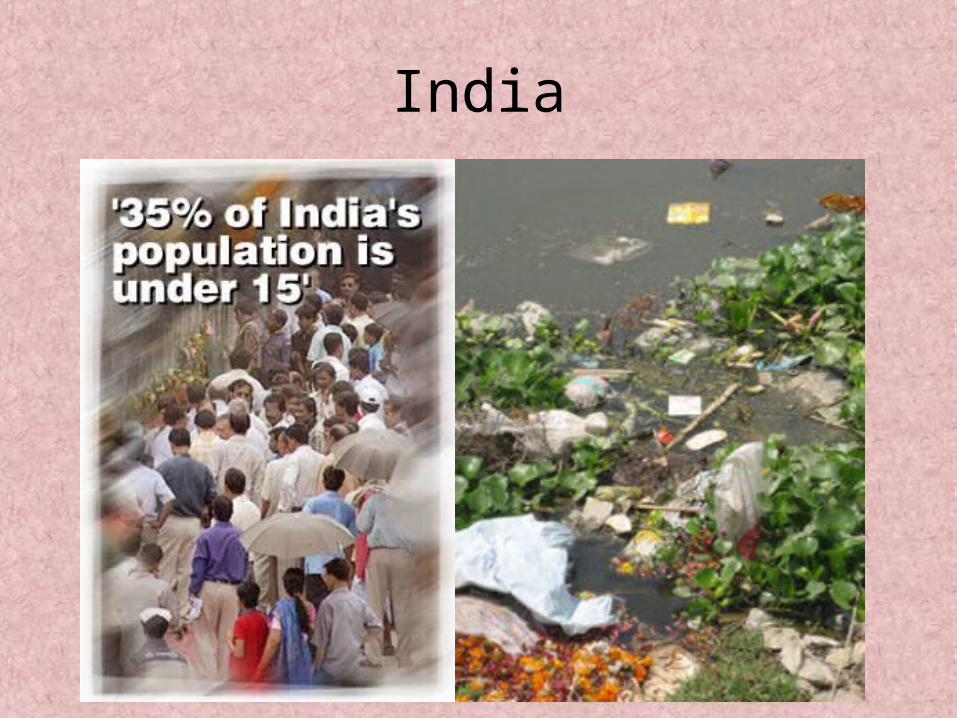
India
• 1.1 billion people
• 16% of world’s people, but only 2.3% of world’s land resources and 2% of world’s forests
• 70% of water seriously polluted
• Tried family planning, but not very successful
• Why?
India
China
• 1.3 billion people• Since 1970, cut its crude birth rate in half and
decreased TFR from 5.7 to 1.8 children/woman• How?
– Free sterilizations/contraception/abortions– Couples who have only one child receive: extra food,
larger pensions, better housing, free medical care, salary bonuses, free school tuition for their child, and preferential treatment in employment when their child enters the work force
China
• Projected that China’s pop will begin to decline in 2042, but what about their aging population/social security?
• Should other countries impose such severe restrictions/limitations on human freedoms to achieve pop control?
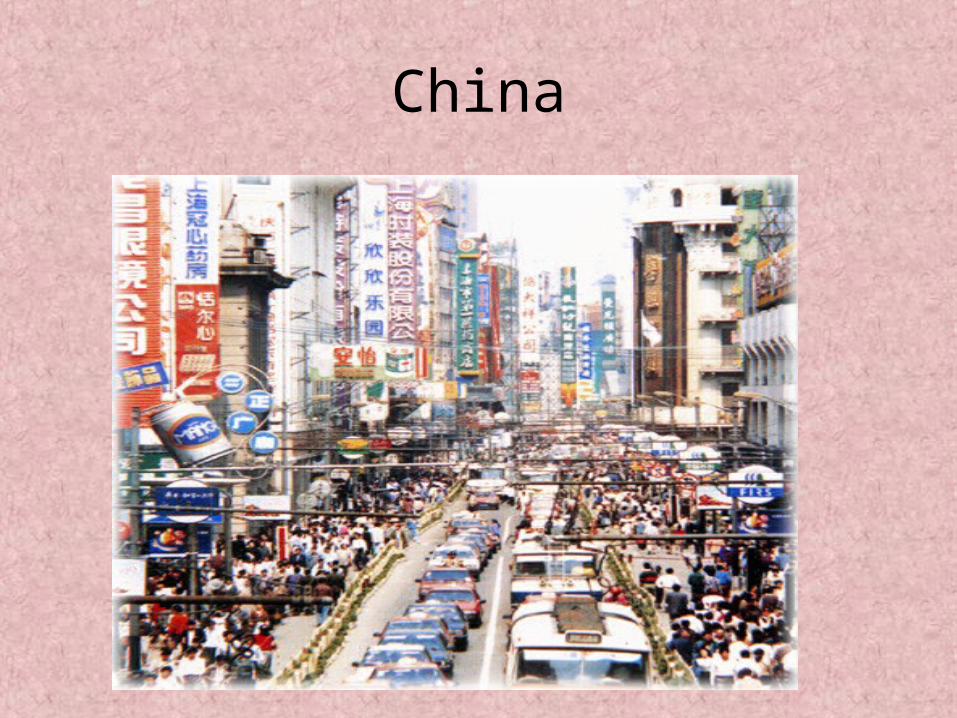
China
Cutting Global Population Growth
• Provide access to family planning services and reproductive health care
• Improve health care of infants, children, pregnant women
• Implement population policies• Improve job opportunities for women• Increase access to education, especially to
women• Increase involvement of men in child-rearing• Eradicate poverty• Reduce/eliminate unsustainable patterns of
production and consumption
Cutting Global Population Growth
• Goal of Cairo Commitment: stabilize pop growth at 7.8 billion by 2050 instead of projected 9-11 billion
• BTW we are already at 6.7 billion…..
• World Clock
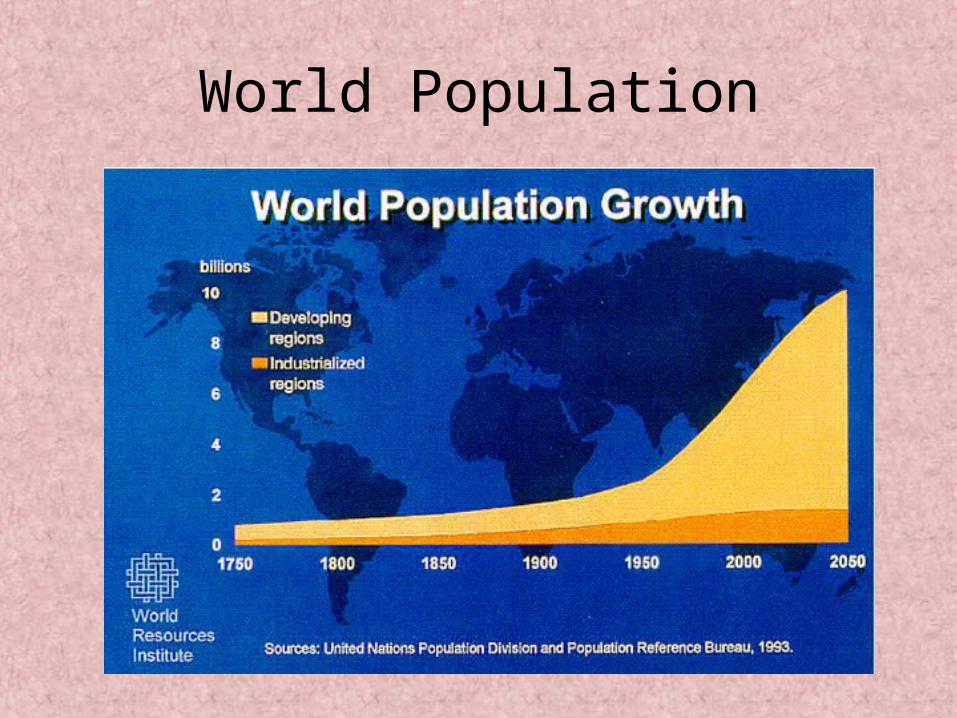
World Population


