Executive Summary EXECUTIVE SUMMARY I. Study Overview Businesses, residents, and visitors depend on Virginia’s airports. The Virginia Air Transportation System Plan (VATSP) Update blends the maintenance of existing airports, with the strategic development and enhancement of the facilities at current airports, along with the development of new system airports. The VATSP helps Virginia keep pace with new aviation technologies such as NextGen. The plan provides direction to meet transportation needs, to serve aviation demand, and to provide economic support through the planning period. Collaboration between the Virginia Department of Aviation (DOAV), the Federal Aviation Administration (FAA), and all sponsors and owners of public-use airports in Virginia is needed for the success of this plan. Following guidance in FAA’s Advisory Circular 150/5070-7, The Airport System Planning Process, this plan ties together the following: • Recommendations from DOAV’s other planning initiatives and programs • Locally generated, verified and screened airport development needs from surveys, master plans and airport capital improvement programs (ACIPs) • Projects needed to enable airports to better fulfill their role in the Virginia Airport System To complete this VATSP Update, the following tasks were undertaken: • Inventory – Information on activity and facilities was collected for the 66 study airports. • Activity Forecasts – Historical and anticipated trends for the commercial service and the general aviation industries were used to project system and airport specific demand. • Facility Objectives Analysis – Facility, service and equipment (FS&E) Objectives were developed for airports in each state airport system role to determine system wide needs within each airport role.. • Alternatives/System Performance Analysis – GIS was used to evaluate current system performance and to identify performance gaps. • Development Costs – Estimated costs to respond to airport specific FS&E objectives were combined with airport specific master plan and ACIP costs. • Sensitivity Analysis – Preliminary plan outcomes were reviewed to identify needed adjustments. • Recommendations - Future airport roles, facility needs, and a funding analysis provide the framework for implementing plan recommendations. II. Inventory The Virginia Airport System is comprised of nine airports with scheduled commercial airline service and 57 general aviation airports. Figure I illustrates the 2014 Virginia Air Transportation System. All of the nine commercial service airports and 39 of the general aviation airports in Virginia are included in FAA’s National Plan of Integrated Airport Systems (NPIAS). Inclusion in the NPIAS indicates that the airport is eligible to compete for federal funding from the FAA. The remaining 18 airports in the Virginia system rely exclusively on local or private funds, along with grants from DOAV, to support their development and maintenance needs. Virginia Air Transportation System Plan (VATSP) Update I
Transcript
Executive Summary
EXECUTIVE SUMMARY
I. Study Overview
Businesses, residents, and visitors depend on Virginia’s airports. The Virginia Air Transportation System Plan (VATSP) Update blends the maintenance of existing airports, with the strategic development and enhancement of the facilities at current airports, along with the development of new system airports. The VATSP helps Virginia keep pace with new aviation technologies such as NextGen. The plan provides direction to meet transportation needs, to serve aviation demand, and to provide economic support through the planning period. Collaboration between the Virginia Department of Aviation (DOAV), the Federal Aviation Administration (FAA), and all sponsors and owners of public-use airports in Virginia is needed for the success of this plan.
Following guidance in FAA’s Advisory Circular 150/5070-7, The Airport System Planning Process, this plan ties together the following:
• Recommendations from DOAV’s other planning initiatives and programs • Locally generated, verified and screened airport development needs from surveys, master plans and
airport capital improvement programs (ACIPs) • Projects needed to enable airports to better fulfill their role in the Virginia Airport System
To complete this VATSP Update, the following tasks were undertaken:
• Inventory – Information on activity and facilities was collected for the 66 study airports. • Activity Forecasts – Historical and anticipated trends for the commercial service and the general
aviation industries were used to project system and airport specific demand. • Facility Objectives Analysis – Facility, service and equipment (FS&E) Objectives were developed for
airports in each state airport system role to determine system wide needs within each airport role.. • Alternatives/System Performance Analysis – GIS was used to evaluate current system performance
and to identify performance gaps. • Development Costs – Estimated costs to respond to airport specific FS&E objectives were combined
with airport specific master plan and ACIP costs. • Sensitivity Analysis – Preliminary plan outcomes were reviewed to identify needed adjustments. • Recommendations - Future airport roles, facility needs, and a funding analysis provide the framework
for implementing plan recommendations.
II. Inventory
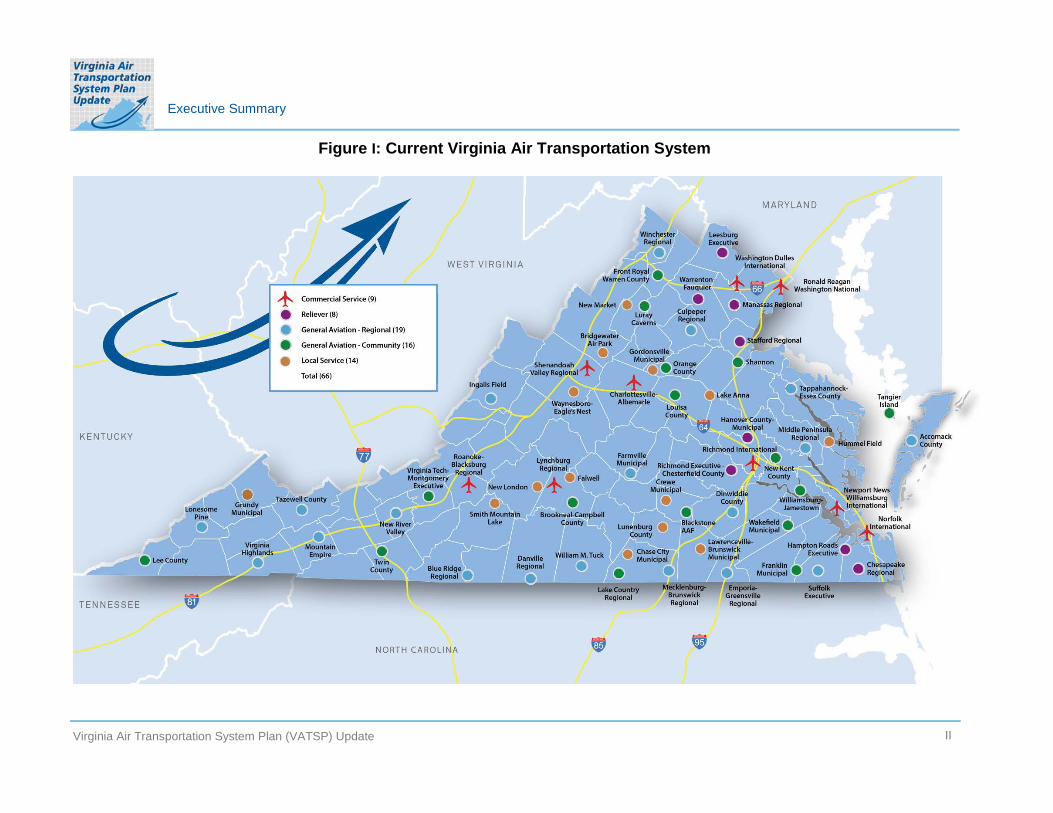
The Virginia Airport System is comprised of nine airports with scheduled commercial airline service and 57 general aviation airports. Figure I illustrates the 2014 Virginia Air Transportation System. All of the nine commercial service airports and 39 of the general aviation airports in Virginia are included in FAA’s National Plan of Integrated Airport Systems (NPIAS). Inclusion in the NPIAS indicates that the airport is eligible to compete for federal funding from the FAA. The remaining 18 airports in the Virginia system rely exclusively on local or private funds, along with grants from DOAV, to support their development and maintenance needs.
Virginia Air Transportation System Plan (VATSP) Update I
Executive Summary
Figure I: Current Virginia Air Transportation System
Virginia Air Transportation System Plan (VATSP) Update II
Executive Summary
State roles established for Virginia’s airports reflect their relative contribution to the Virginia Airport System and were used in the VATSP Update to identify development needs. Brief descriptions of roles for the VATSP airports follow:
• Commercial Service Airports (CS) (nine airports) – providing national and in some cases international air carrier and/or commuter service to surrounding communities. FAA Airport Reference Code (ARC) should be Category C and a precision instrument approach should be available if economically and technically feasible.
• Reliever Airports (RL) (eight airports) – are typically located near a commercial service airport and should be able to accommodate a full range of general aviation aircraft. These airports should have an approach with vertical guidance.
• General Aviation Regional Airports (GR) (19 airports) – are often serving multi-jurisdictional service areas and have facilities and services that can accommodate most general aviation aircraft. These airports should have a published approach.
• General Aviation Community Airports (GC) (16 airports) – are serving a mix of business and recreational users and have facilities and services that support general aviation aircraft that have less demanding runway needs.
• Local Service Airports (LO) (14 airports) – are serving smaller communities and have lower levels of demand than other airports. These airports typically serve smaller general aviation aircraft.
Extensive research and outreach with all study airports was completed as part of the inventory effort. During the inventory task, the following types of data were collected from all study airports:
• Existing airside and landside facilities • Current services • Past, current, and project aviation demand • Planned maintenance and improvement projects • Locally generated cost estimates for future airport development
Information collected in the inventory task provided the basis for much of the subsequent analysis that is part of the VATSP Update.
III. Forecast
VATSP analysis revealed that for many aviation demand components, historic average annual rates of growth for Virginia have been more robust than rates of growth for all airports in the U.S, as shown in Table I.
Virginia Air Transportation System Plan (VATSP) Update III
Executive Summary
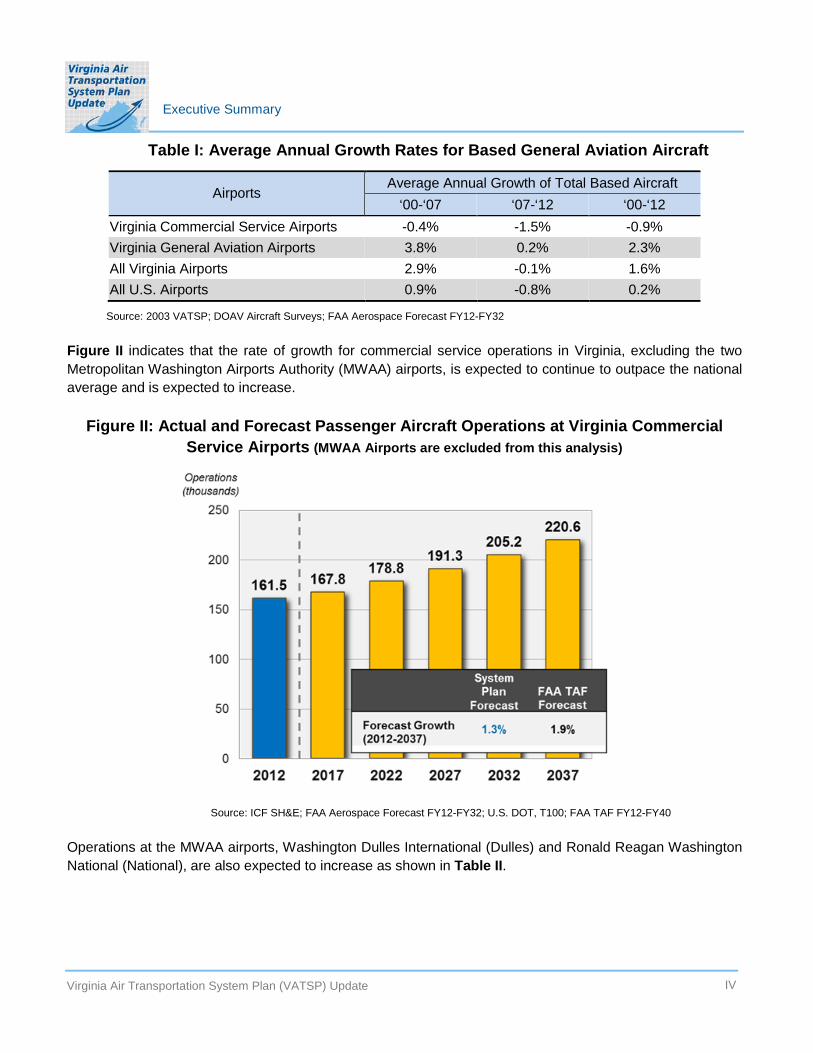
Table I: Average Annual Growth Rates for Based General Aviation Aircraft
Average Annual Growth of Total Based Aircraft Airports
‘07-‘12 ‘00-‘12 ‘00-‘07 Virginia Commercial Service Airports -0.4% -1.5% -0.9% Virginia General Aviation Airports 3.8% 0.2% 2.3% All Virginia Airports 2.9% -0.1% 1.6% All U.S. Airports 0.9% -0.8% 0.2%
Figure II indicates that the rate of growth for commercial service operations in Virginia, excluding the two Metropolitan Washington Airports Authority (MWAA) airports, is expected to continue to outpace the national average and is expected to increase.
Figure II: Actual and Forecast Passenger Aircraft Operations at Virginia Commercial Service Airports (MWAA Airports are excluded from this analysis)
Operations at the MWAA airports, Washington Dulles International (Dulles) and Ronald Reagan Washington National (National), are also expected to increase as shown in Table II.
Virginia Air Transportation System Plan (VATSP) Update IV
Executive Summary
Table II: Actual and Forecast Commercial Aircraft Operations at Ronald Reagan Washington National and Washington Dulles International Airports
Ronald Reagan Washington Dulles Year Washington National International Actual 2012 280,223 268,777 Forecast 2017 291,583 278,300 2022 283,095 304,116 2027 280,752 334,318 2032 283,015 369,604 2037 288,789 410,777 Average Annual Growth 1990-2012 0.4% 1.9% 2000-2012 0.6% -3.0% 2007-2012 0.4% -3.3% 2012-2017 0.8% 0.7% 2017-2037 0.0% 2.0% 2012-2037 0.1% 1.7%
Source: Ronald Reagan Washington National (FAA TAF FY2012-FY2040); Washington Dulles International (MWAA Airport Records; Leigh Fisher Dulles Forecast (September 2012); TAF FY2012-FY2040 forecast growth)
Based general aviation aircraft are those aircraft that are “permanently stored” at one of the study airports. Projections of demand from the VATSP Update, depicted in Figure III indicate that based aircraft in Virginia are expected to continue to grow at a rate above the national average.
Figure III: Forecast of Based Aircraft at Virginia Commercial Service and General Aviation Airports
Virginia Air Transportation System Plan (VATSP) Update V
Executive Summary
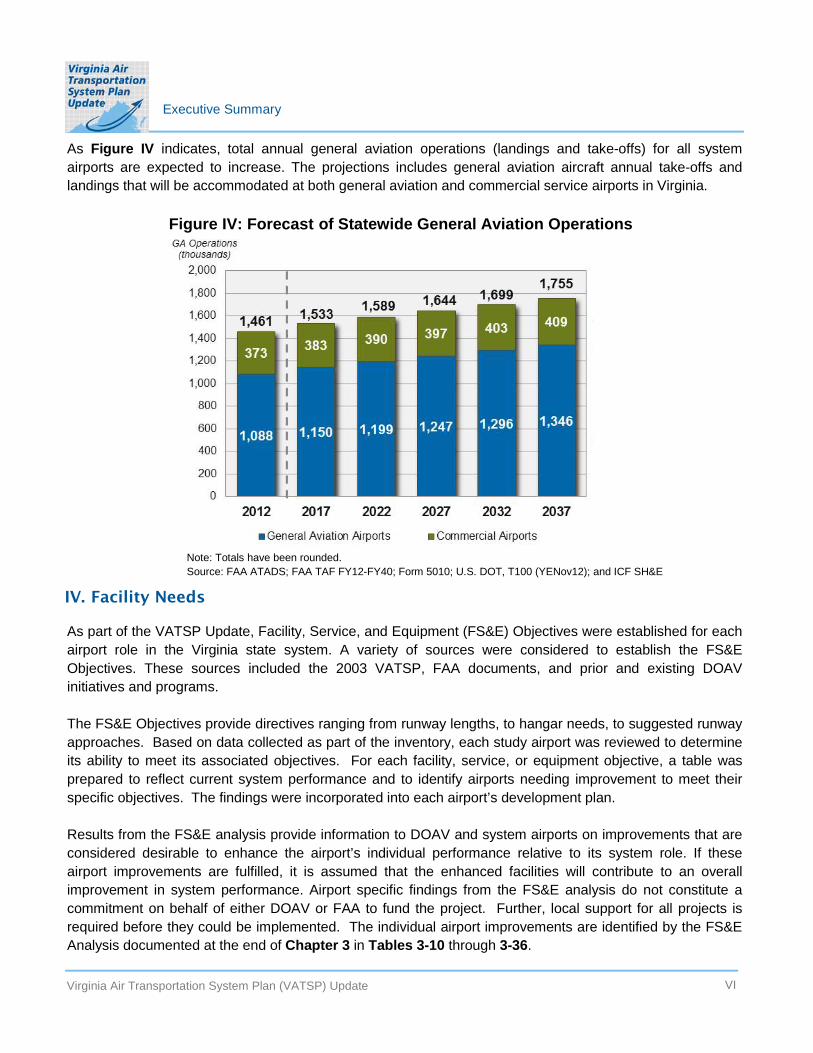
As Figure IV indicates, total annual general aviation operations (landings and take-offs) for all system airports are expected to increase. The projections includes general aviation aircraft annual take-offs and landings that will be accommodated at both general aviation and commercial service airports in Virginia.
Figure IV: Forecast of Statewide General Aviation Operations
Note: Totals have been rounded. Source: FAA ATADS; FAA TAF FY12-FY40; Form 5010; U.S. DOT, T100 (YENov12); and ICF SH&E
IV. Facility Needs
As part of the VATSP Update, Facility, Service, and Equipment (FS&E) Objectives were established for each airport role in the Virginia state system. A variety of sources were considered to establish the FS&E Objectives. These sources included the 2003 VATSP, FAA documents, and prior and existing DOAV initiatives and programs.
The FS&E Objectives provide directives ranging from runway lengths, to hangar needs, to suggested runway approaches. Based on data collected as part of the inventory, each study airport was reviewed to determine its ability to meet its associated objectives. For each facility, service, or equipment objective, a table was prepared to reflect current system performance and to identify airports needing improvement to meet their specific objectives. The findings were incorporated into each airport’s development plan.
Results from the FS&E analysis provide information to DOAV and system airports on improvements that are considered desirable to enhance the airport’s individual performance relative to its system role. If these airport improvements are fulfilled, it is assumed that the enhanced facilities will contribute to an overall improvement in system performance. Airport specific findings from the FS&E analysis do not constitute a commitment on behalf of either DOAV or FAA to fund the project. Further, local support for all projects is required before they could be implemented. The individual airport improvements are identified by the FS&E Analysis documented at the end of Chapter 3 in Tables 3-10 through 3-36.
Virginia Air Transportation System Plan (VATSP) Update VI
Population % of State Population % of
State Population % of State
Executive Summary
V. Alternatives/System Performance
An important part of the VATSP analysis was to determine how well the current system is performing, relative to several accessibility performance measures. To make this determination, analyses was completed to establish drive time service areas for each of the system airports. Depending on the performance measure that was being analyzed, these service areas were based on either 30- or 45-minute drive times.
GIS analysis was used to determine the population accessibility to airports and airport facilities. The VATSP analysis primarily considered the 66 airports in Virginia. Based on FAA guidelines, the analysis also considered the role that airports in neighboring states play in meeting Virginia’s aviation needs. Results of the analysis for the existing system’s performance are shown in Table III below.
This task of the VATSP Update considered if and how current system performance could be optimized. Optimization of the system assumed that there would be no constraint on funds to improve and expand the system and that all projects would be feasible to implement. The alternatives analysis considered changes and improvements for the system that considered factors such as:
• Extending runways at select airports • Adding additional new general aviation airports to the system • Replacing Grundy Municipal airport with Breaks Regional Airport. • Improving all airports to meet their FS&E Objectives (See Tables 3-10 to 3-36 in Chapter 3) • Changing state roles for select airports
Table III: Accessibility to Virginia System Virginia Airports Out of State Airports Total Coverage
Accessibility to Any Airport 7,576,797 94.7% 33,421 0.4% 7,610,218 95.1%
Accessibility to Commercial 6,182,237 77.3% 91,844 1.1% 6,274,081 78.4% Service Airport
Accessibility to Precision 6,977,288 87.2% 52,620 0.7% 7,030,606 87.9% Approach
Accessibility to Weather 7,412,431 92.6% 23,237 0.3% 7,435,668 92.9% Reporting
Accessibility to Business Airports 5,895,696 73.7% 38,137 0.5% 5,933,834 74.2%
Source: Results based on VATSP GIS analysis using 2010 Census data
Virginia Air Transportation System Plan (VATSP) Update VII
Executive Summary
VI. Costs
Unconstrained costs for improvements were identified and estimated in the alternatives analysis. Following that, we determined how to optimize system performance relative to each of the accessibility measures. This task of the VATSP also developed estimates of investment that would be required for each airport to completely fulfill all of their FS&E Objectives.
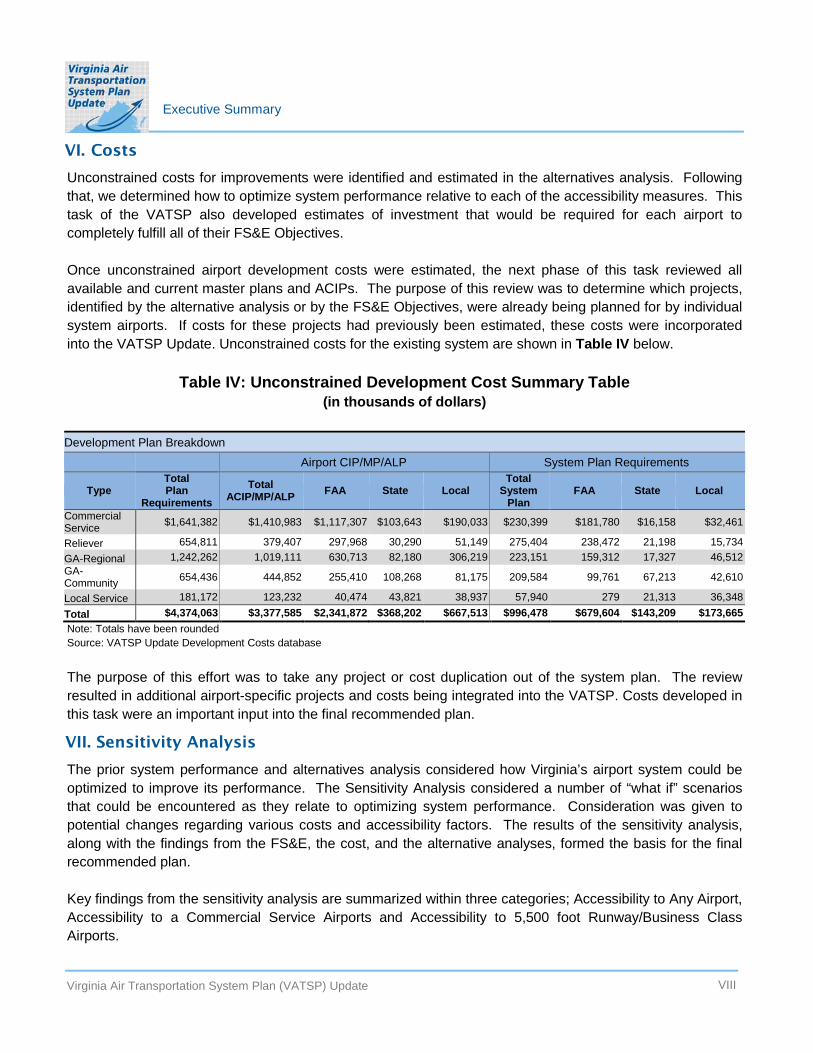
Once unconstrained airport development costs were estimated, the next phase of this task reviewed all available and current master plans and ACIPs. The purpose of this review was to determine which projects, identified by the alternative analysis or by the FS&E Objectives, were already being planned for by individual system airports. If costs for these projects had previously been estimated, these costs were incorporated into the VATSP Update. Unconstrained costs for the existing system are shown in Table IV below.
Table IV: Unconstrained Development Cost Summary Table (in thousands of dollars)
Development Plan Breakdown Airport CIP/MP/ALP System Plan Requirements
Type Total Plan
Requirements Total
ACIP/MP/ALP FAA State Local Total
System Plan
FAA State Local
Commercial Service Reliever GA-Regional GA-Community Local Service
$1,641,382
654,811 1,242,262
654,436
181,172
$1,410,983 $1,117,307 $103,643
379,407 297,968 30,290 1,019,111 630,713 82,180
444,852 255,410 108,268
123,232 40,474 43,821
$190,033
51,149 306,219
81,175
38,937
$230,399 $181,780 $16,158
275,404 238,472 21,198 223,151 159,312 17,327
209,584 99,761 67,213
57,940 279 21,313
$32,461
15,734 46,512
42,610
36,348 Total $4,374,063 $3,377,585 $2,341,872 $368,202 $667,513 $996,478 $679,604 $143,209 $173,665 Note: Totals have been rounded Source: VATSP Update Development Costs database
The purpose of this effort was to take any project or cost duplication out of the system plan. The review resulted in additional airport-specific projects and costs being integrated into the VATSP. Costs developed in this task were an important input into the final recommended plan.
VII. Sensitivity Analysis
The prior system performance and alternatives analysis considered how Virginia’s airport system could be optimized to improve its performance. The Sensitivity Analysis considered a number of “what if” scenarios that could be encountered as they relate to optimizing system performance. Consideration was given to potential changes regarding various costs and accessibility factors. The results of the sensitivity analysis, along with the findings from the FS&E, the cost, and the alternative analyses, formed the basis for the final recommended plan.
Key findings from the sensitivity analysis are summarized within three categories; Accessibility to Any Airport, Accessibility to a Commercial Service Airports and Accessibility to 5,500 foot Runway/Business Class Airports.
Virginia Air Transportation System Plan (VATSP) Update VIII
Executive Summary
Accessibility to Any Airport
Airports providing accessibility for Virginia residents, businesses and visitors are a mixture of publicly-owned, public-use and privately-owned, public use; NPIAS and non-NPIAS; as well as in state and out of state airports. As a result, it is important to understand the role that each airport category plays in terms of supporting accessibility to any airport. When a NPIAS airport sponsor accepts a federal grant, it automatically obligates the airport to remain open for 20 years. Airports in this category are considered most stable for long term accessibility. It was determined out-of-state airports play a small role in terms of providing Virginia with accessibility to any airport. As a result Virginia is not heavily reliant on out-of-state airports regarding the coverage of residents within a 30- or 45 minute drive time. There are nine privately-owned non-NPIAS and nine publicly-owned non-NPIAS general aviation airports in the Virginia system.
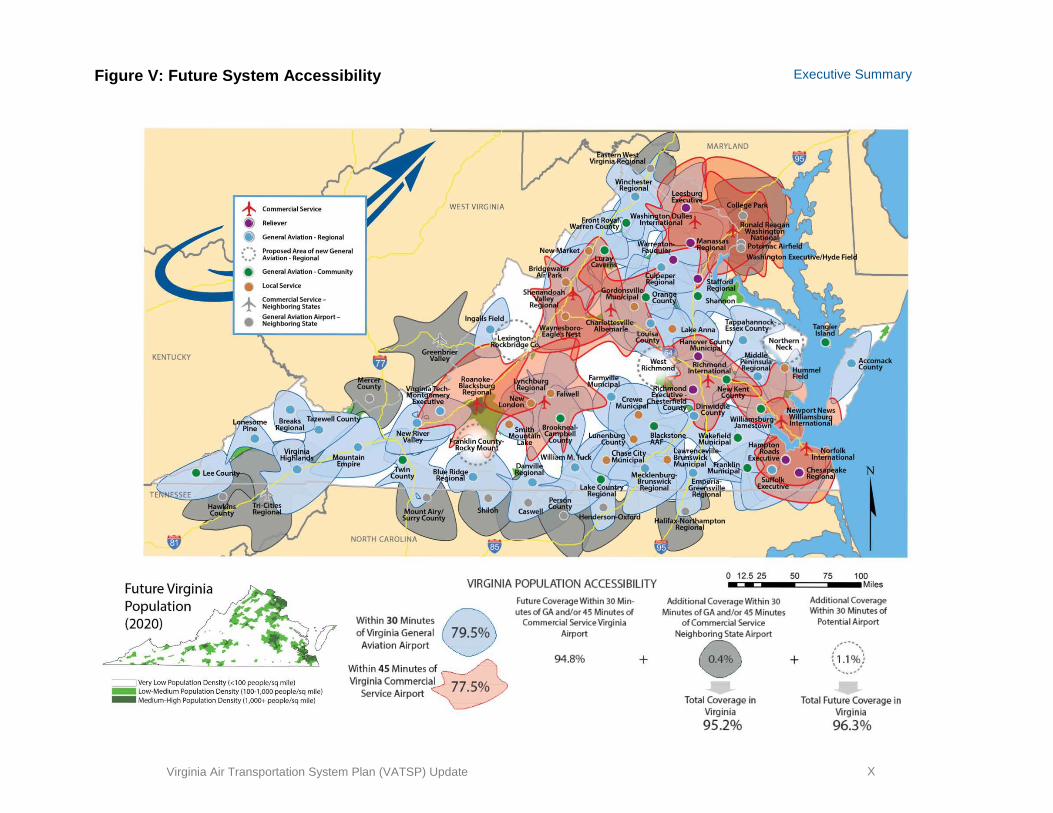
The only means to substantially increase the level of accessibility to a Commercial Service Airport or General Aviation Airport within the system would be to introduce new airports into the system. The VATSP Update contains a recommendation for four new general aviation airports to serve the areas of Lexington-Rockbridge County, Franklin County-Rocky Mount, the Northern Neck, and West Richmond. Local support would be essential for any of these airports to be developed. The development of these new airports would increase accessibility to any airport, and the new airports would provide further back up for the non-NPIAS public and privately-owned airports. The approximate location of these airports is depicted in Figure V.
Virginia Air Transportation System Plan (VATSP) Update IX
KENTUCKY
+ ~ Reliever
~ General Aviation · Reglonal
~::.~
• • +
Proposed Area of new General Aviation · Regional
General Aviation · Community
Local Service
Commercial Servke -Neighboring States
WEST VIRGINIA
Future Virginia Population
VIRGINIA POPULATION ACCESSIBILITY
(2020)
_ Very Low Population Density (<100 people/sq mile) - low-Medium Population Density (100-1,000 people/sq mile) - Medium-High Population Density (1,000+ people/ sq mile)
Within 30 Minutes e of Virginia General
Aviation Airport
Within 45 Minutes o~ Virgini~ Co".'mercial 77 .So/c
Service Airport 0
Future Coverage Within 30 Minutes of GA and/or45 Minutes of
Commercial Service Virginia Airport
94.8% +
0 12.5 25 50 75 100 •=-CJ---== ==---Miles
Additional Coverage Within 30 Minutes of GA and/or 45 Minutes
of Commercial Service Neighboring State Airport
Total Coverage in Virginia
95.2%
+
Additional Coverage Within 30 Minutes of
Potential Airport
,, ......... \ i l.1 % } ' .............. ·
Total Future Coverage in Virginia
96.3%
Figure V: Future System Accessibility Executive Summary
Virginia Air Transportation System Plan (VATSP) Update X
Executive Summary
Accessibility to a Commercial Service Airport
There are nine commercial service airports in Virginia and two additional airports in neighboring states that are within 45 minutes or less of the Virginia border. Based on conditions in the commercial airline industry, it is not considered likely that additional airports in Virginia will have commercial airline service in the future. The VATSP analysis first examined accessibility to commercial service airports using 45-minute drive times. In reality, commercial airline passengers often drive much longer than 45 minutes to reach their departure airport. Based on individual needs and circumstances, passengers will drive up to 120 minutes to reach a departure airport for their commercial airline trip. As Figure VI illustrates, if service areas for all commercial service airports in Virginia and for commercial service airports in neighboring states were increased to 120 minutes, almost 100 percent of Virginia’s residents are within the service area of one or more commercial service airports.
Accessibility to 5,500-foot Runways and Business Class Airports
A primary objective of the VATSP Update was to identify areas of the Commonwealth that are or that should be served by an airport that is capable of serving almost all, if not all, general aviation business jets. This is a system characteristic that is essential for economic support, growth, and diversification. Business class airport characteristics considered in the VATSP include:
1. Runway length of 5,500 feet 2. Precision Approach or RNAV LPV Approach (Vertical Guidance) 3. Weather observation system
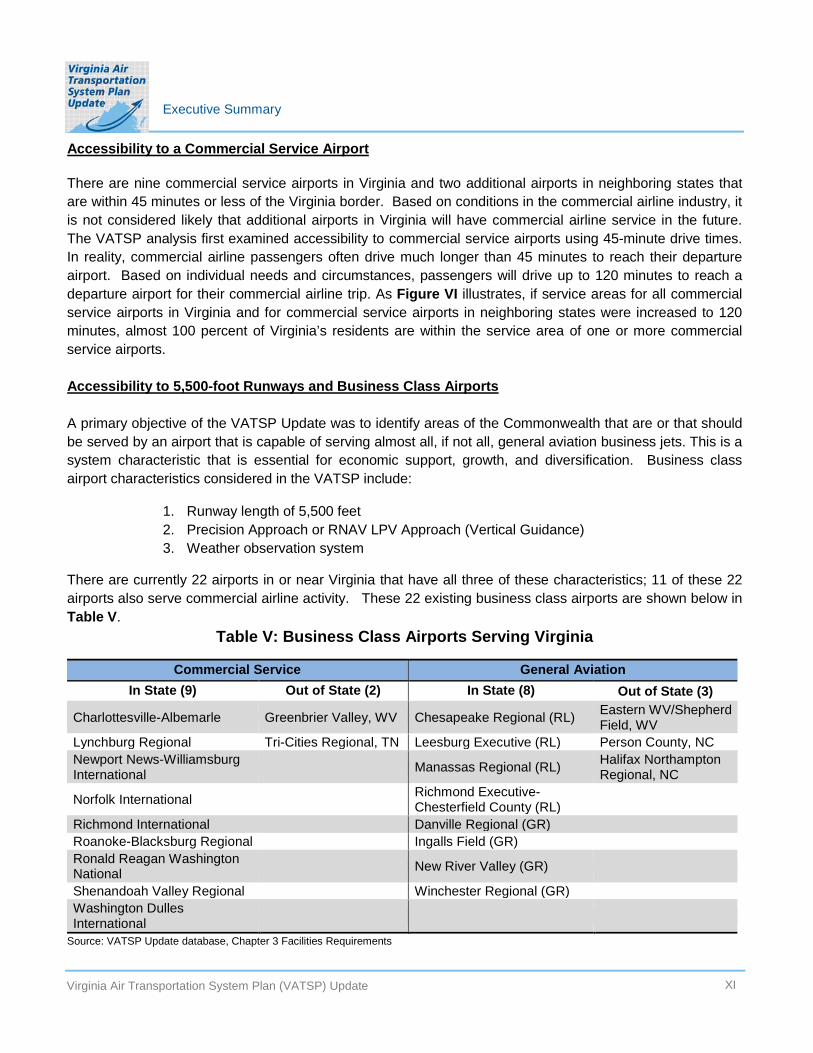
There are currently 22 airports in or near Virginia that have all three of these characteristics; 11 of these 22 airports also serve commercial airline activity. These 22 existing business class airports are shown below in Table V.
Table V: Business Class Airports Serving Virginia
Commercial Service General Aviation In State (9) Out of State (2) In State (8) Out of State (3)
Virginia Air Transportation System Plan (VATSP) Update XI
KENTUCKY
Future Virginia Population (2020)
Very Low Population Density (<100 people/sq mi le) - Low-Medium Population Density (100-1,000 people/sq mile) - Medium-High Population Density (1 ,000+ people/ sq mile)
Commercial Service
~~rQ~6~l~~5~l:t~; -
Within 45 Minutes of 9 Commercial Service Virginia
Airports
+
1 WEST VIRGINIA
Piedmont Triad International
Raleigh-Durham International
0 12.5 25 100 •=-c:i--•===---•Miles
50 75
Additional Coverage within 45 Minutes of
Total ~age in Virginia 78.5%
VIRGINIA POPULATION ACCESSIBILITY Additional Coverage Additional Coverage
Within 60 Minutes within 60 Minutes of 7 Within 90 Minutes within 90 Minutes of 7 of 9 Commercial
Service Virginia Airports
86.4%
Commercial Service Neighboring State
Airports
+ 3.1%
Total C~age in Virginia 89.5%
of 9 Commercial Service Virginia
Airports
+
Total C~age in Virginia 97.3%
Within 120 Minutes of 9 Commercial Service Virginia
Airports
95.6% +
Additional Coverage w ithin 120 Minutes of 7 Commercia l Serv ice
Neighboring State Airports
3.0%
Total C~age in Virg inia 98.6%
Figure VI: Commercial Service Airport Accessibility Executive Summary
Virginia Air Transportation System Plan (VATSP) Update XII
Executive Summary
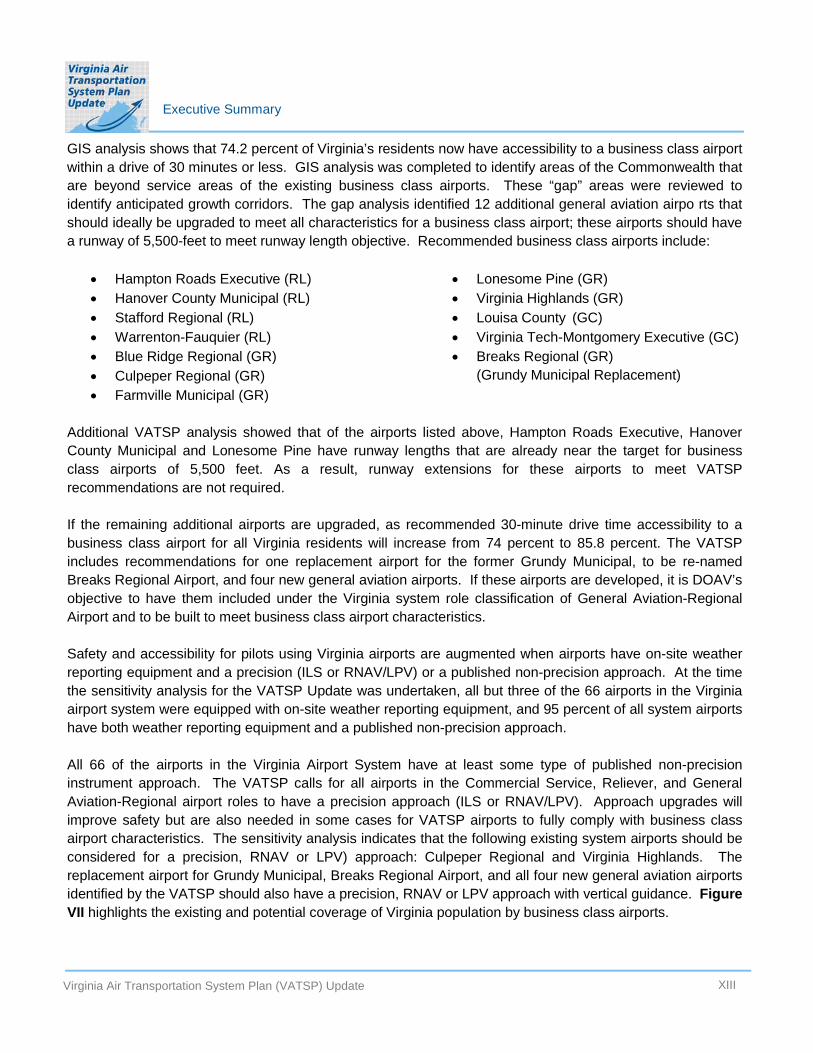
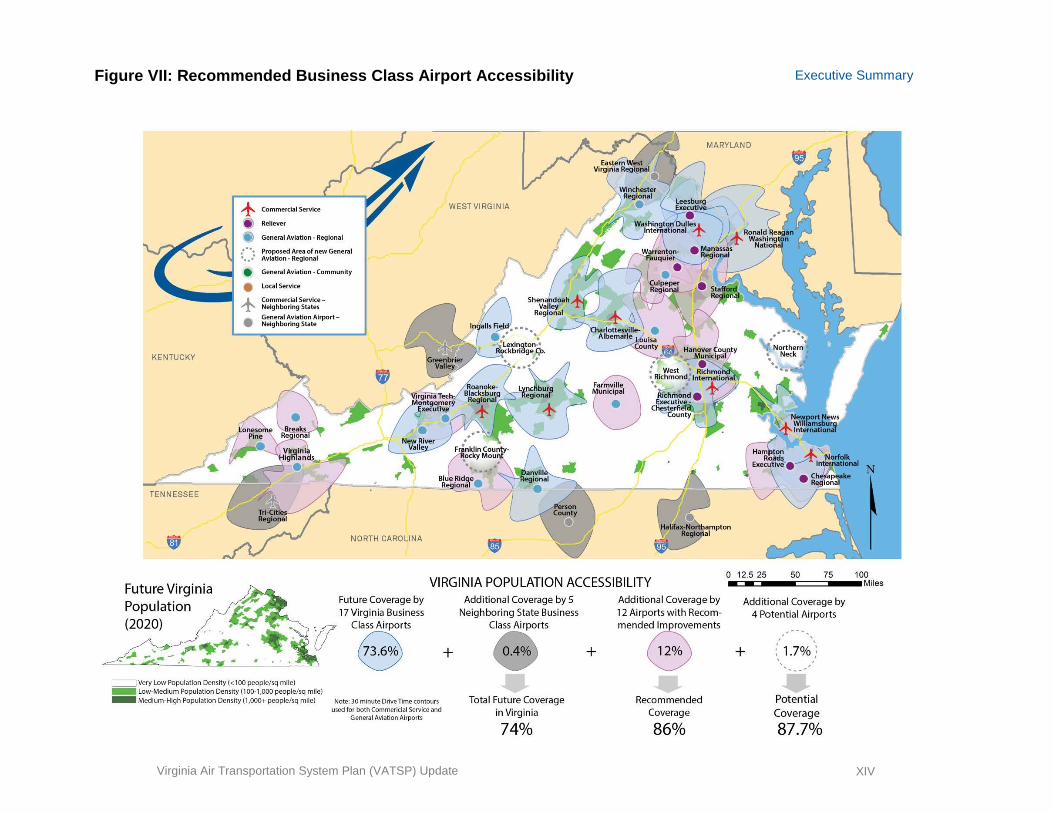
GIS analysis shows that 74.2 percent of Virginia’s residents now have accessibility to a business class airport within a drive of 30 minutes or less. GIS analysis was completed to identify areas of the Commonwealth that are beyond service areas of the existing business class airports. These “gap” areas were reviewed to identify anticipated growth corridors. The gap analysis identified 12 additional general aviation airpo rts that should ideally be upgraded to meet all characteristics for a business class airport; these airports should have a runway of 5,500-feet to meet runway length objective. Recommended business class airports include:
• Hampton Roads Executive (RL) • Lonesome Pine (GR) • Hanover County Municipal (RL) • Virginia Highlands (GR) • Stafford Regional (RL) • Louisa County (GC) • Warrenton-Fauquier (RL) • Virginia Tech-Montgomery Executive (GC) • Blue Ridge Regional (GR) • Breaks Regional (GR) • Culpeper Regional (GR) (Grundy Municipal Replacement) • Farmville Municipal (GR)
Additional VATSP analysis showed that of the airports listed above, Hampton Roads Executive, Hanover County Municipal and Lonesome Pine have runway lengths that are already near the target for business class airports of 5,500 feet. As a result, runway extensions for these airports to meet VATSP recommendations are not required.
If the remaining additional airports are upgraded, as recommended 30-minute drive time accessibility to a business class airport for all Virginia residents will increase from 74 percent to 85.8 percent. The VATSP includes recommendations for one replacement airport for the former Grundy Municipal, to be re-named Breaks Regional Airport, and four new general aviation airports. If these airports are developed, it is DOAV’s objective to have them included under the Virginia system role classification of General Aviation-Regional Airport and to be built to meet business class airport characteristics.
Safety and accessibility for pilots using Virginia airports are augmented when airports have on-site weather reporting equipment and a precision (ILS or RNAV/LPV) or a published non-precision approach. At the time the sensitivity analysis for the VATSP Update was undertaken, all but three of the 66 airports in the Virginia airport system were equipped with on-site weather reporting equipment, and 95 percent of all system airports have both weather reporting equipment and a published non-precision approach.
All 66 of the airports in the Virginia Airport System have at least some type of published non-precision instrument approach. The VATSP calls for all airports in the Commercial Service, Reliever, and General Aviation-Regional airport roles to have a precision approach (ILS or RNAV/LPV). Approach upgrades will improve safety but are also needed in some cases for VATSP airports to fully comply with business class airport characteristics. The sensitivity analysis indicates that the following existing system airports should be considered for a precision, RNAV or LPV) approach: Culpeper Regional and Virginia Highlands. The replacement airport for Grundy Municipal, Breaks Regional Airport, and all four new general aviation airports identified by the VATSP should also have a precision, RNAV or LPV approach with vertical guidance. Figure VII highlights the existing and potential coverage of Virginia population by business class airports.
Virginia Air Transportation System Plan (VATSP) Update XIII
+ Commercial Service WEST VIRGINIA
~ Reliever
~ Gene ral Aviation - Regional
:··. Proposed Area of new General .. Aviat ion - Regional ... • General Aviation - Community
• Local Service
+ Commercial Service-Neighboring States
• General Aviation Airport -Neigh boring Sta te
KENTUCKY
TENNESSEE
NORTH CARO LINA
Future Virginia Population (2020)
VIRGINIA POPULATION ACCESSIBILITY
__=i very low Population Density (<100 people/sq mile) - Low-Medium Population Density (100-1,000 people/sq mile)
Future Coverage by 17 Virginia Business
Class Airports
e - Medium-High Population Density (1,000+ people/sq mile) Note: 30 minute Drive Time contours
used for both Commericial Service and General Aviation Airports
Addit ional Coverage by 5 Neighboring State Business
Class Airports
Total Future Coverage in Virginia
74%
Additional Coverage by 12 Airports w ith Recommended Improvements
e Recommended
Coverage
86%
0 12.5 25 50 75
Additional Coverage by 4 Potential Airports
', .. ~ -.....
+ :, 1.7% ) ,'
Potential Coverage
87.7%
N
~ 100
Miles
Figure VII: Recommended Business Class Airport Accessibility Executive Summary
Virginia Air Transportation System Plan (VATSP) Update XIV
Executive Summary
VIII. Recommended System
The VATSP included research and analysis to develop a comprehensive estimate of costs to maintain, improve, and expand Virginia’s Airport System. Initially, cost estimates were developed for all system airports to be improved to fully meet all of their respective FS&E Objectives from the VATSP. Individual airport master plans and capital improvement plans (ACIPs) were also collected and reviewed to avoid cost duplications and to identify other projects and associated costs included in these documents.
In total, the VATSP Update shows that between now and the end of the planning period, over $4 billion dollars will need to be invested in Virginia’s Airport System to improve existing airports and to build new airports. The accompanying Tables VI through IX show how total investment for the planning periods are divided between various airport roles in Virginia’s system. The tables also show the final projected investment for all future airports. Costs to develop new airports are included as a single–phase, full-build development in these tables. The individual airport cost details and the full-build and alternatively phased development costs for the new airports are documented in Appendices C and D respectively.
Nearly 80 percent of all cost estimates in the VATSP came from individual airport ACIPs. ACIPs focus on short term (1-5 year) development needs. As a result, the total cost to respond to all airport development and maintenance needs between now and the end of the planning period could exceed the estimated $4.337 billion.
Table VI: Project Costs for the 0-5 Year Planning Period (in thousands of dollars)
VATSP Service Role Federal State Local Total
Commercial Service $858,684
Reliever 179,313 18,711 23,540 221,564
GA-Regional 347,465 39,487 68,517 455,469
GA-Community 117,139 46,885 32,914 196,938
Local Service 18,279 18,997 19,571 56,848
Total Costs for Period $1,520,880 $204,734 $253,235 $1,978,850
Project Type Federal State Local Total
Runway Extension $122,205 $10,863 $3,245 $136,312
Terminal Building Needs 75,341 22,178 59,620 157,139
Licensing Standards Needs 47 562 179 788
Airport Basic Unit Needs 257 190 500 947
$80,654 $108,693 $1,048,031
Total for Project Types Only $197,850 $33,793 $63,544 $295,186
Note: Totals have been rounded. All project costs escalated based on project year.
Source: VATSP Update Development Costs database
Virginia Air Transportation System Plan (VATSP) Update XV
Executive Summary
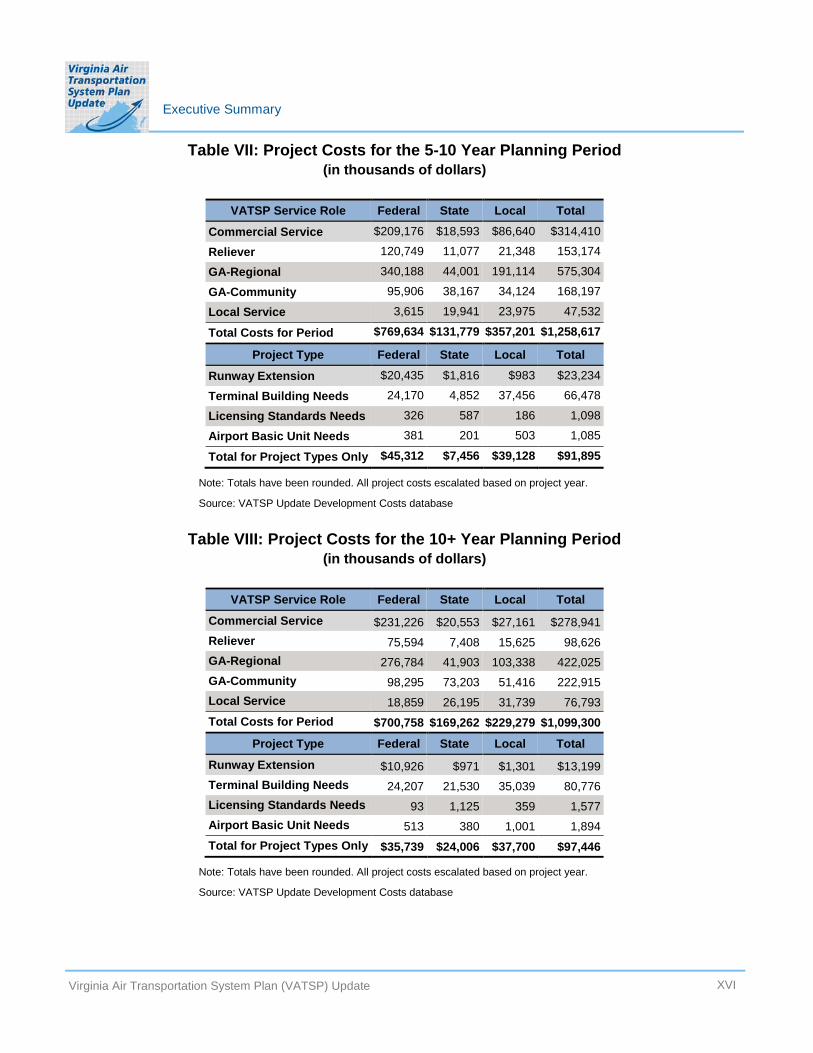
Table VII: Project Costs for the 5-10 Year Planning Period (in thousands of dollars)
VATSP Service Role Federal State Local Total
Commercial Service $209,176 $18,593 $86,640 $314,410
Reliever 120,749 11,077 21,348 153,174
GA-Regional GA-Community Local Service
340,188
95,906
3,615
44,001
38,167
19,941
191,114
34,124
23,975
575,304
168,197
47,532
Total Costs for Period $769,634 $131,779 $357,201 $1,258,617
Project Type
Runway Extension Terminal Building Needs Licensing Standards Needs Airport Basic Unit Needs
Federal $20,435
24,170
326
381
State $1,816
4,852
587
201
Local $983
37,456
186
503
Total $23,234
66,478
1,098
1,085
Total for Project Types Only $45,312 $7,456 $39,128 $91,895
Note: Totals have been rounded. All project costs escalated based on project year.
Source: VATSP Update Development Costs database
Table VIII: Project Costs for the 10+ Year Planning Period (in thousands of dollars)
VATSP Service Role Federal State Local Total
Commercial Service $231,226 $20,553 $27,161 $278,941 Reliever 75,594 7,408 15,625 98,626 GA-Regional 276,784 41,903 103,338 422,025 GA-Community 98,295 73,203 51,416 222,915 Local Service 18,859 26,195 31,739 76,793 Total Costs for Period $700,758 $169,262 $229,279 $1,099,300
Project Type Federal State Local Total
Runway Extension $10,926 $971 $1,301 $13,199 Terminal Building Needs 24,207 21,530 35,039 80,776 Licensing Standards Needs 93 1,125 359 1,577 Airport Basic Unit Needs 513 380 1,001 1,894 Total for Project Types Only $35,739 $24,006 $37,700 $97,446
Note: Totals have been rounded. All project costs escalated based on project year.
Source: VATSP Update Development Costs database
Virginia Air Transportation System Plan (VATSP) Update XVI
Executive Summary
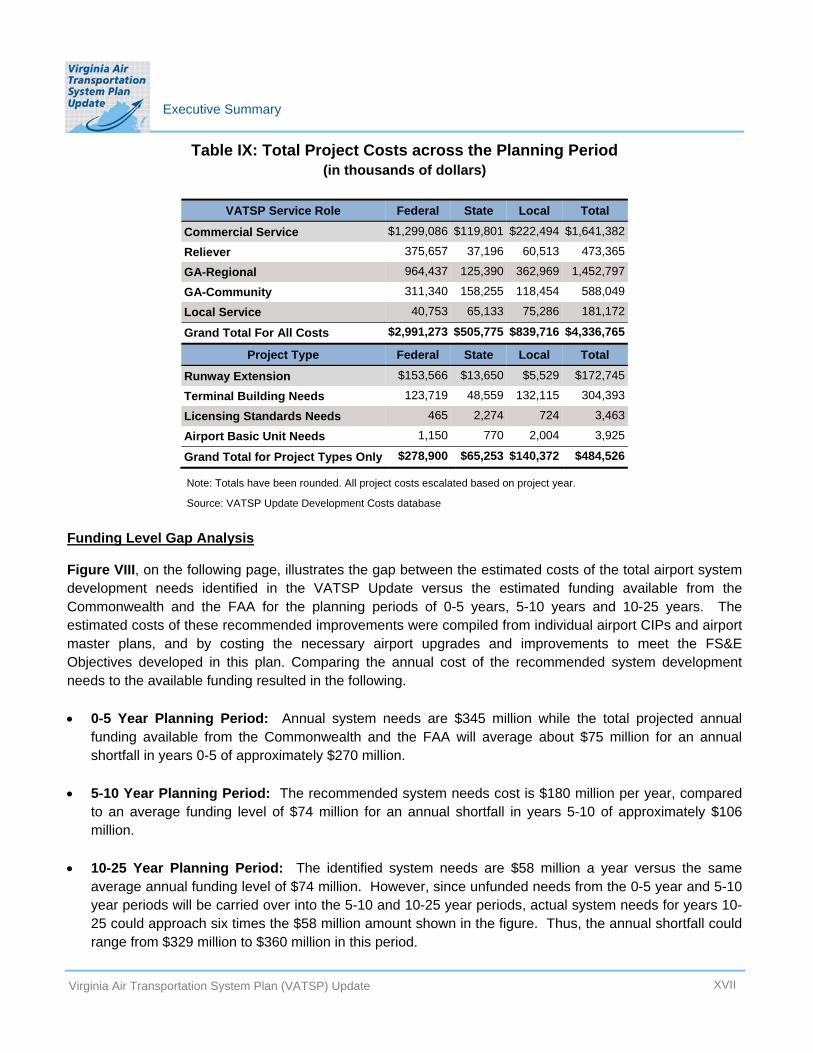
Table IX: Total Project Costs across the Planning Period (in thousands of dollars)
VATSP Service Role Federal State Local Total
Reliever 375,657 37,196 60,513 473,365
GA-Regional 964,437 125,390 362,969 1,452,797
GA-Community 311,340 158,255 118,454 588,049
Local Service 40,753 65,133 75,286 181,172
Grand Total For All Costs $2,991,273 $505,775 $839,716 $4,336,765
Commercial Service $1,299,086 $119,801 $222,494 $1,641,382
Project Type Federal State Local Total
Runway Extension $153,566 $13,650 $5,529 $172,745
Terminal Building Needs 123,719 48,559 132,115 304,393
Licensing Standards Needs 465 2,274 724 3,463
Airport Basic Unit Needs 1,150 770 2,004 3,925
Grand Total for Project Types Only $278,900 $65,253 $140,372 $484,526
Note: Totals have been rounded. All project costs escalated based on project year.
Source: VATSP Update Development Costs database
Funding Level Gap Analysis
Figure VIII, on the following page, illustrates the gap between the estimated costs of the total airport system development needs identified in the VATSP Update versus the estimated funding available from the Commonwealth and the FAA for the planning periods of 0-5 years, 5-10 years and 10-25 years. The estimated costs of these recommended improvements were compiled from individual airport CIPs and airport master plans, and by costing the necessary airport upgrades and improvements to meet the FS&E Objectives developed in this plan. Comparing the annual cost of the recommended system development needs to the available funding resulted in the following.
0-5 Year Planning Period: Annual system needs are $345 million while the total projected annual funding available from the Commonwealth and the FAA will average about $75 million for an annual shortfall in years 0-5 of approximately $270 million.
5-10 Year Planning Period: The recommended system needs cost is $180 million per year, compared to an average funding level of $74 million for an annual shortfall in years 5-10 of approximately $106 million.
10-25 Year Planning Period: The identified system needs are $58 million a year versus the same average annual funding level of $74 million. However, since unfunded needs from the 0-5 year and 5-10 year periods will be carried over into the 5-10 and 10-25 year periods, actual system needs for years 10-25 could approach six times the $58 million amount shown in the figure. Thus, the annual shortfall could range from $329 million to $360 million in this period.
Virginia Air Transportation System Plan (VATSP) Update XVII
Executive Summary
All unfunded needs are carried over into the next year throughout each planning period and into the next planning period as well, accumulating to levels well above the estimated costs of the annual system needs. The trend line for those unfunded costs is also shown on the figure.
Figure VIII: Funding Level Gap Analysis
This update to the VATSP provides important guidance needed to insure that the Commonwealth is focused on key initiatives, strategies, and actions to meet Virginia’s aviation needs now and in the future. For the Virginia airport system to continue to be a national leader and a key contributor to Virginia’s economy, it is important that current DOAV funding levels be, at a minimum, maintained. When one considers that DOAV’s annual investment in its airports historically has been approximately $28 million and that the existing 66 airports are in turn supporting almost $29 billion in annual economic activity, it is without a doubt that Virginia airports are well worth the investment. Figure IX illustrates the final recommended system plan including the general location of four new airports and role changes to four general aviation airports.
XVIII Virginia Air Transportation System Plan (VATSP) Update
Executive Summary
Figure IX: Recommended System
Virginia Air Transportation System Plan (VATSP) Update XIX