Page 1
Copyright © IJIFR 2014. Author’s Subject Area: Water Engineering Available Online at: - http://www.ijifr.com/searchjournal.aspx
www.ijifr.com [email protected] ISSN (Online): 2347-1697
INTERNATIONAL JOURNAL OF INFORMATIVE & FUTURISTIC RESEARCH An Enlightening Online, Open Access, Refereed & Indexed International Journal of Multidisciplinary Research
Volume -1 Issue -11, July 2014
16
3
Evaluation of Intermittent Water Supply System
and Design of 24x7 for a residential area in Mysore,
Karnataka, India
Abstract
Water is a basic need for life, without water life would not exist. Today in Indian scenario
about one in every nine people lack access to good quality water. Although water is
renewable it is finite and precious. Now-a-days due to increase in water demand resulted in
depleting ground water resources that in turn increased in the capital cost for water supply
thus, alternative methods for conservation are to be developed one such is 24x7 which helps
to prevent deliberate wasting of water in comparison to intermittent water supply system. In
this paper along with the design of the 24x7water supply system for existing intermittent
water supply system water quality analysis is being done. Designing of Water supply system
is made using LOOP and EPANET and compared for their efficiency.
Keywords: Water, Quality, Design, LOOP, EPANET, 24x7, Intermittent
1. Introduction
Water supply system is an infrastructure for the collection, transmission, treatment, storage and
distribution of water for homes, commercial establishments, industry, and irrigation, as well as for
public needs as firefighting and street flushing. Of all municipal services, providing of safe
drinking water is perhaps the most vital. In all cases, the its role is to fulfill both quality and quantity
requirements. It has remained the most severe issue for the Urban Local Bodies (ULB), whether they
are located in water abundant or water starved region.
1.1 Intermittent System of Supply
In this case, water is supplied at regular intervals for certain period of the day (either in the morning
or in the evening). Water supply systems do not operate as designed hence, reservoir capacities are
often underutilized, and valves suffer wear and tear [1]. Since, water is supplied by zoning the
Rajeshwari R1, Dr. B. Manoj Kumar2
1Research Scholar, 2Professor Sri Jayachamarajendra College of Engineering
PA
PE
R I
D:
IJIF
R /
V1
/ E
11
/ 0
38
Page 2
Rajeshwari R , Dr. B. Manoj Kumar : Evaluation of Intermittent Water Supply System and Design of 24x7 for a residential area in Mysore, Karnataka, India
www.ijifr.com Email: [email protected] © IJIFR 2014 This paper is available online at - http://www.ijifr.com/searchjournal.aspx
PAPER ID: IJIFR/V1/E11/038
ISSN (Online): 2347-1697
INTERNATIONAL JOURNAL OF INFORMATIVE & FUTURISTIC RESEARCH
Volume -1 Issue -11, July 2014 Author’s Research Area: Water Engineering, Page No. 163-173
16
4
16
4
distribution system, more man power is required [2]. During non-supply hours, pipes are empty and
dirt water enters pipelines at vulnerable spots and water is contaminated [1]. Large doses of chlorine
or other disinfectants are required to make water safe from microbial pollution [3]. Due to limited
hours, peak factor is often in the range of 4 to 6 in most of the systems [4]. Therefore, large sizes of
pipe mains are required for strengthening the network to meet the hydraulic requirements [4].
Inconvenient supply hours affect poor people. Large size of storage is required and consumers have to
pay for pumping. Also, it results in poor sanitation practices leading to increase in health risks and
mortality. Due to intermittent water supply, often meters go out of order resulting in loss of revenue.
Besides, due to uncertainty consumers store a large quantity of water and waste it before collecting
fresh water again. This adds to a huge undue wastage of precious treated water.
1.2 Continuous System of Supply
In this case, water is delivered continuously to every customer of the service 24 hours a day, every
day of the year, through a transmission and distribution system that is continuously full and under
positive pressure throughout all of its pipelines and networks. In this system, pressurized water supply
overcomes shortcomings of intermittent supply and ensures customer convenience and benefits the
poor. Continuous high quality water supply system reduces contamination level as the pipes are under
positive pressure and entry of contaminants into the pipes is restricted [4]. Life of distribution
networks increases as steady pressure in the pipes causes less damage to the pipes. A better demand
management is possible due to elaborate metering and effective leakage control. It also results in less
storage of water or none at all, which in turn reduces wastage of water. Continuous supply of pure
water boosts the economy and attracts more industries and businesses [4].
1.3 Objectives of the Paper
The main objective of this study is to verify the existing water distribution network (intermittent) and
designing of 24x7 water distribution system using computer software’s for the selected DMA of
Mysore city. The specific objectives are:
1. Water quality analysis for the intermittent water distribution system.
2. Identification of failure of existing intermittent water supply distribution system in terms of
design and system age.
3. To simulate the intermittent water distribution system using computer model.
4. Remodeling for 24x7 water distribution system for the design period.
5. To study the changes to be made in existing intermittent to24x7 water supply system.
2 Materials and Methods
Before taking up this work existing water supply distribution system was studied and the problems
observed are listed below:
1. Complaints were being registered regarding the quality of water supplied.
2. Negative pressures in some points were also registered by the consumers.
3. Pipelines at several consumer locations were deteriorated.
4. There were illegal connections being taken up that resulted in loss of revenue.
2.1 Existing Water Supply System
At present the study DMA in the study receives water mainly from the river Kaveri as source, from
the German press MBR of capacity 16.67 ML with a ground level of 782.27 m using 450 diameter
MS pipe it is fed to the Pump house then using 350 diameter MS pipe fills the Master Distribution
Page 3
Rajeshwari R , Dr. B. Manoj Kumar : Evaluation of Intermittent Water Supply System and Design of 24x7 for a residential area in Mysore, Karnataka, India
www.ijifr.com Email: [email protected] © IJIFR 2014 This paper is available online at - http://www.ijifr.com/searchjournal.aspx
PAPER ID: IJIFR/V1/E11/038
ISSN (Online): 2347-1697
INTERNATIONAL JOURNAL OF INFORMATIVE & FUTURISTIC RESEARCH
Volume -1 Issue -11, July 2014 Author’s Research Area: Water Engineering, Page No. 163-173
16
5
16
5
Tank (MDT) at German press itself of 10 Lakh liters capacity with stage height of 18.0m and ground
level of 782.27m with full supply level of 807.27m then using 508 diameter MS pipe, 406 diameter
MS pipe and 300 diameter DI pipe fed to Service level reservoir at DMA 6300 of 15 Lakh liters
capacity with stage height if 15 m and ground level of 776.55m and full supply level of 798.55m from
which using 350 diameter CI and 314 diameter HDPE sent to distribution system. Fig 2.1 shows the
Key diagram of DMA 6300. At present all the pipes in the DMA 6300 is of CI pipes laid very long
back. The details of the existing pipes are given in table 2.1
Table 2.1 Details of Existing pipe network
Pipe Diameter
(mm)
Pipe Material Length (m) Total
63
Cast Iron
(CI)
64,753.10
87, 938.86 m
80 17,208.36
90 923.84
110 2,106.59
140 142.88
150 746.08
160 405.55
200 849.16
250 803.30
2.2 Peak Factor determination
In order determine the peak factor, on site monitoring of the time required for emptying unit volume
of service level reservoir was done and corresponding flow was calculated for a week and each day
peak flow was divided by average flow to finally calculate the Peak factor.
2.3 Water quality analysis
At Sri Jayachamarajendra college of engineering, Environmental Engineering department laboratory
water quality analysis was been done for the water samples collected from dead end, Higher elevation
and Lower elevation node points in three phases, water quality analysis was being done for Physical,
Chemical and bacteriological parameters as per CPHEEO [7] test for drinking water quality
parameters.
Figure 2.1: Key plan for DMA 6300
Page 4
Rajeshwari R , Dr. B. Manoj Kumar : Evaluation of Intermittent Water Supply System and Design of 24x7 for a residential area in Mysore, Karnataka, India
www.ijifr.com Email: [email protected] © IJIFR 2014 This paper is available online at - http://www.ijifr.com/searchjournal.aspx
PAPER ID: IJIFR/V1/E11/038
ISSN (Online): 2347-1697
INTERNATIONAL JOURNAL OF INFORMATIVE & FUTURISTIC RESEARCH
Volume -1 Issue -11, July 2014 Author’s Research Area: Water Engineering, Page No. 163-173
16
6
16
6
2.4 Software for water supply distribution system
2.4.1 Preloop
To find out the nodal demand at each node, Sri Jayachamarajendra college of Engineering, Mysore
has developed software called PRELOOP for Integrated Rural Water Supply and Sanitation Scheme
under World Bank assisted project. The data required for PRELOOP software include:
Pipe Data – Pipe number, connecting node numbers, Pipe length, Hazen-Williams coefficient,
number of persons per house, existing number of houses and house connections in each link (pipeline)
and proposed number of house and house connections.
Node Data – Node numbers and corresponding elevation (Reduced level).
HGL Data – Source node number and node head.
This software is used for calculating the nodal demand and all the input data along with nodal demand
will be transferred to LOOP software.
2.4.2 LOOP
LOOP version 3.0 menu driven computer program written in BASIC is used for the design of water
supply distribution system for both existing and proposed. LOOP program will accept any looped,
partially looped/branched or completely branched network. LOOP uses the Hardy-Cross algorithm to
determine the flow corrections to the assumed flows in pipelines [8]. The flow correction is based on
the concepts of maintaining the flow continuity at node and maintaining a sum of zero head losses
around any loop[8]. Once the flows are determined that meet the above conditions, HGL elevations at
each node can be easily calculated. The LOOP program can accommodate network containing a
maximum of 500 pipes and 400 nodes. It includes cost analysis also and Hazen-Williams equation is
used in the program to calculate the head loss and velocity.
2.4.3 EPANET
EPANET is a computer program that performs extended period simulation of hydraulic and water
quality behavior within pressurized pipe networks. A network consists of pipes, nodes (pipe
junctions), pumps, valves and storage tanks or reservoirs [6]. EPANET tracks the flow of water in
each pipe, the pressure at each node, the height of water in each tank, and the concentration of a
chemical species throughout the network during a simulation period comprised of multiple time steps.
In addition to chemical species, water age and source tracing can also be simulated. The data required
for the EPANET software include:
Node Data – Node number, Elevation, Nodal Demand
Pipe data – Pipe number, Length, diameter, C-factor (Roughness)
Tank data – Bottom elevation, Diameter, Initial and Minimum water levels, Initial water quality.
Running under Windows, EPANET provides an integrated environment for editing network input
data, running hydraulic and water quality simulations, and viewing the results in a variety of formats.
These include color-coded network maps, data tables, time series graphs, and contour plots.
3 Results and Discussions
3.1 General Design Criteria Design Period - As per the CPHEEO [7] Manual on Water Supply and Treatment, the design period
adopted is 30 years for water distribution system.
Per capita water supply - The per capita water supply rate is considered as 135 lpcd.
Page 5
Rajeshwari R , Dr. B. Manoj Kumar : Evaluation of Intermittent Water Supply System and Design of 24x7 for a residential area in Mysore, Karnataka, India
www.ijifr.com Email: [email protected] © IJIFR 2014 This paper is available online at - http://www.ijifr.com/searchjournal.aspx
PAPER ID: IJIFR/V1/E11/038
ISSN (Online): 2347-1697
INTERNATIONAL JOURNAL OF INFORMATIVE & FUTURISTIC RESEARCH
Volume -1 Issue -11, July 2014 Author’s Research Area: Water Engineering, Page No. 163-173
16
7
16
7
Peak factor - As per CPHEEO [7] a peak factor is to be 2 to 3,which varies according with the
population. In the present study peak factor was calculated by monitoring the time required for the
completely filled Service level reservoir to get completely empty which was carried out for one week
and calculated as 1.25 with 4 hours of supply.
Residual pressure and minimum pipe size - The minimum and maximum residual pressures are kept at
7m and 20m respectively. The minimum pipe size adoptedis 90 mm, 6KSC, PVC pipes.
Elevation of the Reservoir - The staging height off the existing reservoir is 15m.
3.2 Population Forecast
The projection of future population has been made taking into account the pattern of growth in the
previous decades. The previous population for 5 decades (from 1971 to 2011) is presented in table
3.1, which shows that an average of 27% growth per decade is seen.
Table 3.1 Population data
SI No. Year Population
(Persons)
Growth Rate per Decade %
1 1971 355685 40
2 1981 476446 33.95
3 1991 605789 27.15
4 2001 799228 31.93
5 2011 938386 14.83
Average Percentage growth 26.97 = 27
Source: Statistical Department Mysore [9].
The projected population for the project design year 2044 is calculated using different methods such
as arithematic progression, geometeric progression, incremental increase and the details are presented
in table 3.2
Table 3.2 Projected Population for Design Period
SI No. Method
Projected population for
year 2044
1 Arithematic Progression Method 14,19, 113
2 Geometeric Increase Method 17,22,131
3 Incremental Increase Method 14,62,619
By considering geometeric increase method the projected population for the design period year 2044
is 17,22,131 which is 1.8 times more over the present population (2011).
Page 6
Rajeshwari R , Dr. B. Manoj Kumar : Evaluation of Intermittent Water Supply System and Design of 24x7 for a residential area in Mysore, Karnataka, India
www.ijifr.com Email: [email protected] © IJIFR 2014 This paper is available online at - http://www.ijifr.com/searchjournal.aspx
PAPER ID: IJIFR/V1/E11/038
ISSN (Online): 2347-1697
INTERNATIONAL JOURNAL OF INFORMATIVE & FUTURISTIC RESEARCH
Volume -1 Issue -11, July 2014 Author’s Research Area: Water Engineering, Page No. 163-173
16
8
16
8
3.3 Water quality analysis Results
Water quality analysis was being done in three phases (P1, P2, and P3) for Dead end, Low elevation
and High elevation nodes, the results are being tabulated in table 3.3, 3.4 and 3.5 below.
Table 3.3 Water quality analysis for Dead End Nodes
Nodes Drinking
Water
Std.
Values
29 113 108 124 101
P1 P2 P3 P1 P2 P3 P1 P2 P3 P1 P2 P3 P1 P2 P3
pH 7 – 8.5 7.24 7.72 7.60 7.34 7.52 7.22 7.31 7.68 7.15 7.28 7.78 7.20 7.26 7.50 7.18
Turbidity 1.5 – 10
NTU 2 6 6 4 7 6 4 6 5.5 3 5 6 2 5 5
Residual
Chlorine
0.2-1
mg/L 0.13 BDL 0.18 0.42 BDL 0.2 0.39 BDL 0.16 0.21 BDL 0.29 0.10 BDL 0.35
Hardness
<300
mg/L as
Caco3
160 252 248 200 288 264 210 265 248 180 276 231 140 270 240
Sulphate 200-400
mg/L 14.5 0.43 0.34 4.23 0.34 0.22 12.23 0.39 0.30 9.69 0.41 0.39 10.87 0.45 0.48
Nitrate <45
mg/L 0.65 0.68 0.68 0.58 0.31 0.23 0.45 0.52 0.30 0.55 0.46 0.36 0.69 0.38 0.52
Iron 0.3-1
mg/L 0.019 0.012 0.018 0.024 0.025 0.020 0.038 0.018 0.028 0.035 0.027 0.032 0.021 0.014 0.042
Fluoride 1-1.5
mg/L 0.2 0.13 0.16 0.1 0.23 0.11 0.2 0.32 0.16 0.4 0.19 0.13 0.2 0.28 0.19
TDS
500-
2000
mg/L
400 280 310 200 360 310 250 320 260 300 410 400 230 500 380
Chloride
200-
1000
mg/L
31.4 35.98 35.63 34.28 31.99 39.81 40.80 38.6 34.40 37.22 32.3 33.66 31.09 30.28 42.91
MPN 0 /100
mL 240 210 21 120 240 15 150 460 28 210 1100 11 460 >1100 9
Table 3.4 Water quality analysis for Low Elevation Nodes
Nodes Drinking
Water
Std.
Values
250 214 242 166 44
P1 P2 P3 P1 P2 P3 P1 P2 P3 P1 P2 P3 P1 P2 P3
pH 7 – 8.5 7.44 7.7 7.62 7.00 7.64 7.71 7.23 7.71 7.89 7.18 7.68 7.71 7.23 7.66 7.26
Turbidity 1.5 – 10
NTU 6 4 5 5 5 4 5 4 5 5 6 4 4 7 5
Residual
Chlorine
0.2-1
mg/L 0.56 BDL 0.2 0.99 BDL 0.16 1.2 BDL 0.16 1.0 BDL 0.1 1.1 BDL 0.18
Hardness
<300
mg/L as
Caco3
210 428 411 450 460 410 460 410 380 320 320 310 260 380 380
Sulphate 200-400 4.47 7.33 30.65 30.91 7.37 17.82 45.52 7.92 11.08 6.42 6.99 7.11 2.02 7.28 15.22
Page 7
Rajeshwari R , Dr. B. Manoj Kumar : Evaluation of Intermittent Water Supply System and Design of 24x7 for a residential area in Mysore, Karnataka, India
www.ijifr.com Email: [email protected] © IJIFR 2014 This paper is available online at - http://www.ijifr.com/searchjournal.aspx
PAPER ID: IJIFR/V1/E11/038
ISSN (Online): 2347-1697
INTERNATIONAL JOURNAL OF INFORMATIVE & FUTURISTIC RESEARCH
Volume -1 Issue -11, July 2014 Author’s Research Area: Water Engineering, Page No. 163-173
16
9
16
9
mg/L
Nitrate <45
mg/L 0.93 0.53 0.23 0.25 2.49 0.49 0.17 2.26 0.26 2.74 2.01 0.2 1.2 1.98 1.11
Iron 0.3-1
mg/L 0.32 0.193 0.18 0.25 0.66 0.099 0.26 0.082 0.11 0.31 0.10 0.079 0.27 0.099 0.098
Fluoride 1-1.5
mg/L 1.0 1.89 1.23 0.68 2.0 1.82 1.01 2.12 1.25 1.3 2.1 1.32 0.99 2.52 1.31
TDS
500-
2000
mg/L
500 510 430 350 440 510 300 580 440 320 420 380 290 410 370
Chloride
200-
1000
mg/L
34.98 39.98 40.05 29.99 69.97 44.98 31.9 42.62 46.77 27.9 52.63 46.02 30.08 40.12 45.98
MPN 0 /100
mL 120 460 210 43 110 150 93 240 210 64 460 240 75 >1100 210
Table 3.5 Water quality analysis for High Elevation Nodes
Nodes Drinking
Water
Std.
Values
79 34 230 246 158
P1 P2 P3 P1 P2 P3 P1 P2 P3 P1 P2 P3 P1 P2 P3
pH 7 – 8.5 8.14 7.81 7.62 8.13 7.79 7.59 8.14 7.86 7.76 8.13 7.75 7.32 8.08 7.72 7.41
Turbidity 1.5 – 10
NTU 6 6 6 6.7 6 6 6.5 5 5 6.3 6 6 6.5 6 5
Residual
Chlorine
0.2-1
mg/L 0.56 BDL 0.36 0.85 BDL 0.65 0.13 BDL 0.4 0.79 BDL 0.39 0.28 BDL 0.28
Hardness
<300
mg/L as
Caco3
460 140 200 430 175 210 440 166 200 450 152 280 410 147 278
Sulphate 200-400
mg/L 30.68 0.35 0.59 33.57 0.46 0.78 33.57 0.42 0.65 38.26 0.39 0.93 33.57 0.32 0.71
Nitrate <45
mg/L 0.88 0.44 0.32 1.21 0.32 0.27 1.38 0.29 0.35 1.51 0.56 0.41 1.42 0.47 0.42
Iron 0.3-1
mg/L 0.067 0.032 0.041 0.073 0.027 0.044 0.079 0.035 0.058 0.049 0.041 0.038 0.055 0.038 0.040
Fluoride 1-1.5
mg/L 0.6 BDL BDL 0.8 0.21 0.21 0.54 0.23 0.23 0.69 BDL 0.21 0.97 0.36 BDL
TDS
500-
2000
mg/L
410 380 390 400 320 375 380 260 300 360 310 310 400 340 380
Chloride
200-
1000
mg/L
31.9 31.99 40.15 34.12 42.02 38.72 30.08 32.63 41.25 32.11 43.25 36.62 31.99 38.72 36.77
MPN 0 /100
mL 210 210 20 240 240 21 1100 460 28 210 150 28 240 210 28
The results clearly show that Residual chlorine and MPN are interdependent variables, Also it shows
that amount of chlorine added for the purpose of disinfection in Phase 2 (during summer) is not at
detected and the required level of disinfection is not at all reached thus, resulting in consumer Dis-
satisfaction. Other Parameters vary significantly within the desired limits is because of water age [5],
pipe material [10] etc.
Page 8
Rajeshwari R , Dr. B. Manoj Kumar : Evaluation of Intermittent Water Supply System and Design of 24x7 for a residential area in Mysore, Karnataka, India
www.ijifr.com Email: [email protected] © IJIFR 2014 This paper is available online at - http://www.ijifr.com/searchjournal.aspx
PAPER ID: IJIFR/V1/E11/038
ISSN (Online): 2347-1697
INTERNATIONAL JOURNAL OF INFORMATIVE & FUTURISTIC RESEARCH
Volume -1 Issue -11, July 2014 Author’s Research Area: Water Engineering, Page No. 163-173
17
0
17
0
3.4 Water Demand calculations
After collecting the Key plan of DMA 6300 from Urban Water Supply and Sewerage Board, reduced
level for each node was calculated using Interpolation Method [11], survey was done to determine the
number of connections per each pipe line and number of houses, commercial buildings, institutions,
recreational centers and health care facilities prevailing was determined and the results are tabulated
below in Table 3.6. Further, Based upon the survey conducted Water Demand for DM 6300 at full
occupied period by 2044 was calculated and is as tabulated in the below Table 3.7.
Table 3.6 Survey results
Sl No. Details Numbers
1 Number of houses 2507 Houses
Ground floor 1050 Houses
Ground + First Floor 1074 Houses
Duplex Houses 230 Houses
No. of Empty sites 291 Sites
No. of Constructions 50 ongoing constructions
No. of Apartments 6 with 243 units
2 Number of Commercial Buildings 126 Units
3 Number of Institutions 16
4 Number of Recreational centers 30
Table 3.7 Water demand calculations
Sl
No. Demand Numbers No. of Persons
Per capita supply
(lpcd)
Total demand
(liters)
1 Ground floor houses 1,050 5persons/house 135 7,08,750
2 Ground+ floor
houses 1,074 5persons/house 135 7,24,950
3 Duplex houses 230 6persons/house 135 1,86,300
4 Institutions 16 5,275 students 45 2,37,375
5 Restaurants 7 175 customers 70 12,250
6 Hospitals 5 700 patients 340 2,38,000
7 Constructions 50 6persons/house 135 40,500
8 Apartments 6 with 243 units 5persons/house 135 1,64,025
9 Vacant Sites 252
5persons/house 135 1,70,100
Total 24,82,250
The present population is supplied with a water supply rate of 110 lpcd, for the projected continuous
supply considered is 135 lpcd and as per CPHEEO [7] the supply rate for institutions in case of
continuous supply is 45 lpcd, Restaurants is 70 lpcd, hospitals is 340 lpcd, Constructions, Apartments
and vacant sites it is 135 lpcd. At present newly constructed 15 Lakh liters capacity service level
reservoir is in operation, hence for 24x7 water supply scheme the tank could be filled twice as per the
above calculated demand requirements.
3.5 Verification of existing water supply network for the present demand
The DMA 6300 is divided into part 1 and part 2 for the purpose of the water distribution due to
variation of reduced level. The Lower elevation i.e., part 1 is provided with water supply all at once
Page 9
Rajeshwari R , Dr. B. Manoj Kumar : Evaluation of Intermittent Water Supply System and Design of 24x7 for a residential area in Mysore, Karnataka, India
www.ijifr.com Email: [email protected] © IJIFR 2014 This paper is available online at - http://www.ijifr.com/searchjournal.aspx
PAPER ID: IJIFR/V1/E11/038
ISSN (Online): 2347-1697
INTERNATIONAL JOURNAL OF INFORMATIVE & FUTURISTIC RESEARCH
Volume -1 Issue -11, July 2014 Author’s Research Area: Water Engineering, Page No. 163-173
17
1
17
1
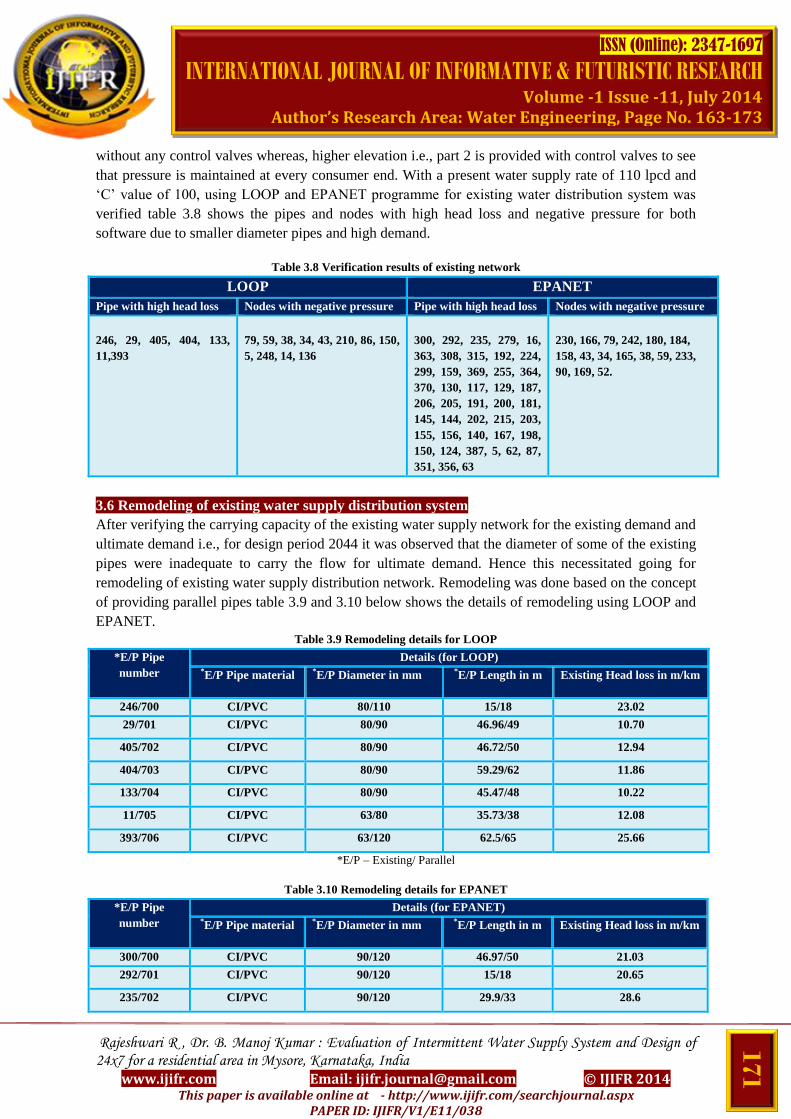
without any control valves whereas, higher elevation i.e., part 2 is provided with control valves to see
that pressure is maintained at every consumer end. With a present water supply rate of 110 lpcd and
‘C’ value of 100, using LOOP and EPANET programme for existing water distribution system was
verified table 3.8 shows the pipes and nodes with high head loss and negative pressure for both
software due to smaller diameter pipes and high demand.
Table 3.8 Verification results of existing network
LOOP EPANET
Pipe with high head loss Nodes with negative pressure Pipe with high head loss Nodes with negative pressure
246, 29, 405, 404, 133,
11,393
79, 59, 38, 34, 43, 210, 86, 150,
5, 248, 14, 136
300, 292, 235, 279, 16,
363, 308, 315, 192, 224,
299, 159, 369, 255, 364,
370, 130, 117, 129, 187,
206, 205, 191, 200, 181,
145, 144, 202, 215, 203,
155, 156, 140, 167, 198,
150, 124, 387, 5, 62, 87,
351, 356, 63
230, 166, 79, 242, 180, 184,
158, 43, 34, 165, 38, 59, 233,
90, 169, 52.
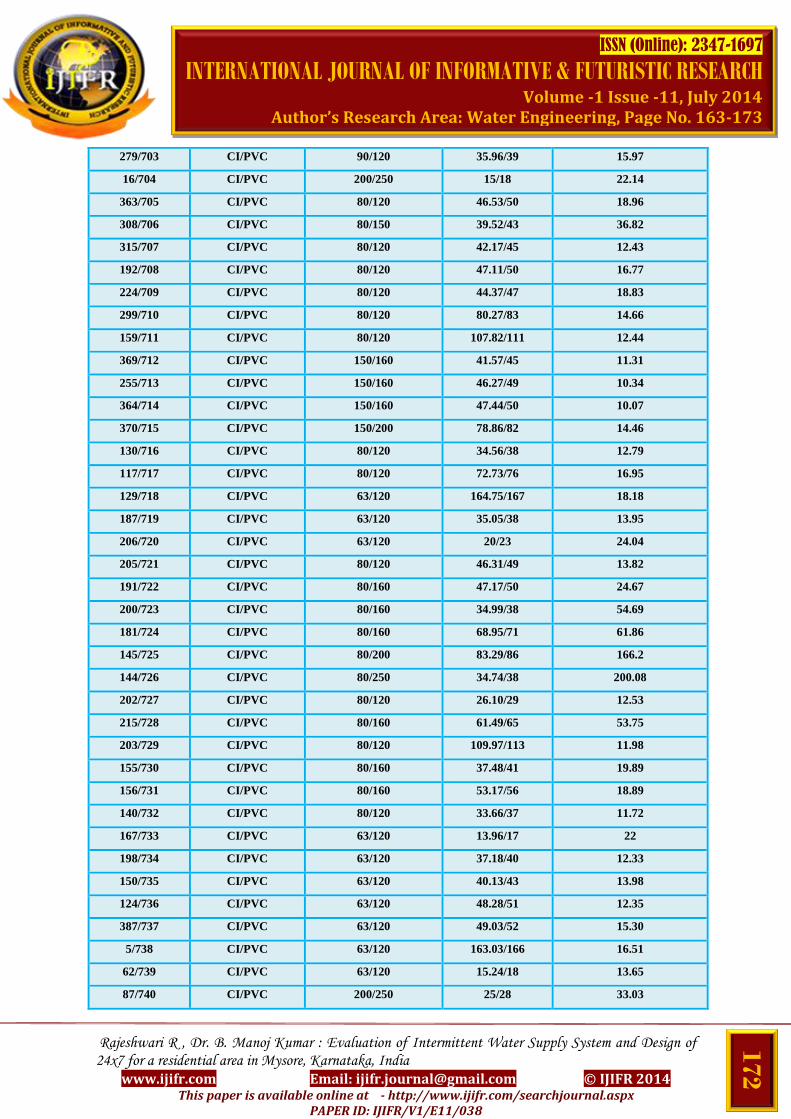
3.6 Remodeling of existing water supply distribution system
After verifying the carrying capacity of the existing water supply network for the existing demand and
ultimate demand i.e., for design period 2044 it was observed that the diameter of some of the existing
pipes were inadequate to carry the flow for ultimate demand. Hence this necessitated going for
remodeling of existing water supply distribution network. Remodeling was done based on the concept
of providing parallel pipes table 3.9 and 3.10 below shows the details of remodeling using LOOP and
EPANET.
Table 3.9 Remodeling details for LOOP
*E/P Pipe
number
Details (for LOOP) *E/P Pipe material *E/P Diameter in mm *E/P Length in m Existing Head loss in m/km
246/700 CI/PVC 80/110 15/18 23.02
29/701 CI/PVC 80/90 46.96/49 10.70
405/702 CI/PVC 80/90 46.72/50 12.94
404/703 CI/PVC 80/90 59.29/62 11.86
133/704 CI/PVC 80/90 45.47/48 10.22
11/705 CI/PVC 63/80 35.73/38 12.08
393/706 CI/PVC 63/120 62.5/65 25.66
*E/P – Existing/ Parallel
Table 3.10 Remodeling details for EPANET
*E/P Pipe
number
Details (for EPANET) *E/P Pipe material *E/P Diameter in mm *E/P Length in m Existing Head loss in m/km
300/700 CI/PVC 90/120 46.97/50 21.03
292/701 CI/PVC 90/120 15/18 20.65
235/702 CI/PVC 90/120 29.9/33 28.6
Page 10
Rajeshwari R , Dr. B. Manoj Kumar : Evaluation of Intermittent Water Supply System and Design of 24x7 for a residential area in Mysore, Karnataka, India
www.ijifr.com Email: [email protected] © IJIFR 2014 This paper is available online at - http://www.ijifr.com/searchjournal.aspx
PAPER ID: IJIFR/V1/E11/038
ISSN (Online): 2347-1697
INTERNATIONAL JOURNAL OF INFORMATIVE & FUTURISTIC RESEARCH
Volume -1 Issue -11, July 2014 Author’s Research Area: Water Engineering, Page No. 163-173
17
2
17
2
279/703 CI/PVC 90/120 35.96/39 15.97
16/704 CI/PVC 200/250 15/18 22.14
363/705 CI/PVC 80/120 46.53/50 18.96
308/706 CI/PVC 80/150 39.52/43 36.82
315/707 CI/PVC 80/120 42.17/45 12.43
192/708 CI/PVC 80/120 47.11/50 16.77
224/709 CI/PVC 80/120 44.37/47 18.83
299/710 CI/PVC 80/120 80.27/83 14.66
159/711 CI/PVC 80/120 107.82/111 12.44
369/712 CI/PVC 150/160 41.57/45 11.31
255/713 CI/PVC 150/160 46.27/49 10.34
364/714 CI/PVC 150/160 47.44/50 10.07
370/715 CI/PVC 150/200 78.86/82 14.46
130/716 CI/PVC 80/120 34.56/38 12.79
117/717 CI/PVC 80/120 72.73/76 16.95
129/718 CI/PVC 63/120 164.75/167 18.18
187/719 CI/PVC 63/120 35.05/38 13.95
206/720 CI/PVC 63/120 20/23 24.04
205/721 CI/PVC 80/120 46.31/49 13.82
191/722 CI/PVC 80/160 47.17/50 24.67
200/723 CI/PVC 80/160 34.99/38 54.69
181/724 CI/PVC 80/160 68.95/71 61.86
145/725 CI/PVC 80/200 83.29/86 166.2
144/726 CI/PVC 80/250 34.74/38 200.08
202/727 CI/PVC 80/120 26.10/29 12.53
215/728 CI/PVC 80/160 61.49/65 53.75
203/729 CI/PVC 80/120 109.97/113 11.98
155/730 CI/PVC 80/160 37.48/41 19.89
156/731 CI/PVC 80/160 53.17/56 18.89
140/732 CI/PVC 80/120 33.66/37 11.72
167/733 CI/PVC 63/120 13.96/17 22
198/734 CI/PVC 63/120 37.18/40 12.33
150/735 CI/PVC 63/120 40.13/43 13.98
124/736 CI/PVC 63/120 48.28/51 12.35
387/737 CI/PVC 63/120 49.03/52 15.30
5/738 CI/PVC 63/120 163.03/166 16.51
62/739 CI/PVC 63/120 15.24/18 13.65
87/740 CI/PVC 200/250 25/28 33.03
Page 11
Rajeshwari R , Dr. B. Manoj Kumar : Evaluation of Intermittent Water Supply System and Design of 24x7 for a residential area in Mysore, Karnataka, India
www.ijifr.com Email: [email protected] © IJIFR 2014 This paper is available online at - http://www.ijifr.com/searchjournal.aspx
PAPER ID: IJIFR/V1/E11/038
ISSN (Online): 2347-1697
INTERNATIONAL JOURNAL OF INFORMATIVE & FUTURISTIC RESEARCH
Volume -1 Issue -11, July 2014 Author’s Research Area: Water Engineering, Page No. 163-173
17
3
17
3
351/741 CI/PVC 80/120 43.26/46 10.10
356/742 CI/PVC 80/120 5/8 13.87
63/743 CI/PVC 80/120 34.87/38 10.38
4 Conclusions
Finally based on the study carried out following conclusions were drawn;
Characterization results showed that there was a prominent factor prevailing in the existing
supply network that was responsible for the unacceptable water quality resulting in high MPN
count.
The residual chlorine was not sufficient during the summer periods as the analysis results
during March-April 2014 were below detectable levels and thus, showed that proper
quantification of the disinfectant is to be done before adding so as to ensure safe drinking for
consumers.
The simulation results showed that there were some low pressure nodal points prevailing and
also high head loss had occurred network which had to be provided with parallel pipes to
solve the problem and provide continuous water supply system.
Peak factor determination was done for a period of one week, where it was found 1.25 but as
per CPHEEO for 4 hours supply it should be 3 in case of existing system
At present newly constructed service level reservoir is constructed and being put into work of
15 Lakh liters capacity however, for continuous supply scheme the tank has to be filled twice
as per the water demand calculation as per the survey done which resulted in the value of 24,
82, 250 Liters per day.
The remodeling option adapted here is by providing parallel pipes which seems more
economical when compared to laying new pipes entirely in the DMA 6300.
5 References
[1] R.M. Clark, W. M. Grayman and R.M. Males, “Contamination Propagation in Distribution Systems”,
Journal of Environmental Engineering, 144(4), pp 929-943, 1988.
[2] Y. Brian, “Design of Branched water supply network on uneven Terrain”, Journal of Environmental
Engineering” 120(2), pp 974-980, 1994.
[3] Bureau of Indian standards for Poly Vinyl Chlorides pipes 4985/2001.
[4] B. Namrata Patil and Dr. W. N. Deulkar, “Quality Management of water supplies under 24x7 schemes,
At sector no. 21, PCMC, Pune”, Journal of Engineering Research and applications, 3(4), pp 1965-
1971, 2013.
[5] Hossein Shamsaei, Othman Jaafar and Noor Ezlin Ahmad Basri, “Effects Residence Time to Water
Quality in Large Water Distribution Systems”, Journal of Scientific Research, 1(5), pp 449-457, 2013.
[6] A Saminu, Abubakar, Nasiru and L Sagir, “Design of NDA Water Distribution Network using
EPANET”, Journal of Emerging Science and Technology, 1(9), pp 1-5, 2013.
[7] CPHEEO (Central Public Health Environmental Engineering Organization), “Manual on Water supply
and Treatment”, Ministry of Urban Development, New Delhi, 1999.
[8] P.R. Bhave, “Rapid Convergence in Hardy cross Method of Network Analysis”, Journal of IWWA,
XVI(1), pp 1-5, 1985.
[9] District Statistical department, Mysore.
[10] Bureau of Indian Standards for Ductile Iron Pipes 8329/2000.
[11] Dr. H. Ramesh, L.Santhosh and C. J Jagadeesh, “Simulation of Hydraulic Parameters in Water
Distribution Network using EPANET and GIS”, International conference on Ecological, Environmental
and Biological Sciences, Jan 7-8, Dubai, 2012


![International Journal of Informative & Futuristic Research …ijifr.com/pdfsave/02-06-2016771V3-E9-063.pdfThe virtual topology design problem is known to be NP-hard [4], [5]. A survey](https://static.documents.pub/doc/80x56/5fef276f21786d11e7244456/international-journal-of-informative-futuristic-research-ijifrcompdfsave02-06-2016771v3-e9-063pdf.jpg)


