Impact of Sequestration on Federal Education Programs The funding cut is equivalent to eliminating educational services as well as eliminating or reducing financial aid for this number of students attending pre-K, elementary, secondary, and postsecondary schools 5.8 7.4 million million 49,365 $38 $40 $42 $44 $46 $48 '04 (billions) F I S C A L Y E A R 2 0 1 3 $3 billion FUNDING CUT* STUDENTS AFFECTED* The funding cut could lead to the elimination of this number of jobs, which includes preK-12 and postsecondary educators, administrative and support staff, and all other specialists POTENTIAL JOB LOSSES* '13 36% The additional number of students enrolled (public preK-12 and all postsecondary) today than in 2004: The rise in costs in providing public K-12 services since 2004: U.S. Department of Education (plus Head Start) Sequestration would roll back Education Department funding** below the level in 2004 As a result of the "fiscal cliff" deal (American Taxpayer Relief Act of 2012) reached at the beginning of the year, sequestration, or automatic, across-the-board budget cuts, was postponed by two months. Absent any agreement to replace sequestration, budget cuts will be uniformly applied to almost all federal programs beginning on March 1, 2013. Due to the delay, however, the total amount of the cut in fiscal year 2013 has been lessened by $24 billion, from $109.3 billion to $85.3 billion. An analysis by the Center on Budget and Policy Priorities (CBPP) indicates that nonexempt, nondefense discretionary programs would be cut by 5.1 percent; and a cut of 5.3 percent would be applied to nonexempt, nondefense mandatory programs. Since Congress has not yet completed work on appropriations for fiscal year 2013, the estimated cuts by education program presented here assume the same rate of operations as in fiscal year 2012. Actual cuts could differ once appropriations are enacted for 2013. * Totals include Head Start. ** Total discretionary funding excluding Pell Grants. Source: NEA calculations using federal agency budget data and based on an analysis by the Center on Budget and Policy Priorities, Here's How the March 1 Sequester Would Work, January 22, 2013. For more information, contact Tom Zembar at 202.822.7109 or [email protected]. As of February 5, 2013.
Transcript
Impact of Sequestration on Federal Education Programs
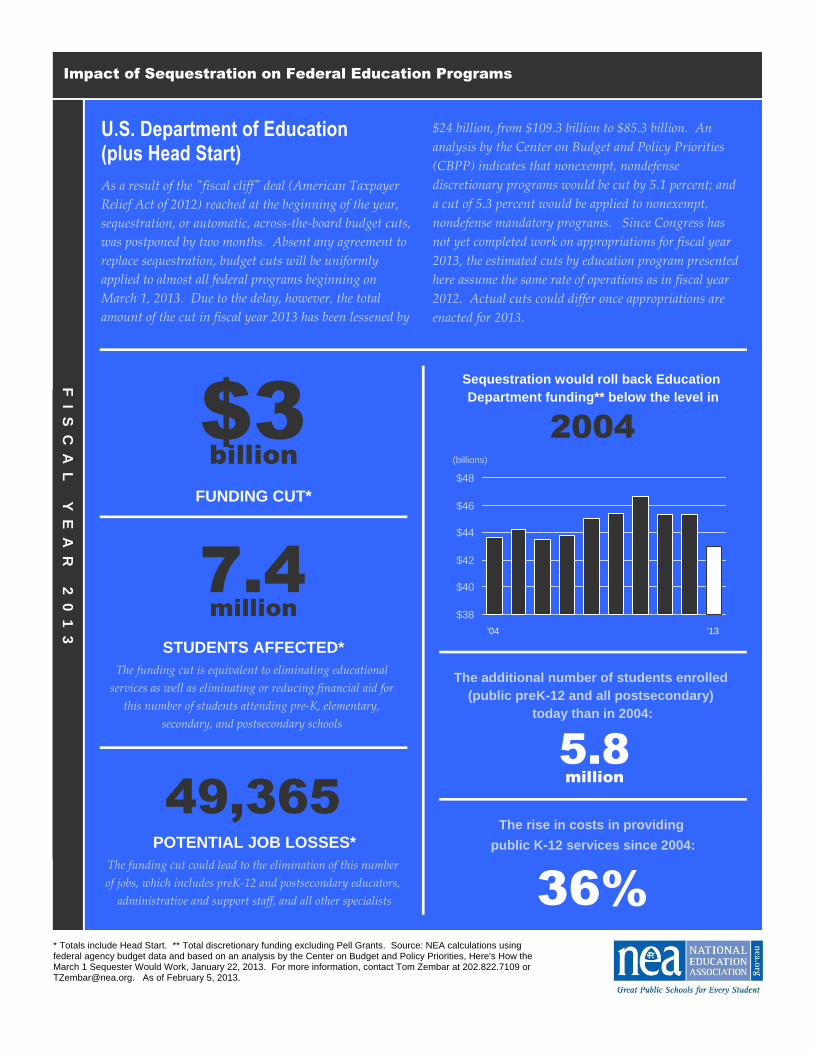
The funding cut is equivalent to eliminating educational
services as well as eliminating or reducing financial aid for
this number of students attending pre-K, elementary,
secondary, and postsecondary schools
5.8
7.4
million
million
49,365
$38
$40
$42
$44
$46
$48
'04
(billions)
F I S C A
L Y E A R
2 0 1 3
$3billion
FUNDING CUT*
STUDENTS AFFECTED*
The funding cut could lead to the elimination of this number
of jobs, which includes preK-12 and postsecondary educators,
administrative and support staff, and all other specialists
POTENTIAL JOB LOSSES*
'13
36%
The additional number of students enrolled (public preK-12 and all postsecondary)
today than in 2004:
The rise in costs in providing public K-12 services since 2004:
U.S. Department of Education (plus Head Start)
Sequestration would roll back Education Department funding** below the level in
2004
As a result of the "fiscal cliff" deal (American Taxpayer
Relief Act of 2012) reached at the beginning of the year,
sequestration, or automatic, across-the-board budget cuts,
was postponed by two months. Absent any agreement to
replace sequestration, budget cuts will be uniformly
applied to almost all federal programs beginning on
March 1, 2013. Due to the delay, however, the total
amount of the cut in fiscal year 2013 has been lessened by
$24 billion, from $109.3 billion to $85.3 billion. An
analysis by the Center on Budget and Policy Priorities
(CBPP) indicates that nonexempt, nondefense
discretionary programs would be cut by 5.1 percent; and
a cut of 5.3 percent would be applied to nonexempt,
nondefense mandatory programs. Since Congress has
not yet completed work on appropriations for fiscal year
2013, the estimated cuts by education program presented
here assume the same rate of operations as in fiscal year
2012. Actual cuts could differ once appropriations are
enacted for 2013.
* Totals include Head Start. ** Total discretionary funding excluding Pell Grants. Source: NEA calculations using federal agency budget data and based on an analysis by the Center on Budget and Policy Priorities, Here's How the March 1 Sequester Would Work, January 22, 2013. For more information, contact Tom Zembar at 202.822.7109 or [email protected]. As of February 5, 2013.
Impact of Sequestration on Federal Education Programs
U.S. Department of Education ProgramsElementary & Secondary Education
Grants to Local Educational Agencies (ESEA Title I, Part A) $740.3 1,181,600 9,910School Improvement State Grants (ESEA section 1003(g)) 27.2 41,600 350State Agency Programs: Migrant (ESEA I-C) and Neglected & Delinquent (ESEA I-D) 22.6 26,600 300Impact Aid Basic Support Payments (ESEA VIII section 8003(b)) 58.8 48,500 810Improving Teacher Quality State Grants (ESEA II, Part A) 125.8 --- 1,63021st Century Community Learning Centers (ESEA IV-B) 58.7 85,500 1,210Education for Homeless Children and Youths (MVHAA Title VII-B) 3.3 45,200 45Rural Education (ESEA VI-B) 9.1 272,100 130English Language Acquisition (ESEA III, Part A) 37.3 209,800 450All Other Elementary & Secondary Education 152.1 141,500 1,910
Special Education Grants to States (IDEA-B-611) 590.5 296,400 7,810Preschool grants (IDEA-B-619) 19.0 38,100 250Grants for infants and families (IDEA-C) 22.6 18,200 300All Other Special Education 12.6 --- 160
Subtotal, Special Education 644.7 352,700 8,520
Rehabilitation Services and Disability Research
Vocational Rehabilitation State Grants (RA Title I-A and Title I-C) 171.2 55,700 1,010All Other Rehabilitation Services and Disability Research 30.9 10,300 390
Subtotal, Rehabilitation Services and Disability Research 202.1 66,000 1,400
Career, Technical, and Adult Education
Career and Technical Education State Grants (Carl D. Perkins CTEA Title I) 57.3 624,400 760Adult Basic and Literacy Education State Grants (AEFLA and WIA section 503) 30.3 127,900 450All Other Career, Technical, and Adult Education 1.0 --- 15
Subtotal, Career, Technical, and Adult Education 88.6 752,300 1,225
Federal Student Financial Assistance
Federal Pell Grants (HEA IV-A-1) exempt --- ---Federal Supplemental Educational Opportunity Grants (HEA IV-A-3) 37.5 1,389,900 340Federal Work-Study (HEA IV-C) 49.8 683,000 450Federal Direct Student Loan Program (HEA IV-D) 63.5 --- ---All Other Federal Student Financial Assistance 1.3 48,300 10
Subtotal, Federal Student Financial Assistance 152.0 2,121,200 ** 800
Higher Education
Federal TRIO Programs (HEA IV-A-2, Chapter 1) 42.8 40,900 410All Other Higher Education 88.2 1,928,600 790
Institute of Education Sciences 30.3 --- 180Departmental Management 103.8 --- 330
Total, U.S. Department of Education Programs $2,587.9 7,314,100 ** 30,400
Other Federal Education-Related Programs
Head Start (HSA section 639 ) 406.4 48,600 18,965
Total, Federal Education-Related Programs $2,994.3 7,362,700 ** 49,365
*Rounded estimates. ** Totals may include some duplication. Some students may receive services under more than one program.For more information, contact Tom Zembar at 202.822.7109 or [email protected]. As of February 5, 2013.
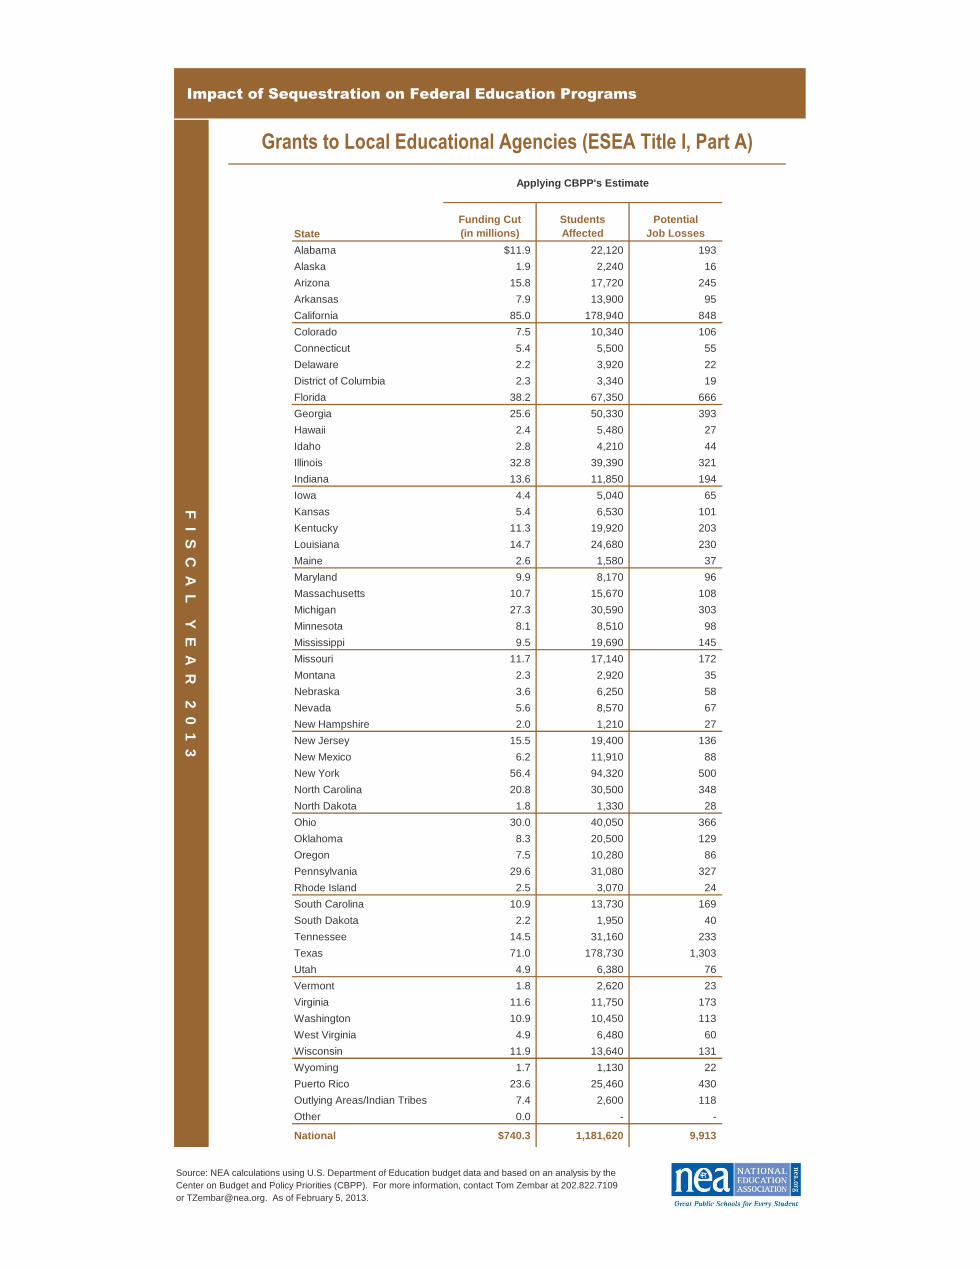
Program
Applying CBPP's Estimate
Funding Cut (in millions)*
Students Affected*
Potential Job Losses*
For more information, contact Tom Zembar at 202.822.7109 or [email protected]. As of February 5, 2013.
Impact of Sequestration on Federal Education Programs
F I S C A
L Y E A R
2 0 1 3
General Notes on "Students Affected"
To derive the number of students affected, NEA first
collected data on the number of students currently
receiving services by state. Since it is not possible to
know precisely how states, districts, and even schools
would implement cuts in federal funding, NEA
calculates an "equivalency" to isolate the number of
students whose services would be eliminated as a result
of sequestration in order to illustrate its impact. From
the number of students currently being served by state,
NEA calculated an average cost per student (per state).
NEA then applied this average cost per student to the
state's reduced funding level, post-sequestration, to
identify the number of students that would remain
unserved due to less funding.
General Notes on "Potential Job Losses"
To derive the number of potential K-12 job losses,
NEA used data by state from the U.S. Census and
NEA Research on current expenditures; salaries,
wages, and benefits; and the number of full-time
equivalent (FTE) employees. NEA calculated the
percentage of current expenditures represented by
salaries, wages, and benefits by state; and, an
average cost per FTE employee by state. NEA
applied the results from both calculations to
determine by state the potential number of jobs that
could be lost from sequestration; and, then
aggregated the losses by state for a national total.
The exception to this approach was for federal student
financial assistance programs. NEA assumed that all
students currently receiving aid would be affected to
varying degrees by any reduction in federal support.
A similar approach was taken for determining the
potential loss of early childhood and postsecondary
jobs, as well as those from other providers, such as
community-based organizations. Sources for the
various data sets include the National Center for
Education Statistics, Office of Head Start, Bureau
of Labor Statistics, and the Government
Accountability Office (GAO). Data for
determining potential job losses at the U.S.
Department of Education was drawn from the
agency's FY 2013 Justifications of Appropriation
Estimates to the Congress. Potential job losses
reflect the mix of jobs specific to each program. For
example, job losses under career and technical
education reflect those at both high schools and
postsecondary schools based on state allocations to
each area.
The impetus for updating the set of tables made available
September 14, 2012 was the "fiscal cliff" deal and
passage of the American Taxpayer Relief Act, which
postponed the start of sequestration, or automatic
budget cuts, by two months and reduced the total
amount of the cuts should they occur. As a result, the
NEA has updated its estimates according to an analysis
of the fiscal cliff deal by the Center on Budget and Policy
Priorities. In addition, since the NEA's September 14th
analysis, the U.S. Department of Education has made
available updated state allocation and participation
estimates for selected programs, which the NEA has
incorporated here as well.
Revisions to the Set of Tables Released September 14, 2012
NEA's estimates reflect direct job losses only.
According to Dr. Lawrence Mishel of the Economic
Policy Institute, every 100,000 education jobs lost
translates into roughly 30,000 jobs lost in other
sectors due to reduced spending by schools and
those laid off.
Impact of Sequestration on Federal Education Programs
The funding cut is equivalent to eliminating extra
instructional services for this number of students
who are struggling academically, particularly
students attending high-poverty schools1.2
1.18
million
million
9,900
$10
$11
$12
$13
$14
$15
'08
(billions)
F I S C A
L Y E A R
2 0 1 3
$740million
FUNDING CUT
STUDENTS AFFECTED
The funding cut could lead to the elimination of this number
of jobs, which includes teachers, classroom aides, reading
specialists, and other support staff
POTENTIAL JOB LOSSES
'13
12%
The additional number of students receiving Title I services today than in 2008:
The rise in costs, on average, in providing Title I services since 2008:
Grants to Local Educational Agencies (ESEA Title I, Part A)
Sequestration would roll back funding below the level in
2008
As a result of the "fiscal cliff" deal (American Taxpayer
Relief Act of 2012) reached at the beginning of the year,
sequestration, or automatic, across-the-board budget cuts,
was postponed by two months. Absent any agreement to
replace sequestration, budget cuts will be uniformly
applied to almost all federal programs beginning on
March 1, 2013. Due to the delay, however, the total
amount of the cut in fiscal year 2013 has been lessened by
$24 billion, from $109.3 billion to $85.3 billion. An
analysis by the Center on Budget and Policy Priorities
(CBPP) indicates that nonexempt, nondefense
discretionary programs would be cut by 5.1 percent; and
a cut of 5.3 percent would be applied to nonexempt,
nondefense mandatory programs. Since Congress has
not yet completed work on appropriations for fiscal year
2013, the estimated cuts by education program presented
here assume the same rate of operations as in fiscal year
2012. Actual cuts could differ once appropriations are
enacted for 2013.
Source: NEA calculations using U.S. Department of Education budget data and based on an analysis by the Center on Budget and Policy Priorities, Here's How the March 1 Sequester Would Work, January 22, 2013. For more information, contact Tom Zembar at 202.822.7109 or [email protected]. As of February 5, 2013.
Impact of Sequestration on Federal Education Programs
Source: NEA calculations using U.S. Department of Education budget data and based on an analysis by theCenter on Budget and Policy Priorities (CBPP). For more information, contact Tom Zembar at 202.822.7109or [email protected]. As of February 5, 2013.
Applying CBPP's Estimate
F I S C A
L Y E A R
2 0 1 3
Grants to Local Educational Agencies (ESEA Title I, Part A)
Impact of Sequestration on Federal Education Programs
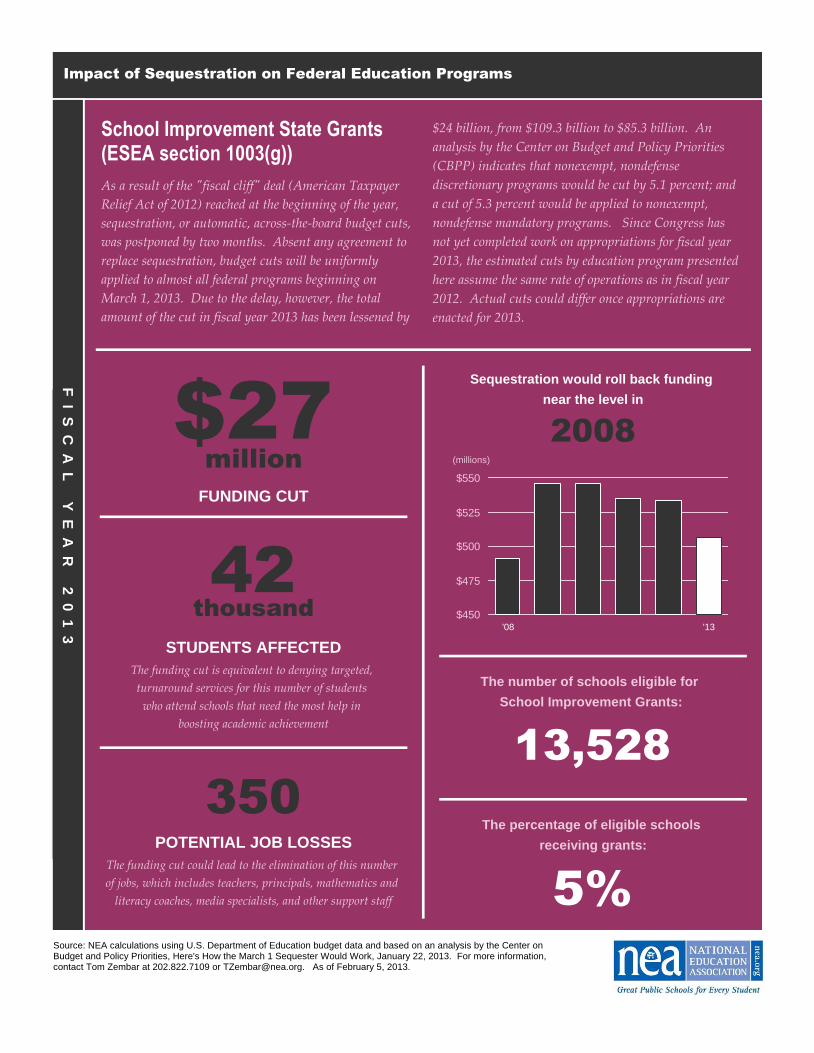
The funding cut is equivalent to denying targeted,
turnaround services for this number of students
who attend schools that need the most help in
boosting academic achievement
13,528
42thousand
350
$450
$475
$500
$525
$550
'08
(millions)
F I S C A
L Y E A R
2 0 1 3
$27million
FUNDING CUT
STUDENTS AFFECTED
The funding cut could lead to the elimination of this number
of jobs, which includes teachers, principals, mathematics and
literacy coaches, media specialists, and other support staff
POTENTIAL JOB LOSSES
'13
5%
The number of schools eligible for School Improvement Grants:
The percentage of eligible schools receiving grants:
School Improvement State Grants (ESEA section 1003(g))
Sequestration would roll back funding near the level in
2008
As a result of the "fiscal cliff" deal (American Taxpayer
Relief Act of 2012) reached at the beginning of the year,
sequestration, or automatic, across-the-board budget cuts,
was postponed by two months. Absent any agreement to
replace sequestration, budget cuts will be uniformly
applied to almost all federal programs beginning on
March 1, 2013. Due to the delay, however, the total
amount of the cut in fiscal year 2013 has been lessened by
$24 billion, from $109.3 billion to $85.3 billion. An
analysis by the Center on Budget and Policy Priorities
(CBPP) indicates that nonexempt, nondefense
discretionary programs would be cut by 5.1 percent; and
a cut of 5.3 percent would be applied to nonexempt,
nondefense mandatory programs. Since Congress has
not yet completed work on appropriations for fiscal year
2013, the estimated cuts by education program presented
here assume the same rate of operations as in fiscal year
2012. Actual cuts could differ once appropriations are
enacted for 2013.
Source: NEA calculations using U.S. Department of Education budget data and based on an analysis by the Center on Budget and Policy Priorities, Here's How the March 1 Sequester Would Work, January 22, 2013. For more information, contact Tom Zembar at 202.822.7109 or [email protected]. As of February 5, 2013.
Impact of Sequestration on Federal Education Programs
Source: NEA calculations using U.S. Department of Education budget data and based on an analysis by theCenter on Budget and Policy Priorities (CBPP). For more information, contact Tom Zembar at 202.822.7109or [email protected]. As of February 5, 2013.
Applying CBPP's Estimate
F I S C A
L Y E A R
2 0 1 3
School Improvement State Grants (ESEA section 1003(g))
Impact of Sequestration on Federal Education Programs
The funding cut is equivalent to eliminating services
for this number of students who are migratory,
attending community day programs, or in State-run
institutions and correctional facilities
27thousand
300
$350
$375
$400
'08
(millions)
F I S C A
L Y E A R
2 0 1 3
$23million
FUNDING CUT
STUDENTS AFFECTED
The funding cut could lead to the elimination of this number
of jobs, which includes teachers, reading specialists,
counselors, and other support staff
POTENTIAL JOB LOSSES
'13
Migrant (ESEA I-C) and Neglected & Delinquent (ESEA I-D)
Migrant (ESEA I-C)
$40
$44
$48
$52
'02
(millions)
'13
Neglected & Delinquent (ESEA I-D)
Sequestration would roll back funding below the level in
2008
Sequestration would roll back funding below the level in
2002
As a result of the "fiscal cliff" deal (American Taxpayer
Relief Act of 2012) reached at the beginning of the year,
sequestration, or automatic, across-the-board budget cuts,
was postponed by two months. Absent any agreement to
replace sequestration, budget cuts will be uniformly
applied to almost all federal programs beginning on
March 1, 2013. Due to the delay, however, the total
amount of the cut in fiscal year 2013 has been lessened by
$24 billion, from $109.3 billion to $85.3 billion. An
analysis by the Center on Budget and Policy Priorities
(CBPP) indicates that nonexempt, nondefense
discretionary programs would be cut by 5.1 percent; and
a cut of 5.3 percent would be applied to nonexempt,
nondefense mandatory programs. Since Congress has
not yet completed work on appropriations for fiscal year
2013, the estimated cuts by education program presented
here assume the same rate of operations as in fiscal year
2012. Actual cuts could differ once appropriations are
enacted for 2013.
Source: NEA calculations using U.S. Department of Education budget data and based on an analysis by the Center on Budget and Policy Priorities, Here's How the March 1 Sequester Would Work, January 22, 2013. For more information, contact Tom Zembar at 202.822.7109 or [email protected]. As of February 5, 2013.
Impact of Sequestration on Federal Education Programs
Source: NEA calculations using U.S. Department of Education budget data and based on an analysis by theCenter on Budget and Policy Priorities (CBPP). For more information, contact Tom Zembar at 202.822.7109or [email protected]. As of February 5, 2013.
Applying CBPP's Estimate
F I S C A
L Y E A R
2 0 1 3
Migrant (ESEA I-C) and Neglected & Delinquent (ESEA I-D) Programs
Impact of Sequestration on Federal Education Programs
The funding cut is equivalent to shifting the costs for
educating this number of students from the federal
government to local school districts
48thousand
800
$1.04
$1.08
$1.12
$1.16
'06
F I S C A
L Y E A R
2 0 1 3
$59million
FUNDING CUT
STUDENTS AFFECTED
The funding cut could lead to the elimination of this number
of jobs, which includes teachers, aides, technology and media
specialists, counselors, nurses, and other support staff
POTENTIAL JOB LOSSES
'13
22%
Impact Aid Basic Support Payments (ESEA VIII section 8003(b))
The rise in school general operating expenditures
since 2006:
Sequestration would roll back funding near the level in
2006(billions)
As a result of the "fiscal cliff" deal (American Taxpayer
Relief Act of 2012) reached at the beginning of the year,
sequestration, or automatic, across-the-board budget cuts,
was postponed by two months. Absent any agreement to
replace sequestration, budget cuts will be uniformly
applied to almost all federal programs beginning on
March 1, 2013. Due to the delay, however, the total
amount of the cut in fiscal year 2013 has been lessened by
$24 billion, from $109.3 billion to $85.3 billion. An
analysis by the Center on Budget and Policy Priorities
(CBPP) indicates that nonexempt, nondefense
discretionary programs would be cut by 5.1 percent; and
a cut of 5.3 percent would be applied to nonexempt,
nondefense mandatory programs. Since Congress has
not yet completed work on appropriations for fiscal year
2013, the estimated cuts by education program presented
here assume the same rate of operations as in fiscal year
2012. Actual cuts could differ once appropriations are
enacted for 2013.
Source: NEA calculations using U.S. Department of Education budget data and based on an analysis by the Center on Budget and Policy Priorities, Here's How the March 1 Sequester Would Work, January 22, 2013. For more information, contact Tom Zembar at 202.822.7109 or [email protected]. As of February 5, 2013.
$6.1billion
The shortfall in fully funding maximum payments since 2006:
Impact of Sequestration on Federal Education Programs
Source: NEA calculations using U.S. Department of Education budget data and based on an analysis by theCenter on Budget and Policy Priorities (CBPP). For more information, contact Tom Zembar at 202.822.7109or [email protected]. As of February 5, 2013.
Applying CBPP's Estimate
F I S C A
L Y E A R
2 0 1 3
Impact Aid Basic Support Payments (ESEA VIII, section 8003(b))
Impact of Sequestration on Federal Education Programs
95%
1,630
$2.00
$2.25
$2.50
$2.75
$3.00
'02
(billions)
F I S C A
L Y E A R
2 0 1 3
$126million
2,630
FUNDING CUT
TEACHERS UNHIRED TO REDUCE CLASS SIZE
The funding cut could lead to the elimination of this number
of jobs, which includes general and special education teachers,
and professional development coaches
POTENTIAL JOB LOSSES
'13
45%
The percentage of districts that receive Title II, Part A funds:
The percentage of Title II, Part A funds received by the highest-poverty districts:
Improving Teacher Quality State Grants (ESEA Title II, Part A)
The funding cut is equivalent to eliminating the option for
districts to hire this number of teachers to reduce class size,
particularly in grades K to 3 in large, high-poverty urban
schools as well as rural low-income schools
Sequestration would reduce funding to its lowest level
since inception in 2002:
As a result of the "fiscal cliff" deal (American Taxpayer
Relief Act of 2012) reached at the beginning of the year,
sequestration, or automatic, across-the-board budget cuts,
was postponed by two months. Absent any agreement to
replace sequestration, budget cuts will be uniformly
applied to almost all federal programs beginning on
March 1, 2013. Due to the delay, however, the total
amount of the cut in fiscal year 2013 has been lessened by
$24 billion, from $109.3 billion to $85.3 billion. An
analysis by the Center on Budget and Policy Priorities
(CBPP) indicates that nonexempt, nondefense
discretionary programs would be cut by 5.1 percent; and
a cut of 5.3 percent would be applied to nonexempt,
nondefense mandatory programs. Since Congress has
not yet completed work on appropriations for fiscal year
2013, the estimated cuts by education program presented
here assume the same rate of operations as in fiscal year
2012. Actual cuts could differ once appropriations are
enacted for 2013.
Source: NEA calculations using U.S. Department of Education budget data and based on an analysis by the Center on Budget and Policy Priorities, Here's How the March 1 Sequester Would Work, January 22, 2013. For more information, contact Tom Zembar at 202.822.7109 or [email protected]. As of February 5, 2013.
Impact of Sequestration on Federal Education Programs
StateFunding Cut
(in thousands)Teachers Unhired to Reduce Class Size*
* Assumes all of the funding cut would have been used for class size reduction.
Source: NEA calculations using U.S. Department of Education budget data and based on an analysis by theCenter on Budget and Policy Priorities (CBPP). For more information, contact Tom Zembar at 202.822.7109or [email protected]. As of February 5, 2013.
F I S C A
L Y E A R
2 0 1 3
Improving Teacher Quality State Grants (ESEA Title II, Part A)
Applying CBPP's Estimate
Impact of Sequestration on Federal Education Programs
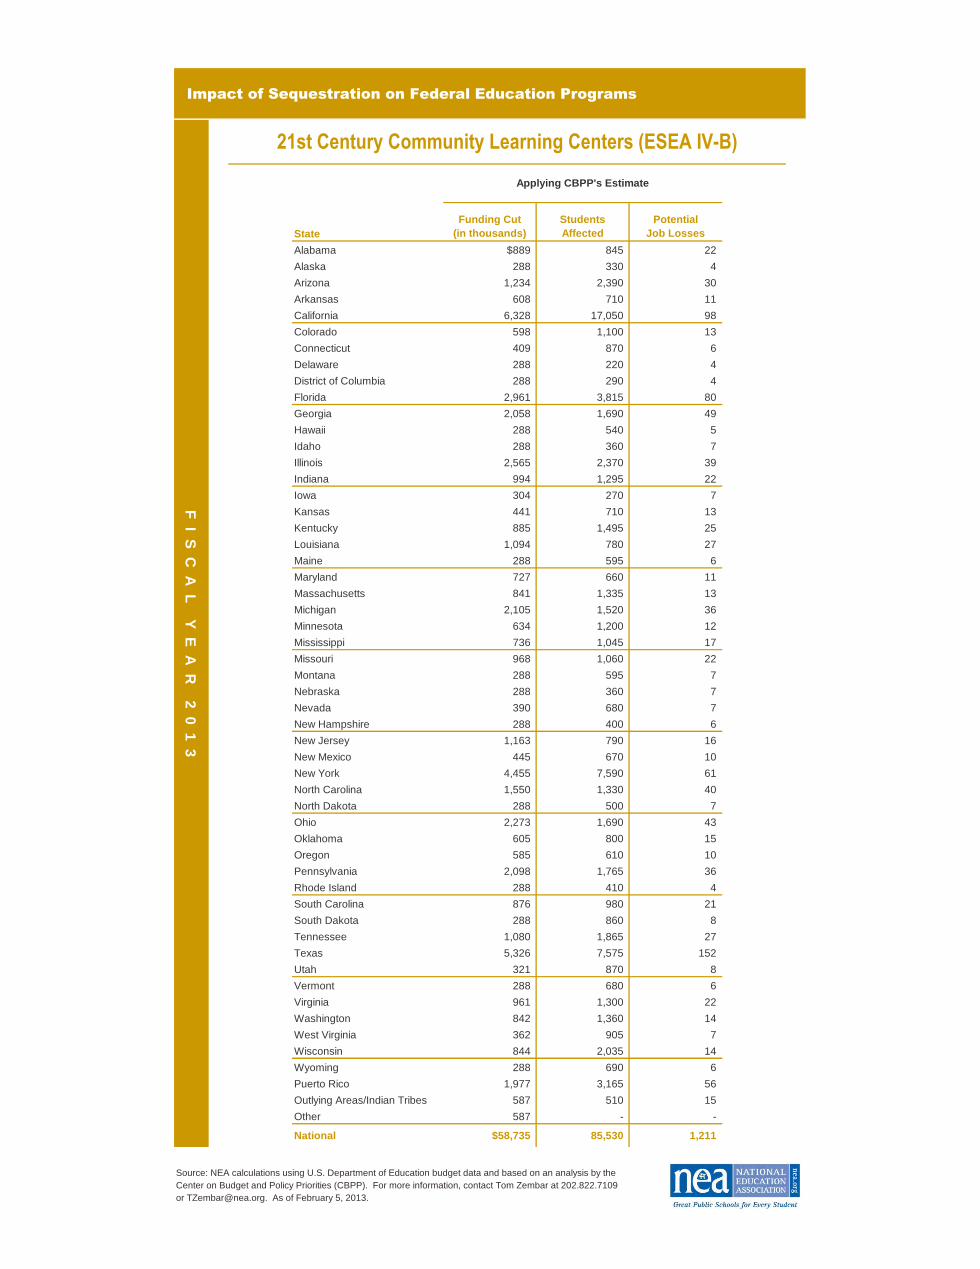
The funding cut is equivalent to eliminating before-
and after-school services and summer school programs
for this number of students, most of which attend
high-need, high-poverty schools
125
86
thousand
thousand
1,200
$1.00
$1.05
$1.10
$1.15
$1.20
'08
(billions)
F I S C A
L Y E A R
2 0 1 3
$59million
FUNDING CUT
STUDENTS AFFECTED
The funding cut could lead to the elimination of this number
of jobs, which includes school-day teachers and other non-
teaching school staff, as well as center administrators and
coordinators, and youth development workers
POTENTIAL JOB LOSSES
'13
The additional number of students attending afterschool programs
today than in 2008:
The percentage of attendees that qualify for free or reduced-price lunch are nearly:
21st Century Community Learning Centers (ESEA Title IV-B)
66%
Sequestration would roll back funding near the level in
2008
As a result of the "fiscal cliff" deal (American Taxpayer
Relief Act of 2012) reached at the beginning of the year,
sequestration, or automatic, across-the-board budget cuts,
was postponed by two months. Absent any agreement to
replace sequestration, budget cuts will be uniformly
applied to almost all federal programs beginning on
March 1, 2013. Due to the delay, however, the total
amount of the cut in fiscal year 2013 has been lessened by
$24 billion, from $109.3 billion to $85.3 billion. An
analysis by the Center on Budget and Policy Priorities
(CBPP) indicates that nonexempt, nondefense
discretionary programs would be cut by 5.1 percent; and
a cut of 5.3 percent would be applied to nonexempt,
nondefense mandatory programs. Since Congress has
not yet completed work on appropriations for fiscal year
2013, the estimated cuts by education program presented
here assume the same rate of operations as in fiscal year
2012. Actual cuts could differ once appropriations are
enacted for 2013.
Source: NEA calculations using U.S. Department of Education budget data and based on an analysis by the Center on Budget and Policy Priorities, Here's How the March 1 Sequester Would Work, January 22, 2013. For more information, contact Tom Zembar at 202.822.7109 or [email protected]. As of February 5, 2013.
Impact of Sequestration on Federal Education Programs
Source: NEA calculations using U.S. Department of Education budget data and based on an analysis by theCenter on Budget and Policy Priorities (CBPP). For more information, contact Tom Zembar at 202.822.7109or [email protected]. As of February 5, 2013.
Applying CBPP's Estimate
F I S C A
L Y E A R
2 0 1 3
21st Century Community Learning Centers (ESEA IV-B)
Impact of Sequestration on Federal Education Programs
The funding cut is equivalent to eliminating a range of
services to facilitate the enrollment, attendance, and success in
school for this number of students who are homeless
500
45
thousand
thousand
45
$60
$61
$62
$63
$64
$65
$66
'06
(millions)
F I S C A
L Y E A R
2 0 1 3
$3million
FUNDING CUT
STUDENTS AFFECTED
The funding cut could lead to the elimination of this number
of jobs, which includes teachers, classroom aides, reading
specialists, counselors, school nurses, and other support staff
POTENTIAL JOB LOSSES
'13
130%
The additional number of homeless children receiving services today than in 2006:
The percentage increase in the number of homeless children receiving services since 2006:
Education for Homeless Children & Youths (MVHAA Title VII-B)
Sequestration would roll back funding below the level in
2006
As a result of the "fiscal cliff" deal (American Taxpayer
Relief Act of 2012) reached at the beginning of the year,
sequestration, or automatic, across-the-board budget cuts,
was postponed by two months. Absent any agreement to
replace sequestration, budget cuts will be uniformly
applied to almost all federal programs beginning on
March 1, 2013. Due to the delay, however, the total
amount of the cut in fiscal year 2013 has been lessened by
$24 billion, from $109.3 billion to $85.3 billion. An
analysis by the Center on Budget and Policy Priorities
(CBPP) indicates that nonexempt, nondefense
discretionary programs would be cut by 5.1 percent; and
a cut of 5.3 percent would be applied to nonexempt,
nondefense mandatory programs. Since Congress has
not yet completed work on appropriations for fiscal year
2013, the estimated cuts by education program presented
here assume the same rate of operations as in fiscal year
2012. Actual cuts could differ once appropriations are
enacted for 2013.
Source: NEA calculations using U.S. Department of Education budget data and based on an analysis by the Center on Budget and Policy Priorities, Here's How the March 1 Sequester Would Work, January 22, 2013. For more information, contact Tom Zembar at 202.822.7109 or [email protected]. As of February 5, 2013.
Impact of Sequestration on Federal Education Programs
Source: NEA calculations using U.S. Department of Education budget data and based on an analysis by theCenter on Budget and Policy Priorities (CBPP). For more information, contact Tom Zembar at 202.822.7109or [email protected]. As of February 5, 2013.
Applying CBPP's Estimate
F I S C A
L Y E A R
2 0 1 3
Education for Homeless Children and Youths (MVHAA Title VII-B)
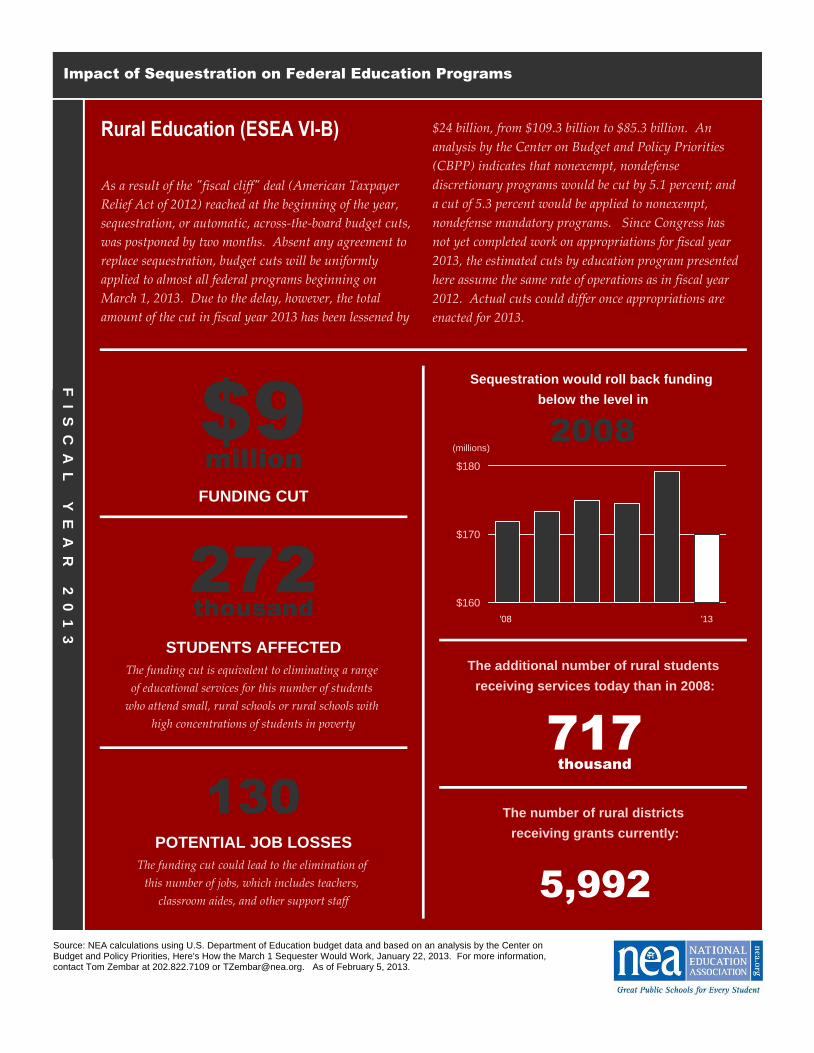
Impact of Sequestration on Federal Education Programs
The funding cut is equivalent to eliminating a range
of educational services for this number of students
who attend small, rural schools or rural schools with
high concentrations of students in poverty
717
272
thousand
thousand
130
$160
$170
$180
'08
(millions)
F I S C A
L Y E A R
2 0 1 3
$9million
FUNDING CUT
STUDENTS AFFECTED
The funding cut could lead to the elimination of
this number of jobs, which includes teachers,
classroom aides, and other support staff
POTENTIAL JOB LOSSES
'13
5,992
The additional number of rural students receiving services today than in 2008:
The number of rural districts receiving grants currently:
Rural Education (ESEA VI-B)
Sequestration would roll back funding below the level in
2008
As a result of the "fiscal cliff" deal (American Taxpayer
Relief Act of 2012) reached at the beginning of the year,
sequestration, or automatic, across-the-board budget cuts,
was postponed by two months. Absent any agreement to
replace sequestration, budget cuts will be uniformly
applied to almost all federal programs beginning on
March 1, 2013. Due to the delay, however, the total
amount of the cut in fiscal year 2013 has been lessened by
$24 billion, from $109.3 billion to $85.3 billion. An
analysis by the Center on Budget and Policy Priorities
(CBPP) indicates that nonexempt, nondefense
discretionary programs would be cut by 5.1 percent; and
a cut of 5.3 percent would be applied to nonexempt,
nondefense mandatory programs. Since Congress has
not yet completed work on appropriations for fiscal year
2013, the estimated cuts by education program presented
here assume the same rate of operations as in fiscal year
2012. Actual cuts could differ once appropriations are
enacted for 2013.
Source: NEA calculations using U.S. Department of Education budget data and based on an analysis by the Center on Budget and Policy Priorities, Here's How the March 1 Sequester Would Work, January 22, 2013. For more information, contact Tom Zembar at 202.822.7109 or [email protected]. As of February 5, 2013.
Impact of Sequestration on Federal Education Programs
Source: NEA calculations using U.S. Department of Education budget data and based on an analysis by theCenter on Budget and Policy Priorities (CBPP). For more information, contact Tom Zembar at 202.822.7109or [email protected]. As of February 5, 2013.
Applying CBPP's Estimate
F I S C A
L Y E A R
2 0 1 3
Rural Education (ESEA VI-B)
Impact of Sequestration on Federal Education Programs
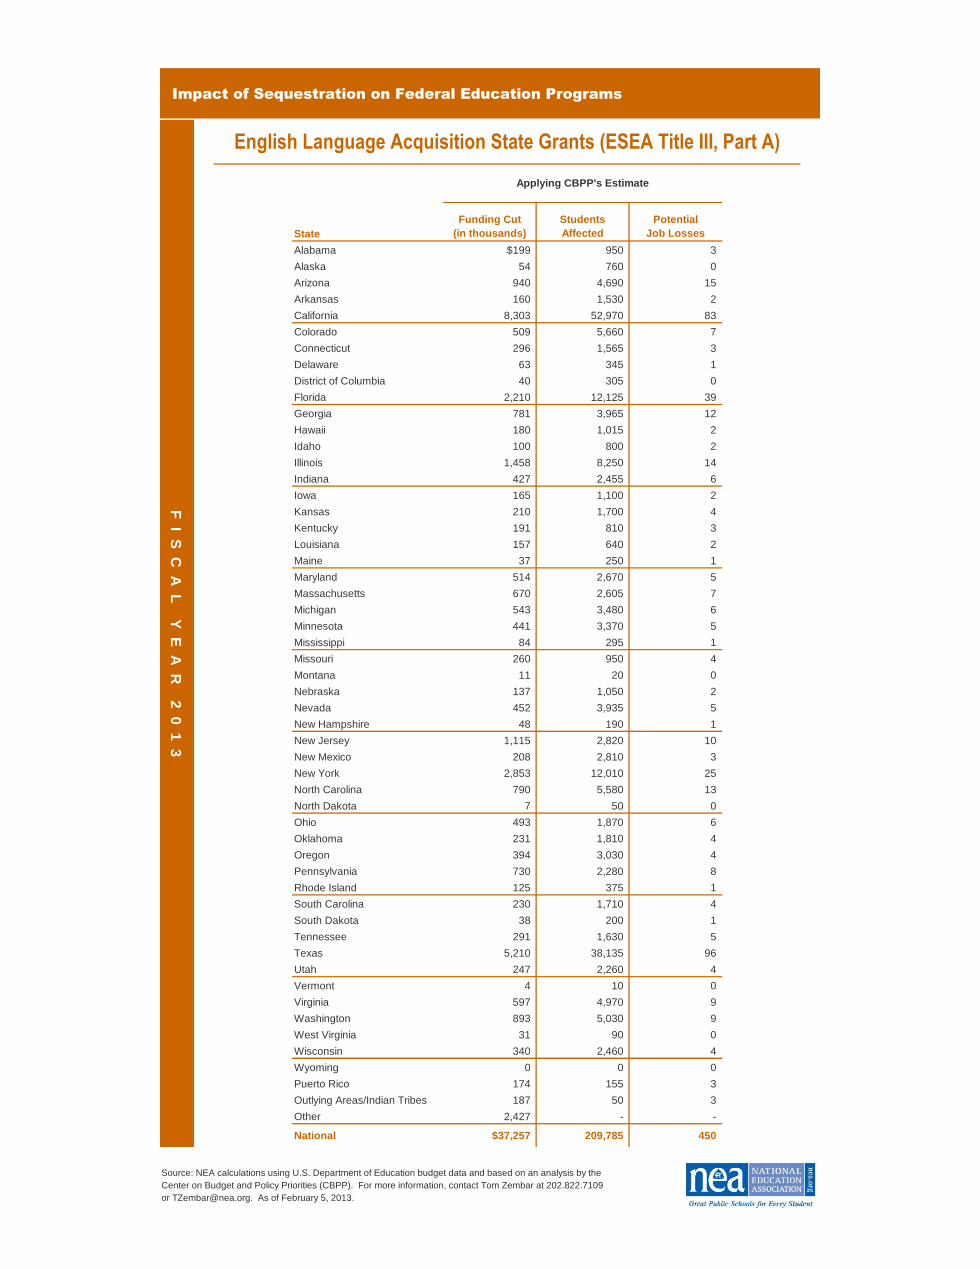
The funding cut is equivalent to eliminating
language instruction educational programs
for this number of English learners
210thousand
450
$660
$680
$700
$720
$740
$760
'08
(millions)
F I S C A
L Y E A R
2 0 1 3
$37million
FUNDING CUT
STUDENTS AFFECTED
The funding cut could lead to the elimination of this
number of jobs, which includes teachers,
paraprofessionals, and other support staff
POTENTIAL JOB LOSSES
'13
English Language Acquisition State Grants (ESEA Title III, Part A)
Sequestration would roll back funding below the level in
2008
As a result of the "fiscal cliff" deal (American Taxpayer
Relief Act of 2012) reached at the beginning of the year,
sequestration, or automatic, across-the-board budget cuts,
was postponed by two months. Absent any agreement to
replace sequestration, budget cuts will be uniformly
applied to almost all federal programs beginning on
March 1, 2013. Due to the delay, however, the total
amount of the cut in fiscal year 2013 has been lessened by
$24 billion, from $109.3 billion to $85.3 billion. An
analysis by the Center on Budget and Policy Priorities
(CBPP) indicates that nonexempt, nondefense
discretionary programs would be cut by 5.1 percent; and
a cut of 5.3 percent would be applied to nonexempt,
nondefense mandatory programs. Since Congress has
not yet completed work on appropriations for fiscal year
2013, the estimated cuts by education program presented
here assume the same rate of operations as in fiscal year
2012. Actual cuts could differ once appropriations are
enacted for 2013.
Source: NEA calculations using U.S. Department of Education budget data and based on an analysis by the Center on Budget and Policy Priorities, Here's How the March 1 Sequester Would Work, January 22, 2013. For more information, contact Tom Zembar at 202.822.7109 or [email protected]. As of February 5, 2013.
56
The number of distinct languages reported by states as one of the
top five languages spoken by English learners in that state:
The number of distinct languages spoken in homes across the
United States:
325
Impact of Sequestration on Federal Education Programs
Source: NEA calculations using U.S. Department of Education budget data and based on an analysis by theCenter on Budget and Policy Priorities (CBPP). For more information, contact Tom Zembar at 202.822.7109or [email protected]. As of February 5, 2013.
Applying CBPP's Estimate
F I S C A
L Y E A R
2 0 1 3
English Language Acquisition State Grants (ESEA Title III, Part A)
Impact of Sequestration on Federal Education Programs
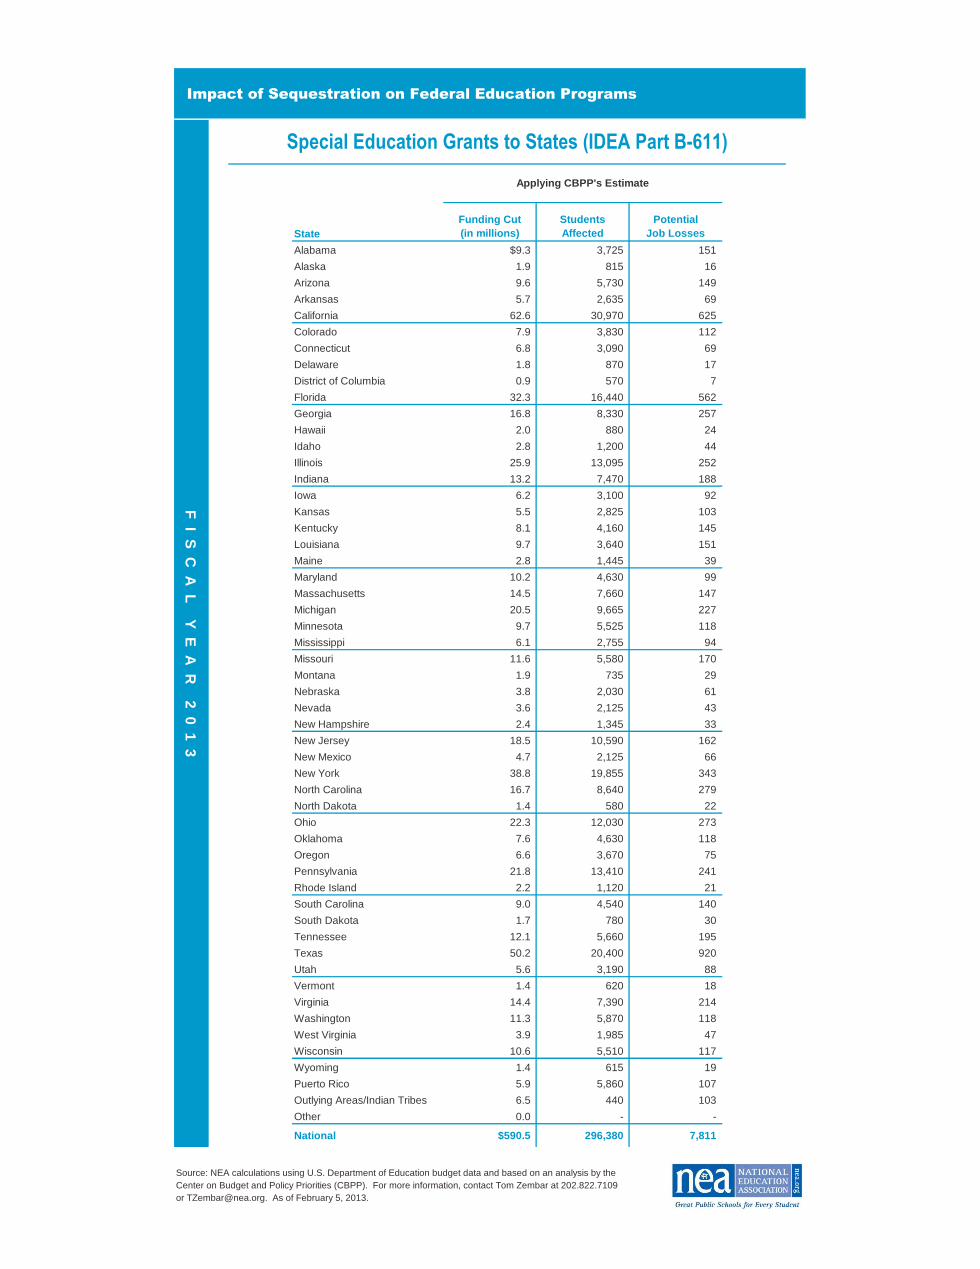
The funding cut is equivalent to shifting the cost of educating
this number of students with special needs from the federal
government to states and school districts
296thousand
7,800
$9.8
$10.2
$10.6
$11.0
$11.4
$11.8
'08
(billions)
F I S C A
L Y E A R
2 0 1 3
$591million
FUNDING CUT
STUDENTS AFFECTED
The funding cut could lead to the elimination of this number
of jobs, which includes special education teachers,
occupational and physical therapists, and school counselors
POTENTIAL JOB LOSSES
'13
14%
The rise in costs in providing special education services
since 2008:
Special Education Grants to States (IDEA Part B-611)
15%
The federal share of the excess costs of educating students with disabilities in 2013 would fall to
below the 2002 share:
Sequestration would roll back funding near the level in
2008
As a result of the "fiscal cliff" deal (American Taxpayer
Relief Act of 2012) reached at the beginning of the year,
sequestration, or automatic, across-the-board budget cuts,
was postponed by two months. Absent any agreement to
replace sequestration, budget cuts will be uniformly
applied to almost all federal programs beginning on
March 1, 2013. Due to the delay, however, the total
amount of the cut in fiscal year 2013 has been lessened by
$24 billion, from $109.3 billion to $85.3 billion. An
analysis by the Center on Budget and Policy Priorities
(CBPP) indicates that nonexempt, nondefense
discretionary programs would be cut by 5.1 percent; and
a cut of 5.3 percent would be applied to nonexempt,
nondefense mandatory programs. Since Congress has
not yet completed work on appropriations for fiscal year
2013, the estimated cuts by education program presented
here assume the same rate of operations as in fiscal year
2012. Actual cuts could differ once appropriations are
enacted for 2013.
Source: NEA calculations using U.S. Department of Education budget data and based on an analysis by the Center on Budget and Policy Priorities, Here's How the March 1 Sequester Would Work, January 22, 2013. For more information, contact Tom Zembar at 202.822.7109 or [email protected]. As of February 5, 2013.
Impact of Sequestration on Federal Education Programs
Source: NEA calculations using U.S. Department of Education budget data and based on an analysis by theCenter on Budget and Policy Priorities (CBPP). For more information, contact Tom Zembar at 202.822.7109or [email protected]. As of February 5, 2013.
Applying CBPP's Estimate
F I S C A
L Y E A R
2 0 1 3
Special Education Grants to States (IDEA Part B-611)
Impact of Sequestration on Federal Education Programs
The funding cut is equivalent to shifting the costs of educating
this number of preschool children with special needs from the
federal government to states and school districts
223
38
thousand
thousand
250
$300
$325
$350
$375
$400
'95
(millions)
F I S C A
L Y E A R
2 0 1 3
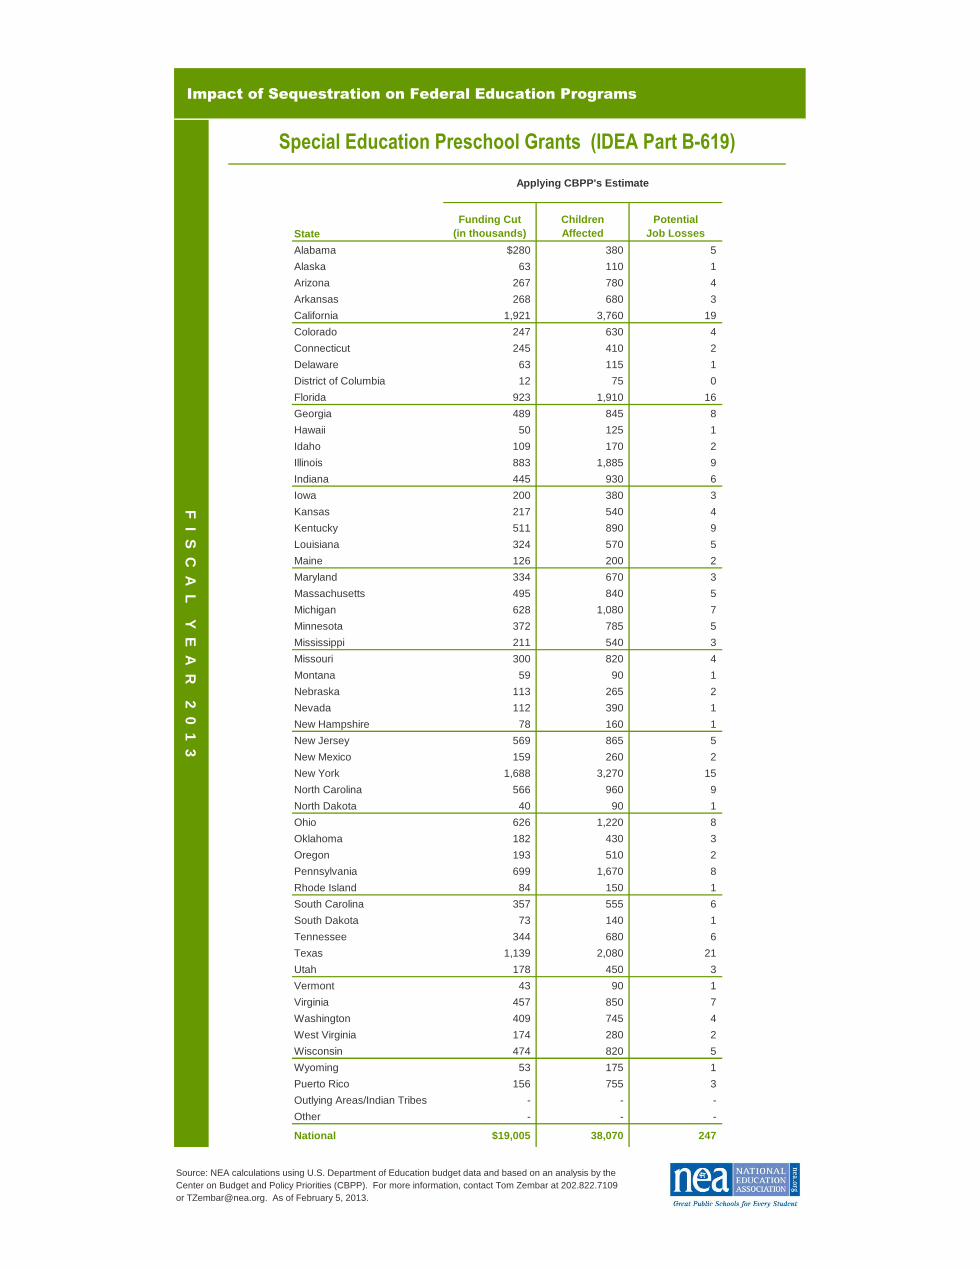
$19million
FUNDING CUT
CHILDREN AFFECTED
The funding cut could lead to the elimination of this number
of jobs, which includes special education teachers, early
The additional number of children receiving special education services today than in 1995:
The rise in costs in providing special education services
since 1995:
Special Education Preschool Grants (IDEA Part B-619)
Sequestration would roll back funding below the level in
1995
As a result of the "fiscal cliff" deal (American Taxpayer
Relief Act of 2012) reached at the beginning of the year,
sequestration, or automatic, across-the-board budget cuts,
was postponed by two months. Absent any agreement to
replace sequestration, budget cuts will be uniformly
applied to almost all federal programs beginning on
March 1, 2013. Due to the delay, however, the total
amount of the cut in fiscal year 2013 has been lessened by
$24 billion, from $109.3 billion to $85.3 billion. An
analysis by the Center on Budget and Policy Priorities
(CBPP) indicates that nonexempt, nondefense
discretionary programs would be cut by 5.1 percent; and
a cut of 5.3 percent would be applied to nonexempt,
nondefense mandatory programs. Since Congress has
not yet completed work on appropriations for fiscal year
2013, the estimated cuts by education program presented
here assume the same rate of operations as in fiscal year
2012. Actual cuts could differ once appropriations are
enacted for 2013.
Source: NEA calculations using U.S. Department of Education budget data and based on an analysis by the Center on Budget and Policy Priorities, Here's How the March 1 Sequester Would Work, January 22, 2013. For more information, contact Tom Zembar at 202.822.7109 or [email protected]. As of February 5, 2013.
Impact of Sequestration on Federal Education Programs
Source: NEA calculations using U.S. Department of Education budget data and based on an analysis by theCenter on Budget and Policy Priorities (CBPP). For more information, contact Tom Zembar at 202.822.7109or [email protected]. As of February 5, 2013.
Applying CBPP's Estimate
F I S C A
L Y E A R
2 0 1 3
Special Education Preschool Grants (IDEA Part B-619)
Impact of Sequestration on Federal Education Programs
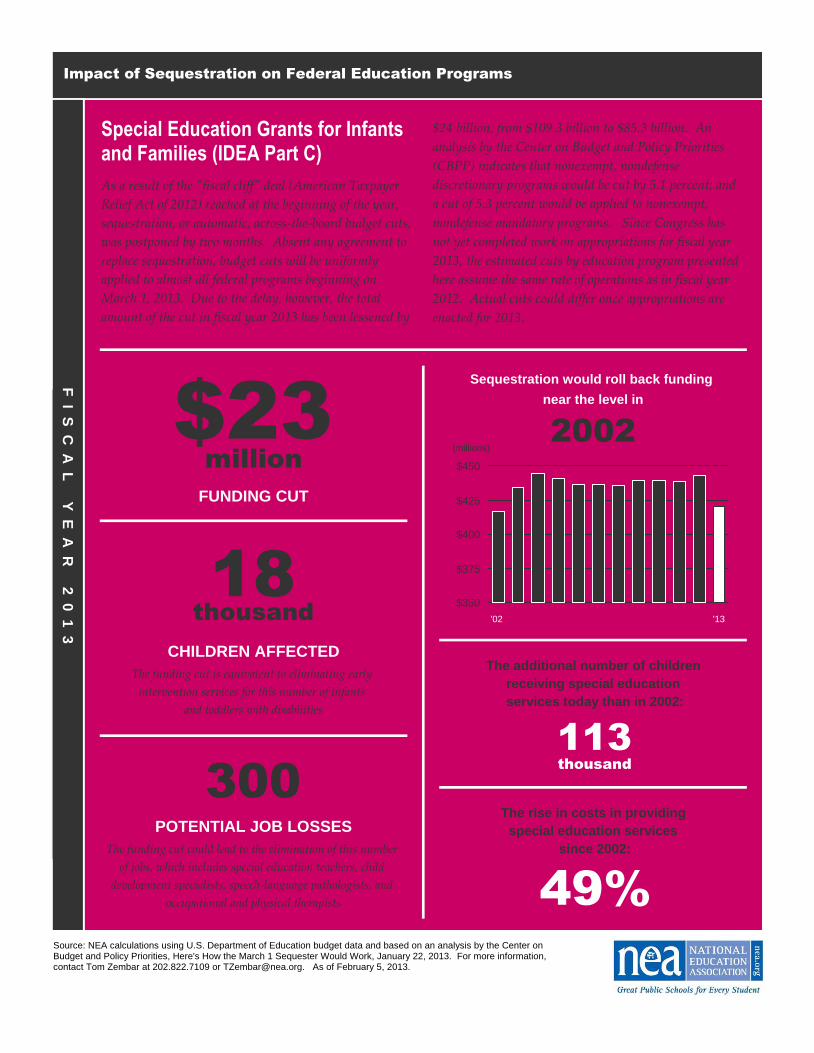
The funding cut is equivalent to eliminating early
intervention services for this number of infants
and toddlers with disabilities
113
18
thousand
thousand
300
$350
$375
$400
$425
$450
'02
(millions)
F I S C A
L Y E A R
2 0 1 3
$23million
FUNDING CUT
CHILDREN AFFECTED
The funding cut could lead to the elimination of this number
of jobs, which includes special education teachers, child
development specialists, speech-language pathologists, and
occupational and physical therapists
POTENTIAL JOB LOSSES
'13
49%
The additional number of children receiving special education services today than in 2002:
The rise in costs in providing special education services
since 2002:
Special Education Grants for Infants and Families (IDEA Part C)
Sequestration would roll back funding near the level in
2002
As a result of the "fiscal cliff" deal (American Taxpayer
Relief Act of 2012) reached at the beginning of the year,
sequestration, or automatic, across-the-board budget cuts,
was postponed by two months. Absent any agreement to
replace sequestration, budget cuts will be uniformly
applied to almost all federal programs beginning on
March 1, 2013. Due to the delay, however, the total
amount of the cut in fiscal year 2013 has been lessened by
$24 billion, from $109.3 billion to $85.3 billion. An
analysis by the Center on Budget and Policy Priorities
(CBPP) indicates that nonexempt, nondefense
discretionary programs would be cut by 5.1 percent; and
a cut of 5.3 percent would be applied to nonexempt,
nondefense mandatory programs. Since Congress has
not yet completed work on appropriations for fiscal year
2013, the estimated cuts by education program presented
here assume the same rate of operations as in fiscal year
2012. Actual cuts could differ once appropriations are
enacted for 2013.
Source: NEA calculations using U.S. Department of Education budget data and based on an analysis by the Center on Budget and Policy Priorities, Here's How the March 1 Sequester Would Work, January 22, 2013. For more information, contact Tom Zembar at 202.822.7109 or [email protected]. As of February 5, 2013.
Impact of Sequestration on Federal Education Programs
Source: NEA calculations using U.S. Department of Education budget data and based on an analysis by theCenter on Budget and Policy Priorities (CBPP). For more information, contact Tom Zembar at 202.822.7109or [email protected]. As of February 5, 2013.
Applying CBPP's Estimate
F I S C A
L Y E A R
2 0 1 3
Special Education Grants for Infants & Families (IDEA Part C)
Impact of Sequestration on Federal Education Programs
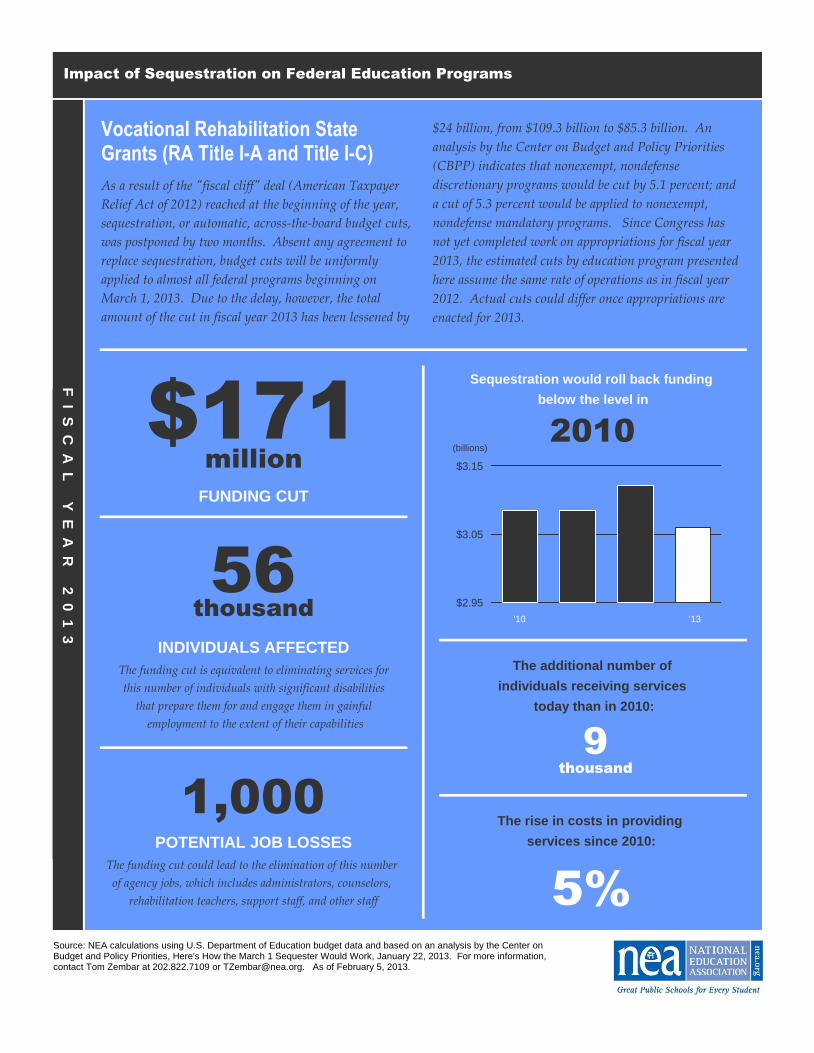
The funding cut is equivalent to eliminating services for
this number of individuals with significant disabilities
that prepare them for and engage them in gainful
employment to the extent of their capabilities
9
56
thousand
thousand
1,000
$2.95
$3.05
$3.15
'10
(billions)
F I S C A
L Y E A R
2 0 1 3
$171million
FUNDING CUT
INDIVIDUALS AFFECTED
The funding cut could lead to the elimination of this number
of agency jobs, which includes administrators, counselors,
rehabilitation teachers, support staff, and other staff
POTENTIAL JOB LOSSES
'13
5%
The additional number of individuals receiving services
today than in 2010:
The rise in costs in providing services since 2010:
Vocational Rehabilitation State Grants (RA Title I-A and Title I-C)
Sequestration would roll back funding below the level in
2010
As a result of the "fiscal cliff" deal (American Taxpayer
Relief Act of 2012) reached at the beginning of the year,
sequestration, or automatic, across-the-board budget cuts,
was postponed by two months. Absent any agreement to
replace sequestration, budget cuts will be uniformly
applied to almost all federal programs beginning on
March 1, 2013. Due to the delay, however, the total
amount of the cut in fiscal year 2013 has been lessened by
$24 billion, from $109.3 billion to $85.3 billion. An
analysis by the Center on Budget and Policy Priorities
(CBPP) indicates that nonexempt, nondefense
discretionary programs would be cut by 5.1 percent; and
a cut of 5.3 percent would be applied to nonexempt,
nondefense mandatory programs. Since Congress has
not yet completed work on appropriations for fiscal year
2013, the estimated cuts by education program presented
here assume the same rate of operations as in fiscal year
2012. Actual cuts could differ once appropriations are
enacted for 2013.
Source: NEA calculations using U.S. Department of Education budget data and based on an analysis by the Center on Budget and Policy Priorities, Here's How the March 1 Sequester Would Work, January 22, 2013. For more information, contact Tom Zembar at 202.822.7109 or [email protected]. As of February 5, 2013.
Impact of Sequestration on Federal Education Programs
Source: NEA calculations using U.S. Department of Education budget data and based on an analysis by theCenter on Budget and Policy Priorities (CBPP). For more information, contact Tom Zembar at 202.822.7109or [email protected]. As of February 5, 2013.
Applying CBPP's Estimate
F I S C A
L Y E A R
2 0 1 3
Vocational Rehabilitation State Grants (RA Title I-A and Title I-C)
Impact of Sequestration on Federal Education Programs
The funding cut is equivalent to eliminating career and
technical education programs in high schools, technical
schools, and community colleges for this number of students
2.6
624
million
thousand
760
$0.9
$1.0
$1.1
$1.2
'00
(billions)
F I S C A
L Y E A R
2 0 1 3
$57million
FUNDING CUT
STUDENTS AFFECTED
The funding cut could lead to the elimination of this number
of jobs, which includes high school teachers, counselors,
faculty at postsecondary institutions, and other support staff
POTENTIAL JOB LOSSES
'13
60%
The additional number of students enrolled today in
career and technical education programs than in 2000:
The rise in costs in providing career and technical education
programs since 2000:
Career & Technical Education State Grants (Carl D. Perkins CTEA Title I)
2000
Sequestration would roll back funding near the level in
As a result of the "fiscal cliff" deal (American Taxpayer
Relief Act of 2012) reached at the beginning of the year,
sequestration, or automatic, across-the-board budget cuts,
was postponed by two months. Absent any agreement to
replace sequestration, budget cuts will be uniformly
applied to almost all federal programs beginning on
March 1, 2013. Due to the delay, however, the total
amount of the cut in fiscal year 2013 has been lessened by
$24 billion, from $109.3 billion to $85.3 billion. An
analysis by the Center on Budget and Policy Priorities
(CBPP) indicates that nonexempt, nondefense
discretionary programs would be cut by 5.1 percent; and
a cut of 5.3 percent would be applied to nonexempt,
nondefense mandatory programs. Since Congress has
not yet completed work on appropriations for fiscal year
2013, the estimated cuts by education program presented
here assume the same rate of operations as in fiscal year
2012. Actual cuts could differ once appropriations are
enacted for 2013.
Source: NEA calculations using U.S. Department of Education budget data and based on an analysis by the Center on Budget and Policy Priorities, Here's How the March 1 Sequester Would Work, January 22, 2013. For more information, contact Tom Zembar at 202.822.7109 or [email protected]. As of February 5, 2013.
Impact of Sequestration on Federal Education Programs
Source: NEA calculations using U.S. Department of Education budget data and based on an analysis by theCenter on Budget and Policy Priorities (CBPP). For more information, contact Tom Zembar at 202.822.7109or [email protected]. As of February 5, 2013.
Applying CBPP's Estimate
F I S C A
L Y E A R
2 0 1 3
Career & Technical Education State Grants (Carl D. Perkins CTEA Title I)
Impact of Sequestration on Federal Education Programs
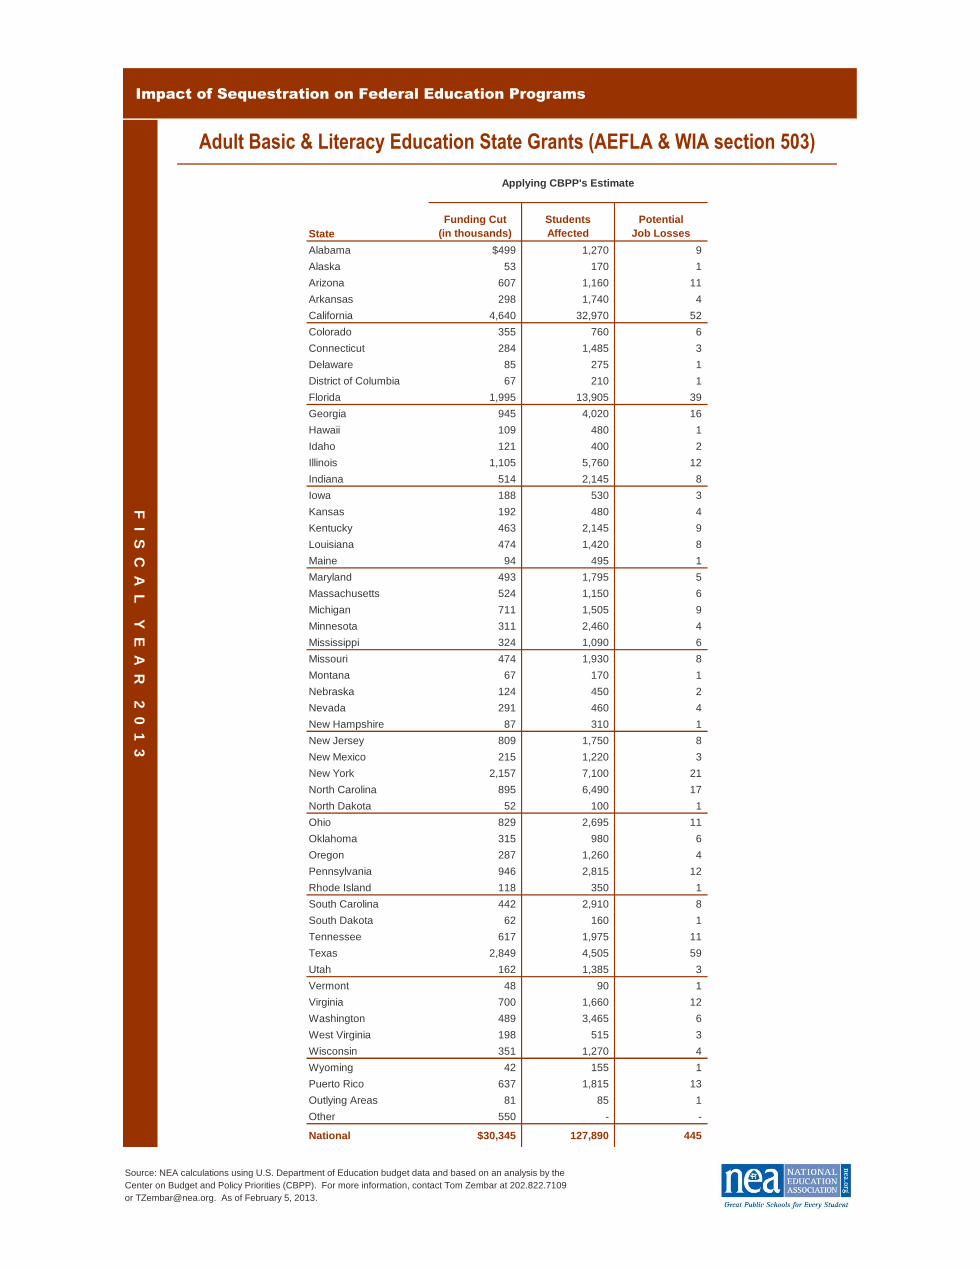
The funding cut is equivalent to eliminating programs
that provide adult basic education, English literacy, adult
secondary education, workplace literacy, and family
literacy services for this number of adults
4%
128thousand
450
$500
$550
$600
$650
'08
(millions)
F I S C A
L Y E A R
2 0 1 3
$30million
FUNDING CUT
STUDENTS AFFECTED
The funding cut could lead to the elimination of this
number of jobs, which includes adult literacy and GED
teachers in community colleges, community-based
organizations, and public schools
POTENTIAL JOB LOSSES
'13
72%
The percentage of participants receiving services compared to
those who are eligible:
The percentage of programs with confirmed waiting lists
across all fifty states:
Adult Basic and Literacy Education State Grants (AEFLA & WIA sec. 503)
2008
Sequestration would roll back funding near the level in
As a result of the "fiscal cliff" deal (American Taxpayer
Relief Act of 2012) reached at the beginning of the year,
sequestration, or automatic, across-the-board budget cuts,
was postponed by two months. Absent any agreement to
replace sequestration, budget cuts will be uniformly
applied to almost all federal programs beginning on
March 1, 2013. Due to the delay, however, the total
amount of the cut in fiscal year 2013 has been lessened by
$24 billion, from $109.3 billion to $85.3 billion. An
analysis by the Center on Budget and Policy Priorities
(CBPP) indicates that nonexempt, nondefense
discretionary programs would be cut by 5.1 percent; and
a cut of 5.3 percent would be applied to nonexempt,
nondefense mandatory programs. Since Congress has
not yet completed work on appropriations for fiscal year
2013, the estimated cuts by education program presented
here assume the same rate of operations as in fiscal year
2012. Actual cuts could differ once appropriations are
enacted for 2013.
Source: NEA calculations using U.S. Department of Education budget data and based on an analysis by the Center on Budget and Policy Priorities, Here's How the March 1 Sequester Would Work, January 22, 2013. For more information, contact Tom Zembar at 202.822.7109 or [email protected]. As of February 5, 2013.
Impact of Sequestration on Federal Education Programs
Source: NEA calculations using U.S. Department of Education budget data and based on an analysis by theCenter on Budget and Policy Priorities (CBPP). For more information, contact Tom Zembar at 202.822.7109or [email protected]. As of February 5, 2013.
Impact of Sequestration on Federal Education Programs
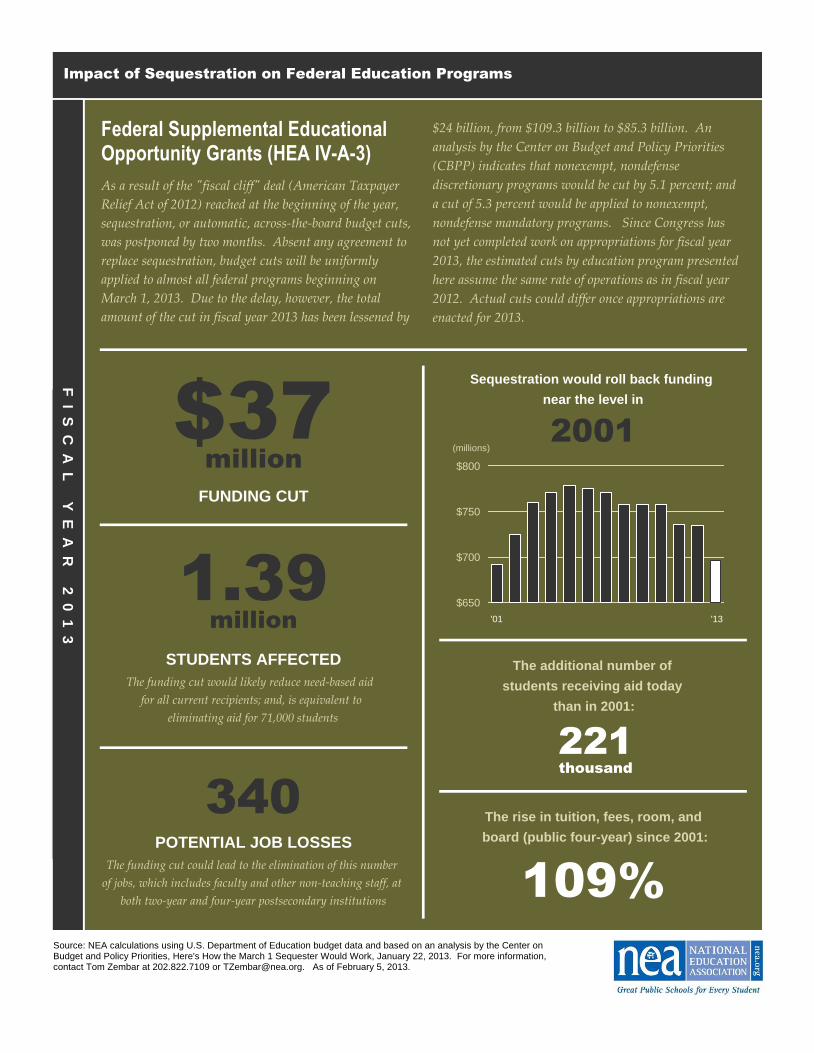
The funding cut would likely reduce need-based aid
for all current recipients; and, is equivalent to
eliminating aid for 71,000 students
221
1.39
thousand
million
340
$650
$700
$750
$800
'01
(millions)
F I S C A
L Y E A R
2 0 1 3
$37million
FUNDING CUT
STUDENTS AFFECTED
The funding cut could lead to the elimination of this number
of jobs, which includes faculty and other non-teaching staff, at
both two-year and four-year postsecondary institutions
POTENTIAL JOB LOSSES
'13
109%
The additional number of students receiving aid today
than in 2001:
The rise in tuition, fees, room, and board (public four-year) since 2001:
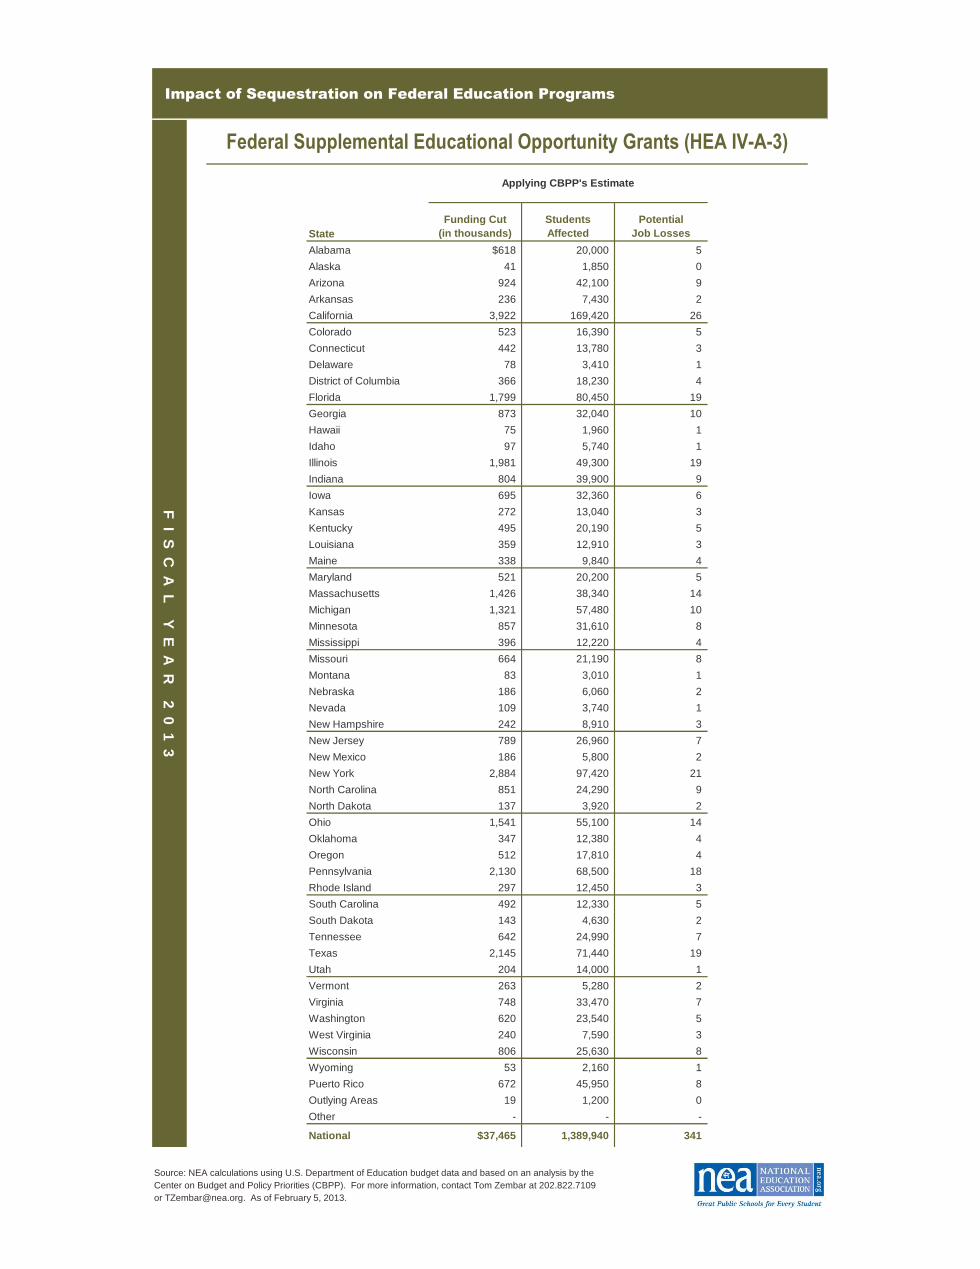
Federal Supplemental Educational Opportunity Grants (HEA IV-A-3)
Sequestration would roll back funding near the level in
2001
As a result of the "fiscal cliff" deal (American Taxpayer
Relief Act of 2012) reached at the beginning of the year,
sequestration, or automatic, across-the-board budget cuts,
was postponed by two months. Absent any agreement to
replace sequestration, budget cuts will be uniformly
applied to almost all federal programs beginning on
March 1, 2013. Due to the delay, however, the total
amount of the cut in fiscal year 2013 has been lessened by
$24 billion, from $109.3 billion to $85.3 billion. An
analysis by the Center on Budget and Policy Priorities
(CBPP) indicates that nonexempt, nondefense
discretionary programs would be cut by 5.1 percent; and
a cut of 5.3 percent would be applied to nonexempt,
nondefense mandatory programs. Since Congress has
not yet completed work on appropriations for fiscal year
2013, the estimated cuts by education program presented
here assume the same rate of operations as in fiscal year
2012. Actual cuts could differ once appropriations are
enacted for 2013.
Source: NEA calculations using U.S. Department of Education budget data and based on an analysis by the Center on Budget and Policy Priorities, Here's How the March 1 Sequester Would Work, January 22, 2013. For more information, contact Tom Zembar at 202.822.7109 or [email protected]. As of February 5, 2013.
Impact of Sequestration on Federal Education Programs
Source: NEA calculations using U.S. Department of Education budget data and based on an analysis by theCenter on Budget and Policy Priorities (CBPP). For more information, contact Tom Zembar at 202.822.7109or [email protected]. As of February 5, 2013.
Applying CBPP's Estimate
F I S C A
L Y E A R
2 0 1 3
Federal Supplemental Educational Opportunity Grants (HEA IV-A-3)
Impact of Sequestration on Federal Education Programs
The funding cut would likely reduce need-based aid for
all current recipients; and, is equivalent to eliminating
part-time employment for 35,000 students
683thousand
450
$875
$925
$975
$1,025
'00
(millions)
F I S C A
L Y E A R
2 0 1 3
$50million
FUNDING CUT
STUDENTS AFFECTED
The funding cut could lead to the elimination of this number
of jobs, which includes faculty and other non-teaching staff, at
both two-year and four-year postsecondary institutions
POTENTIAL JOB LOSSES
'13
7%
The average aid as a share of a student's tuition, fees, room, and board (public four-year) in 2000:
Federal Work-Study (HEA IV-C)
Sequestration would roll back funding below the level in
2000
15%
The average aid as a share of a student's tuition, fees, room, and board (public
four-year) in 2013 post-sequester:
As a result of the "fiscal cliff" deal (American Taxpayer
Relief Act of 2012) reached at the beginning of the year,
sequestration, or automatic, across-the-board budget cuts,
was postponed by two months. Absent any agreement to
replace sequestration, budget cuts will be uniformly
applied to almost all federal programs beginning on
March 1, 2013. Due to the delay, however, the total
amount of the cut in fiscal year 2013 has been lessened by
$24 billion, from $109.3 billion to $85.3 billion. An
analysis by the Center on Budget and Policy Priorities
(CBPP) indicates that nonexempt, nondefense
discretionary programs would be cut by 5.1 percent; and
a cut of 5.3 percent would be applied to nonexempt,
nondefense mandatory programs. Since Congress has
not yet completed work on appropriations for fiscal year
2013, the estimated cuts by education program presented
here assume the same rate of operations as in fiscal year
2012. Actual cuts could differ once appropriations are
enacted for 2013.
Source: NEA calculations using U.S. Department of Education budget data and based on an analysis by the Center on Budget and Policy Priorities, Here's How the March 1 Sequester Would Work, January 22, 2013. For more information, contact Tom Zembar at 202.822.7109 or [email protected]. As of February 5, 2013.
Impact of Sequestration on Federal Education Programs
Source: NEA calculations using U.S. Department of Education budget data and based on an analysis by theCenter on Budget and Policy Priorities (CBPP). For more information, contact Tom Zembar at 202.822.7109or [email protected]. As of February 5, 2013.
Applying CBPP's Estimate
F I S C A
L Y E A R
2 0 1 3
Federal Work-Study (HEA IV-C)
Impact of Sequestration on Federal Education Programs
The funding cut is equivalent to eliminating outreach and
support services to encourage enrollment in and completion of
postsecondary education for this number of needy individuals,
many who are first-generation college students
41thousand
400
$650
$750
$850
$950
'02
(millions)
F I S C A
L Y E A R
2 0 1 3
$43million
FUNDING CUT
STUDENTS AFFECTED
The funding cut could lead to the elimination of this number
of jobs, which includes coordinators, counselors, tutors,
educators, professional staff, and other support staff
POTENTIAL JOB LOSSES
'13
15%
Federal TRIO Programs (HEA IV-A-2, Chapter 1)
Sequestration would roll back funding below the level in
2002
164
The percentage increase in the cost per participant today
than in 2002:
The additional number of projects funded today
than in 2002:
As a result of the "fiscal cliff" deal (American Taxpayer
Relief Act of 2012) reached at the beginning of the year,
sequestration, or automatic, across-the-board budget cuts,
was postponed by two months. Absent any agreement to
replace sequestration, budget cuts will be uniformly
applied to almost all federal programs beginning on
March 1, 2013. Due to the delay, however, the total
amount of the cut in fiscal year 2013 has been lessened by
$24 billion, from $109.3 billion to $85.3 billion. An
analysis by the Center on Budget and Policy Priorities
(CBPP) indicates that nonexempt, nondefense
discretionary programs would be cut by 5.1 percent; and
a cut of 5.3 percent would be applied to nonexempt,
nondefense mandatory programs. Since Congress has
not yet completed work on appropriations for fiscal year
2013, the estimated cuts by education program presented
here assume the same rate of operations as in fiscal year
2012. Actual cuts could differ once appropriations are
enacted for 2013.
Source: NEA calculations using U.S. Department of Education budget data and based on an analysis by the Center on Budget and Policy Priorities, Here's How the March 1 Sequester Would Work, January 22, 2013. For more information, contact Tom Zembar at 202.822.7109 or [email protected]. As of February 5, 2013.
Impact of Sequestration on Federal Education Programs
Source: NEA calculations using U.S. Department of Education budget data and based on an analysis by theCenter on Budget and Policy Priorities (CBPP). For more information, contact Tom Zembar at 202.822.7109or [email protected]. As of February 5, 2013.
Applying CBPP's Estimate
F I S C A
L Y E A R
2 0 1 3
Federal TRIO Programs (HEA IV-A-2, Chapter 1)
Impact of Sequestration on Federal Education Programs
The funding cut is equivalent to eliminating funded
enrollment slots that offer comprehensive early
learning and development services for this number
of children from low-income families
49thousand
18,965
$6.6
$7.0
$7.4
$7.8
$8.2
'11
(billions)
F I S C A
L Y E A R
2 0 1 3
$406million
FUNDING CUT
CHILDREN AFFECTED
The funding cut could lead to the elimination of this number
of jobs, which includes teachers, assistant teachers,
management staff, and other support staff
POTENTIAL JOB LOSSES
'13
26%
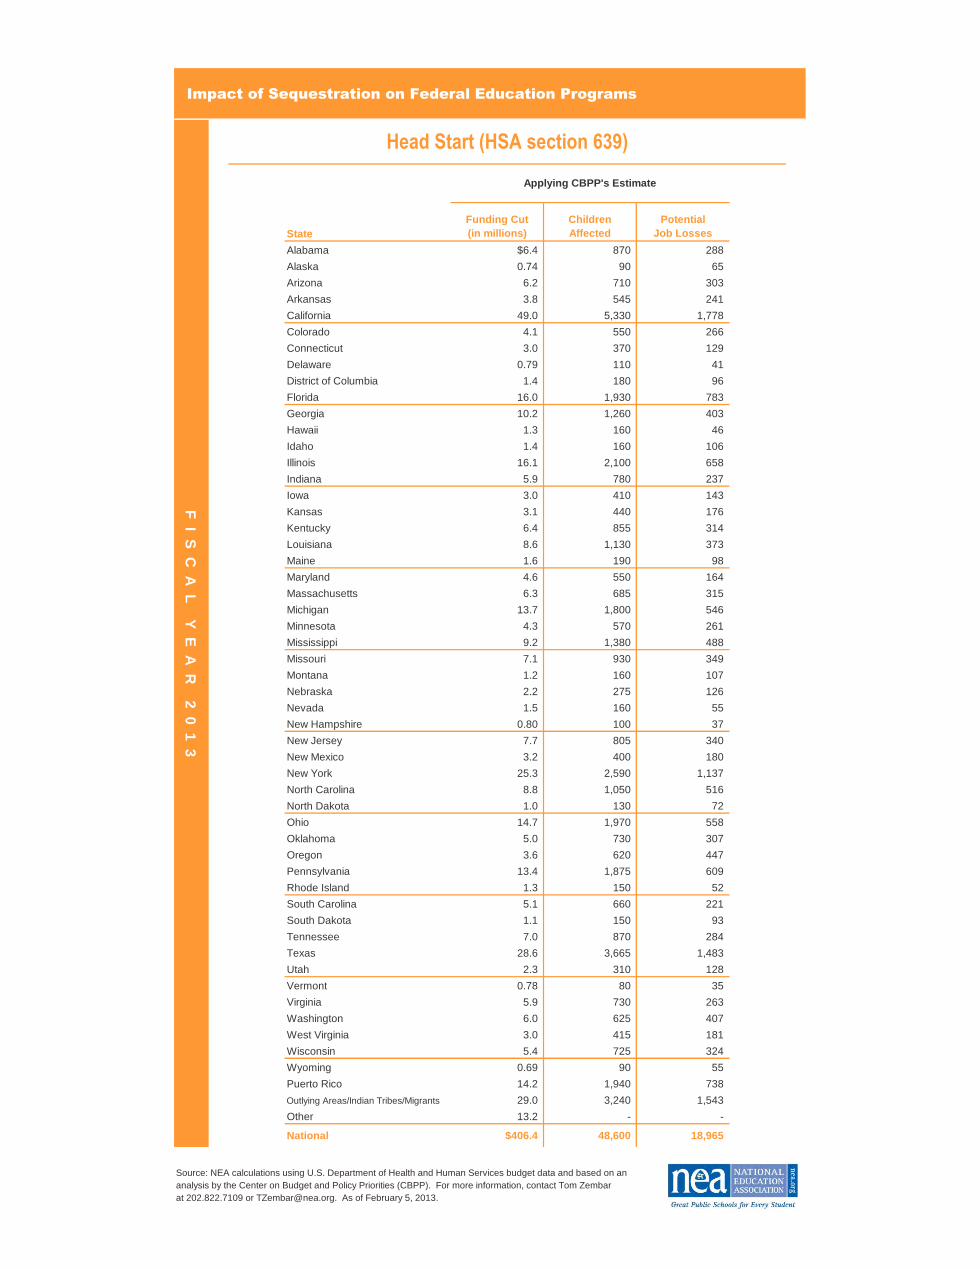
Head Start (HSA section 639)
Sequestration would roll back funding near the level in
2011
Poverty rate of children under age 5:
The number of children under age 5 in poverty:
5.1million
As a result of the "fiscal cliff" deal (American Taxpayer
Relief Act of 2012) reached at the beginning of the year,
sequestration, or automatic, across-the-board budget cuts,
was postponed by two months. Absent any agreement to
replace sequestration, budget cuts will be uniformly
applied to almost all federal programs beginning on
March 1, 2013. Due to the delay, however, the total
amount of the cut in fiscal year 2013 has been lessened by
$24 billion, from $109.3 billion to $85.3 billion. An
analysis by the Center on Budget and Policy Priorities
(CBPP) indicates that nonexempt, nondefense
discretionary programs would be cut by 5.1 percent; and
a cut of 5.3 percent would be applied to nonexempt,
nondefense mandatory programs. Since Congress has
not yet completed work on appropriations for fiscal year
2013, the estimated cuts by education program presented
here assume the same rate of operations as in fiscal year
2012. Actual cuts could differ once appropriations are
enacted for 2013.
Source: NEA calculations using U.S. Department of Health and Human Services budget data and based on an analysis by the Center on Budget and Policy Priorities, Here's How the March 1 Sequester Would Work, January 22, 2013. For more information, contact Tom Zembar at 202.822.7109 or [email protected]. As of February 5, 2013.
Impact of Sequestration on Federal Education Programs
Source: NEA calculations using U.S. Department of Health and Human Services budget data and based on ananalysis by the Center on Budget and Policy Priorities (CBPP). For more information, contact Tom Zembarat 202.822.7109 or [email protected]. As of February 5, 2013.


![Impact of Sequestration on Federal Education Programs Reformatted 06-26-12[1]](https://static.documents.pub/doc/80x56/577ce7511a28abf10394d734/impact-of-sequestration-on-federal-education-programs-reformatted-06-26-121.jpg)


