Translating Research into Action (TRAction) Implementation Research Embedded in Integrated Community Case Management (CCM) Program CCM: Improving Data to Improve Programs (CCM‐IDIP) Improving data use of routine CCM M&E by health workers: Case study in Malawi 9 th January 2014 Institute for International Programs Johns Hopkins University Bloomberg School of Public Health in collaboration with Save the Children, USA and the Malawi MOH/IMCI unit Supported by the United States Agency for International Development (USAID) through the Translating Research into Action (TRAction) project
Transcript
Translating Research into Action (TRAction)
Implementation Research Embedded in Integrated
Community Case Management (CCM) Program CCM: Improving Data to Improve Programs (CCM‐IDIP)
Improving data use of routine CCM M&E by health workers:
Case study in Malawi
9th January 2014
Institute for International Programs Johns Hopkins University Bloomberg School of Public Health
in collaboration with Save the Children, USA and the Malawi MOH/IMCI unit
Supported by the United States Agency for International Development (USAID) through the Translating Research into Action (TRAction) project
Executive summary Background The government of Malawi has been implementing integrated community case management (CCM) of common childhood illnesses since 2008 through provision of community-based services by Health Surveillance Assistants (HSAs). The “Implementation Research Embedded in Integrated Community Case Management (CCM) Program: Improving Data to Improve Programs (CCM-IDIP)” Translating Research into Action (TRAction) project is working with CCM programs in Malawi and other countries to improve monitoring and evaluation (M&E) and use of information. In 2012, we conducted a desk review and data quality assessment (DQA) of the current CCM M&E system in Malawi. We found a well-defined structure for routine reporting, and good levels of reporting and completeness. However, the data are not being use systematically to guide programs, and when they are used it is mostly at the higher levels of the health system rather than at district level and below. HSAs and their supervisors expressed a keen interest in understanding and using the data that they are collecting and reporting.
We worked with district health staff and partners to develop a program to increase data interpretation and use at the HSA, health facility, and district levels. The data interpretation and use (DI) package aims to improve data use and quality by giving health staff the tools to analyze and interpret the M&E CCM data they routinely report. The package includes:
(1) general training on data management, use and interpretation; (2) refresher training on the routine reporting forms; (3) data use templates for displaying the monthly CCM implementation strength data; (4) provision of calculators to assist with completing monitoring forms and (5) working with district staff to identify reporting benchmarks and action thresholds.
Methods The package was implemented in two districts of Malawi (Kasungu and Dowa). We conducted training-of-trainers with district health staff. The district health staff then provided training on the package to HSAs and HSA supervisors with supervision from STC and the MOH. All CCM-trained HSAs and their supervisors in the two districts were targeted for training. The DI package was implemented for at least three months in each district beginning in February 2013.
We assessed the effectiveness of the package by conducting an endline DQA of the routine monthly monitoring data in July 2013 and comparing with results from a baseline DQA June 2012. Both DQAs provided information on the routine reporting system We included variables for the reporting availability (forms submitted), and completeness (all components of forms are complete) for the previous reporting month (June 2013 versus May 2012). Reporting consistency (data quality of the forms) was assessed for the previous reporting month with completed data: June 2013 (or May if June forms were not available) versus May 2012 (or April if the May forms were not available).
In addition, in 2013, we collected information from participants on their experiences with the DI package as a basis for assessing the strengths and weaknesses.
Results
ii
Between baseline and endline, the level of availability and completeness of the routine monitoring forms was maintained in Kasungu but decreased in Dowa. Turnover of district staff and the termination of Save the Children (STC) CCM support in Dowa were cited as possible reasons for the decrease in reporting.
At the HSA level, both districts showed improvements in consistency of case reporting, particularly for children with fast breathing, which improved significantly since the 2012 baseline DQA. Changes in reporting quality were less apparent for drugs dispensed.
At the health facility level, reporting consistency remained at adequate levels with large variations in consistency for certain indicators such as lumefantrine/artemether (LA) stock-outs and HSAs residing in their catchment areas. Although the sample size is too small to make any definitive inferences, there is evidence that reporting for cases and drug stocks have improved. Supervision and mentoring reporting at the health facility level remains problematic.
Participants reported that the data use templates were easy to use and did not take long to complete (average 1 hour per month). DQA interviewers noted that most participants were displaying the completed templates at their practice site. All participants stated that the information displayed on the templates was used for programmatic decision-making. For instance, almost all the participants reported using the templates to track increases in child illness cases, and that they responded to these increases by conducting health talks and education campaigns in their catchment areas. The templates were used as occupational advocacy tools to improve working conditions: for example to request additional drugs or to show that some HSAs are receiving all the supervisory visits conducted by the health facilities, while other HSAs are receiving no supervision visits. At the health facilities, participants mentioned that the data are now available to everyone, whereas prior to the introduction of the package they were held by one person and others had no access to them.
Conclusion In general, we consider the implementation of this data use package to be a success. Users stated that the package was well received and useful to their CCM work. This innovative approach also seems feasible, and even easy, to integrate into the overall CCM program. The costs are reasonable at only 247 USD per health facility for implementation, training, and follow-up supervision.
There is evidence of improvements in monitoring data availability, completeness, and consistency from the baseline to endline, although it is difficult to attribute this to the package implementation. Due to budget and logistical constraints, we did not have a large enough sample size to conduct rigorous statistical testing. Despite this limitation, there is clear evidence that the health staff used the information produced through the data use package to improve the CCM program at the grassroots level, and we consider it a valuable resource. Due to the perceived value of the program and the relatively low cost and effort of implementation, we are recommending that this package be implemented at the national level in Malawi.
iii
Acknowledgements This report is the collaborative work of the Institute of International Programs at the Johns Hopkins University (IIP-JHU), Save the Children (STC), United States and Malawi Offices and the Malawi Ministry of Health/Integrated Management of Childhood Illnesses (MOH/IMCI). We thank the HSAs and health staff that participated in the study and who continue to provide services to sick children in hard-to-reach areas.
This study was supported by the American people through the United States Agency for International Development (USAID) and its Translating Research into Action (TRAction). TRAction is managed by University Research Co., LLC (URC) under the Cooperative Agreement Number GHS-A-00-09-00015-00. For more information on TRAction’s work, please visit http://www.tractionproject.org/.
Contributions The report was prepared by Elizabeth Hazel (IIP-JHU), Emmanuel Chimbalanga (STC), Tiyese Chimuna (STC), Tanya Guenther (STC), Humphreys Nsona (Malawi MOH), and Jennifer Bryce (IIP-JHU). Sara Riese (URC) provided feedback and Verna Scheeler (IIP-JHU) edited. Please direct any questions to Elizabeth Hazel at [email protected].
IIP – JHU Institute for International Programs, Johns Hopkins University
IMCI Integrated management of childhood illnesses
LA lumefantrine/artemether
M&E Monitoring and evaluation
MOH Ministry of Health
ORS Oral rehydration salts
PRISM Performance of routine information systems management
RVR Results verification ratio
SSDI Support for service delivery integration
STC Save the Children
TOT Training of trainers
URC University Research Co., LLC
USAID United States Agency for International Development
vi
Background
The government of Malawi has been implementing integrated community case management (CCM) of common childhood illnesses since 2008 through provision of community-based services by Health Surveillance Assistants (HSAs). The “Implementation Research Embedded in Integrated Community Case Management (CCM) Program: Improving Data to Improve Programs (CCM-IDIP)” Translating Research into Action (TRAction) project is working with CCM programs in Malawi and other countries to improve monitoring, evaluation and use of information. To achieve this goal, we undertake implementation research that addresses the following specific objectives:
1) Desk review and data quality assessment: To assess CCM monitoring and evaluation systems and existing and routine data sources through application and data quality assessment of CCM Benchmark indicators1,2;
2) National and district level stakeholder consultations: To identify priority gaps in CCM M&E systems and potential innovative approaches to data collection;
3) Implement “innovative” approaches: To examine the feasibility, cost and quality of innovative data collection approaches for needed CCM M&E systems and/or indicators; and
4) To document the benefits and use of improved CCM monitoring systems, data collection methods and indicators in programmatic decisions at district and national level.
We have carried out three major activities addressing objectives 1, 2, and 3 to date. In March 2012, we conducted a desk review to determine the availability of the CCM Benchmark indicators in Malawi and stakeholder consultations with national level program implementers to identify and prioritize gaps in the monitoring and evaluation systems and generate ideas for potential innovations to address these gaps. In May 2012, we conducted a data quality assessment (DQA) in two districts to review current data collection forms and systems to assess the CCM monitoring strategy at the community, primary health facility and district levels.
Through the desk review, stakeholder consultations, and preliminary findings of the DQA, data quality and use was highlighted as an important gap in the national M&E system. Currently, the monthly reporting forms are filled in at the village clinic (HSA) level, submitted to the health facilities to be compiled and submitted to the district for additional compilation and finally to the national level. The data are not retained at lower levels where health staff can use them to inform and improve the CCM program. Also problematic, national level data are aggregated at the district only and do not provide health facility or village clinic-level information. Data quality was listed as a concern among the participants in the data quality assessment, and highlighted the interrelationship between data quality and data use. If health staff have better access to the data and assistance with interpretation and analysis, the monitoring data may be seen as more valuable and the quality more important.
Together with the MOH, we developed a data use improvement (DI) package to improve data analysis, interpretation and use at the health facility and HSA levels. In order to assess the package
1 Malawi desk review and stakeholder consultations of CCM M&E, April 2012 2 Malawi Rapid Data Quality Assessment Report, October 2012
7
implementation, we conducted a second data quality assessment to determine if data use and quality have improved. The activity included key informant interviews to document the successes, challenges, and the feasibility of scaling-up the package.
Objectives:
The objectives of this report are to:
1. Describe the implementation and costs of the DI package in the two districts;
2. Describe any changes in data collection and reporting since the baseline data quality assessment;
3. Document and assess any differences in the availability, completeness and quality of the monitoring data since the baseline DQA;
4. Assess the strength of the data use and improvement package implementation by measuring the proportion of health workers using the templates;
5. Explore how the templates are affecting how health staff use CCM data in program management and decision making; and
6. Identify any successes, challenges, and areas of improvement in the package implementation.
Methods
Implementation of the DI package As one of the innovative approaches (objective 3), we have implemented a data use improvement (DI) package at the health facility and HSA levels. The DI package included:
• General training on data management, use and interpretation;
• Data use templates for displaying the monthly CCM implementation strength data;
• Provision of calculators to HSAs and senior HSAs to assist with completing monitoring forms;
• Refresher training for HSAs and senior HSAs on completing the monthly reporting forms and
• Working with district IMCI coordinator to identify reporting “benchmarks” and “action thresholds” and agree on steps that would be taken when levels are below the agreed upon action thresholds.
This method was proposed during an advisory meeting with district health officials, the IMCI unit of the MOH and Save the Children in Lilongwe on 17 October 2012. Participants reviewed the approach and gave feedback was incorporated in the protocol.
8
Geographic scope
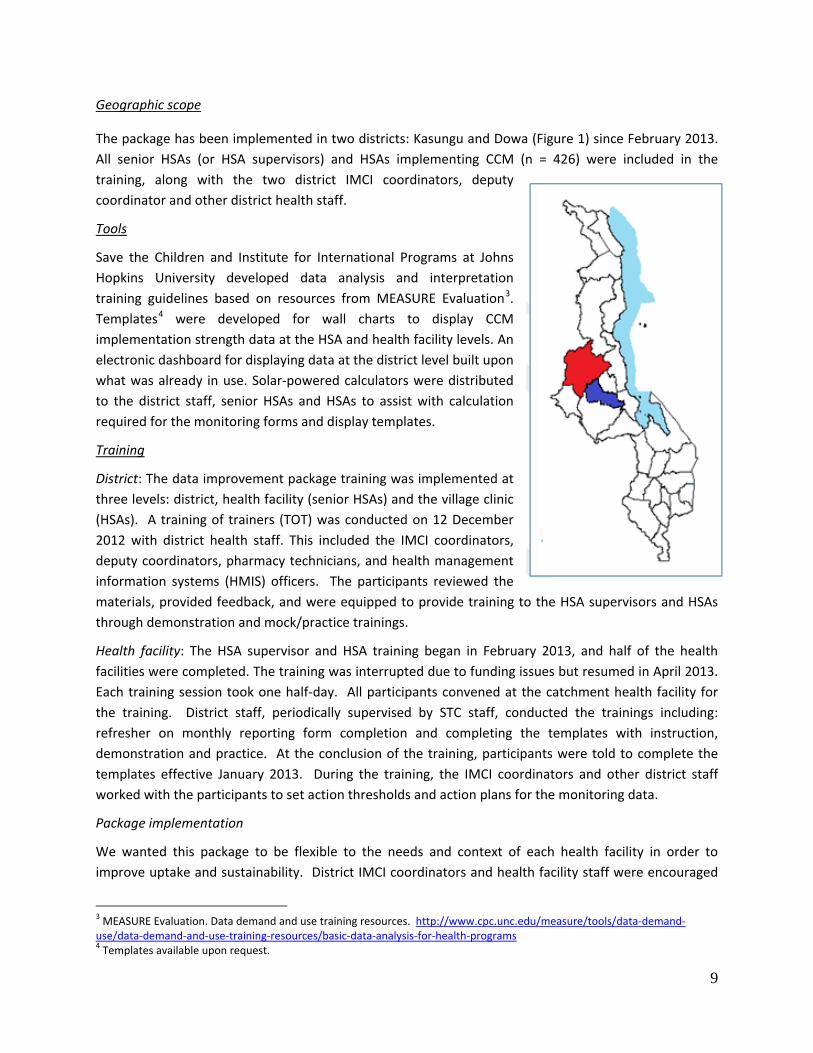
The package has been implemented in two districts: Kasungu and Dowa (Figure 1) since February 2013. All senior HSAs (or HSA supervisors) and HSAs implementing CCM (n = 426) were included in the training, along with the two district IMCI coordinators, deputy coordinator and other district health staff.
Tools
Save the Children and Institute for International Programs at Johns Hopkins University developed data analysis and interpretation training guidelines based on resources from MEASURE Evaluation3. Templates4 were developed for wall charts to display CCM implementation strength data at the HSA and health facility levels. An electronic dashboard for displaying data at the district level built upon what was already in use. Solar-powered calculators were distributed to the district staff, senior HSAs and HSAs to assist with calculation required for the monitoring forms and display templates.
Training
District: The data improvement package training was implemented at three levels: district, health facility (senior HSAs) and the village clinic (HSAs). A training of trainers (TOT) was conducted on 12 December 2012 with district health staff. This included the IMCI coordinators, deputy coordinators, pharmacy technicians, and health management information systems (HMIS) officers. The participants reviewed the materials, provided feedback, and were equipped to provide training to the HSA supervisors and HSAs through demonstration and mock/practice trainings.
Health facility: The HSA supervisor and HSA training began in February 2013, and half of the health facilities were completed. The training was interrupted due to funding issues but resumed in April 2013. Each training session took one half-day. All participants convened at the catchment health facility for the training. District staff, periodically supervised by STC staff, conducted the trainings including: refresher on monthly reporting form completion and completing the templates with instruction, demonstration and practice. At the conclusion of the training, participants were told to complete the templates effective January 2013. During the training, the IMCI coordinators and other district staff worked with the participants to set action thresholds and action plans for the monitoring data.
Package implementation
We wanted this package to be flexible to the needs and context of each health facility in order to improve uptake and sustainability. District IMCI coordinators and health facility staff were encouraged
3 MEASURE Evaluation. Data demand and use training resources. http://www.cpc.unc.edu/measure/tools/data-demand-use/data-demand-and-use-training-resources/basic-data-analysis-for-health-programs 4 Templates available upon request.
Figure 1. Study districts Kasungu (red) Dowa (blue)
to determine many of the implementation details, such as how the templates were filled-in (either directly from the CCM register or the completed monthly reporting forms) and where exactly the templates should be displayed. Supervision of the package implementation by STC staff was minimal as we aimed to assess effectiveness of this package in a “real-world” scenario as opposed to a research study with additional supports that would be difficult to implement routinely. STC conducted a one-week supervision field mission to Kasungu district to observe template use in health facilities and village clinics. The district staff conducted supervisory and mentoring visits as part of their routine supervision activities to HSAs and senior HSAs and monitored the template use.
Data Quality Assessment The 2012 data quality assessment provided information on the routine reporting system. This included the availability (forms submitted), completeness (all components of forms are complete), and reporting consistency (data quality) of current data, in particular, its use for decision-making and identifying areas for improvements. For further information, please see 2012 Data Quality Assessment report. 5 In 2013, after implementation of the DI package, we conducted a follow-up data quality assessment. In this section, we describe the implementation of the 2013 DQA and note any differences to the 2012 DQA methodology.
Sampling of health facilities and HSAs
In the baseline data quality assessment, we randomly selected four health facilities and included the district hospital in each district. Four HSAs from each health facility catchment area were randomly selected from a full list of HSAs trained and deployed in CCM in the hard-to-reach areas obtained from the MOH/IMCI unit and partners. For the endline assessment, we revisited those previously selected 10 health facilities and HSAs in the catchment area. Any HSAs not available during the period of data collection was replaced with a neighboring HSA.
Data collection tools
We revised the baseline data collection tools for the endline DQA and included reviews of the existing data collection and compilation tools. For the endline DQA, we added questions on the DI package use and perceptions. The data tools6 were originally adapted from frameworks and assessment tools for data quality audits (DQA)7,8 and for assessing the performance of routine information systems management (PRISM).9 Representatives from the MOH/IMCI and the District Health Office (DHO) provided feedback during the development at both baseline and endline, and the tools were piloted during the 2013 training.
5 Malawi Rapid Data Quality Assessment Report, October 2012. 6 Data collection tools available upon request. 7Ronveaux O, Rickert D, Hadler S, Groom H, Lloyd J, Bchir A, et al. The immunization data quality audit: verifying the quality and consistency of immunization monitoring systems. Bull World Health Organ. 2005; 83(7): 503-10. 8MEASURE_Evaluation. Data Quality Audit Tool: Guidelines for Implementation; 2008. 9Aqil A, Lippeveld T, Hozumi D. PRISM Framework: A Paradigm Shift for Designing, Strengthening and Evaluating Routine Health Information Systems. . Health Policy and Planning. 2009; 24(3): 217-28
10
Composition and training of data collection teams
The data collection teams in the field included representatives from STC, the MOH/IMCI Unit and technical officers from two DHOs. Kasungu and Dowa DHO staff were invited to work as data collectors during this exercise to provide valuable input during the study. In July 2013, the data collectors were trained for two days and then completed a one-day pilot and practice of the tools and protocols at two health facilities and with two HSAs in Dowa district. The MOH district staff did not work in their own district to minimize bias.
On the first day, a brief presentation was given on the project activities and the importance of HSAs, health facility and the districts to analyze locally-generated data for decision-making and program improvement. The team reviewed each question from the data collection forms facilitated jointly by Save the Children and the IMCI Unit. This was done to ensure understanding on the phrasing and probing approach of the questions and to clarify any issues/concerns from the team.
After review of the questionnaires, the team was divided into two teams to prepare for the pilot exercise, which took place on the second day of the training. During this exercise, each team was tasked to interview two senior HSAs and two HSAs.
On day three, teams were requested to present on their pilot test field experiences. Suggestions for further modifications to the tools and other recommendations on logistics support were made. The afternoon of the third day was spent on developing a schedule for the actual data collection for Dowa and Kasungu districts. A list of health facilities and sampled HSAs was shared, contact details for the interviews were made available from both districts, and the total number of days required for the exercise was agreed upon.
Data collection in districts
The data collection was carried out over a two-week period in July 2013. Teams visited the districts and used DQA Form 1 to guide discussions and assessment of forms and the data use package at the district level. The teams visited the selected health facilities and applied the DQA Form 2. Two senior staff, from both the STC office and the MOH/IMCI, attended the interviews in both districts to provide consistency and supervision. Data were collected on paper and scanned/emailed to IIP-JHU and STC for analysis.
Analysis
Our analysis focused on describing any changes in the M&E system since the 2012 assessment. We described changes in the availability and completeness of the routine forms for the previous reporting month (June 2013) compared to the 2012 (May) data. The reporting consistency of the routine forms was assessed for the previous month with complete data, either June or May 2013as compared to the 2012 data (May or April). at the HSA (Form 1A) and health facility (Form 1B) levels. Although the baseline was conducted in June and the endline in July, we consider the time-period to be comparable to take into account any seasonal differences in reporting availability, completeness, and consistency.
11
To measure reporting consistency, we calculated the “result verification ratio”10 for key indicators, such as the number of sick children treated in the community over a one-month period. The results verification ratio (RVR) is defined as:
Results verification ratio: HF =
Sum of verified counts from the HSA reports Total count reported in the health facility report
Results verification ratio: HSA = Verified (from register) counts from HSA Reported counts (summary report) from the HSA
An RVR of 1.00 is perfect reporting, while less than 1.00 indicates over-reporting and more than 1.00 under-reporting. We considered a RVR of less than 0.8 (20% over-reporting) or more than 1.20 (20% under-reporting) to be problematic.
We used a t-test analysis to examine whether the RVRs have changed from baseline to endline. The information collected on the successes, challenges and the perceived value of the data use and improvement package will be used in a feasibility analysis to evaluate the package’s potential for success, should it be scaled-up in Malawi.
Dissemination
The results and analyses will be reviewed with key stakeholders to assist in interpretation and recommendations. The preliminary findings were presented to MOH officials in September 2013. Preliminary results were shown globally at an international conference and during a Malawi national stakeholder meeting in November 2013.
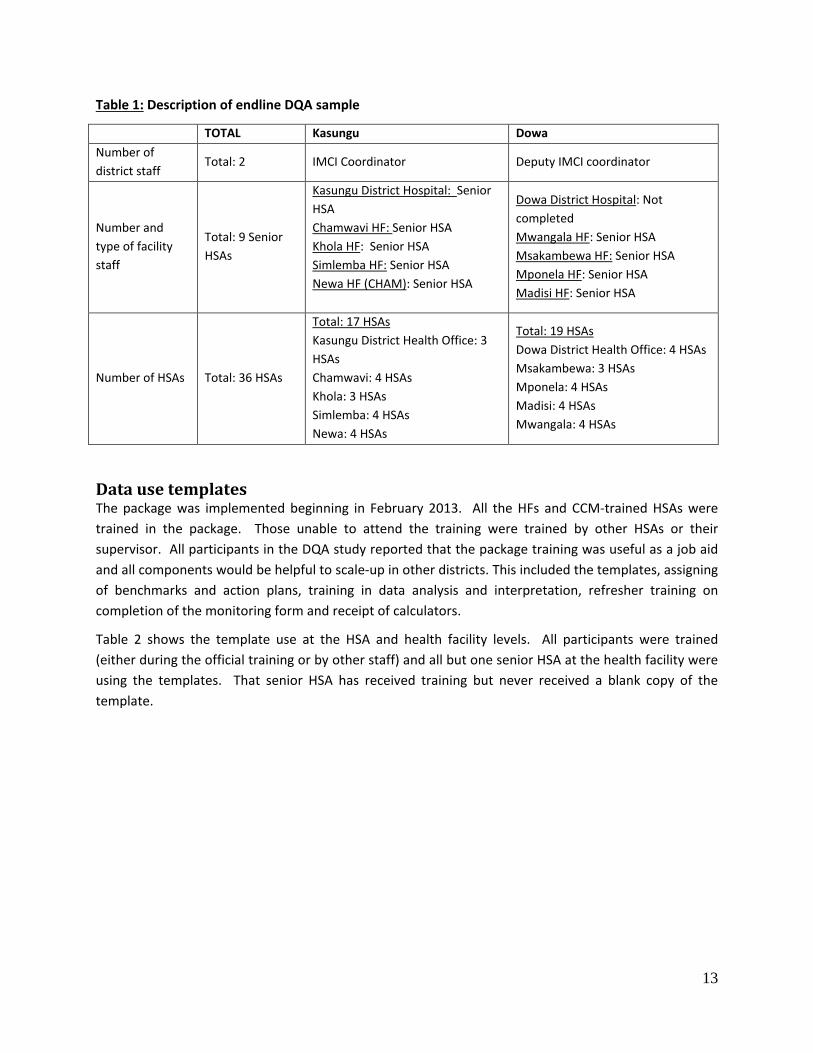
Results and interpretation Table 1 shows the number of district staff, health facility staff, and HSAs interviewed in the endline DQA. As in the baseline, we used Form 1 to interview either the IMCI coordinator or deputy coordinator, although there was turnover since 2012. Nine senior HSAs were interviewed using Form 2; we were unable to interview the Dowa district hospital. Thirty-six HSAs were interviewed in both districts. The majority were revisited from the baseline 2012 DQA, but there was some turnover (6% (1/17) in Kasungu and 32% (6/19) in Dowa). In cases of turnover, another HSA was randomly selected from that health facility catchment area.
10MEASURE_Evaluation. Data Quality Audit Tool: Guidelines for Implementation; 2008.
Data use templates The package was implemented beginning in February 2013. All the HFs and CCM-trained HSAs were trained in the package. Those unable to attend the training were trained by other HSAs or their supervisor. All participants in the DQA study reported that the package training was useful as a job aid and all components would be helpful to scale-up in other districts. This included the templates, assigning of benchmarks and action plans, training in data analysis and interpretation, refresher training on completion of the monitoring form and receipt of calculators.
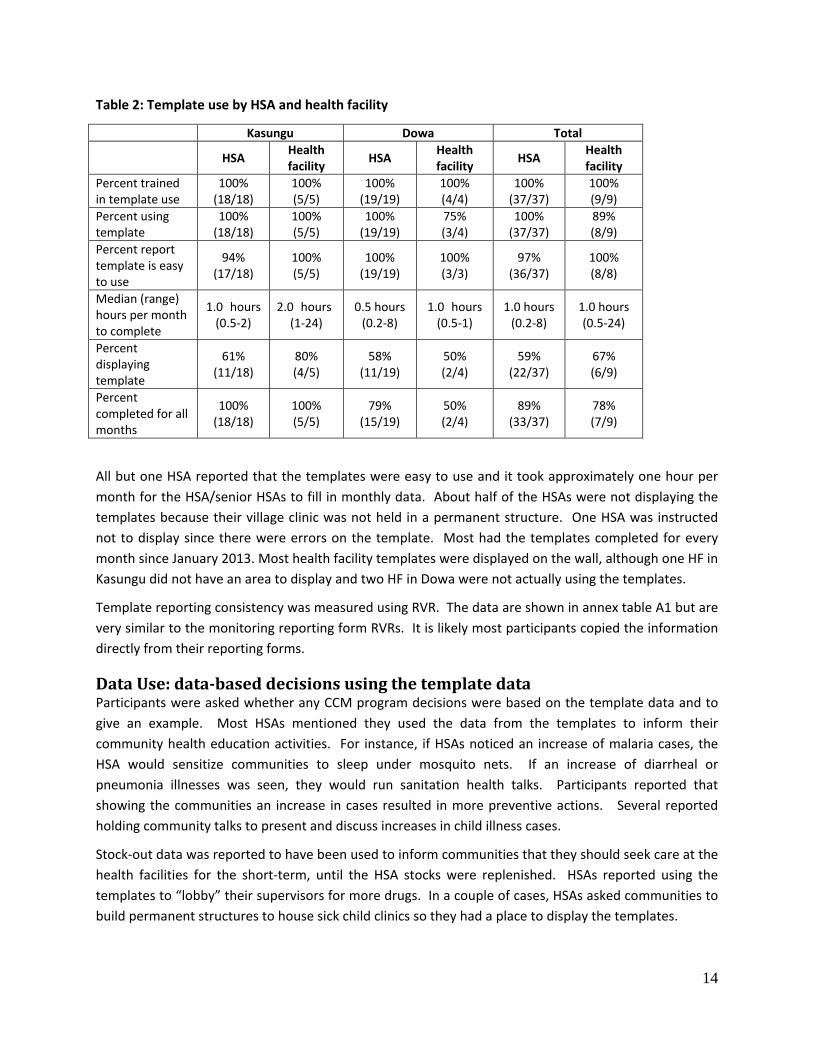
Table 2 shows the template use at the HSA and health facility levels. All participants were trained (either during the official training or by other staff) and all but one senior HSA at the health facility were using the templates. That senior HSA has received training but never received a blank copy of the template.
13
Table 2: Template use by HSA and health facility
Kasungu Dowa Total HSA Health
facility HSA Health facility HSA Health
facility Percent trained in template use
100% (18/18)
100% (5/5)
100% (19/19)
100% (4/4)
100% (37/37)
100% (9/9)
Percent using template
100% (18/18)
100% (5/5)
100% (19/19)
75% (3/4)
100% (37/37)
89% (8/9)
Percent report template is easy to use
94% (17/18)
100% (5/5)
100% (19/19)
100% (3/3)
97% (36/37)
100% (8/8)
Median (range) hours per month to complete
1.0 hours (0.5-2)
2.0 hours (1-24)
0.5 hours (0.2-8)
1.0 hours (0.5-1)
1.0 hours (0.2-8)
1.0 hours (0.5-24)
Percent displaying template
61% (11/18)
80% (4/5)
58% (11/19)
50% (2/4)
59% (22/37)
67% (6/9)
Percent completed for all months
100% (18/18)
100% (5/5)
79% (15/19)
50% (2/4)
89% (33/37)
78% (7/9)
All but one HSA reported that the templates were easy to use and it took approximately one hour per month for the HSA/senior HSAs to fill in monthly data. About half of the HSAs were not displaying the templates because their village clinic was not held in a permanent structure. One HSA was instructed not to display since there were errors on the template. Most had the templates completed for every month since January 2013. Most health facility templates were displayed on the wall, although one HF in Kasungu did not have an area to display and two HF in Dowa were not actually using the templates.
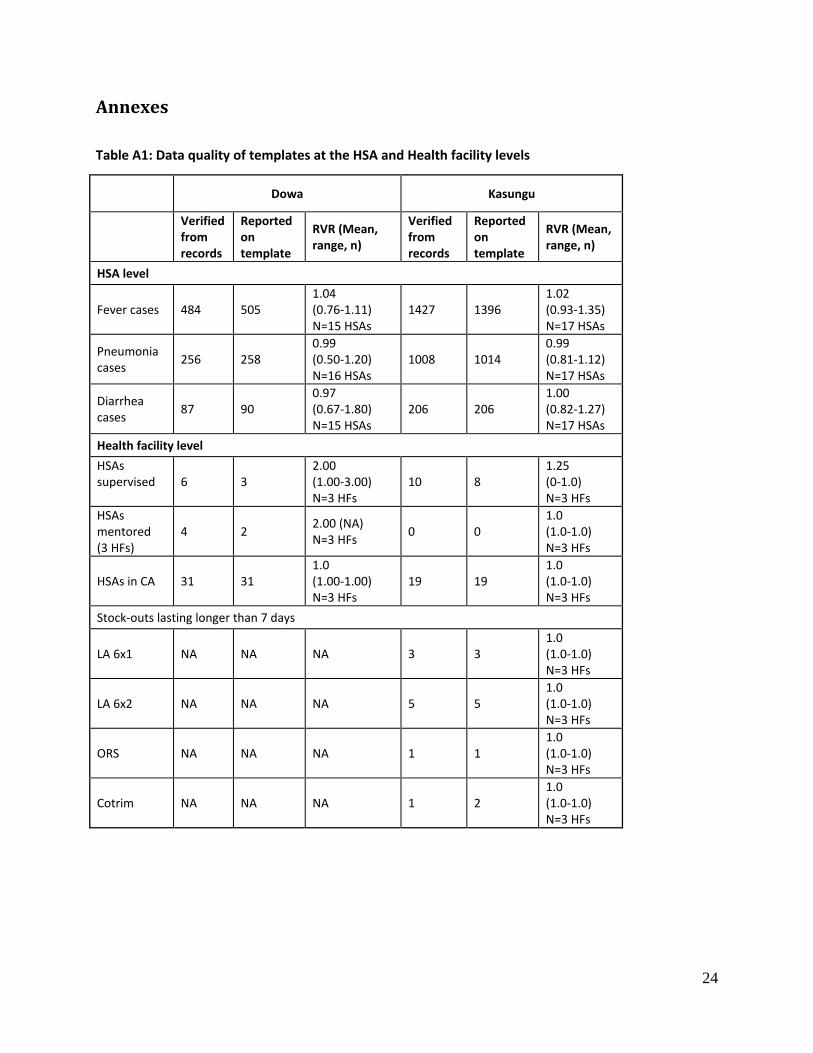
Template reporting consistency was measured using RVR. The data are shown in annex table A1 but are very similar to the monitoring reporting form RVRs. It is likely most participants copied the information directly from their reporting forms.
Data Use: data-based decisions using the template data Participants were asked whether any CCM program decisions were based on the template data and to give an example. Most HSAs mentioned they used the data from the templates to inform their community health education activities. For instance, if HSAs noticed an increase of malaria cases, the HSA would sensitize communities to sleep under mosquito nets. If an increase of diarrheal or pneumonia illnesses was seen, they would run sanitation health talks. Participants reported that showing the communities an increase in cases resulted in more preventive actions. Several reported holding community talks to present and discuss increases in child illness cases.
Stock-out data was reported to have been used to inform communities that they should seek care at the health facilities for the short-term, until the HSA stocks were replenished. HSAs reported using the templates to “lobby” their supervisors for more drugs. In a couple of cases, HSAs asked communities to build permanent structures to house sick child clinics so they had a place to display the templates.
14
Senior HSAs at the health facilities reported using their template data to make staffing decisions, e.g. deploying HSAs to vacant areas and asking the district to allocate additional CCM-trained HSAs. One health facility indicated that the templates helped them better track the number of stock-outs, and they began ordering more drugs further in advance. Another supervisor showed the data to the facility in-charge to assist with drug procurement. If many HSAs reported not residing in their catchment area, supervisors would reinforce the importance of this during staff meetings. Another HF reported that an unusually high number of pneumonia cases were reported by HSAs, so the supervisor convened a CCM meeting and provided refreshers on following the CCM manual and counting respiration rates.
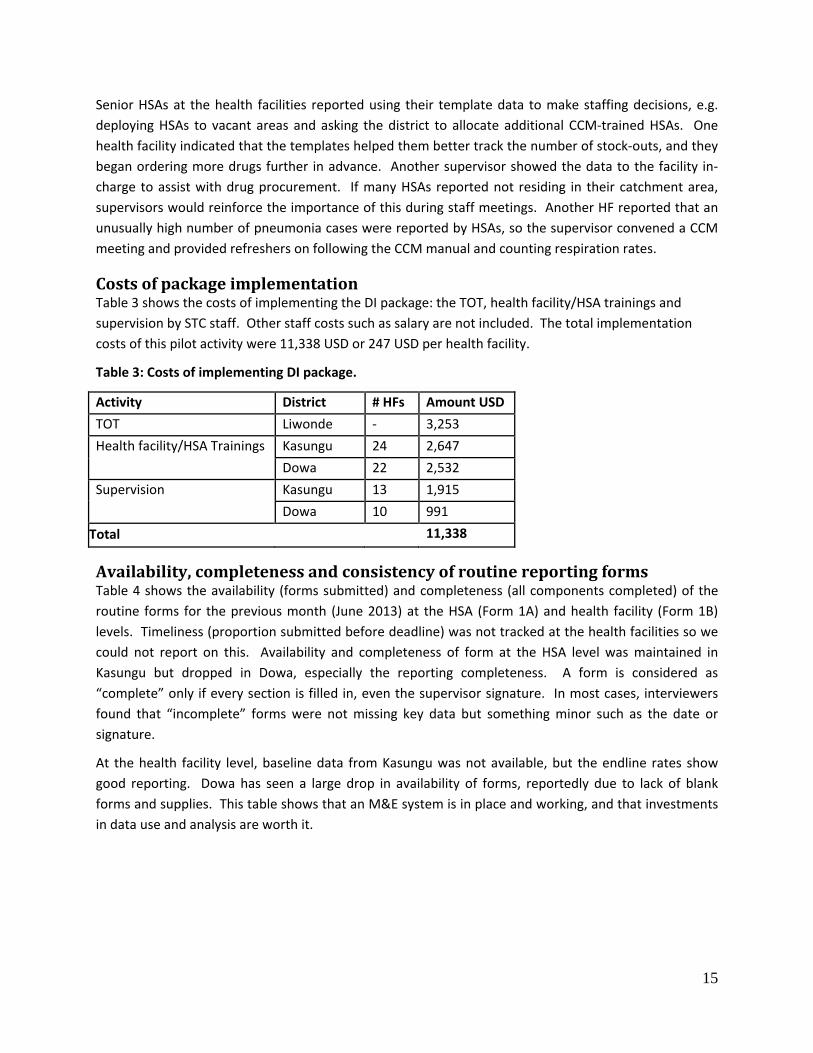
Costs of package implementation Table 3 shows the costs of implementing the DI package: the TOT, health facility/HSA trainings and supervision by STC staff. Other staff costs such as salary are not included. The total implementation costs of this pilot activity were 11,338 USD or 247 USD per health facility.
Table 3: Costs of implementing DI package.
Activity District # HFs Amount USD TOT Liwonde - 3,253 Health facility/HSA Trainings Kasungu 24 2,647
Dowa 22 2,532 Supervision Kasungu 13 1,915
Dowa 10 991 Total 11,338
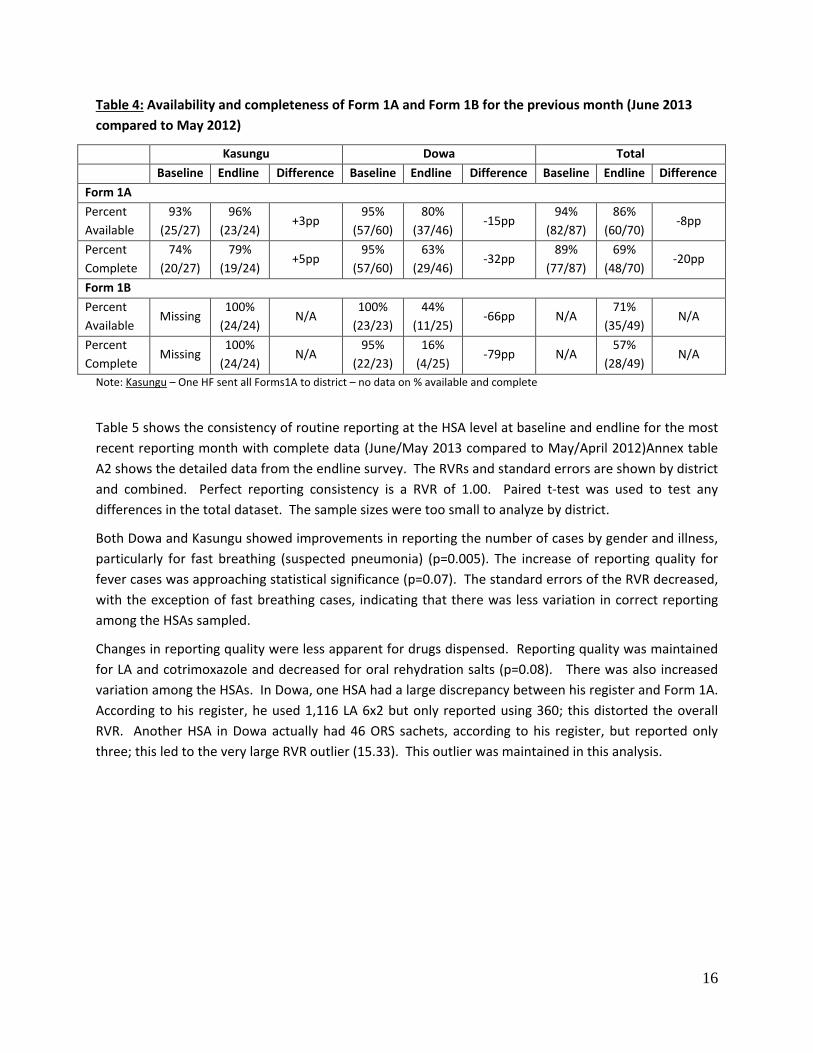
Availability, completeness and consistency of routine reporting forms Table 4 shows the availability (forms submitted) and completeness (all components completed) of the routine forms for the previous month (June 2013) at the HSA (Form 1A) and health facility (Form 1B) levels. Timeliness (proportion submitted before deadline) was not tracked at the health facilities so we could not report on this. Availability and completeness of form at the HSA level was maintained in Kasungu but dropped in Dowa, especially the reporting completeness. A form is considered as “complete” only if every section is filled in, even the supervisor signature. In most cases, interviewers found that “incomplete” forms were not missing key data but something minor such as the date or signature.
At the health facility level, baseline data from Kasungu was not available, but the endline rates show good reporting. Dowa has seen a large drop in availability of forms, reportedly due to lack of blank forms and supplies. This table shows that an M&E system is in place and working, and that investments in data use and analysis are worth it.
15
Table 4: Availability and completeness of Form 1A and Form 1B for the previous month (June 2013 compared to May 2012)
Kasungu Dowa Total Baseline Endline Difference Baseline Endline Difference Baseline Endline Difference Form 1A Percent Available
93% (25/27)
96% (23/24)
+3pp 95%
(57/60) 80%
(37/46) -15pp
94% (82/87)
86% (60/70)
-8pp
Percent Complete
74% (20/27)
79% (19/24)
+5pp 95%
(57/60) 63%
(29/46) -32pp
89% (77/87)
69% (48/70)
-20pp
Form 1B Percent Available
Missing 100%
(24/24) N/A
100% (23/23)
44% (11/25)
-66pp N/A 71%
(35/49) N/A
Percent Complete
Missing 100%
(24/24) N/A
95% (22/23)
16% (4/25)
-79pp N/A 57%
(28/49) N/A
Note: Kasungu – One HF sent all Forms1A to district – no data on % available and complete
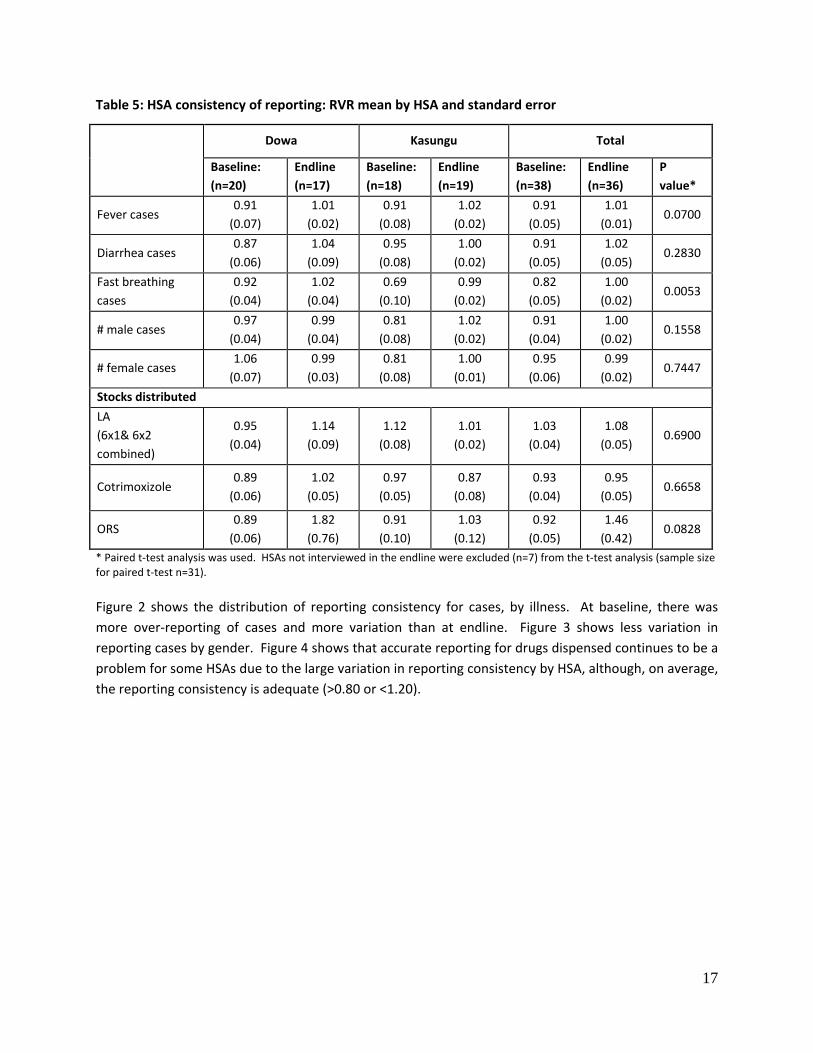
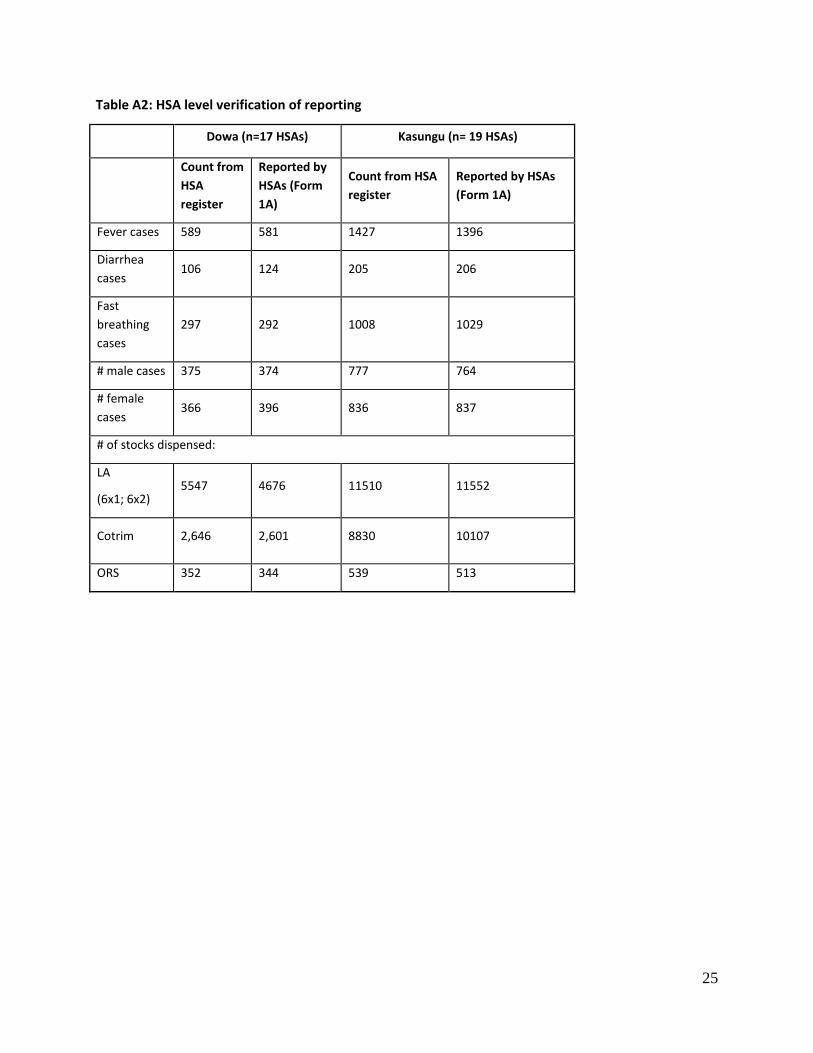
Table 5 shows the consistency of routine reporting at the HSA level at baseline and endline for the most recent reporting month with complete data (June/May 2013 compared to May/April 2012)Annex table A2 shows the detailed data from the endline survey. The RVRs and standard errors are shown by district and combined. Perfect reporting consistency is a RVR of 1.00. Paired t-test was used to test any differences in the total dataset. The sample sizes were too small to analyze by district.
Both Dowa and Kasungu showed improvements in reporting the number of cases by gender and illness, particularly for fast breathing (suspected pneumonia) (p=0.005). The increase of reporting quality for fever cases was approaching statistical significance (p=0.07). The standard errors of the RVR decreased, with the exception of fast breathing cases, indicating that there was less variation in correct reporting among the HSAs sampled.
Changes in reporting quality were less apparent for drugs dispensed. Reporting quality was maintained for LA and cotrimoxazole and decreased for oral rehydration salts (p=0.08). There was also increased variation among the HSAs. In Dowa, one HSA had a large discrepancy between his register and Form 1A. According to his register, he used 1,116 LA 6x2 but only reported using 360; this distorted the overall RVR. Another HSA in Dowa actually had 46 ORS sachets, according to his register, but reported only three; this led to the very large RVR outlier (15.33). This outlier was maintained in this analysis.
16
Table 5: HSA consistency of reporting: RVR mean by HSA and standard error
Dowa Kasungu Total
Baseline: (n=20)
Endline (n=17)
Baseline: (n=18)
Endline (n=19)
Baseline: (n=38)
Endline (n=36)
P value*
Fever cases 0.91
(0.07) 1.01
(0.02) 0.91
(0.08) 1.02
(0.02) 0.91
(0.05) 1.01
(0.01) 0.0700
Diarrhea cases 0.87
(0.06) 1.04
(0.09) 0.95
(0.08) 1.00
(0.02) 0.91
(0.05) 1.02
(0.05) 0.2830
Fast breathing cases
0.92 (0.04)
1.02 (0.04)
0.69 (0.10)
0.99 (0.02)
0.82 (0.05)
1.00 (0.02)
0.0053
# male cases 0.97
(0.04) 0.99
(0.04) 0.81
(0.08) 1.02
(0.02) 0.91
(0.04) 1.00
(0.02) 0.1558
# female cases 1.06
(0.07) 0.99
(0.03) 0.81
(0.08) 1.00
(0.01) 0.95
(0.06) 0.99
(0.02) 0.7447
Stocks distributed LA (6x1& 6x2 combined)
0.95 (0.04)
1.14 (0.09)
1.12 (0.08)
1.01 (0.02)
1.03 (0.04)
1.08 (0.05)
0.6900
Cotrimoxizole 0.89
(0.06) 1.02
(0.05) 0.97
(0.05) 0.87
(0.08) 0.93
(0.04) 0.95
(0.05) 0.6658
ORS 0.89
(0.06) 1.82
(0.76) 0.91
(0.10) 1.03
(0.12) 0.92
(0.05) 1.46
(0.42) 0.0828
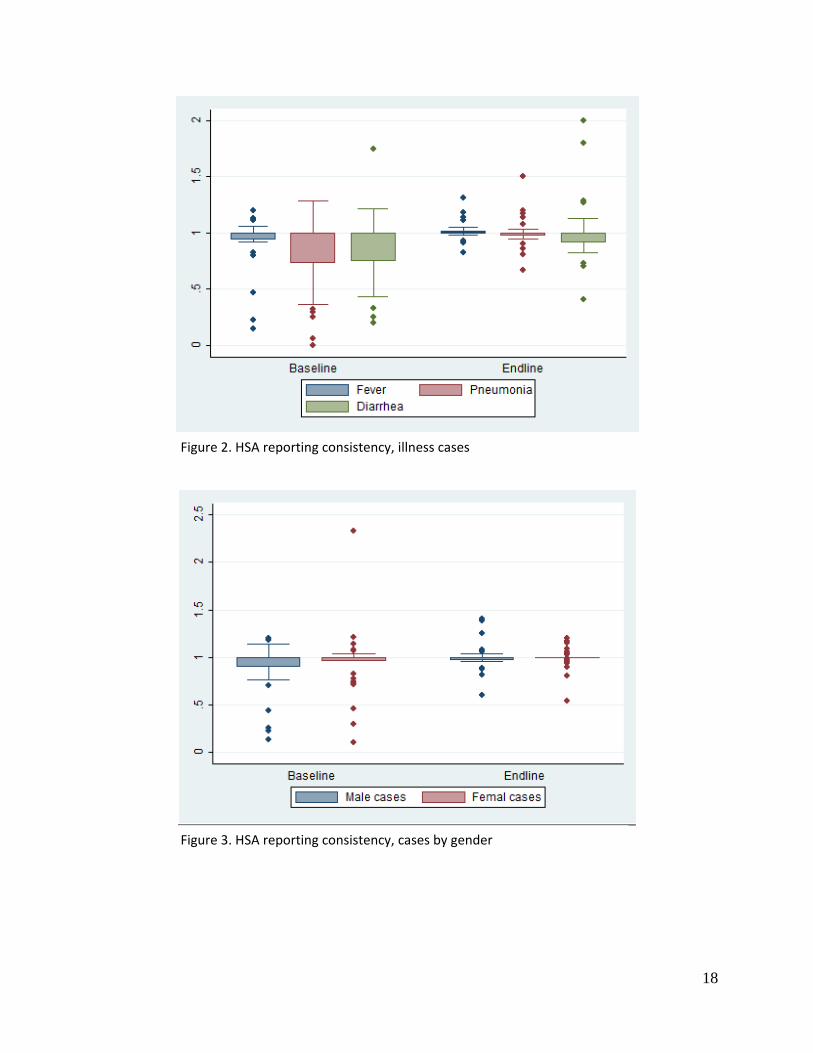
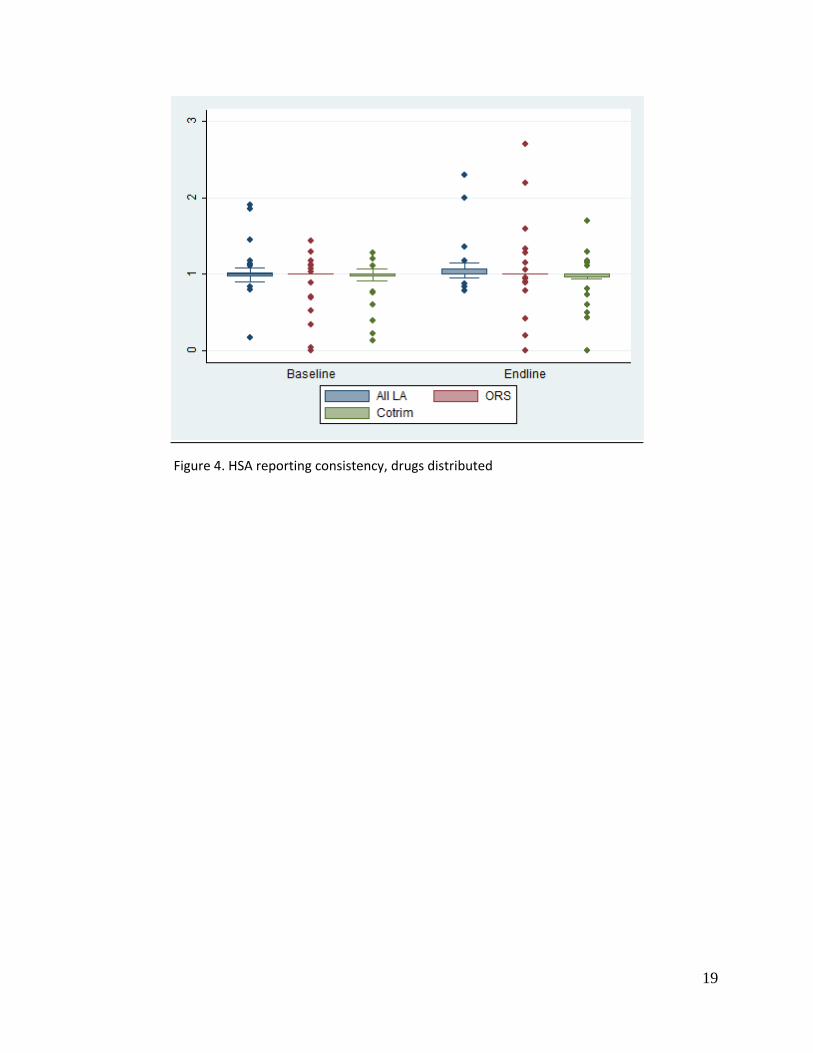
* Paired t-test analysis was used. HSAs not interviewed in the endline were excluded (n=7) from the t-test analysis (sample size for paired t-test n=31). Figure 2 shows the distribution of reporting consistency for cases, by illness. At baseline, there was more over-reporting of cases and more variation than at endline. Figure 3 shows less variation in reporting cases by gender. Figure 4 shows that accurate reporting for drugs dispensed continues to be a problem for some HSAs due to the large variation in reporting consistency by HSA, although, on average, the reporting consistency is adequate (>0.80 or <1.20).
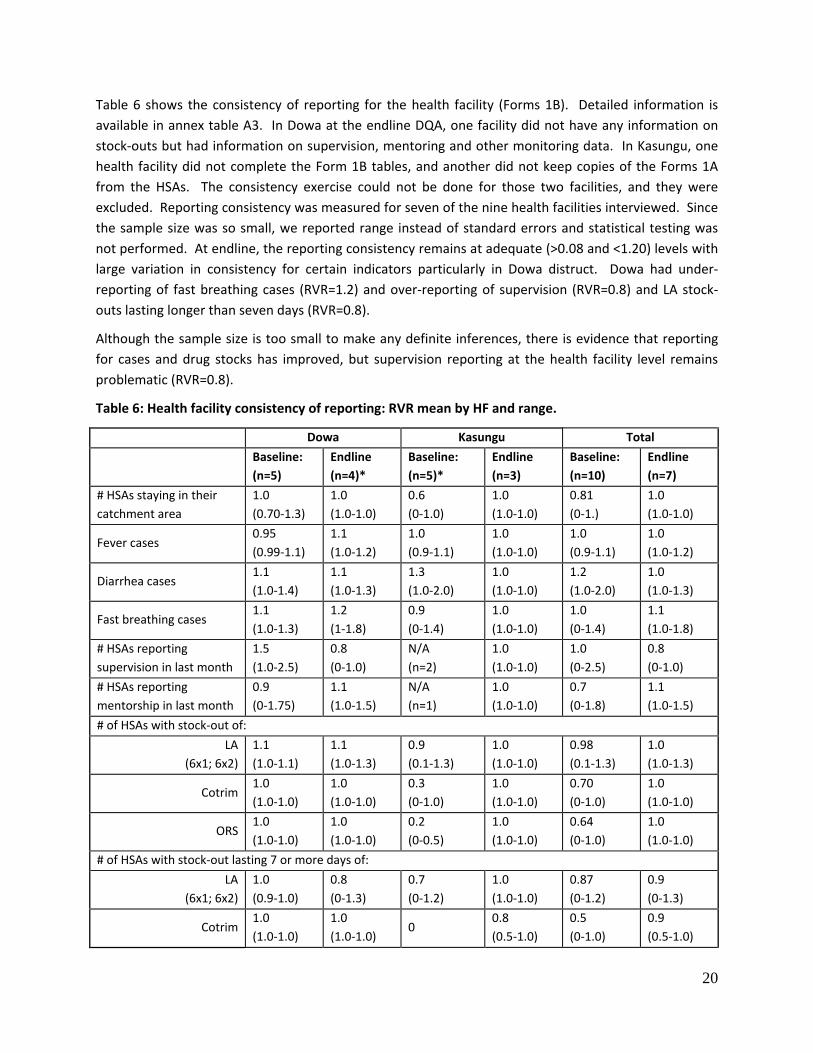
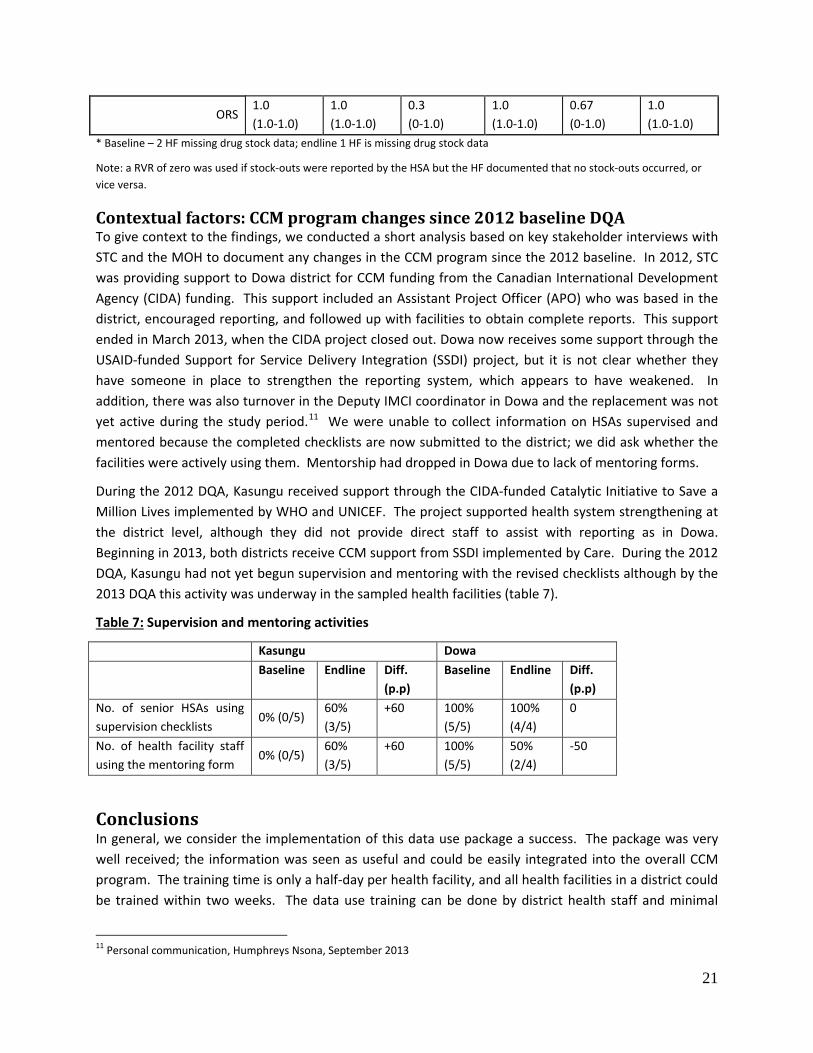
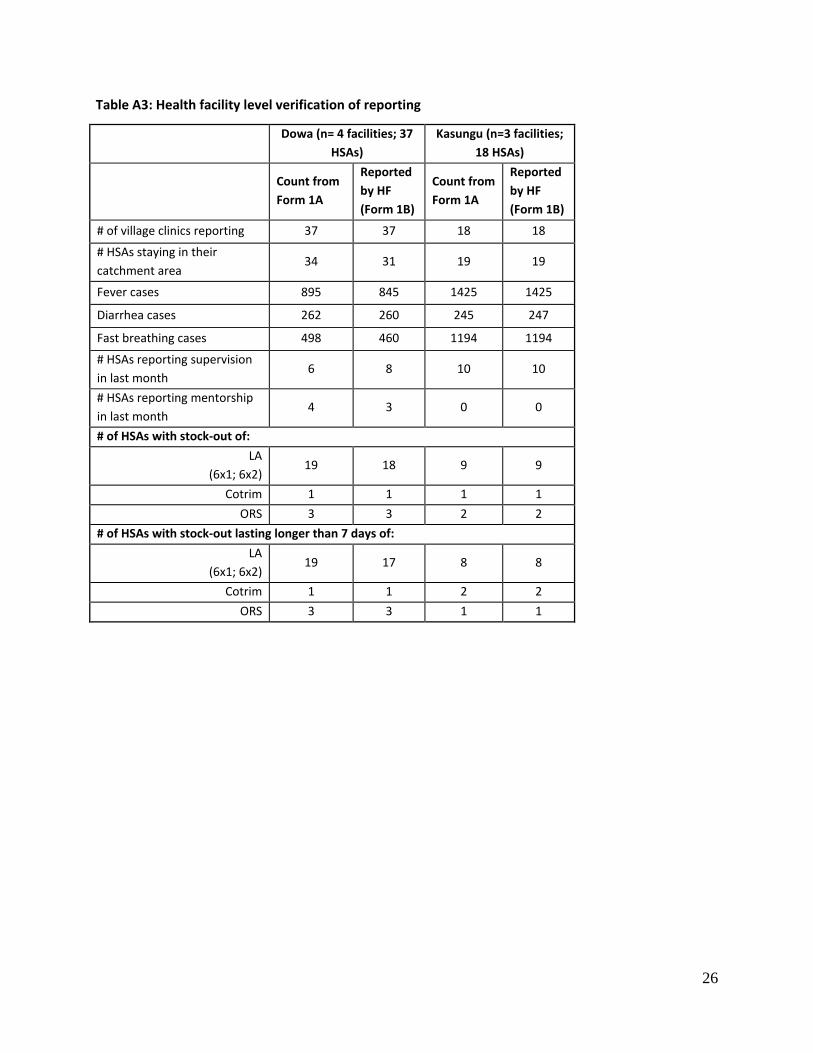
Table 6 shows the consistency of reporting for the health facility (Forms 1B). Detailed information is available in annex table A3. In Dowa at the endline DQA, one facility did not have any information on stock-outs but had information on supervision, mentoring and other monitoring data. In Kasungu, one health facility did not complete the Form 1B tables, and another did not keep copies of the Forms 1A from the HSAs. The consistency exercise could not be done for those two facilities, and they were excluded. Reporting consistency was measured for seven of the nine health facilities interviewed. Since the sample size was so small, we reported range instead of standard errors and statistical testing was not performed. At endline, the reporting consistency remains at adequate (>0.08 and <1.20) levels with large variation in consistency for certain indicators particularly in Dowa distruct. Dowa had under-reporting of fast breathing cases (RVR=1.2) and over-reporting of supervision (RVR=0.8) and LA stock-outs lasting longer than seven days (RVR=0.8).
Although the sample size is too small to make any definite inferences, there is evidence that reporting for cases and drug stocks has improved, but supervision reporting at the health facility level remains problematic (RVR=0.8).
Table 6: Health facility consistency of reporting: RVR mean by HF and range.
Dowa Kasungu Total
Baseline: (n=5)
Endline (n=4)*
Baseline: (n=5)*
Endline (n=3)
Baseline: (n=10)
Endline (n=7)
# HSAs staying in their catchment area
1.0 (0.70-1.3)
1.0 (1.0-1.0)
0.6 (0-1.0)
1.0 (1.0-1.0)
0.81 (0-1.)
1.0 (1.0-1.0)
Fever cases 0.95 (0.99-1.1)
1.1 (1.0-1.2)
1.0 (0.9-1.1)
1.0 (1.0-1.0)
1.0 (0.9-1.1)
1.0 (1.0-1.2)
Diarrhea cases 1.1 (1.0-1.4)
1.1 (1.0-1.3)
1.3 (1.0-2.0)
1.0 (1.0-1.0)
1.2 (1.0-2.0)
1.0 (1.0-1.3)
Fast breathing cases 1.1 (1.0-1.3)
1.2 (1-1.8)
0.9 (0-1.4)
1.0 (1.0-1.0)
1.0 (0-1.4)
1.1 (1.0-1.8)
# HSAs reporting supervision in last month
1.5 (1.0-2.5)
0.8 (0-1.0)
N/A (n=2)
1.0 (1.0-1.0)
1.0 (0-2.5)
0.8 (0-1.0)
# HSAs reporting mentorship in last month
0.9 (0-1.75)
1.1 (1.0-1.5)
N/A (n=1)
1.0 (1.0-1.0)
0.7 (0-1.8)
1.1 (1.0-1.5)
# of HSAs with stock-out of: LA
(6x1; 6x2) 1.1 (1.0-1.1)
1.1 (1.0-1.3)
0.9 (0.1-1.3)
1.0 (1.0-1.0)
0.98 (0.1-1.3)
1.0 (1.0-1.3)
Cotrim 1.0 (1.0-1.0)
1.0 (1.0-1.0)
0.3 (0-1.0)
1.0 (1.0-1.0)
0.70 (0-1.0)
1.0 (1.0-1.0)
ORS 1.0 (1.0-1.0)
1.0 (1.0-1.0)
0.2 (0-0.5)
1.0 (1.0-1.0)
0.64 (0-1.0)
1.0 (1.0-1.0)
# of HSAs with stock-out lasting 7 or more days of: LA
(6x1; 6x2) 1.0 (0.9-1.0)
0.8 (0-1.3)
0.7 (0-1.2)
1.0 (1.0-1.0)
0.87 (0-1.2)
0.9 (0-1.3)
Cotrim 1.0 (1.0-1.0)
1.0 (1.0-1.0)
0 0.8 (0.5-1.0)
0.5 (0-1.0)
0.9 (0.5-1.0)
20
ORS 1.0 (1.0-1.0)
1.0 (1.0-1.0)
0.3 (0-1.0)
1.0 (1.0-1.0)
0.67 (0-1.0)
1.0 (1.0-1.0)
* Baseline – 2 HF missing drug stock data; endline 1 HF is missing drug stock data
Note: a RVR of zero was used if stock-outs were reported by the HSA but the HF documented that no stock-outs occurred, or vice versa.
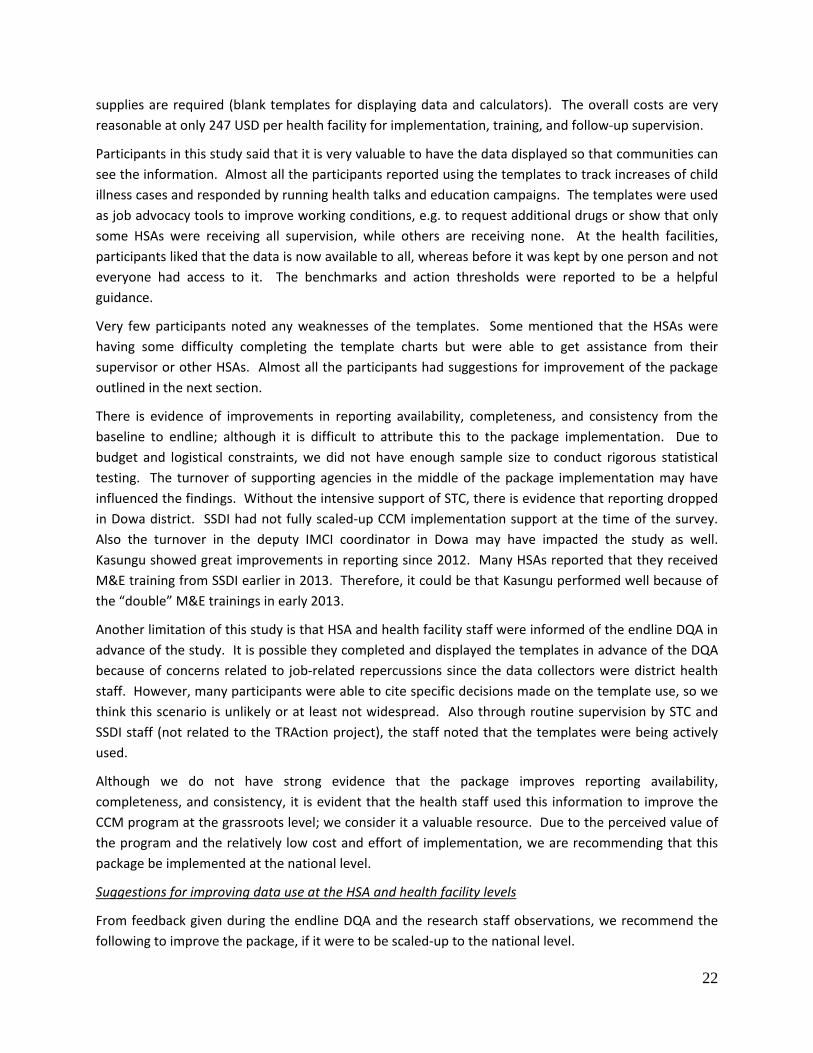
Contextual factors: CCM program changes since 2012 baseline DQA To give context to the findings, we conducted a short analysis based on key stakeholder interviews with STC and the MOH to document any changes in the CCM program since the 2012 baseline. In 2012, STC was providing support to Dowa district for CCM funding from the Canadian International Development Agency (CIDA) funding. This support included an Assistant Project Officer (APO) who was based in the district, encouraged reporting, and followed up with facilities to obtain complete reports. This support ended in March 2013, when the CIDA project closed out. Dowa now receives some support through the USAID-funded Support for Service Delivery Integration (SSDI) project, but it is not clear whether they have someone in place to strengthen the reporting system, which appears to have weakened. In addition, there was also turnover in the Deputy IMCI coordinator in Dowa and the replacement was not yet active during the study period.11 We were unable to collect information on HSAs supervised and mentored because the completed checklists are now submitted to the district; we did ask whether the facilities were actively using them. Mentorship had dropped in Dowa due to lack of mentoring forms.
During the 2012 DQA, Kasungu received support through the CIDA-funded Catalytic Initiative to Save a Million Lives implemented by WHO and UNICEF. The project supported health system strengthening at the district level, although they did not provide direct staff to assist with reporting as in Dowa. Beginning in 2013, both districts receive CCM support from SSDI implemented by Care. During the 2012 DQA, Kasungu had not yet begun supervision and mentoring with the revised checklists although by the 2013 DQA this activity was underway in the sampled health facilities (table 7).
Table 7: Supervision and mentoring activities
Kasungu Dowa Baseline Endline Diff.
(p.p) Baseline Endline Diff.
(p.p) No. of senior HSAs using supervision checklists
0% (0/5) 60% (3/5)
+60 100% (5/5)
100% (4/4)
0
No. of health facility staff using the mentoring form
0% (0/5) 60% (3/5)
+60 100% (5/5)
50% (2/4)
-50
Conclusions In general, we consider the implementation of this data use package a success. The package was very well received; the information was seen as useful and could be easily integrated into the overall CCM program. The training time is only a half-day per health facility, and all health facilities in a district could be trained within two weeks. The data use training can be done by district health staff and minimal
11 Personal communication, Humphreys Nsona, September 2013
21
supplies are required (blank templates for displaying data and calculators). The overall costs are very reasonable at only 247 USD per health facility for implementation, training, and follow-up supervision.
Participants in this study said that it is very valuable to have the data displayed so that communities can see the information. Almost all the participants reported using the templates to track increases of child illness cases and responded by running health talks and education campaigns. The templates were used as job advocacy tools to improve working conditions, e.g. to request additional drugs or show that only some HSAs were receiving all supervision, while others are receiving none. At the health facilities, participants liked that the data is now available to all, whereas before it was kept by one person and not everyone had access to it. The benchmarks and action thresholds were reported to be a helpful guidance.
Very few participants noted any weaknesses of the templates. Some mentioned that the HSAs were having some difficulty completing the template charts but were able to get assistance from their supervisor or other HSAs. Almost all the participants had suggestions for improvement of the package outlined in the next section.
There is evidence of improvements in reporting availability, completeness, and consistency from the baseline to endline; although it is difficult to attribute this to the package implementation. Due to budget and logistical constraints, we did not have enough sample size to conduct rigorous statistical testing. The turnover of supporting agencies in the middle of the package implementation may have influenced the findings. Without the intensive support of STC, there is evidence that reporting dropped in Dowa district. SSDI had not fully scaled-up CCM implementation support at the time of the survey. Also the turnover in the deputy IMCI coordinator in Dowa may have impacted the study as well. Kasungu showed great improvements in reporting since 2012. Many HSAs reported that they received M&E training from SSDI earlier in 2013. Therefore, it could be that Kasungu performed well because of the “double” M&E trainings in early 2013.
Another limitation of this study is that HSA and health facility staff were informed of the endline DQA in advance of the study. It is possible they completed and displayed the templates in advance of the DQA because of concerns related to job-related repercussions since the data collectors were district health staff. However, many participants were able to cite specific decisions made on the template use, so we think this scenario is unlikely or at least not widespread. Also through routine supervision by STC and SSDI staff (not related to the TRAction project), the staff noted that the templates were being actively used.
Although we do not have strong evidence that the package improves reporting availability, completeness, and consistency, it is evident that the health staff used this information to improve the CCM program at the grassroots level; we consider it a valuable resource. Due to the perceived value of the program and the relatively low cost and effort of implementation, we are recommending that this package be implemented at the national level.
Suggestions for improving data use at the HSA and health facility levels
From feedback given during the endline DQA and the research staff observations, we recommend the following to improve the package, if it were to be scaled-up to the national level.
22
General recommendations
• It would be helpful for the package to provide refresher training on how to use the templates. Data review meetings at the district level already take place; it would be helpful to add this as an agenda item to some of the data review meetings. Selected HSAs could present their templates, and policy-makers could attend some of these meetings.
• Several participants noted a lack of supplies: blank monitoring forms (Forms 1A & 1B) and the templates. The success of the package depends on the availability of reporting materials.
• During the training, it would be helpful to combine several health facilities so that the HSAs may learn from one another.
• Participants would benefit from having printed copies of the training manuals. • Selected village committee members and community volunteers should be invited to the
training.
Template recommendation
• Several recommendations were made to add additional data such as: o cases by gender; o cases referred (shows how many children are seeking care but HSA is unable to treat); o number of cases followed-up (so HSAs can track who has completed referral); o total number of cases seen and annual caseload; o a graph for drug consumption; o family planning activities; and o inclusion of other illnesses such as red eye, palmar pallor and malnutrition. Village
committee support and activities, e.g. number of meetings held per month,etc • The health facility templates should include the number of reports turned in before the
deadline, since there is no current system for tracking timeliness of reporting. • Insertion of horizontal grid lines (1-10) would result in easier and more precise plotting.
Additionally, the scale of cases treated per month would need to be increased. Many HSAs had to draw in extra gridlines.
• It would be helpful to consider integrating all illnesses into one graph to condense the information. An alternative display method should be developed for HSAs who do not hold clinics in a permanent structure or where a structure is without walls.
23
Annexes
Table A1: Data quality of templates at the HSA and Health facility levels
Dowa Kasungu
Verified from records
Reported on template
RVR (Mean, range, n)
Verified from records
Reported on template
RVR (Mean, range, n)
HSA level
Fever cases 484 505 1.04 (0.76-1.11) N=15 HSAs
1427 1396 1.02 (0.93-1.35) N=17 HSAs
Pneumonia cases 256 258
0.99 (0.50-1.20) N=16 HSAs
1008 1014 0.99 (0.81-1.12) N=17 HSAs
Diarrhea cases 87 90
0.97 (0.67-1.80) N=15 HSAs
206 206 1.00 (0.82-1.27) N=17 HSAs
Health facility level HSAs supervised
6 3 2.00 (1.00-3.00) N=3 HFs
10 8 1.25 (0-1.0) N=3 HFs
HSAs mentored (3 HFs)
4 2 2.00 (NA) N=3 HFs 0 0
1.0 (1.0-1.0) N=3 HFs
HSAs in CA 31 31 1.0 (1.00-1.00) N=3 HFs
19 19 1.0 (1.0-1.0) N=3 HFs
Stock-outs lasting longer than 7 days
LA 6x1 NA NA NA 3 3 1.0 (1.0-1.0) N=3 HFs
LA 6x2 NA NA NA 5 5 1.0 (1.0-1.0) N=3 HFs
ORS NA NA NA 1 1 1.0 (1.0-1.0) N=3 HFs
Cotrim NA NA NA 1 2 1.0 (1.0-1.0) N=3 HFs
24
Table A2: HSA level verification of reporting
Dowa (n=17 HSAs) Kasungu (n= 19 HSAs)
Count from HSA register
Reported by HSAs (Form 1A)
Count from HSA register
Reported by HSAs (Form 1A)
Fever cases 589 581 1427 1396
Diarrhea cases
106 124 205 206
Fast breathing cases
297 292 1008 1029
# male cases 375 374 777 764
# female cases
366 396 836 837
# of stocks dispensed:
LA
(6x1; 6x2) 5547 4676 11510 11552
Cotrim 2,646 2,601 8830 10107
ORS 352 344 539 513
25
Table A3: Health facility level verification of reporting
Dowa (n= 4 facilities; 37
HSAs) Kasungu (n=3 facilities;
18 HSAs)
Count from Form 1A
Reported by HF (Form 1B)
Count from Form 1A
Reported by HF (Form 1B)
# of village clinics reporting 37 37 18 18
# HSAs staying in their catchment area
34 31 19 19
Fever cases 895 845 1425 1425
Diarrhea cases 262 260 245 247
Fast breathing cases 498 460 1194 1194
# HSAs reporting supervision in last month
6 8 10 10
# HSAs reporting mentorship in last month
4 3 0 0
# of HSAs with stock‐out of: LA
(6x1; 6x2) 19 18 9 9
Cotrim 1 1 1 1 ORS 3 3 2 2
# of HSAs with stock‐out lasting longer than 7 days of: LA