40
Improved crop productivity and rural livelihoods through balanced nutrition in the rainfed semi-arid tropics Science with a human face Resilient Dryland Systems Report No. 58
Improved crop productivity and rural livelihoods throughbalanced nutrition in the rainfed semi-arid tropics
Science with a human face
68-2013
ICRISAT is a memberof the CGIAR ConsortiumScience with a human face
ww
w.ic
risat
.org
Abo
ut I
CR
ISA
T ICRISAT-Liaison OfficeCG Centers BlockNASC ComplexDev Prakash Shastri MargNew Delhi 110 012, India
ICRISAT-Nairobi(Regional hub ESA)PO Box 39063, Nairobi, Kenya
ICRISAT-Bamako(Regional hub WCA)BP 320Bamako, Mali
ICRISAT-NiameyBP 12404Niamey, Niger (Via Paris)
ICRISAT-LilongweChitedze Agricultural Research StationPO Box 1096Lilongwe, Malawi
ICRISAT-Maputoc/o IIAM, Av. das FPLM No 2698Caixa Postal 1906Maputo, Mozambique
ICRISAT-Patancheru(Headquarters)Patancheru 502 324Andhra Pradesh, IndiaTel +91 40 30713071
ICRISAT-BulawayoMatopos Research StationPO Box 776Bulawayo, Zimbabwe
ICRISAT- KanoPMB 3491, Sabo Bakin Zuwo RoadTarauni, Kano, Nigeria
The International Crops Research Institute for the Semi-Arid Tropics (ICRISAT) is a non-profit, non-political organization that conducts agricultural research for development in Asia and sub-Saharan Africa with a wide array of partners throughout the world. Covering 6.5 million square kilometers of land in 55 countries, the semi-arid tropics have over 2 billion people, of whom 644 million are the poorest of the poor. ICRISAT innovations help the dryland poor move from poverty to prosperity by harnessing markets while managing risks – a strategy called Inclusive Market-Oriented Development (IMOD).
ICRISAT is headquartered in Patancheru near Hyderabad, Andhra Pradesh, India, with two regional hubs and five country offices in sub-Saharan Africa. It is a member of the CGIAR Consortium. CGIAR is a global research partnership for a food secure future.
Res
ilien
t Dry
land
Sys
tem
s R
epor
t N
o. 5
8

This publication is part of the research project “Sustainable rural livelihoods through enhanced farming system productivity and efficient support systems in rain-fed areas; Sub-project: Increasing crop productivity through soil-test based sustainable nutrient management in eight target rain-fed districts” supported by Indian Council of Agricultural Research (ICAR), New Delhi, India through Central Research Institute for Dryland Agriculture (CRIDA), Hyderabad.
Citation: Wani Suhas P, Girish Chander, Sahrawat KL, Sreenath Dixit, Venkateswarlu B. 2013. Improved crop productivity and rural livelihoods through balanced nutrition in the rainfed semi-arid tropics. Resilient Dryland Systems Report no. 58. Patancheru, Andhra Pradesh, India: International Crops Research Institute for the Semi-Arid Tropics (ICRISAT). 36 pp.
AbstractDiagnostic soil analysis in targeted clusters of eight districts in Andhra Pradesh revealed critical deficiencies of sulphur (61 to 98%), boron (23 to 98%) and zinc (45 to 85%) in addition to that of soil carbon (25 to 97%), and phosphorus (14 to 84%) which are apparently holding back the productivity potential. The soil test based application of sulphur, boron and zinc together increased productivity by 8 to 102% in cotton, groundnut, castor, sorghum, greengram, cowpea, chickpea and maize. Economic assessment reveal that per rupee invested as additional cost (` 1,400/- to ` 2,150/-) gave ` 1.6 to 28.5 in return. Residual benefits of balanced nutrition were observed during 4 succeeding seasons. Soil health improved in balanced nutrition plots, inspite of higher yields and nutrient removal. The results showed that balanced nutrition is the way forward to increase crop productivity through resilience building of production systems and improve farm based livelihoods in the SAT regions.
Contributing teamC. Rajesh, Research Associate, ICRISATP. Narsimha Rao, Research Fellow, ICRISATG. Pardhasaradhi, Manager, CRAL, ICRISAT
Consortium partnersKVK, Acharya NG Ranga Agricultural University, Hyderabad (ANGRAU), AdilabadWatershed Support Services and Activities Network (WASSAN), RangareddyModern Architects for Rural India (MARI), WarangalBAIF Institute of Rural Development (BIRD BAIF), Anantapur & MahabubnagarSri Aurobindo Institute for Rural Development (SAIRD), NalgondaCenter for World Solidarity (CWS), KhammamAakruthi Agricultural Associates (AAKRUTI), Kadapa
2013
Improved Crop Productivity and Rural Livelihoods through Balanced Nutrition
in the Rainfed Semi-Arid Tropics
Suhas P Wani, Girish Chander, KL Sahrawat, Sreenath Dixit, and B Venkateswarlu
Indian Council of Agricultural ResearchNew Delhi, India
Central Research Institute for Dryland AgricultureHyderabad
ICRISAT Research Program Resilient Dryland Systems
Report no. 58
Patancheru 502 324, Andhra Pradesh, India
Suhas P Wani Assistant Research Program Director and Principal Scientist (Watersheds), Resilient Dryland Systems, ICRISAT, Patancheru 502 324, Andhra Pradesh, India
Girish Chander Scientist (Soil Science), Resilient Dryland Systems, ICRISAT, Patancheru 502 324, Andhra Pradesh, India
KL Sahrawat Consultant, Resilient Dryland Systems, ICRISAT, Patancheru 502 324, Andhra Pradesh, India
Sreenath Dixit Principal Scientist, Central Research Institute for Dryland Agriculture (ICAR), Santoshnagar, Hyderabad 500 059, Andhra Pradesh, India
B Venkateswarlu Director, Central Research Institute for Dryland Agriculture (ICAR), Santoshnagar, Hyderabad 500 059, Andhra Pradesh, India
About the Authors
AcknowledgementsWe gratefully acknowledge the support from Central Research Institute for the Dryland Agriculture (CRIDA), Hyderabad, Indian Council of Agricultural Research (ICAR) through World Bank assisted National Agriculture Innovation Project (NAIP) for undertaking development research for impact. We sincerely acknowledge the help from our consortium partners, Krishi Vignan Kendra (KVK), Adilabad; Acharya NG Ranga Agricultural University (ANGRAU), Hyderabad; Watershed Support Services and Activities Network (WASSAN), Rangareddy; Modern Architects for Rural India (MARI), Warangal; BAIF Institute of Rural Development (BIRD BAIF), Anantapur & Mahabubnagar; Sri Aurobindo Institute for Rural Development (SAIRD), Nalgonda; Center for World Solidarity (CWS), Khammam; and and Aakruthi Agricultural Associates (AAKRUTI), Kadapa; in undertaking on-farm research for impact. Sincere thanks are also to Dr AVR Kesava Rao and Mr K Srinivas Rao for sharing rainfall data for target districts, and GIS unit, ICRISAT for mapping study sites.
The opinions expressed in this publication are those of the authors and do not necessarily reflect those of ICRISAT or ICAR or CRIDA or the World Bank. The designations employed and the presentation of material in this publication do not imply the expression of any opinion whatsoever on the part of ICRISAT or ICAR or CRIDA or the World Bank concerning the legal status of any country, territory, city or area, or concerning the delimitation of its frontiers or boundaries. Where trade names are used, this does not constitute endorsement of or discrimination against any product.

iii
ContentsIntroduction ...................................................................................................................................1
Large yield gaps between current and potential yields ................................................................1
Nutrient mining and land degradation – threat to sustainability ....................................................2
Study sites ....................................................................................................................................3
Consortium and convergence approach.......................................................................................3
Soil health assessment.................................................................................................................6Participatory and stratified soil sampling ..............................................................................6Methods of soil and plant analysis .......................................................................................7Extent of nutrient deficiencies in study sites .........................................................................8Development of fertilizer recommendations .........................................................................8
On-farm farmer participatory trials on balanced nutrition ...........................................................10Trials during rainy seasons .................................................................................................11Trials during post-rainy seasons ........................................................................................13
Economics of crop production ....................................................................................................15Rainy season crops ............................................................................................................15Post-rainy season crops .....................................................................................................15
Diversification to vegetables .......................................................................................................17
Rainwater use efficiency ............................................................................................................18
Nutrient uptake by crops.............................................................................................................20
Residual effect of secondary and micronutrients ........................................................................20
Soil health under balanced nutrition ...........................................................................................23
Integration of on-farm produced vermicompost in nutrient management strategies ..................25
Future Research and Development Needs ................................................................................27
References ................................................................................................................................28

1
IntroductionWorldwide, rain-fed agriculture is practiced in 80% of the agricultural area and generates 62% of the world’s staple food (FAOSTAT 2005). These regions are home to the world’s poor and malnourished people, and almost all population growth (95%) is taking place in these developing regions (Wani et al. 2012a). In India, area under rain-fed agriculture is 89 million ha (2/3rd of total), and contributes to 44% national food production (Wani et al. 2012b). In context of irrigated regions in India having reached productivity plateau, rain-fed regions offer hope to increase food production to required 290 million t by 2025 to meet the food requirement (Amarasinghe et al. 2007; Wani et al. 2008). But, rain-fed semi arid tropics (SAT) areas in India are the hot spot of land degradation, low crop yields and poverty. Out of 852 million poor and malnourished people in the world, 221 million are in India. Similar situation more or less exists in Andhra Pradesh state in India. In Andhra Pradesh, agriculture contributes to about 20% of the GDP (Gross domestic product), but provides employment and livelihood to more than 60% of rural population. Thus any growth in agriculture directly translates into poverty reduction in rural areas. Growth in agricultural productivity also accounts for a large share of economic growth. Agriculture-led development is feasible in these rain-fed regions only by applying scientific knowledge to increase crop productivity and incomes.
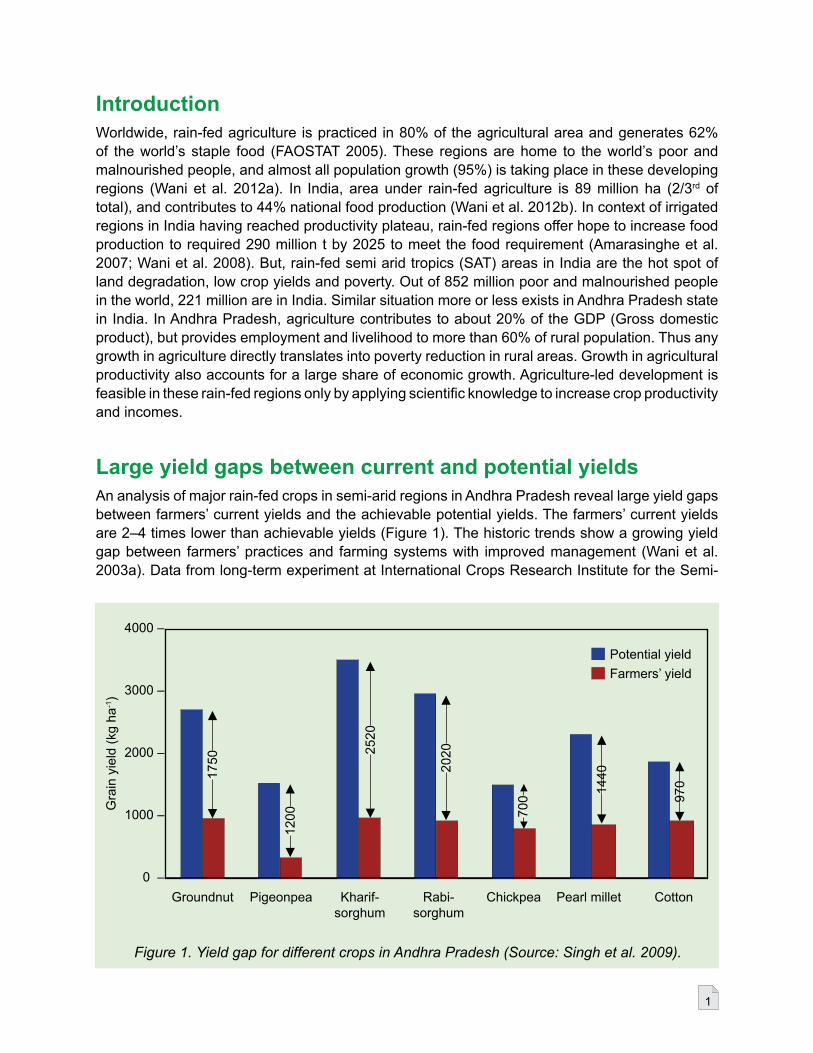
Large yield gaps between current and potential yieldsAn analysis of major rain-fed crops in semi-arid regions in Andhra Pradesh reveal large yield gaps between farmers’ current yields and the achievable potential yields. The farmers’ current yields are 2–4 times lower than achievable yields (Figure 1). The historic trends show a growing yield gap between farmers’ practices and farming systems with improved management (Wani et al. 2003a). Data from long-term experiment at International Crops Research Institute for the Semi-
Figure 1. Yield gap for different crops in Andhra Pradesh (Source: Singh et al. 2009).
Potential yieldFarmers’ yield
4000 –
3000 –
2000 –
1000 –
0 –
Gra
in y
ield
(kg
ha-1)
Groundnut Pigeonpea Kharif- sorghum
Rabi- sorghum
Chickpea Pearl millet Cotton
◄►
1750
◄►
1200 ◄
►25
20
◄►
2020
◄►
1440
◄►
970
◄►
700

2
Arid Tropics (ICRISAT) heritage watershed site has demonstrated that integrated watershed management interventions which focus on balanced nutrient management along with crop, land and water management practices can sustainably increase rain-fed crop yield by five folds as compared to that under traditional farmer’s practices (Wani et al. 2003a, 2011, 2012a).
Nutrient mining and land degradation – threat to sustainabilityThe soils in SAT regions are not only thirsty but also hungry. The SAT soils are generally marginal compared to those in the irrigated or assured rainfall regions. Poor soils with low nutrient reserves are brought under cultivation due to population pressure and that too without much external input of nutrients for a long time, resulting in mining and depletion of scanty stocks of nutrients. Farmers avoid external balanced nutrient inputs because of the risk of crop failure due to erratic rainfall in these regions unlike in the irrigated or assured rainfall regions where risks of crop failure are minimal. Further, the rate of organic matter degradation in the SAT is relatively higher than in the temperate region due to prevailing high temperatures and drying and wetting cycles. These soils are prone to severe wind and water erosion, which take away nutrient rich fine top fertile soil layer. Thus, soil erosion along with mining of nutrients by continuous cropping, without adequate additions of nutrients, have impoverished the soils over the years. Wide-spread deficiency of macro, micro and secondary nutrients have been reported in rain-fed areas (Wani et al. 2003b; Rego et al. 2005; Sahrawat et al. 2010; Girish Chander et al. 2012) which must be overcome to enhance productivity in a sustainable manner to meet the current and future food needs of the growing population.
The father of Green Revolution, Dr Norman Borlaug while accepting the Nobel Peace Prize in 1970 aptly said: “If the dwarf wheat varieties developed (by him) was the vehicle, the fertilizers were the fuel which produced high yields and triggered the Green Revolution in many developing countries including India.” This synergy between improved genetic resources and adequate nutrient supply sustained the increased productivity of rice and wheat for nearly three decades. In recent years the high productivity in irrigated agriculture is stagnating or declining in spite of supplying increasing nitrogen (N), phosphorus (P) and potassium (K) fertilizers. One of the major factors for this situation has been identified as inadequate supply of micronutrients. And it is important that such mistake is not repeated in the rain-fed semi-arid tropics.
In dryland tropics, farmers have noticed responses to N, P and K fertilizers and most of the farmers do apply these fertilizers to their crops like groundnut, maize, castor and sorghum. Thus, crops in SAT mine the limited stocks of micronutrients and secondary elements from the marginal soils, resulting in their decline in these soils. Table 1 gives the amounts of micro and secondary nutrients removed by various crops under rain-fed dryland conditions. Even though the quantities of nutrients removed are small when compared to irrigated crops because of low yields, deficiencies do occur due to relatively small reserves in these marginal soils. In recent years, the availability of farm yard manure (FYM) and organic manures and the quantity applied have declined drastically resulting in micronutrient deficiencies. The problem of secondary nutrients and micronutrients is severe in drylands, as farmers preferentially apply whatever available small quantities of organic manure to irrigated rice, vegetables and cash crops. Low-value crops like sorghum, millet, etc receive small quantities of FYM, once in 3 to 4 years in some cases. Improper crop management in drylands due to inadequate supply of nutrients and other inputs results in poor growth of crops which in turn results in poor canopy development and more soil erosion due to downpour in the rainy season. Thus the nutrient-rich topsoil is eroded resulting in various nutrient deficiencies.

3
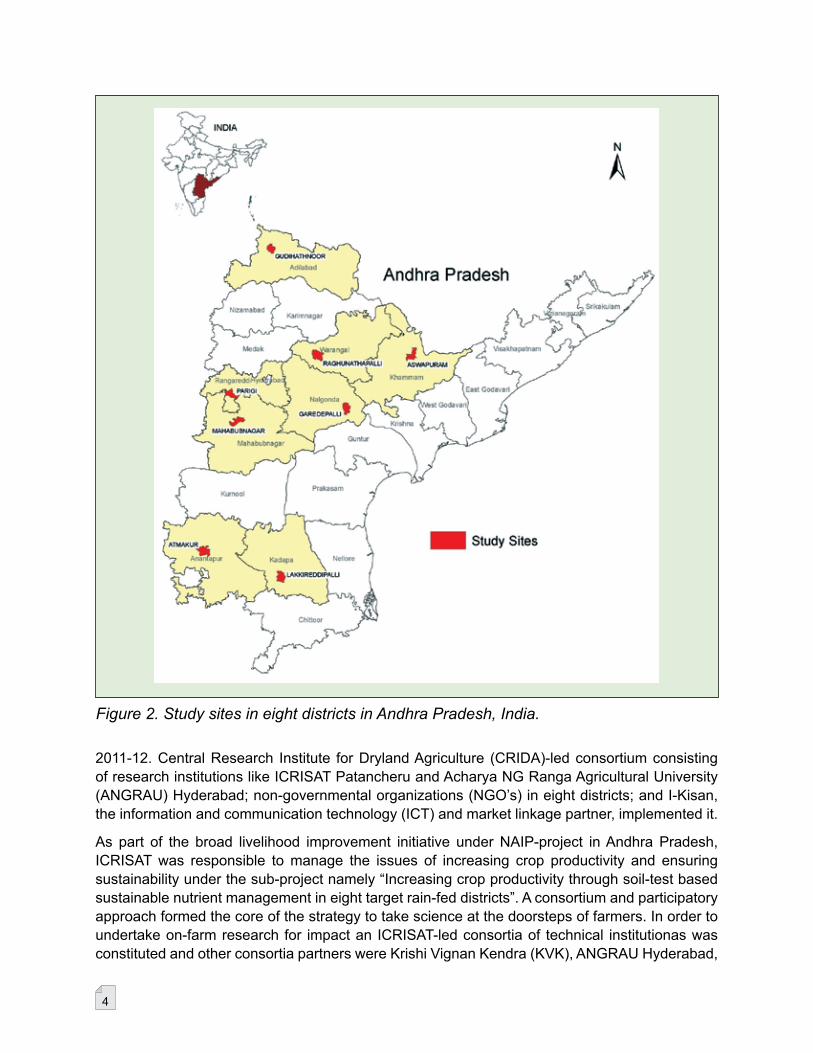
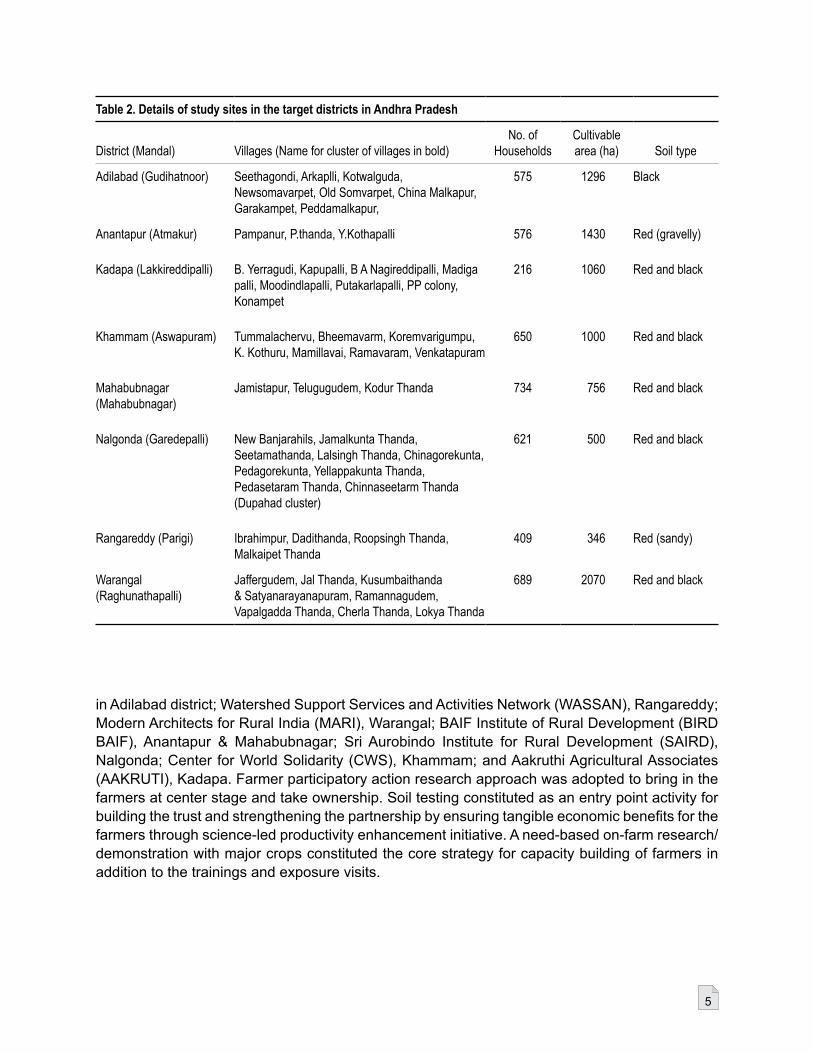
Study sitesThe targeted cluster of villages (Figure 2; Table 2) in eight mandals in Adilabad, Anantapur, Kadapa, Khammam, Mahabubnagar, Nalgonda, Rangareddy and Warangal districts were selected by the ICRISAT-led consortia in view of the subsistence farming prevalent and very low productivity. The number of households range from 216 in B.Yerragudi cluster of Kadapa district to 739 in Jamistapur cluster of Mahabubnagar district, while the cultivable area varies from 346 ha in Ibrahimpur cluster of Rangareddy district to 2070 ha in Jaffergudem cluster of Warangal district. The major crops grown in the area are cotton, pigeonpea, groundnut, castor, maize, chickpea, sorghum, rice and sunflower. The soils of the region are predominantly red (Alfisols) and black (Vertisols and associated Vertic soils). In general, the selected project sites are inhabited by the indigeneous people who are very poor and highly indebted. They have limited livelihood opportunities and therefore migration also happens to some extent. Among major constraints to a higher productivity include land degradation and occurrence of droughts. The irrigation facility is scarce and productivity is very low. Therefore, the overall goal of the intervention was to lead to sustainable intensification and reduce poverty in the target dryland upstream areas.
Consortium and convergence approachTo bring in impact in productivity and livelihood improvement in rural areas, a holistic farming systems approach is needed to tackle multiple issues at the farm level. ICRISAT in its integrated watershed management programs over the years has evolved a consortium (of technical institutions) and convergence (of interventions/developmental schemes) approach in different sectors like livestock, markets, policies, institutions, finances, monitoring and evaluation in addition to agricultural production related. The consortium and convergence mechanism has been refined over the years to change the lives of smallholders in the semi-arid tropics in India (Wani et al. 2012c).
In order to change the livelihoods of farmers in cluster villages in eight rain-fed districts of Andhra Pradesh an Indian Council of Agricultural Research (ICAR) supported National Agricultural Innovation Project (NAIP) namely “Sustainable rural livelihoods through enhanced farming system productivity and efficient support systems in rain-fed areas”, was implemented during 2007-08 to
Table 1. Mean yield and uptake of nutrients by crops grown in the Andhra Pradesh Rural Livelihood Program (APRLP) watersheds, Andhra Pradesh, India in 2002
Crop
Grain yield (kg ha-1) Stover yield (kg ha-1)
Nutrients removed (g ha-1)
Control Treated
Control Treated Control Treated S B Zn S B Zn
Mungbean 770 1110 730 1000 2325 20 46 4009 30 68Maize 2730 4560 3460 4290 4536 16 112 7014 19 192Groundnut 700 940 1990 2490 4355 40 50 6418 52 81Pigeonpea 540 870 1310 2100 1619 22 27 2649 36 45Castor 590 890 820 1190 2216 18 40 3550 26 62
Source: Rego et al., 2005
4
2011-12. Central Research Institute for Dryland Agriculture (CRIDA)-led consortium consisting of research institutions like ICRISAT Patancheru and Acharya NG Ranga Agricultural University (ANGRAU) Hyderabad; non-governmental organizations (NGO’s) in eight districts; and I-Kisan, the information and communication technology (ICT) and market linkage partner, implemented it.
As part of the broad livelihood improvement initiative under NAIP-project in Andhra Pradesh, ICRISAT was responsible to manage the issues of increasing crop productivity and ensuring sustainability under the sub-project namely “Increasing crop productivity through soil-test based sustainable nutrient management in eight target rain-fed districts”. A consortium and participatory approach formed the core of the strategy to take science at the doorsteps of farmers. In order to undertake on-farm research for impact an ICRISAT-led consortia of technical institutionas was constituted and other consortia partners were Krishi Vignan Kendra (KVK), ANGRAU Hyderabad,
Figure 2. Study sites in eight districts in Andhra Pradesh, India.
5
in Adilabad district; Watershed Support Services and Activities Network (WASSAN), Rangareddy; Modern Architects for Rural India (MARI), Warangal; BAIF Institute of Rural Development (BIRD BAIF), Anantapur & Mahabubnagar; Sri Aurobindo Institute for Rural Development (SAIRD), Nalgonda; Center for World Solidarity (CWS), Khammam; and Aakruthi Agricultural Associates (AAKRUTI), Kadapa. Farmer participatory action research approach was adopted to bring in the farmers at center stage and take ownership. Soil testing constituted as an entry point activity for building the trust and strengthening the partnership by ensuring tangible economic benefits for the farmers through science-led productivity enhancement initiative. A need-based on-farm research/demonstration with major crops constituted the core strategy for capacity building of farmers in addition to the trainings and exposure visits.
Table 2. Details of study sites in the target districts in Andhra Pradesh
District (Mandal) Villages (Name for cluster of villages in bold)No. of
HouseholdsCultivable area (ha) Soil type
Adilabad (Gudihatnoor) Seethagondi, Arkaplli, Kotwalguda, Newsomavarpet, Old Somvarpet, China Malkapur, Garakampet, Peddamalkapur,
575 1296 Black
Anantapur (Atmakur) Pampanur, P.thanda, Y.Kothapalli 576 1430 Red (gravelly)
Kadapa (Lakkireddipalli) B. Yerragudi, Kapupalli, B A Nagireddipalli, Madiga palli, Moodindlapalli, Putakarlapalli, PP colony, Konampet
216 1060 Red and black
Khammam (Aswapuram) Tummalachervu, Bheemavarm, Koremvarigumpu, K. Kothuru, Mamillavai, Ramavaram, Venkatapuram
650 1000 Red and black
Mahabubnagar (Mahabubnagar)
Jamistapur, Telugugudem, Kodur Thanda 734 756 Red and black
Nalgonda (Garedepalli) New Banjarahils, Jamalkunta Thanda, Seetamathanda, Lalsingh Thanda, Chinagorekunta, Pedagorekunta, Yellappakunta Thanda, Pedasetaram Thanda, Chinnaseetarm Thanda (Dupahad cluster)
621 500 Red and black
Rangareddy (Parigi) Ibrahimpur, Dadithanda, Roopsingh Thanda, Malkaipet Thanda
409 346 Red (sandy)
Warangal (Raghunathapalli)
Jaffergudem, Jal Thanda, Kusumbaithanda & Satyanarayanapuram, Ramannagudem, Vapalgadda Thanda, Cherla Thanda, Lokya Thanda
689 2070 Red and black

6
Soil health assessment
Participatory and stratified soil samplingSoil testing plays an important role in the diagnosis of nutrient deficiencies and determining the nutrient requirements of crops for judicious use of external inputs of fertilizers and amendments. Soil sampling is an important component of soil fertility evaluation and nutrient management research. Soil sampling constituted an important entry point activity for the consortia to make rapport with the farming community (Figure 3). Soil samples were collected by the farmers themselves with required handholding support from the experts.
As soil analysis involves huge cost, human and other resources, we had a challenge to restrict sampling to selected farmers, but without compromising on precision. To solve this problem, ICRISAT has developed and evaluated a stratified soil sampling method (Sahrawat et al. 2008). In this method, if a target region is sampled in a way to represent different strata based on topography, soil color, soil texture, crop management, socio-economics etc., the 20-25% samples give the same results as 100%, and thus brings in the scales of economy. This plan takes into consideration the variation in different subpopulations in an effort to increase the overall precision of the estimates over the entire population (representing a field, plot or watershed).
Figure 3. Participatory Soil Sampling in Warangal district cluster.

7
For sampling study sites, we divided cluster villages in three parts – upper, mid and lower parts of the topo-sequence. Soil fertility might be dependent mainly on the farmer’s inputs, which in turn depends on the resourcefulness of the farmer, i.e. large, medium or small landholder. Therefore, at each topo-sequence location, socio-economic condition using farm size as a proxy was super imposed. Twenty percent farms were sampled to represent proportionately different farm-holding sizes and within each farm class to represent variations like soil color, texture, cropping system etc.
At ultimate sampling unit in a farmer’s field, we collected 8 to 10 cores of surface (0–0.15 m) soil samples and mixed together to make a composite sample. For economic and precision reasons, soil samples taken were made into composites on the basis of a plot, field or at a part of the watershed under sampling. In this case, it is assumed that a reasonable and valid estimate of the mean of characteristic of the population can be made from the single analysis of the composite sample. For this assumption to be true it must be ensured that all soil samples that form a composite are drawn from the population and each sample contributes the same amount to the composite (Petersen and Calvin 1996). The precision with which mean is estimated can be increased by increasing the number of samples that form a composite.
Methods of soil and plant analysisSoil samples were processed before analysis in the laboratory for various characteristics. The samples were air-dried in the shade and sieved through a 2-mm sieve for general analysis. However, for organic carbon (OC) soil samples were ground to pass through a 0.25 mm sieve. Soil analysis was done to determine the pools of available nutrients in the soil with a view to make judicious use of external inputs of nutrients for achieving a given yield. The principle underlying soil chemical analysis is that the amount or concentration of a nutrient present in the representative soil sample is proportional to the amount that would be made available to the plant during the growing season. This assumption may or may not hold as the growth or yield of a crop is determined by several prevailing agroclimatic conditions during the growing season, especially soil moisture, solar radiation and temperature. However, with these limitations soil testing has proved useful in making a more rational use of fertilizers. A number of standard texts are available that describe the various methods used for determining the pools of available major (N, P and K), secondary [calcium (Ca), magnesium (Mg) and sulphur (S)] and micronutrients [iron (Fe), zinc (Zn), manganese (Mn), copper (Cu), boron (B) and molybdenum (Mo)] (Jackson 1958; Sparks 1996). For undertaking analysis of soil samples collected from farmers’ fields in Andhra Pradesh, we employed the following standard methods (Table 3).
Table 3. Different methods used for chemical analysis of soil samples collected from farmers’ fields in Andhra Pradesh, India.
Soil property Description
pH Soil to water ratio of 1:2, using glass electrodeEC Same as above, using E.C. meterOrganic carbon (OC) Wet dichromate oxidation (Nelson & Sommers 1996)Available phosphorus (P) Olsen P (0.5 M NaHCO
3, pH 8.5) (Olsen and Sommers 1982)
Available potassium (K) 1 N ammonium acetate (Helmke and Sparks 1996)Available sulphur (S) CaCl
2/ MCP extraction (Tabatabai 1996)
Available zinc (Zn) DTPA extractable Zn (Lindsay and Norvell 1978) Available boron (B) Hot water extractable B (Keren 1996)

8
The critical limits adopted for delineating deficient samples from sufficient in a parameter or nutrient are - 0.50% for OC, 5 mg kg-1 soil for P, 50 mg kg-1 for K, 10 mg kg-1 for S, 0.58 mg kg-1 for B and 0.75 mg kg-1 for Zn.
Total N, P and K in plant materials were determined by digesting them with sulfuric acid-selenium mixture, while N and P in the digests were analyzed using auto-analyzer and K using atomic absorption spectrophotometer (Sahrawat et al. 2002a). Zinc in the plant materials was determined by digesting them with triacid and Zn in the digests was determined using atomic absorption spectrophotometer (Sahrawat et al. 2002b). Total S and B in plant samples were determined by Inductively Coupled Plasma Emission Spectrophotometer (ICP-AES) in the digests prepared by digesting the samples with nitric acid (Mills and Jones 1996).
Extent of nutrient deficiencies in study sitesThe results of the analysis of soil samples in the village clusters of eight districts are presented in Table 4 to indicate per cent farms with low levels of nutrients along with mean values and range of the nutrients found in the targeted clusters. Results showed besides deficiencies of N (in terms of organic carbon) and P, the widespread deficiencies of S, B and Zn in all the districts. Majority (>50%) of the farmers’ fields in all the districts (55 to 97% fields), except in Adilabad and Khammam, had low levels of soil C which indicated general poor soil health. Low levels of C specifically indicated N deficiencies. Phosphorus deficiencies were prominent in Adilabad (60% fields), Kadapa (84% fields) and Khammam (60% fields) districts, while the other districts (Anantapur, Mahabubnagar, Nalgonda, Rangareddy, Warangal) had rather majority fields with sufficient levels of P, thereby indicating scope to reduce use and cost of phosphatic fertilizers. Potassium as such was not a problem in any of the district except in Kadapa where majority (54%) fields had low levels of K. In addition to macronutrient deficiencies, the analysis results showed widespread deficiencies of secondary and micronutrients mainly S, B and Zn. All the districts were found with majority of the fields having low levels of S (61 to 98% fields). Boron deficiency was found in majority fields (83 to 98% fields) in all the districts except Nalgonda and Warangal districts. Similarly Zn was deficient in majority fields (51 to 85% fields) in all the districts except Khammam and Mahabubnagar. Keeping in mind the essentiality of nutrients, apparently the S, B and Zn deficiencies along with that of N and P are holding back the realization of productivity potential.
Development of fertilizer recommendationsBased on the results of analysis done on sampled soils, we developed soil test-based fertilizer recommendations at the level of cluster of villages (or mandal), as against the state level blanket recommendations which are generally followed in India. As % nutrient deficiency is indicative of nutrient mining, we recommended to apply full dose of a nutrient if deficiency was observed in >50% fields and half dose of nutrient if deficiency was observed in <50% fields. The state fertilizer recommendations for N, P and K (Table 5) were modified based on this principle to address varying soil fertility needs at cluster of villages level. Similarly, for newly emerged deficiencies of S, B and Zn, the general per ha recommendations of 30 kg S (through gypsum), 5 kg zinc and 0.5 kg boron were adjusted on the principle of deficiency to meet soil fertility needs.

9
Tabl
e 4.
Soi
l fer
tility
sta
tus
of fa
rmer
s’ fi
elds
in ta
rget
ed c
lust
ers
in 8
dis
tric
ts o
f And
hra
Prad
esh
Dis
trict
(Clu
ster
)N
o. o
f fa
rmer
sPa
ram
eter
pHEC
(dS
m-1)
OC
(%)
Avai
labl
e P
(mg
kg-1)
Avai
labl
e K
(mg
kg-1)
Avai
labl
e S
(mg
kg-1)
Avai
labl
e B
(mg
kg-1)
Avai
labl
e Zn
(mg
kg-1)
Adila
bad
63R
ange
6.4-
8.9
0.06
-2.8
60.
27-1
.33
0.2-
48.8
46-5
492.
0-14
20.
10-0
.84
0.10
-2.9
0
(See
tago
ndi)
Mea
n8.
20.
270.
626.
920
512
.20.
370.
66%
def
icie
ncy
2760
276
8771
Anan
tapu
r82
Ran
ge5.
5-8.
80.
02-3
.20
0.12
-1.4
50.
6-42
.438
-148
83.
5-11
70.
06-1
.40
0.26
-5.0
0
(Pam
panu
r)M
ean
7.4
0.18
0.45
8.4
116
100.
320.
88%
def
icie
ncy
6632
985
8861
Kada
pa83
Ran
ge6.
0-8.
80.
02-1
.30
0.12
-1.3
10.
2-13
.417
-482
1.8-
223
0.10
-3.6
50.
24-5
.20
(B. Y
erra
gudi
)M
ean
7.3
0.12
0.26
2.5
616.
60.
40.
61%
def
icie
ncy
9784
5498
8885
Kham
mam
102
Ran
ge3.
8-8.
80.
03-0
.86
0.32
-1.5
00.
2-57
.831
-856
3.6-
71.9
0.12
-1.2
20.
28-6
.80
(Tum
mal
ache
ruvu
)M
ean
6.8
0.15
0.7
8.5
180
10.6
0.39
1.09
% d
efic
ienc
y25
602
6787
45
Mah
abub
naga
r13
3R
ange
6.0-
10.2
0.01
-2.3
70.
13-1
.13
0.2-
44.4
25-1
263
3.4-
287
0.04
-1.2
40.
30-4
.68
(Zam
ista
pur)
Mea
n7.
80.
220.
448.
710
511
.60.
360.
96%
def
icie
ncy
6243
1873
8348
Nal
gond
a14
2R
ange
5.5-
9.0
0.03
-1.6
00.
14-1
.13
0.6-
50.4
21-3
462.
1-14
00.
10-3
.00
0.22
-6.5
8
(Dup
ahad
)M
ean
7.6
0.29
0.46
8.6
8917
0.85
1.02
% d
efic
ienc
y68
3814
6136
51
Ran
gare
ddy
121
Ran
ge4.
7-8.
20.
02-1
.16
0.15
-1.5
60.
2-60
.024
-405
1.1-
81.6
0.06
-1.2
40.
15-4
.00
(Ibra
him
pur)
Mea
n6.
70.
120.
58.
992
3.7
0.26
0.64
% d
efic
ienc
y55
3917
9898
76
War
anga
l10
0R
ange
6.1-
9.4
0.04
-1.6
80.
08-0
.84
0.2-
53.4
21-2
801.
8-48
.90.
25-3
.55
0.26
-3.8
8
(Jaf
ferg
udem
)M
ean
7.8
0.27
0.41
1611
89.
40.
940.
96%
def
icie
ncy
8114
577
2350

10
Table 5. General nutrient recommendations for different crops in Andhra Pradesh, India (State agricultural university; and ICRISAT)
Crop
Nutrient recommendations (kg ha-1)
N P2O
5 K
2O S B Zn
Cotton 120 60 60 30 0.5 10Groundnut 20 40 50 30 0.5 10
Castor 75 40 30 30 0.5 10
Sorghum 80 40 30 30 0.5 10
Greengram 20 50 0 30 0.5 10
Cow pea 20 50 0 30 0.5 10
Chickpea 10 25 20 30 0.5 10
Maize 100 50 40 30 0.5 10
On-farm farmer participatory trials on balanced nutritionBased on the soil test results, on-farm participatory trials were planned and conducted in all the clusters to evaluate and demonstrate the effects of balanced nutrition in different rainy (June to September) and post-rainy (October to January) season crops (Table 6).
Table 6. Detail of farmer participatory evaluation trials on soil test based balanced nutrition during 2008-09 to 2011-12
District Crop
2008-09 2009-10 2010-11 2011-12
TotalRainy
seasonPost-rainy
seasonRainy
seasonPost-rainy
seasonRainy
seasonPost-rainy
seasonRainy
season
Adilabad Cotton 13 6 19Sorghum 4 4Chickpea 14 8 5 27
Anantapur Groundnut 9 4 3 9 5 5 5 40
Kadapa Groundnut 13 11 6 6 3 39Sunflower 8 7 15Tomato 1 1
Khammam Cotton 13 5 4 22Greengram 5 5
Mahabubnagar Castor 2 1 5 8Groundnut 4 4 8
Nalgonda Groundnut 3 5 4 5 8 8 33Tomato 6 6
Rangareddy Cowpea 4 4Groundnut 5 5
Warangal Cotton 13 15 4 6 38Maize 15 5 20Tomato 4 4Okra 2 2Brinjal 1 1
Total 50 40 47 61 24 38 41 301
11
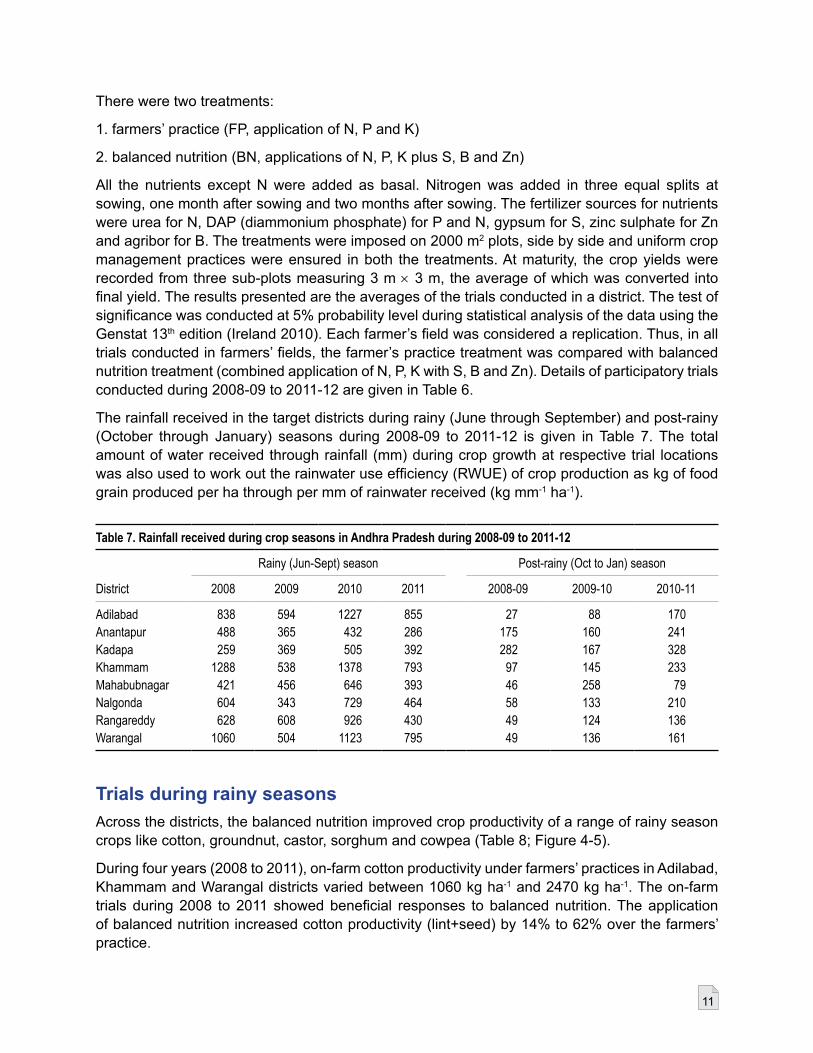
Table 7. Rainfall received during crop seasons in Andhra Pradesh during 2008-09 to 2011-12
District
Rainy (Jun-Sept) season Post-rainy (Oct to Jan) season
2008 2009 2010 2011 2008-09 2009-10 2010-11
Adilabad 838 594 1227 855 27 88 170Anantapur 488 365 432 286 175 160 241Kadapa 259 369 505 392 282 167 328Khammam 1288 538 1378 793 97 145 233Mahabubnagar 421 456 646 393 46 258 79Nalgonda 604 343 729 464 58 133 210Rangareddy 628 608 926 430 49 124 136Warangal 1060 504 1123 795 49 136 161
There were two treatments:
1. farmers’ practice (FP, application of N, P and K)
2. balanced nutrition (BN, applications of N, P, K plus S, B and Zn)
All the nutrients except N were added as basal. Nitrogen was added in three equal splits at sowing, one month after sowing and two months after sowing. The fertilizer sources for nutrients were urea for N, DAP (diammonium phosphate) for P and N, gypsum for S, zinc sulphate for Zn and agribor for B. The treatments were imposed on 2000 m2 plots, side by side and uniform crop management practices were ensured in both the treatments. At maturity, the crop yields were recorded from three sub-plots measuring 3 m × 3 m, the average of which was converted into final yield. The results presented are the averages of the trials conducted in a district. The test of significance was conducted at 5% probability level during statistical analysis of the data using the Genstat 13th edition (Ireland 2010). Each farmer’s field was considered a replication. Thus, in all trials conducted in farmers’ fields, the farmer’s practice treatment was compared with balanced nutrition treatment (combined application of N, P, K with S, B and Zn). Details of participatory trials conducted during 2008-09 to 2011-12 are given in Table 6.
The rainfall received in the target districts during rainy (June through September) and post-rainy (October through January) seasons during 2008-09 to 2011-12 is given in Table 7. The total amount of water received through rainfall (mm) during crop growth at respective trial locations was also used to work out the rainwater use efficiency (RWUE) of crop production as kg of food grain produced per ha through per mm of rainwater received (kg mm-1 ha-1).
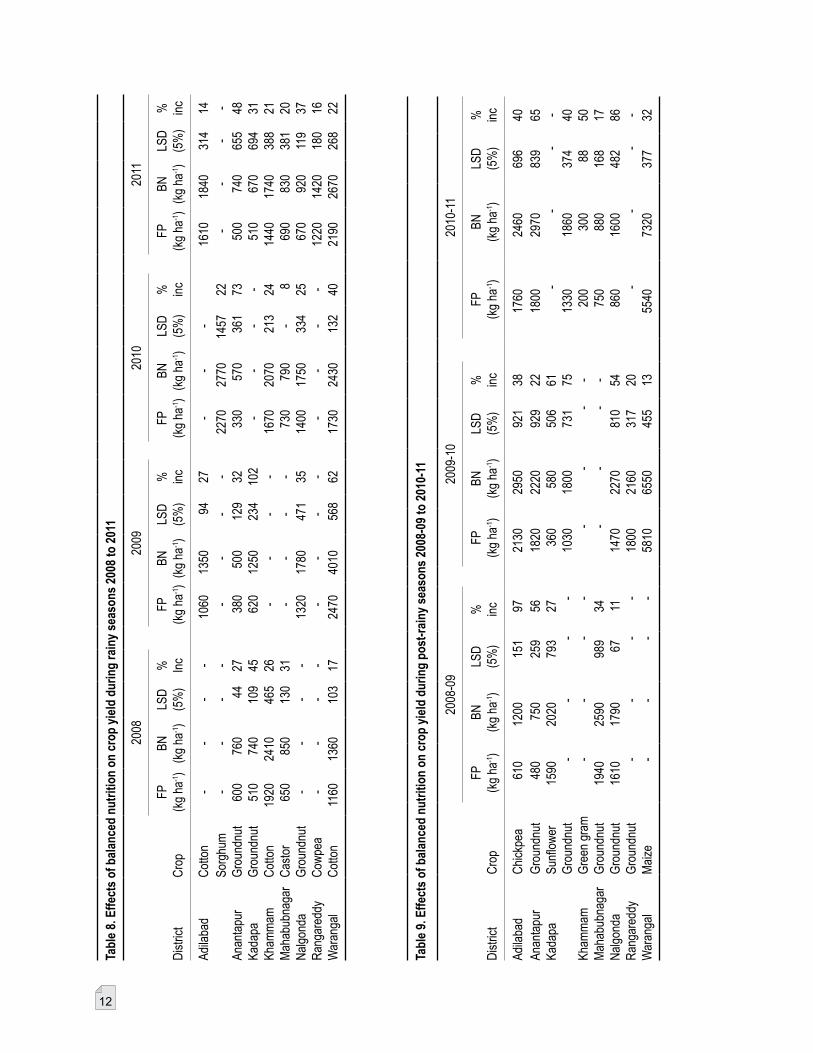
Trials during rainy seasonsAcross the districts, the balanced nutrition improved crop productivity of a range of rainy season crops like cotton, groundnut, castor, sorghum and cowpea (Table 8; Figure 4-5).
During four years (2008 to 2011), on-farm cotton productivity under farmers’ practices in Adilabad, Khammam and Warangal districts varied between 1060 kg ha-1 and 2470 kg ha-1. The on-farm trials during 2008 to 2011 showed beneficial responses to balanced nutrition. The application of balanced nutrition increased cotton productivity (lint+seed) by 14% to 62% over the farmers’ practice.
12
Tabl
e 8.
Effe
cts
of b
alan
ced
nutr
ition
on
crop
yie
ld d
urin
g ra
iny
seas
ons
2008
to 2
011
Dis
trict
Cro
p
2008
2009
2010
2011
FP(k
g ha
-1)
BN(k
g ha
-1)
LSD
(5%
)% In
cFP
(kg
ha-1)
BN(k
g ha
-1)
LSD
(5%
)% in
cFP
(kg
ha-1)
BN(k
g ha
-1)
LSD
(5%
)% in
cFP
(kg
ha-1)
BN(k
g ha
-1)
LSD
(5%
)% in
c
Adila
bad
Cot
ton
--
--
1060
1350
9427
--
-16
1018
4031
414
Sorg
hum
--
--
--
--
2270
2770
1457
22-
--
-An
anta
pur
Gro
undn
ut60
076
044
2738
050
012
932
330
570
361
7350
074
065
548
Kada
paG
roun
dnut
510
740
109
4562
012
5023
410
2-
--
-51
067
069
431
Kham
mam
Cot
ton
1920
2410
465
26-
--
-16
7020
7021
324
1440
1740
388
21M
ahab
ubna
gar
Cas
tor
650
850
130
31-
--
-73
079
0-
869
083
038
120
Nal
gond
aG
roun
dnut
--
--
1320
1780
471
3514
0017
5033
425
670
920
119
37R
anga
redd
yC
owpe
a-
--
--
--
--
--
-12
2014
2018
016
War
anga
lC
otto
n11
6013
6010
317
2470
4010
568
6217
3024
3013
240
2190
2670
268
22
Tabl
e 9.
Effe
cts
of b
alan
ced
nutr
ition
on
crop
yie
ld d
urin
g po
st-r
ainy
sea
sons
200
8-09
to 2
010-
11
Dis
trict
Cro
p
2008
-09
2009
-10
2010
-11
FP(k
g ha
-1)
BN(k
g ha
-1)
LSD
(5%
)% in
cFP
(kg
ha-1)
BN(k
g ha
-1)
LSD
(5%
)% in
cFP
(kg
ha-1)
BN(k
g ha
-1)
LSD
(5%
)% in
c
Adila
bad
Chi
ckpe
a61
012
0015
197
2130
2950
921
3817
6024
6069
640
Anan
tapu
rG
roun
dnut
480
750
259
5618
2022
2092
922
1800
2970
839
65Ka
dapa
Sunf
low
er15
9020
2079
327
360
580
506
61-
--
-G
roun
dnut
--
--
1030
1800
731
7513
3018
6037
440
Kham
mam
Gre
en g
ram
--
--
--
--
200
300
8850
Mah
abub
naga
rG
roun
dnut
1940
2590
989
34-
--
-75
088
016
817
Nal
gond
aG
roun
dnut
1610
1790
6711
1470
2270
810
5486
016
0048
286
Ran
gare
ddy
Gro
undn
ut-
--
-18
0021
6031
720
--
--
War
anga
lM
aize
--
--
5810
6550
455
1355
4073
2037
732

13
The farmers’ practice of groundnut cultivation in Anantapur, Kadapa and Nalgonda districts recorded groundnut yield in the range of 330 kg ha-1 to 1400 kg ha-1. The application of balanced nutrition increased yield by 25 to 102% over the farmers’ management.
Similarly, the application of balanced nutrition increased crop productivity in castor (8 to 31%) in Mahabubnagar, sorghum (22%) in Adilabad and cowpea (16%) in Rangareddy districts.
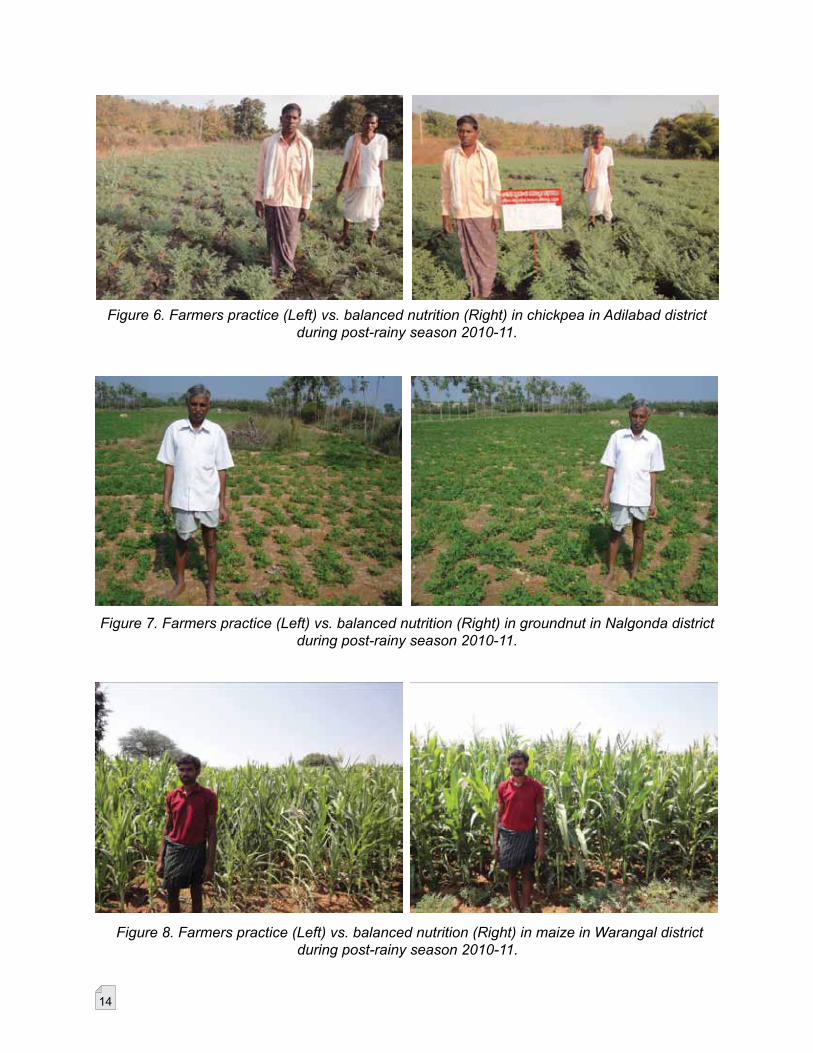
Trials during post-rainy seasons Like rainy season crops, the benefits of balanced nutrition in improved productivity were also found in post-rainy season crops like groundnut, chickpea, sunflower, greengram and maize (Table 9; Figure 6-8).
Figure 5. Farmers practice (Left) vs. balanced nutrition (Right) in cotton in Warangal district during rainy season 2011.
Figure 4. Farmers practice (Left) and balanced nutrition (Right) in cotton in Khammam district during rainy season 2010.
14
Figure 6. Farmers practice (Left) vs. balanced nutrition (Right) in chickpea in Adilabad district during post-rainy season 2010-11.
Figure 7. Farmers practice (Left) vs. balanced nutrition (Right) in groundnut in Nalgonda district during post-rainy season 2010-11.
Figure 8. Farmers practice (Left) vs. balanced nutrition (Right) in maize in Warangal district during post-rainy season 2010-11.

15
Participatory trials were conducted with post-rainy season groundnut in Anantapur, Kadapa, Mahabubnagar, Nalgonda and Rangareddy districts during three constructive years (2008-09 to 2010-11). Across the districts, the farmers’ management practice recorded yields in the range of 480 kg ha-1 to 1940 kg ha-1, thereby showing higher groundnut yields during post-rainy season in comparison to rainy season. The results showed 11 to 86% increase in productivity with the application of balanced nutrition (880 kg ha-1 to 2970 kg ha-1) as compared with the farmers’ practice.
The benefits of balanced nutrition in productivity improvement over the farmers practice were also recorded in chickpea (38 to 97%) in Adilabad, sunflower (27 to 61%) in Kadapa, greengram (50%) in Khammam and maize (13 to 32%) in Warangal.
Economics of crop production
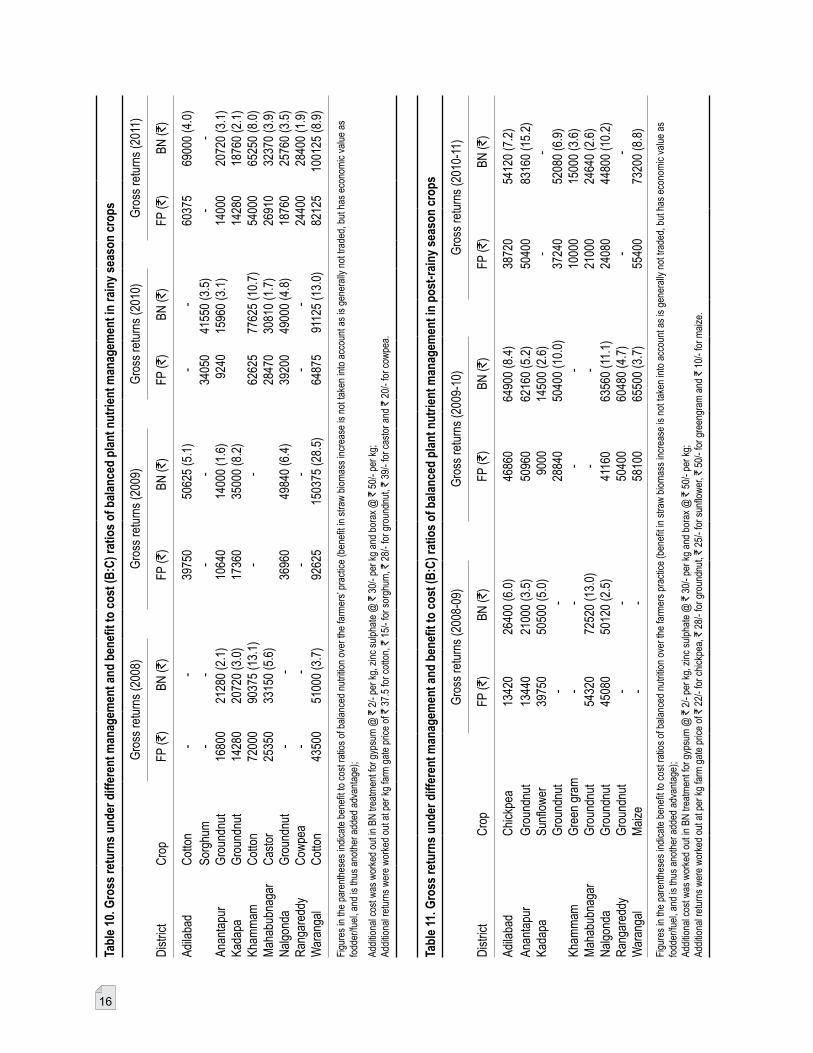
Rainy season cropsAn economic analysis in case of cotton in Adilabad, Khammam and Warangal districts showed per ha gross return in the range of ` 39750/- to ` 92625/- for farmers practice; while the balanced nutrition increased it in the range of ` 50625/- to ` 150375/- (Table 10). The adoption of soil test-based application of S, B and Zn under balanced nutrition brought in per ha additional cost of ` 1400/- to ` 2150/- with additional returns of ` 7500/- to ` 57750/-. The benefit to cost ratio varied between 3.7 to 28.5, thus showing soil test based balanced nutrition an acceptable technology at the farm level.
In groundnut crop, the gross returns ranged from ` 9240/- to ` 39200/- under the farmers practice which increased to from ` 14000/- to ` 49840/- under the balanced nutrient management. The additional cost incurred on balanced nutrition was from ` 2025/- to ` 2150/-, while the additional returns varied between ̀ 3360/- and ̀ 17640/-. A favorable benefit to cost ratio (1.6 to 8.2) showed economic viability of the technology for scaling up at the farm level.
Similarly, the gross returns were lower under the farmers management for castor (` 25350/- to ` 28470/-) in Mahabubnagar, sorghum (` 34050/-) in Adilabad, and cowpea (` 24400/-) in Rangareddy which enhanced under the balanced nutrient management to ` 30810/- to ` 33150/- for castor, ` 41550 for sorghum and ` 28400/- for cowpea. The additional cost of technology was mere ` 1400/- for castor, while ` 2150/- each for sorghum and cowpea. The benefit to cost ratio of balanced nutrient management was very favorable for castor (1.7 to 5.6) in Mahabubnagar district, sorghum (3.5) in Adilabad and cowpea (1.9) in Rangareddy for adoption at farm level.
Post-rainy season cropsThe cultivation of groundnut crop in the targeted districts under the farmers’ management practice brought in a gross return in the range of ̀ 13440/- to ̀ 54320/- (Table 11). The benefits of balanced nutrition were evident in enhanced gross returns at ` 21000/- to ` 83160/-. In different districts, the additional cost of soil test based balanced nutrition varied between ` 1400/- and ` 2150/-. The additional returns were higher at ` 3640/- to ` 32760/-. Per rupee invested on balanced nutrition returned ` 2.5 to ` 15.2, thereby proving it a profitable proposition.
16
Tabl
e 10
. Gro
ss re
turn
s un
der d
iffer
ent m
anag
emen
t and
ben
efit
to c
ost (
B:C
) rat
ios
of b
alan
ced
plan
t nut
rient
man
agem
ent i
n ra
iny
seas
on c
rops
Dis
trict
Cro
p
Gro
ss re
turn
s (2
008)
Gro
ss re
turn
s (2
009)
Gro
ss re
turn
s (2
010)
Gro
ss re
turn
s (2
011)
FP (`
)BN
(`)
FP (`
)BN
(`)
FP (`
)BN
(`)
FP (`
)BN
(`)
Adila
bad
Cot
ton
--
3975
050
625
(5.1
)-
-60
375
6900
0 (4
.0)
Sorg
hum
--
--
3405
041
550
(3.5
)-
-An
anta
pur
Gro
undn
ut16
800
2128
0 (2
.1)
1064
014
000
(1.6
) 9
240
1596
0 (3
.1)
1400
020
720
(3.1
)Ka
dapa
Gro
undn
ut14
280
2072
0 (3
.0)
1736
035
000
(8.2
)14
280
1876
0 (2
.1)
Kham
mam
Cot
ton
7200
090
375
(13.
1)-
-62
625
7762
5 (1
0.7)
5400
065
250
(8.0
)M
ahab
ubna
gar
Cas
tor
2535
033
150
(5.6
)28
470
3081
0 (1
.7)
2691
032
370
(3.9
)N
algo
nda
Gro
undn
ut-
-36
960
4984
0 (6
.4)
3920
049
000
(4.8
)18
760
2576
0 (3
.5)
Ran
gare
ddy
Cow
pea
--
--
--
2440
028
400
(1.9
)W
aran
gal
Cot
ton
4350
051
000
(3.7
)92
625
1503
75 (2
8.5)
6487
591
125
(13.
0)82
125
1001
25 (8
.9)
Figu
res
in th
e pa
rent
hese
s in
dica
te b
enef
it to
cos
t rat
ios
of b
alan
ced
nutri
tion
over
the
farm
ers’
prac
tice
(ben
efit
in s
traw
bio
mas
s in
crea
se is
not
take
n in
to a
ccou
nt a
s is
gen
eral
ly n
ot tr
aded
, but
has
eco
nom
ic v
alue
as
fodd
er/fu
el, a
nd is
thus
ano
ther
add
ed a
dvan
tage
);
Addi
tiona
l cos
t was
wor
ked
out i
n BN
trea
tmen
t for
gyp
sum
@ `
2/-
per k
g, z
inc
sulp
hate
@ `
30/
- per
kg
and
bora
x @
` 5
0/- p
er k
g;
Addi
tiona
l ret
urns
wer
e w
orke
d ou
t at p
er k
g fa
rm g
ate
pric
e of
` 3
7.5
for c
otto
n, `
15/
- for
sor
ghum
, ` 2
8/- f
or g
roun
dnut
, ` 3
9/- f
or c
asto
r and
` 2
0/- f
or c
owpe
a.
Tabl
e 11
. Gro
ss re
turn
s un
der d
iffer
ent m
anag
emen
t and
ben
efit
to c
ost (
B:C
) rat
ios
of b
alan
ced
plan
t nut
rient
man
agem
ent i
n po
st-r
ainy
sea
son
crop
s
Dis
trict
Cro
p
Gro
ss re
turn
s (2
008-
09)
Gro
ss re
turn
s (2
009-
10)
Gro
ss re
turn
s (2
010-
11)
FP (`
)BN
(`)
FP (`
)BN
(`)
FP (`
)BN
(`)
Adila
bad
Chi
ckpe
a13
420
2640
0 (6
.0)
4686
064
900
(8.4
)38
720
5412
0 (7
.2)
Anan
tapu
rG
roun
dnut
1344
021
000
(3.5
)50
960
6216
0 (5
.2)
5040
083
160
(15.
2)Ka
dapa
Sunf
low
er39
750
5050
0 (5
.0)
900
014
500
(2.6
)-
-G
roun
dnut
--
2884
050
400
(10.
0)37
240
5208
0 (6
.9)
Kham
mam
Gre
en g
ram
--
--
1000
015
000
(3.6
)M
ahab
ubna
gar
Gro
undn
ut54
320
7252
0 (1
3.0)
--
2100
024
640
(2.6
)N
algo
nda
Gro
undn
ut45
080
5012
0 (2
.5)
4116
063
560
(11.
1)24
080
4480
0 (1
0.2)
Ran
gare
ddy
Gro
undn
ut-
-50
400
6048
0 (4
.7)
--
War
anga
lM
aize
--
5810
065
500
(3.7
)55
400
7320
0 (8
.8)
Figu
res
in th
e pa
rent
hese
s in
dica
te b
enef
it to
cos
t rat
ios
of b
alan
ced
nutri
tion
over
the
farm
ers
prac
tice
(ben
efit
in s
traw
bio
mas
s in
crea
se is
not
take
n in
to a
ccou
nt a
s is
gen
eral
ly n
ot tr
aded
, but
has
eco
nom
ic v
alue
as
fodd
er/fu
el, a
nd is
thus
ano
ther
add
ed a
dvan
tage
);Ad
ditio
nal c
ost w
as w
orke
d ou
t in
BN tr
eatm
ent f
or g
ypsu
m @
` 2
/- pe
r kg,
zin
c su
lpha
te @
` 3
0/- p
er k
g an
d bo
rax
@ `
50/
- per
kg;
Ad
ditio
nal r
etur
ns w
ere
wor
ked
out a
t per
kg
farm
gat
e pr
ice
of `
22/
- for
chi
ckpe
a, `
28/
- for
gro
undn
ut, `
25/
- for
sun
flow
er, `
50/
- for
gre
engr
am a
nd `
10/
- for
mai
ze.

17
Similarly, farmers’ input treatment recorded gross returns in the range of ̀ 13420/- to ̀ 46860/- for chickpea in Adilabad, ` 9000/- to ` 39750/- for sunflower in Kadapa, ` 10000/- for greengram in Khammam and ` 55400/- to ` 58100/- for maize in Warangal. However, the adoption of balanced nutrition recorded higher gross returns at ` 26400/- to ` 64900/- for chickpea, ` 14500/- to ` 50500/- for sunflower, ` 15000/- for greengram and ` 65500/- to ` 73200/- for maize. The additional cost of technology was ̀ 2150/- for both chickpea in Adilabad and sunflower in Kadapa, while ` 1400/- for greengram in Khammam and ` 2025 for maize in Warangal. The additional returns under balanced nutrition varied from ` 12980/- to ` 18040/- for chickpea, ` 5500/- to ` 10750/- for sunflower, ` 5000/- for greengram and ` 7400/- to 17800/- for maize. The benefit to cost ratios of the technology in all the crops were very favorable to promote it at the farm level – 6.0 to 8.4 in chickpea, 2.6 to 5.0 in sunflower, 3.6 in greengram and 3.7 to 8.8 in maize.
Diversification to vegetablesThe issue in dryland tropics in Andhra Pradesh is not only of low crop productivity, but also of low value crops. In the IMOD (Inclusive Market Oriented Development Strategy) model for livelihood improvement in the dryland tropics, crop diversification with high-value crops is promoted with the rural poor to generate more incomes. In Warangal district, farmers diversified to different vegetable crops and harvested 4,710 kg ha-1 tomato, 5,600 kg ha-1 okra and 3,790 kg ha-1 brinjal with cultivation by their own management (Figure 9). In the plots where balanced nutrition was followed, they got higher productivity to the tune of 21% in tomato, 17% in okra and 14% in brinjal. In balanced nutrition, farmers incurred an additional cost of ` 2025/- on the application of deficient S, B and Zn, while received far higher additional returns to the tune of ̀ 4,950/- in tomato, ` 11,650/- in okra and ` 6,240/- in brinjal.
Figure 9. Effects of balanced nutrition on vegetable yield in Warangal district during post-rainy season 2008-09
Farmers’ practice7000
6000
5000
4000
3000
2000
1000
0 Tomato Okra Brinjal
Frui
t yie
ld (k
g ha
-1)
Balanced nutrition

18
35000 –
30000 –
25000 –
20000 –
15000 –
10000 –
5000 –
0 –
12000
Kadapa Nalgonda
13940
21940
29900M
arke
tabl
e yi
eld
(kg
ha-1)
Farmers’ practice
Balanced nutrition
Figure 10. Effects of balanced nutrition on tomato marketable yield in Kadapa and Nalgonda districts during post-rainy season 2009-10.
In Kadapa and Nalgonda district, farmers diversified to tomato crop and harvested 12,000 kg ha-1
in Kadapa, while 21,940 kg ha-1 in Nalgonda by following their own management (Figure 10). In the plots where balanced nutrition was applied, they got 16% higher productivity in Kadapa and 36% in Nalgonda. In improved management plots, farmers incurred an additional cost of ` 2,150/- in Kadapa and ` 2,050/- in Nalgonda on the application of deficient S, B and Zn. The additional returns however were far higher than additional cost of balanced nutrition, at ` 9,700/- in Kadapa and ` 39,800/- in Nalgonda.
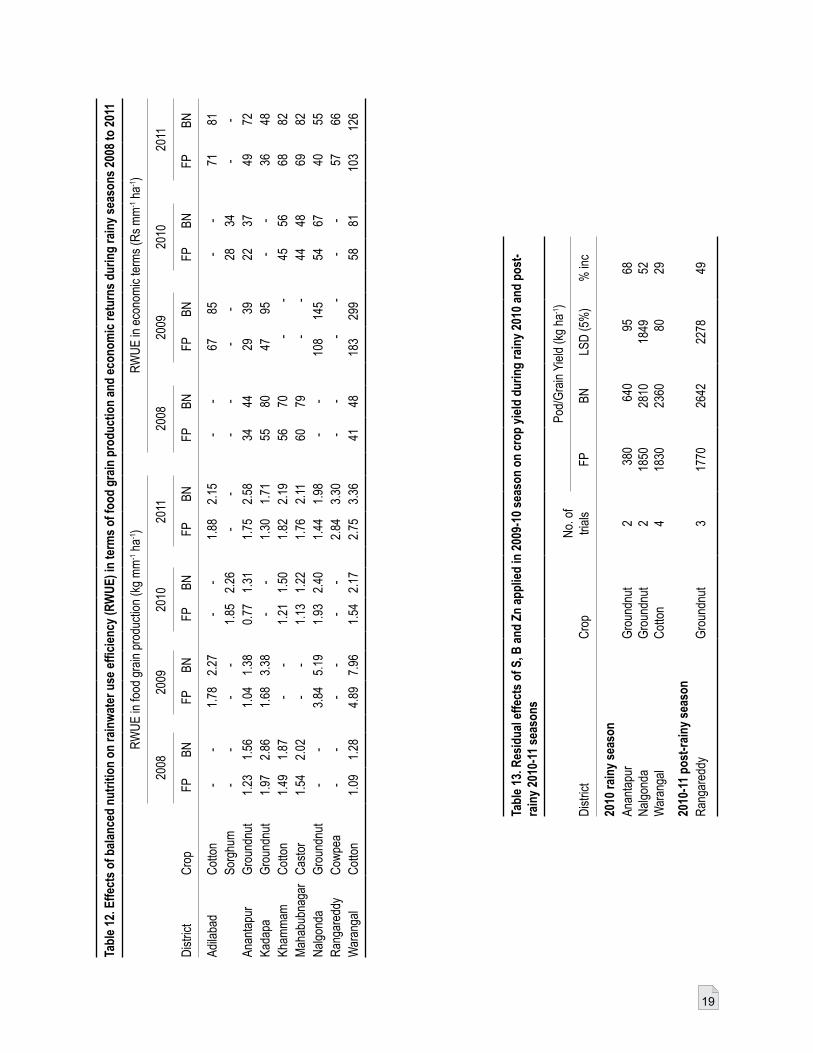
Rainwater use efficiency Water is a scarce resource and chief determinant of poverty and hunger in rural areas in Andhra Pradesh. So improving rainwater use efficiency (RWUE) is important for achieving food security and better livelihoods. Rainwater use efficiency indicates how best the precious rainfall is used for crop production. The RWUE in simple terms is calculated as grain yield (kg) produced per unit (mm) of rainfall per ha and expressed as kg mm-1 ha-1.
In general the RWUE of food grain production is low under the current farmers’ practice of cultivation which varied between 1.09 to 4.89 kg mm-1 ha-1 for cotton, 0.77 to 3.84 kg mm-1 ha-1 for groundnut, 1.13 to 1.76 kg mm-1 ha-1 for castor, 1.85 kg mm-1 ha-1 for sorghum and 2.84 kg mm-1 ha-1 for cowpea (Table 12). The plants were not able to make the best of available water resources because of constraints to growth in terms of low soil fertility due to deficiencies of secondary and micronutrients. Under balanced nutrition, the RWUE increased to 1.28 to 7.96 kg mm-1 ha-1 in cotton, 1.31 to 5.19 kg mm-1 ha-1 in groundnut, 1.22 to 2.11 kg mm-1 ha-1 in castor, 2.26 kg mm-1 ha-1 in sorghum and 3.30 kg mm-1 ha-1 in cowpea. In monetary terms, 1 mm of rainfall
19
Tabl
e 12
. Effe
cts
of b
alan
ced
nutr
ition
on
rain
wat
er u
se e
ffici
ency
(RW
UE)
in te
rms
of fo
od g
rain
pro
duct
ion
and
econ
omic
retu
rns
durin
g ra
iny
seas
ons
2008
to 2
011
Dis
trict
Cro
p
RW
UE
in fo
od g
rain
pro
duct
ion
(kg
mm
-1 h
a-1)
RW
UE
in e
cono
mic
term
s (R
s m
m-1 h
a-1)
2008
2009
2010
2011
2008
2009
2010
2011
FPBN
FPBN
FPBN
FPBN
FPBN
FPBN
FPBN
FPBN
Adila
bad
Cot
ton
--
1.78
2.27
--
1.88
2.15
--
6785
--
7181
Sorg
hum
--
--
1.85
2.26
--
--
--
2834
--
Anan
tapu
rG
roun
dnut
1.23
1.56
1.04
1.38
0.77
1.31
1.75
2.58
3444
2939
2237
4972
Kada
paG
roun
dnut
1.97
2.86
1.68
3.38
--
1.30
1.71
5580
4795
--
3648
Kham
mam
Cot
ton
1.49
1.87
--
1.21
1.50
1.82
2.19
5670
--
4556
6882
Mah
abub
naga
rC
asto
r1.
542.
02-
-1.
131.
221.
762.
1160
79-
-44
4869
82N
algo
nda
Gro
undn
ut-
-3.
845.
191.
932.
401.
441.
98-
-10
814
554
6740
55R
anga
redd
yC
owpe
a-
--
--
-2.
843.
30-
--
--
-57
66W
aran
gal
Cot
ton
1.09
1.28
4.89
7.96
1.54
2.17
2.75
3.36
4148
183
299
5881
103
126
Tabl
e 13
. Res
idua
l effe
cts
of S
, B a
nd Z
n ap
plie
d in
200
9-10
sea
son
on c
rop
yiel
d du
ring
rain
y 20
10 a
nd p
ost-
rain
y 20
10-1
1 se
ason
s
Dis
trict
Cro
pN
o. o
f tri
als
Pod/
Gra
in Y
ield
(kg
ha-1)
FPBN
LSD
(5%
)%
inc
2010
rain
y se
ason
Anan
tapu
rG
roun
dnut
2 3
80 6
40
9568
Nal
gond
aG
roun
dnut
218
5028
1018
4952
War
anga
lC
otto
n4
1830
2360
80
29
2010
-11
post
-rai
ny s
easo
nR
anga
redd
yG
roun
dnut
317
7026
4222
7849
20
under farmers’ practice yielded gross returns between Rs 41 to 183 with cotton, Rs 22 to 108 with groundnut, Rs 44-69 with castor, Rs 28 with sorghum and Rs 57 with cowpea. While under balanced nutrient management practice, 1 mm rainfall enhanced gross returns varying from Rs 48 to 299 in cotton, Rs 37 to 145 in groundnut, Rs 48 to 82 in castor, Rs 34 in sorghum and Rs 66 in cowpea. The results showed that soil fertility management with a purpose to increase proportion of water balance as productive transpiration, is one of the most important rainwater management strategies to improve yields and water productivity (Rockstrom et al. 2010).
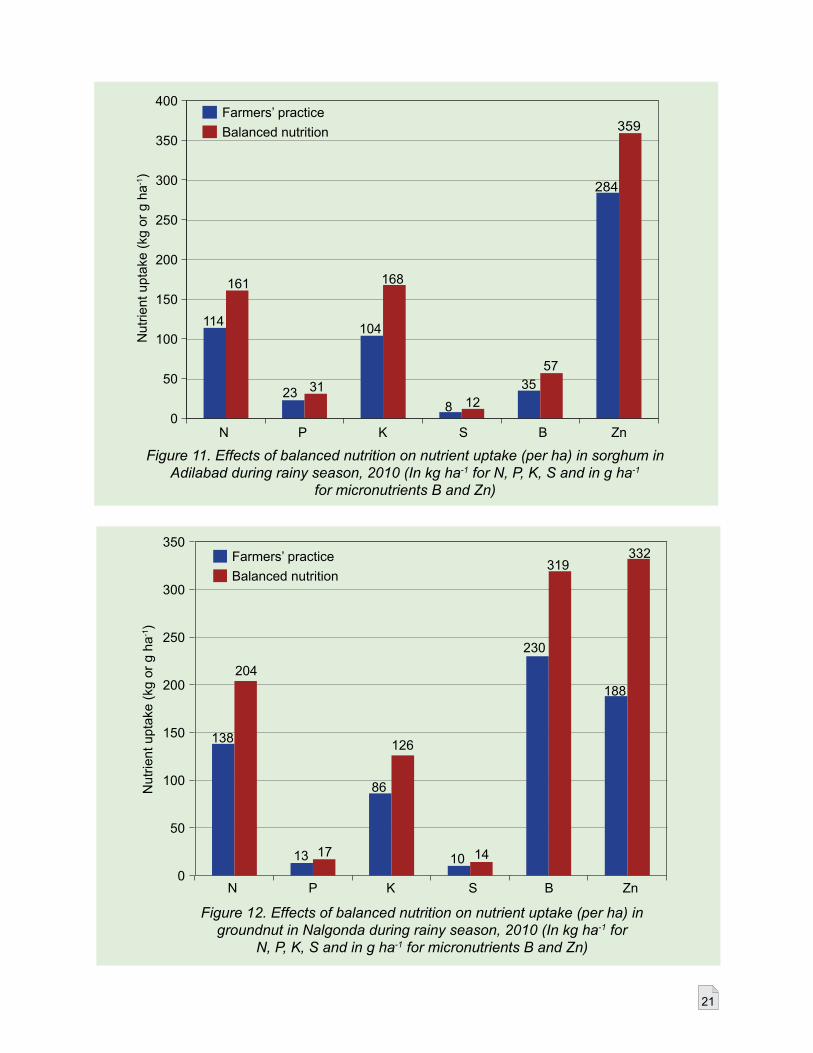
Nutrient uptake by cropsNutrient uptake study with sorghum in Adilabad showed higher nutrient removal under the balanced nutrition as compared with the farmers’ practice. The farmers’ practice removed 114 kg N ha-1, 23 kg P ha-1, 104 kg K ha-1, 8 kg S ha-1, 35 g B ha-1 and 284 g Zn ha-1 (Figure 11). The balanced nutrition increased uptake by 41% in N, 37% in P, 62% in K, 43% in S, 66% in B and 26% in Zn. This increase in nutrient uptake resulted due to increased growth and yield. Development of extensive roots apparently absorbed nutrients very effectively from far off places. Applied S, B and Zn in balanced nutrition apparently increased their availability in soil and uptake by the plants. Moreover, the nutrients like B enhances P availability in soil (Saha and Haldar 1998) probably due to borate-phosphate exchange mechanism resulting more uptake by plants. Extensive studies have also supported the idea that B in plants is credited with maintaining membrane integrity (Cakmak et al. 1995) and hence enhanced ability of membranes to transport vital nutrients.
Similarly, the uptake study with groundnut crop in Nalgonda showed nutrient removals to the tune of 138 kg N ha-1, 13 kg P ha-1, 86 kg K ha-1, 10 kg S ha-1, 230 kg B ha-1 and 188 kg Zn ha-1 (Figure 12). The balanced nutrition increased the nutrient removal by 48% in N, 37% in P, 47% in K, 50% in S, 39% in B and 77% in Zn.
Residual effect of secondary and micronutrientsMicronutrients are no doubt essential for plant production, but are required in small amounts and so may not be required to be added every season due to residual effects. Therefore, the residual effects of S, B and Zn added during the previous seasons were evaluated for crop production.
The residual benefits of previous seasons (post-rainy 2009-10) applied micro and secondary nutrients were evaluated during 2010 rainy season in Anantapur, Nalgonda and Warangal districts, and during 2010-11 post-rainy season in Rangareddy district. Residual benefits were evident in increased yields as compared with the farmers’ practice (Table 13; Figure 13). The yields were higher in plots with residual effects by 68% in groundnut in Anantapur, 52% in groundnut in Nalgonda and 29% in cotton in Warangal. In Rangareddy, the residual effects were seen even after 1 year of application. The groundnut crop pod yield was 49% higher as compared with the farmers practice (Table 13).
During 2011 rainy season, residual effects after one, two and four seasons were studied with cotton crop in Adilabad and Warangal district. The cotton yields in farmers’ fields in Adilabad and Warangal where S, B and Zn were applied during rainy season 2009, rainy season 2010 and
21
Figure 11. Effects of balanced nutrition on nutrient uptake (per ha) in sorghum in Adilabad during rainy season, 2010 (In kg ha-1 for N, P, K, S and in g ha-1
for micronutrients B and Zn)
400
350
300
250
200
150
100
50
0 N P K S B Zn
161
23 31
104
168
8 1235
57
284
359Farmers’ practice
Nut
rient
upt
ake
(kg
or g
ha-1
)Balanced nutrition
114
Nut
rient
upt
ake
(kg
or g
ha-1
)
Figure 12. Effects of balanced nutrition on nutrient uptake (per ha) in groundnut in Nalgonda during rainy season, 2010 (In kg ha-1 for
N, P, K, S and in g ha-1 for micronutrients B and Zn)
350
300
250
200
150
100
50
0
138
204
13 17
86
126
10 14
230
319332
188
N P K S B Zn
Farmers’ practiceBalanced nutrition

22
Figure 13. Farmers practice (Left) vs. residual effects of balanced nutrition (Right) in cotton in Warangal district during rainy season 2010
post-rainy season 2010-11were observed higher than the farmers practice plots. In 2 districts, the residual benefits varied between 5 and 24% (Table 14). The soil test based balanced nutrition, thus not only benefits farmers during the season of application, but rather increases the resilience of production systems for benefits in future.
Table 14. Residual effects of S, B and Zn application on crop yield during rainy season 2011
District CropNo of trials
Season of SBZn application
Pod/Grain/seed cotton yield (kg ha-1)
FP BN LSD (5%) % inc
Adilabad Cotton 3 Post-rainy 2010-11 1690 1780 286 5Adilabad Cotton 3 Rainy 2010 1530 1660 500 8
Adilabad Cotton 2 Rainy 2009 1410 1530 141 9
Warangal Cotton 3 Post-rainy 2010-11 2040 2470 125 21
Warangal Cotton 3 Rainy 2010 2040 2520 130 24
Warangal Cotton 3 Rainy 2009 2040 2360 185 16
23
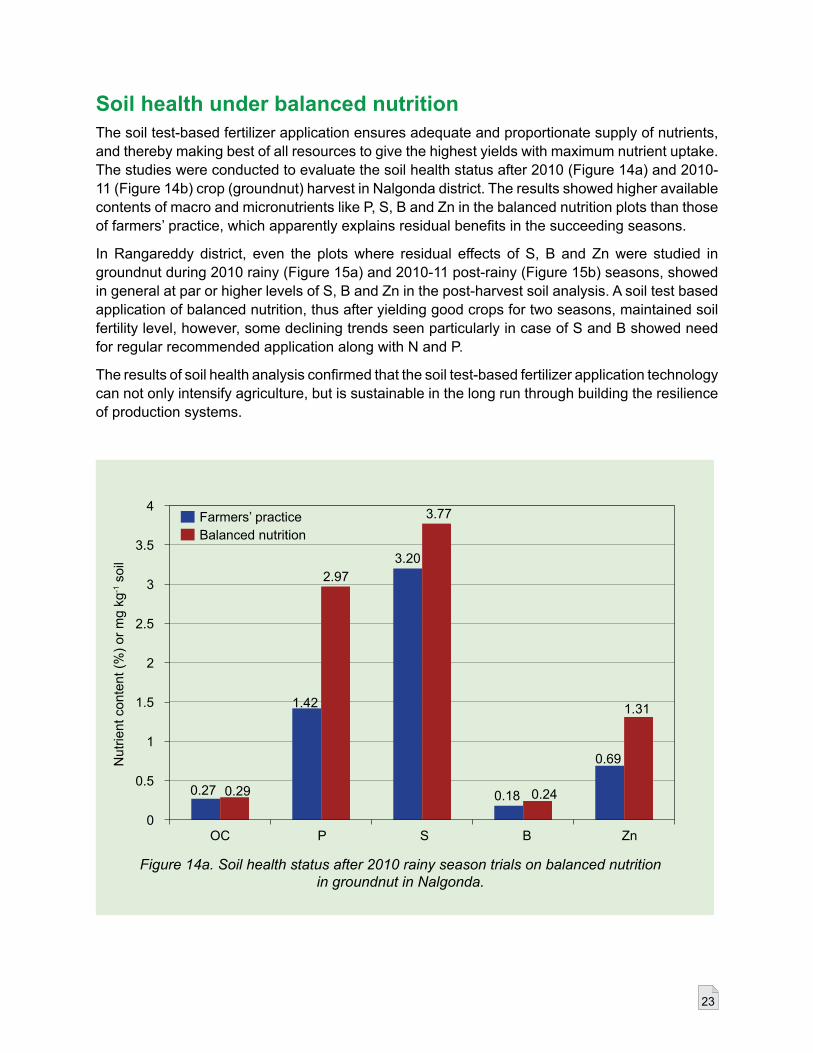
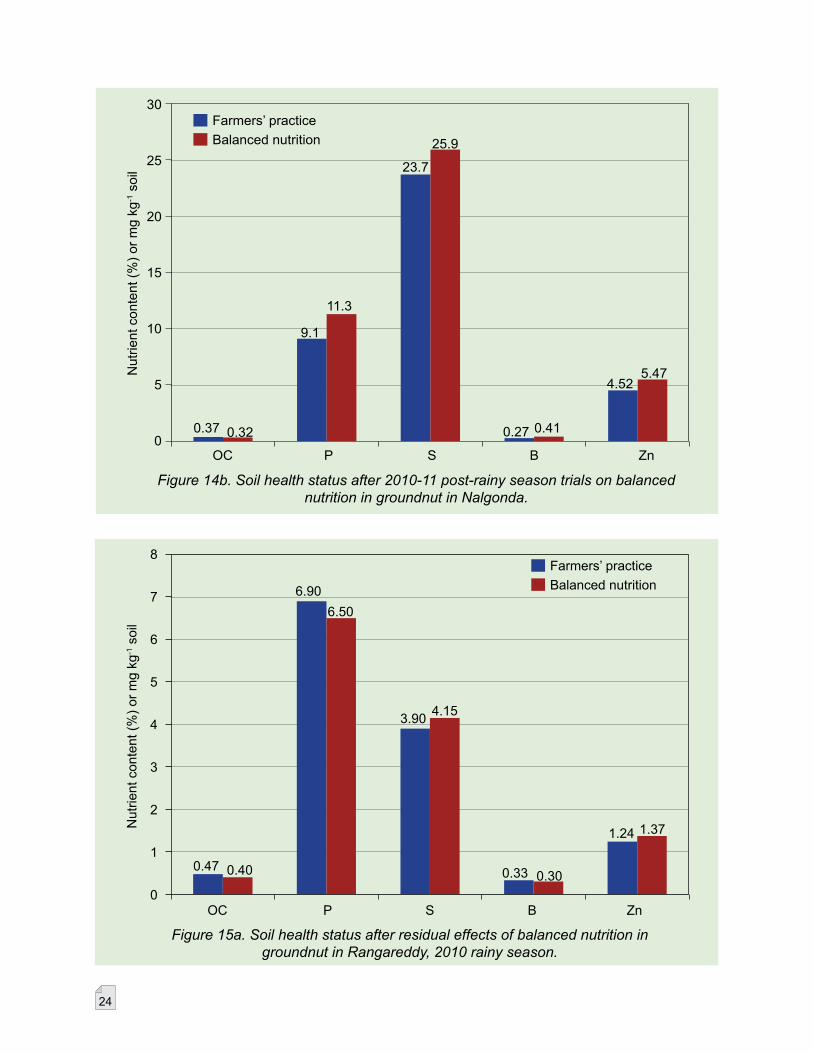
Soil health under balanced nutritionThe soil test-based fertilizer application ensures adequate and proportionate supply of nutrients, and thereby making best of all resources to give the highest yields with maximum nutrient uptake. The studies were conducted to evaluate the soil health status after 2010 (Figure 14a) and 2010-11 (Figure 14b) crop (groundnut) harvest in Nalgonda district. The results showed higher available contents of macro and micronutrients like P, S, B and Zn in the balanced nutrition plots than those of farmers’ practice, which apparently explains residual benefits in the succeeding seasons.
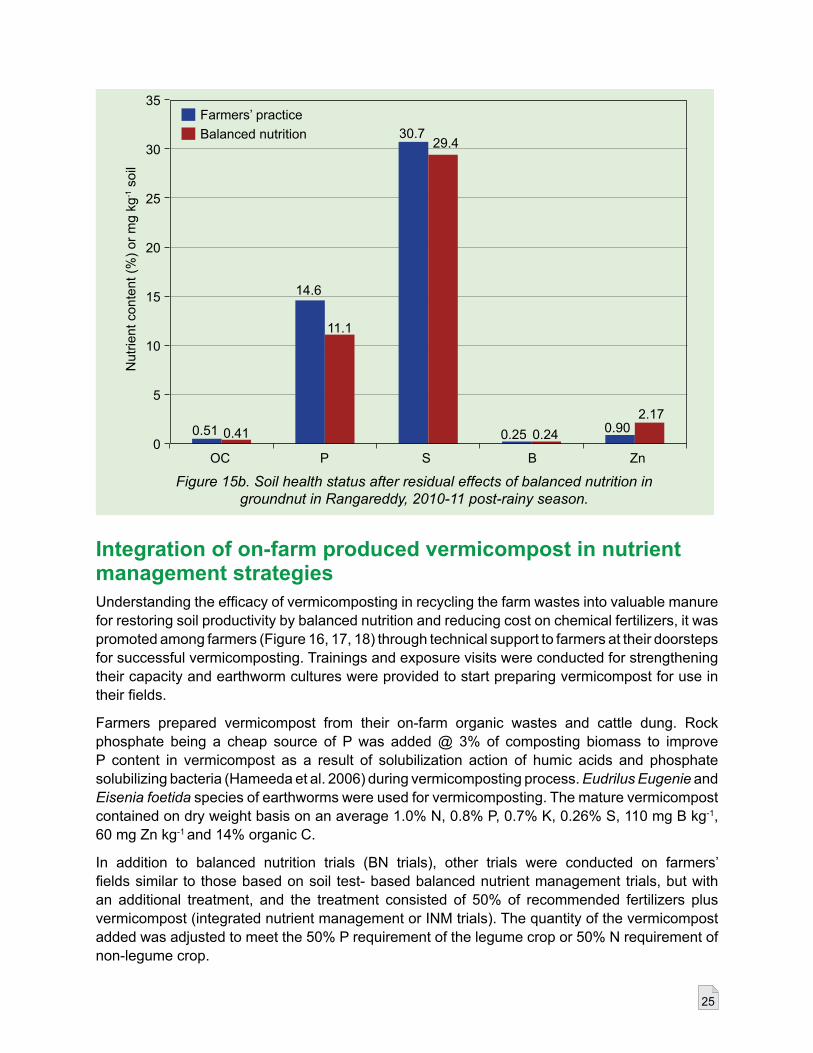
In Rangareddy district, even the plots where residual effects of S, B and Zn were studied in groundnut during 2010 rainy (Figure 15a) and 2010-11 post-rainy (Figure 15b) seasons, showed in general at par or higher levels of S, B and Zn in the post-harvest soil analysis. A soil test based application of balanced nutrition, thus after yielding good crops for two seasons, maintained soil fertility level, however, some declining trends seen particularly in case of S and B showed need for regular recommended application along with N and P.
The results of soil health analysis confirmed that the soil test-based fertilizer application technology can not only intensify agriculture, but is sustainable in the long run through building the resilience of production systems.
Figure 14a. Soil health status after 2010 rainy season trials on balanced nutrition in groundnut in Nalgonda.
4
3.5
3
2.5
2
1.5
1
0.5
0
0.27
OC P S B Zn
0.29
1.42
2.973.20
3.77
0.18 0.24
0.69
1.31
Farmers’ practiceBalanced nutrition
Nut
rient
con
tent
(%) o
r mg
kg-1 s
oil
24
30
25
20
15
10
5
0 0.37
OC P S B Zn
0.32
9.1
11.3
23.7
25.9
0.27 0.41
4.525.47
Farmers’ practiceBalanced nutrition
Figure 14b. Soil health status after 2010-11 post-rainy season trials on balanced nutrition in groundnut in Nalgonda.
Nut
rient
con
tent
(%) o
r mg
kg-1 s
oil
8
7
6
5
4
3
2
1
0 OC
0.47 0.40
6.906.50
3.90 4.15
0.33 0.30
1.24 1.37
P S B Zn
Farmers’ practiceBalanced nutrition
Figure 15a. Soil health status after residual effects of balanced nutrition in groundnut in Rangareddy, 2010 rainy season.
Nut
rient
con
tent
(%) o
r mg
kg-1 s
oil
25
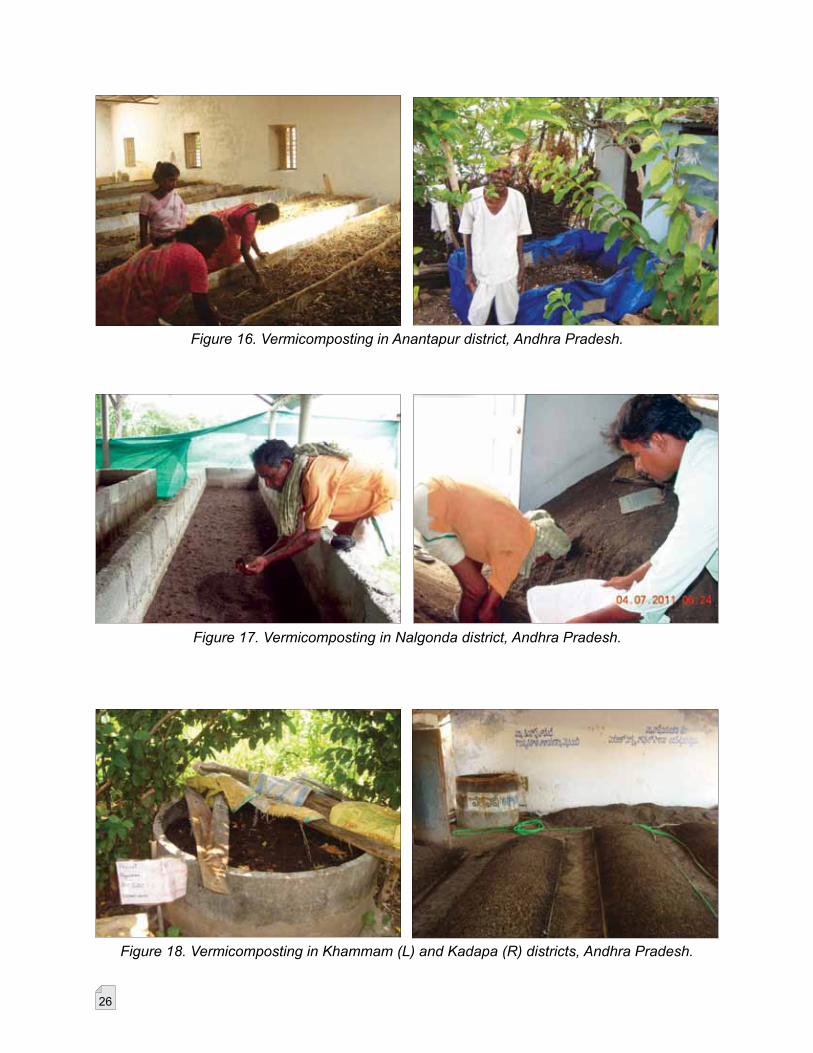
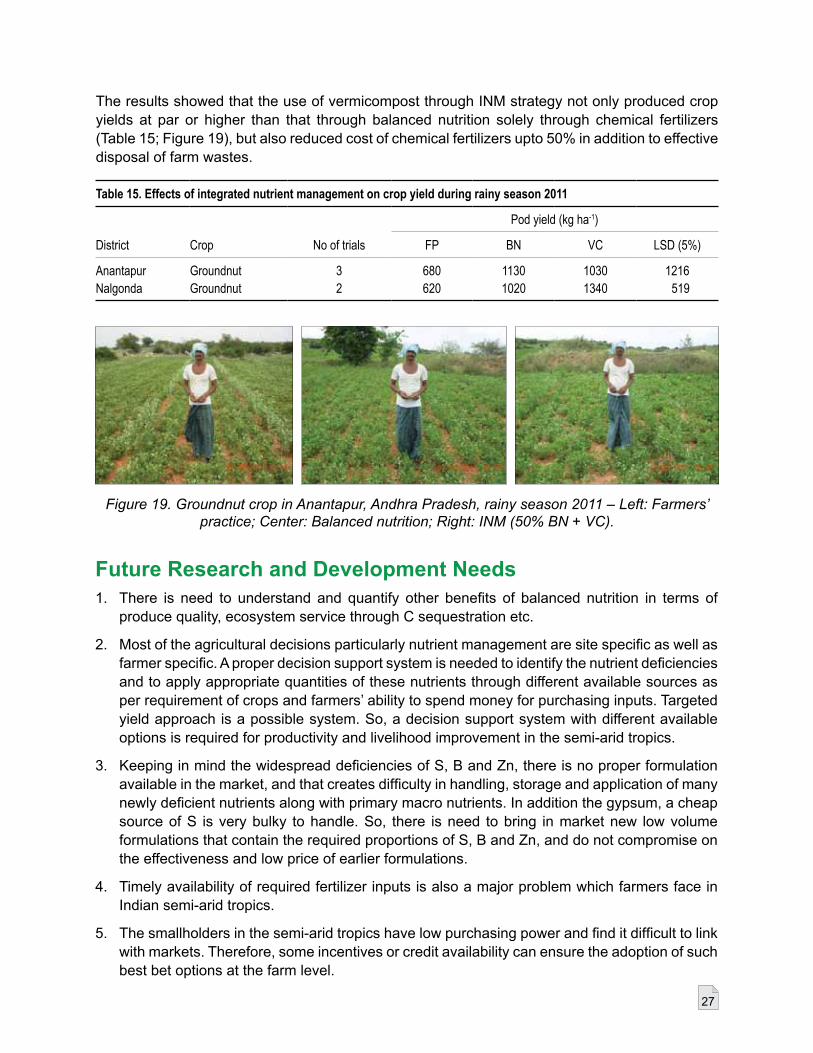
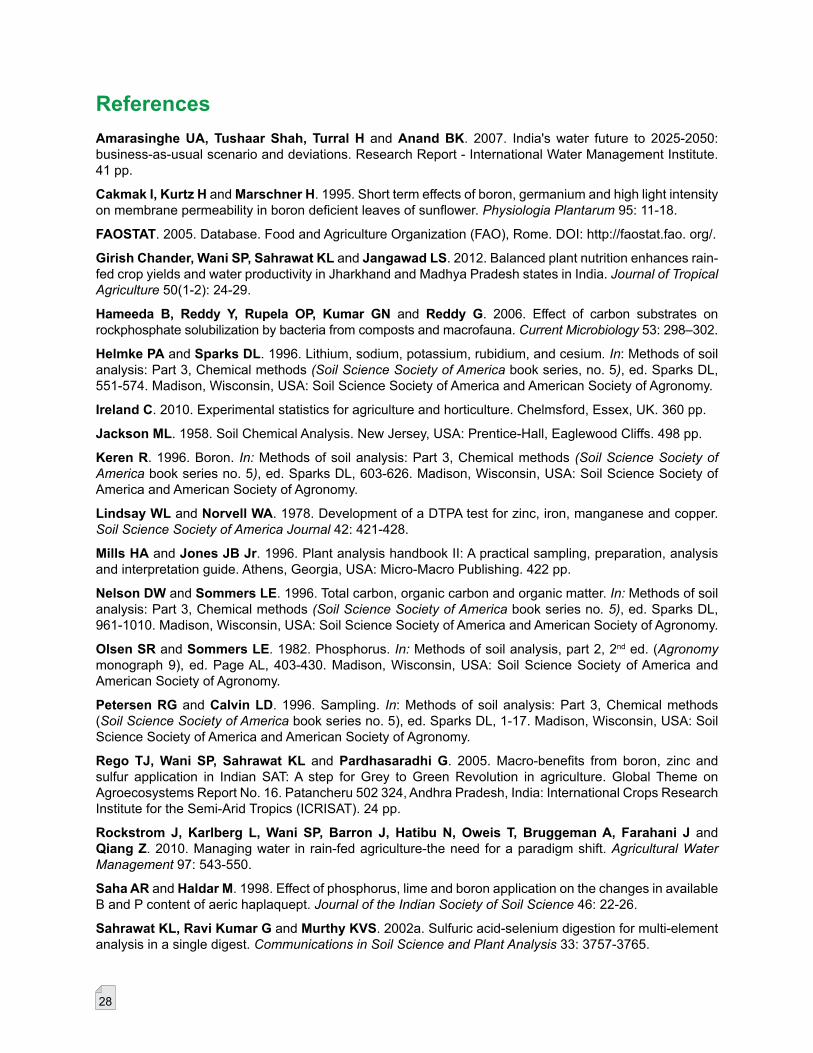
Integration of on-farm produced vermicompost in nutrient management strategiesUnderstanding the efficacy of vermicomposting in recycling the farm wastes into valuable manure for restoring soil productivity by balanced nutrition and reducing cost on chemical fertilizers, it was promoted among farmers (Figure 16, 17, 18) through technical support to farmers at their doorsteps for successful vermicomposting. Trainings and exposure visits were conducted for strengthening their capacity and earthworm cultures were provided to start preparing vermicompost for use in their fields.
Farmers prepared vermicompost from their on-farm organic wastes and cattle dung. Rock phosphate being a cheap source of P was added @ 3% of composting biomass to improve P content in vermicompost as a result of solubilization action of humic acids and phosphate solubilizing bacteria (Hameeda et al. 2006) during vermicomposting process. Eudrilus Eugenie and Eisenia foetida species of earthworms were used for vermicomposting. The mature vermicompost contained on dry weight basis on an average 1.0% N, 0.8% P, 0.7% K, 0.26% S, 110 mg B kg-1, 60 mg Zn kg-1 and 14% organic C.
In addition to balanced nutrition trials (BN trials), other trials were conducted on farmers’ fields similar to those based on soil test- based balanced nutrient management trials, but with an additional treatment, and the treatment consisted of 50% of recommended fertilizers plus vermicompost (integrated nutrient management or INM trials). The quantity of the vermicompost added was adjusted to meet the 50% P requirement of the legume crop or 50% N requirement of non-legume crop.
35
30
25
20
15
10
5
0 OC
0.51 0.41
14.6
11.1
30.729.4
0.25 0.24 0.902.17
P S B Zn
Farmers’ practiceBalanced nutrition
Figure 15b. Soil health status after residual effects of balanced nutrition in groundnut in Rangareddy, 2010-11 post-rainy season.
Nut
rient
con
tent
(%) o
r mg
kg-1 s
oil
26
Figure 16. Vermicomposting in Anantapur district, Andhra Pradesh.
Figure 17. Vermicomposting in Nalgonda district, Andhra Pradesh.
Figure 18. Vermicomposting in Khammam (L) and Kadapa (R) districts, Andhra Pradesh.
27
Figure 19. Groundnut crop in Anantapur, Andhra Pradesh, rainy season 2011 – Left: Farmers’ practice; Center: Balanced nutrition; Right: INM (50% BN + VC).
The results showed that the use of vermicompost through INM strategy not only produced crop yields at par or higher than that through balanced nutrition solely through chemical fertilizers (Table 15; Figure 19), but also reduced cost of chemical fertilizers upto 50% in addition to effective disposal of farm wastes.
Table 15. Effects of integrated nutrient management on crop yield during rainy season 2011
District Crop No of trials
Pod yield (kg ha-1)
FP BN VC LSD (5%)
Anantapur Groundnut 3 680 1130 1030 1216Nalgonda Groundnut 2 620 1020 1340 519
Future Research and Development Needs1. There is need to understand and quantify other benefits of balanced nutrition in terms of
produce quality, ecosystem service through C sequestration etc.
2. Most of the agricultural decisions particularly nutrient management are site specific as well as farmer specific. A proper decision support system is needed to identify the nutrient deficiencies and to apply appropriate quantities of these nutrients through different available sources as per requirement of crops and farmers’ ability to spend money for purchasing inputs. Targeted yield approach is a possible system. So, a decision support system with different available options is required for productivity and livelihood improvement in the semi-arid tropics.
3. Keeping in mind the widespread deficiencies of S, B and Zn, there is no proper formulation available in the market, and that creates difficulty in handling, storage and application of many newly deficient nutrients along with primary macro nutrients. In addition the gypsum, a cheap source of S is very bulky to handle. So, there is need to bring in market new low volume formulations that contain the required proportions of S, B and Zn, and do not compromise on the effectiveness and low price of earlier formulations.
4. Timely availability of required fertilizer inputs is also a major problem which farmers face in Indian semi-arid tropics.
5. The smallholders in the semi-arid tropics have low purchasing power and find it difficult to link with markets. Therefore, some incentives or credit availability can ensure the adoption of such best bet options at the farm level.
28
ReferencesAmarasinghe UA, Tushaar Shah, Turral H and Anand BK. 2007. India's water future to 2025-2050: business-as-usual scenario and deviations. Research Report - International Water Management Institute. 41 pp.
Cakmak I, Kurtz H and Marschner H. 1995. Short term effects of boron, germanium and high light intensity on membrane permeability in boron deficient leaves of sunflower. Physiologia Plantarum 95: 11-18.
FAOSTAT. 2005. Database. Food and Agriculture Organization (FAO), Rome. DOI: http://faostat.fao. org/.
Girish Chander, Wani SP, Sahrawat KL and Jangawad LS. 2012. Balanced plant nutrition enhances rain-fed crop yields and water productivity in Jharkhand and Madhya Pradesh states in India. Journal of Tropical Agriculture 50(1-2): 24-29.
Hameeda B, Reddy Y, Rupela OP, Kumar GN and Reddy G. 2006. Effect of carbon substrates on rockphosphate solubilization by bacteria from composts and macrofauna. Current Microbiology 53: 298–302.
Helmke PA and Sparks DL. 1996. Lithium, sodium, potassium, rubidium, and cesium. In: Methods of soil analysis: Part 3, Chemical methods (Soil Science Society of America book series, no. 5), ed. Sparks DL, 551-574. Madison, Wisconsin, USA: Soil Science Society of America and American Society of Agronomy.
Ireland C. 2010. Experimental statistics for agriculture and horticulture. Chelmsford, Essex, UK. 360 pp.
Jackson ML. 1958. Soil Chemical Analysis. New Jersey, USA: Prentice-Hall, Eaglewood Cliffs. 498 pp.
Keren R. 1996. Boron. In: Methods of soil analysis: Part 3, Chemical methods (Soil Science Society of America book series no. 5), ed. Sparks DL, 603-626. Madison, Wisconsin, USA: Soil Science Society of America and American Society of Agronomy.
Lindsay WL and Norvell WA. 1978. Development of a DTPA test for zinc, iron, manganese and copper. Soil Science Society of America Journal 42: 421-428.
Mills HA and Jones JB Jr. 1996. Plant analysis handbook II: A practical sampling, preparation, analysis and interpretation guide. Athens, Georgia, USA: Micro-Macro Publishing. 422 pp.
Nelson DW and Sommers LE. 1996. Total carbon, organic carbon and organic matter. In: Methods of soil analysis: Part 3, Chemical methods (Soil Science Society of America book series no. 5), ed. Sparks DL, 961-1010. Madison, Wisconsin, USA: Soil Science Society of America and American Society of Agronomy.
Olsen SR and Sommers LE. 1982. Phosphorus. In: Methods of soil analysis, part 2, 2nd ed. (Agronomy monograph 9), ed. Page AL, 403-430. Madison, Wisconsin, USA: Soil Science Society of America and American Society of Agronomy.
Petersen RG and Calvin LD. 1996. Sampling. In: Methods of soil analysis: Part 3, Chemical methods (Soil Science Society of America book series no. 5), ed. Sparks DL, 1-17. Madison, Wisconsin, USA: Soil Science Society of America and American Society of Agronomy.
Rego TJ, Wani SP, Sahrawat KL and Pardhasaradhi G. 2005. Macro-benefits from boron, zinc and sulfur application in Indian SAT: A step for Grey to Green Revolution in agriculture. Global Theme on Agroecosystems Report No. 16. Patancheru 502 324, Andhra Pradesh, India: International Crops Research Institute for the Semi-Arid Tropics (ICRISAT). 24 pp.
Rockstrom J, Karlberg L, Wani SP, Barron J, Hatibu N, Oweis T, Bruggeman A, Farahani J and Qiang Z. 2010. Managing water in rain-fed agriculture-the need for a paradigm shift. Agricultural Water Management 97: 543-550.
Saha AR and Haldar M. 1998. Effect of phosphorus, lime and boron application on the changes in available B and P content of aeric haplaquept. Journal of the Indian Society of Soil Science 46: 22-26.
Sahrawat KL, Ravi Kumar G and Murthy KVS. 2002a. Sulfuric acid-selenium digestion for multi-element analysis in a single digest. Communications in Soil Science and Plant Analysis 33: 3757-3765.
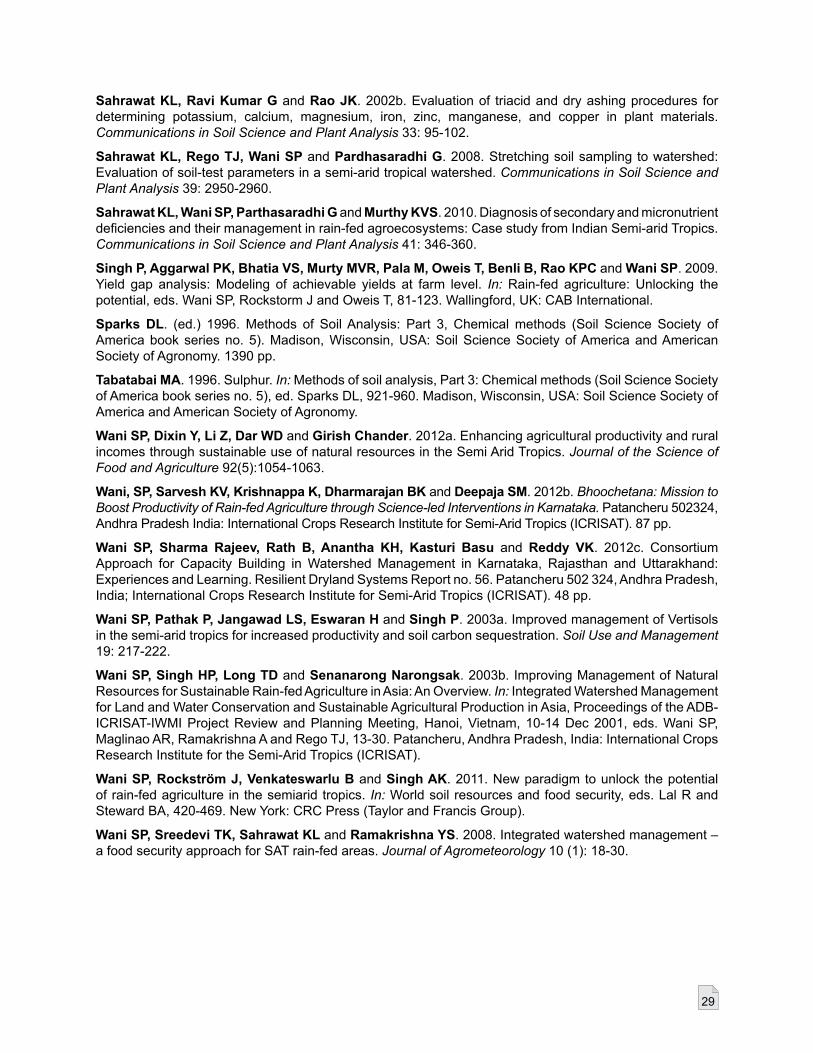
29
Sahrawat KL, Ravi Kumar G and Rao JK. 2002b. Evaluation of triacid and dry ashing procedures for determining potassium, calcium, magnesium, iron, zinc, manganese, and copper in plant materials. Communications in Soil Science and Plant Analysis 33: 95-102.
Sahrawat KL, Rego TJ, Wani SP and Pardhasaradhi G. 2008. Stretching soil sampling to watershed: Evaluation of soil-test parameters in a semi-arid tropical watershed. Communications in Soil Science and Plant Analysis 39: 2950-2960.
Sahrawat KL, Wani SP, Parthasaradhi G and Murthy KVS. 2010. Diagnosis of secondary and micronutrient deficiencies and their management in rain-fed agroecosystems: Case study from Indian Semi-arid Tropics. Communications in Soil Science and Plant Analysis 41: 346-360.
Singh P, Aggarwal PK, Bhatia VS, Murty MVR, Pala M, Oweis T, Benli B, Rao KPC and Wani SP. 2009. Yield gap analysis: Modeling of achievable yields at farm level. In: Rain-fed agriculture: Unlocking the potential, eds. Wani SP, Rockstorm J and Oweis T, 81-123. Wallingford, UK: CAB International.
Sparks DL. (ed.) 1996. Methods of Soil Analysis: Part 3, Chemical methods (Soil Science Society of America book series no. 5). Madison, Wisconsin, USA: Soil Science Society of America and American Society of Agronomy. 1390 pp.
Tabatabai MA. 1996. Sulphur. In: Methods of soil analysis, Part 3: Chemical methods (Soil Science Society of America book series no. 5), ed. Sparks DL, 921-960. Madison, Wisconsin, USA: Soil Science Society of America and American Society of Agronomy.
Wani SP, Dixin Y, Li Z, Dar WD and Girish Chander. 2012a. Enhancing agricultural productivity and rural incomes through sustainable use of natural resources in the Semi Arid Tropics. Journal of the Science of Food and Agriculture 92(5):1054-1063.
Wani, SP, Sarvesh KV, Krishnappa K, Dharmarajan BK and Deepaja SM. 2012b. Bhoochetana: Mission to Boost Productivity of Rain-fed Agriculture through Science-led Interventions in Karnataka. Patancheru 502324, Andhra Pradesh India: International Crops Research Institute for Semi-Arid Tropics (ICRISAT). 87 pp.
Wani SP, Sharma Rajeev, Rath B, Anantha KH, Kasturi Basu and Reddy VK. 2012c. Consortium Approach for Capacity Building in Watershed Management in Karnataka, Rajasthan and Uttarakhand: Experiences and Learning. Resilient Dryland Systems Report no. 56. Patancheru 502 324, Andhra Pradesh, India; International Crops Research Institute for Semi-Arid Tropics (ICRISAT). 48 pp.
Wani SP, Pathak P, Jangawad LS, Eswaran H and Singh P. 2003a. Improved management of Vertisols in the semi-arid tropics for increased productivity and soil carbon sequestration. Soil Use and Management 19: 217-222.
Wani SP, Singh HP, Long TD and Senanarong Narongsak. 2003b. Improving Management of Natural Resources for Sustainable Rain-fed Agriculture in Asia: An Overview. In: Integrated Watershed Management for Land and Water Conservation and Sustainable Agricultural Production in Asia, Proceedings of the ADB-ICRISAT-IWMI Project Review and Planning Meeting, Hanoi, Vietnam, 10-14 Dec 2001, eds. Wani SP, Maglinao AR, Ramakrishna A and Rego TJ, 13-30. Patancheru, Andhra Pradesh, India: International Crops Research Institute for the Semi-Arid Tropics (ICRISAT).
Wani SP, Rockström J, Venkateswarlu B and Singh AK. 2011. New paradigm to unlock the potential of rain-fed agriculture in the semiarid tropics. In: World soil resources and food security, eds. Lal R and Steward BA, 420-469. New York: CRC Press (Taylor and Francis Group).
Wani SP, Sreedevi TK, Sahrawat KL and Ramakrishna YS. 2008. Integrated watershed management – a food security approach for SAT rain-fed areas. Journal of Agrometeorology 10 (1): 18-30.


This publication is part of the research project “Sustainable rural livelihoods through enhanced farming system productivity and efficient support systems in rain-fed areas; Sub-project: Increasing crop productivity through soil-test based sustainable nutrient management in eight target rain-fed districts” supported by Indian Council of Agricultural Research (ICAR), New Delhi, India through Central Research Institute for Dryland Agriculture (CRIDA), Hyderabad.
Citation: Wani Suhas P, Girish Chander, Sahrawat KL, Sreenath Dixit, Venkateswarlu B. 2013. Improved crop productivity and rural livelihoods through balanced nutrition in the rainfed semi-arid tropics. Resilient Dryland Systems Report no. 58. Patancheru, Andhra Pradesh, India: International Crops Research Institute for the Semi-Arid Tropics (ICRISAT). 36 pp.
AbstractDiagnostic soil analysis in targeted clusters of eight districts in Andhra Pradesh revealed critical deficiencies of sulphur (61 to 98%), boron (23 to 98%) and zinc (45 to 85%) in addition to that of soil carbon (25 to 97%), and phosphorus (14 to 84%) which are apparently holding back the productivity potential. The soil test based application of sulphur, boron and zinc together increased productivity by 8 to 102% in cotton, groundnut, castor, sorghum, greengram, cowpea, chickpea and maize. Economic assessment reveal that per rupee invested as additional cost (` 1,400/- to ` 2,150/-) gave ` 1.6 to 28.5 in return. Residual benefits of balanced nutrition were observed during 4 succeeding seasons. Soil health improved in balanced nutrition plots, inspite of higher yields and nutrient removal. The results showed that balanced nutrition is the way forward to increase crop productivity through resilience building of production systems and improve farm based livelihoods in the SAT regions.
Contributing teamC. Rajesh, Research Associate, ICRISATP. Narsimha Rao, Research Fellow, ICRISATG. Pardhasaradhi, Manager, CRAL, ICRISAT
Consortium partnersKVK, Acharya NG Ranga Agricultural University, Hyderabad (ANGRAU), AdilabadWatershed Support Services and Activities Network (WASSAN), RangareddyModern Architects for Rural India (MARI), WarangalBAIF Institute of Rural Development (BIRD BAIF), Anantapur & MahabubnagarSri Aurobindo Institute for Rural Development (SAIRD), NalgondaCenter for World Solidarity (CWS), KhammamAakruthi Agricultural Associates (AAKRUTI), Kadapa
68-2013
ICRISAT is a memberof the CGIAR Consortium
Science with a human face
ww
w.ic
risat
.org
Abo
ut IC
RIS
AT
The International Crops Research Institute for the Semi-Arid Tropics (ICRISAT) is a non-profit, non-political organization that conducts agricultural research for development in Asia and sub-Saharan Africa with a wide array of partners throughout the world. Covering 6.5 million square kilometers of land in 55 countries, the semi-arid tropics have over 2 billion people, of whom 644 million are the poorest of the poor. ICRISAT innovations help the dryland poor move from poverty to prosperity by harnessing markets while managing risks – a strategy called Inclusive Market-Oriented Development (IMOD).
ICRISAT is headquartered in Patancheru near Hyderabad, Andhra Pradesh, India, with two regional hubs and five country offices in sub-Saharan Africa. It is a member of the CGIAR Consortium. CGIAR is a global research partnership for a food secure future.
ICRISAT-Patancheru(Headquarters)Patancheru 502 324Andhra Pradesh, IndiaTel +91 40 30713071Fax +91 40 [email protected]
ICRISAT-Liaison OfficeCG Centers BlockNASC ComplexDev Prakash Shastri MargNew Delhi 110 012, IndiaTel +91 11 32472306 to 08Fax +91 11 25841294
ICRISAT-Bamako(Regional hub WCA)BP 320Bamako, MaliTel +223 20 709200Fax +223 20 [email protected]
ICRISAT-Nairobi(Regional hub ESA)PO Box 39063, Nairobi, KenyaTel +254 20 7224550Fax +254 20 [email protected]
ICRISAT-BulawayoMatopos Research StationPO Box 776Bulawayo, ZimbabweTel +263 383 311 to 15Fax +263 383 [email protected]
ICRISAT- KanoPMB 3491Sabo Bakin Zuwo Road, Tarauni, Kano, NigeriaTel: +234 7034889836;
+234 8054320384 +234 8033556795
ICRISAT-LilongweChitedze Agricultural Research StationPO Box 1096Lilongwe, MalawiTel +265 1 707297, 071, 067, 057Fax +265 1 [email protected]
ICRISAT-Maputoc/o IIAM, Av. das FPLM No 2698Caixa Postal 1906Maputo, MozambiqueTel +258 21 461657Fax +258 21 [email protected]
ICRISAT-NiameyBP 12404, NiameyNiger (Via Paris)Tel +227 20722529,
20722725Fax +227 [email protected]
Research Report No. 58
ICRISAT Research ProgramResilient Dryland Systems
Improved crop productivity andrural livelihoods throughbalanced nutrition in the rain-fed semi-arid tropics (SAT)Suhas P Wani , Girish Chander, KL Sahrawat, Sreenath Dixitand B Venkateswarlu
Science with a human face


