84
Valuable lessons Improving economy and efficiency in schools Local government national report July 2009 PHOTO REDACTED DUE TO THIRD PARTY RIGHTS OR OTHER LEGAL ISSUES

Valuable lessonsImproving economy and efficiency in schools
Local government national report
July 2009PHOTO REDACTED DUE TO THIRD PARTY RIGHTS OR OTHER LEGAL ISSUES

2
The Audit Commission is an independent watchdog, driving economy, efficiency and effectiveness in local public services to deliver better outcomes for everyone.
Our work across local government, health, housing, community safety and fire and rescue services means that we have a unique perspective. We promote value for money for taxpayers, auditing the £200 billion spent by 11,000 local public bodies.
As a force for improvement, we work in partnership to assess local public services and make practical recommendations for promoting a better quality of life for local people.

1Valuable lessonsAudit Commission
Contents
Contents
Summary and Recommendations 3
Introduction 9
Chapter 1 Expenditure in schools 13
Chapter 2 Incentives for schools to improve economy and efficiency 19
Chapter 3 School management processes 31
Chapter 4 Improving economy and efficiency of procurement 39
Chapter 5 Improving economy and efficiency of workforce deployment 49
Chapter 6 Conclusion 63
Appendices 65
Appendix 1: Research method 66
Appendix 2: The funding system for schools 68
Appendix 3: Analysis of variation in schools’ procurement expenditure 70
Appendix 4: References 77

2 Contents

Summary andRecommendations
Summary 4
Recommendations 6

4 Summary
Summary
Education expenditure per pupil has increased by two-thirds in a decade � English primary and secondary schools spent over £31 billion
in 2007/08, an increase of 56 per cent in real terms since 1997/98.
� While school results have improved, not all targets have been met.
� Schools’ budgets are now growing more slowly and the future is likely to be more austere.
� The Department for Children, Schools and Families (DCSF) claimed over £3 billion of school efficiencies between 2005/06 and 2007/08, with a target of £3.7 billion in the next three years.
Schools have weak incentives to be economical and efficient � Value for money requires economy and efficiency as well
as effectiveness. � Schools’ accountability for spending is weak; they do not have
to report efficiency savings, or respond to DCSF’s targets. � Ofsted’s value for money assessment has focused more on
effectiveness than economy and efficiency. � The financial management standard in schools focuses
on processes rather than the real achievement of economy and efficiency.
� Councils focus on processes and helping schools in difficulty. � Governors can challenge schools to improve economy and
efficiency, but this challenge is not always strong enough.
Schools could save over £400 million through better procurement alone � Schools’ spending on goods and services increased by 40 per
cent over eight years to £6.8 billion in 2007/08. � The great variation between schools’ spending on standard
items shows scope for large savings. � Schools should subject suppliers of goods and services,
including councils’ traded services, to competition, and use professional buying organisations to reap economies of scale.
� Councils should support schools to purchase more effectively, for example in understanding local markets and aggregating buying power.

5Valuable lessonsAudit Commission
Summary
Workforce deployment is the most important decision in schools and must be undertaken with economy and efficiency in mind � Schools spent £24.2 billion on their workforce in 2007/08, up
from £14.3 billion in 1999/2000. � There are 32,000 more teachers, 100,000 more teaching
assistants and 70,000 more support staff than there were in 1997, while pupil numbers have fallen by 80,000.
� In a more austere future, schools will need to ensure that the number of staff is affordable and the mix offers good value for money.
� Schools have more flexibility than they may realise to deploy classroom staff efficiently.
� Schools have little comparative information on costs or how workforce deployment affects outcomes for children.
Many schools have excessive balances, of which over £500 million could be released nationally � School balances increased from £680 million in 1999/2000 to
more than £1.76 billion in 2007/08. � In 2007/08, balances in secondary schools increased by
22 per cent and in primary schools by 7 per cent in real terms. � Hoarding money intended for education is poor value
for money. � Nearly 40 per cent of schools have excessive balances
despite repeated encouragement to reduce them.
There are many ways schools can save money without adversely affecting children’s education � Use the national benchmarking tool to identify high costs. � Improve planning to include the costs of the workforce and link
financial and performance information. � Collaborate with other schools to share both teaching and
support staff; procure jointly; and share market intelligence. � Federation is rare, but can deliver significant savings.
Examples have achieved savings of 6 and 2 per cent of overall revenue expenditure.

6 Recommendations
Recommendations
DCSF should: � ensure that there is a more robust assessment of economy
and efficiency; � develop the Financial Management Standard in Schools
(FMSiS) to provide comparisons between schools, and to focus on improving economy and efficiency;
� consult on more effective measures to reduce and redistribute school balances;
� monitor and report at national level on the achievement of efficiencies in non-pay expenditure identified in this report;
� improve the research base, and the information available to schools and governors, so that decision making on classroom staff deployment can take better account of economy and efficiency without compromising effectiveness; and
� collect unit costs for high-cost items to improve the comparative information available to schools.
Councils should: � Improve the availability and quality of financial support by:
– offering resource management and value for money training to schools as part of the council’s financial package, targeting those with limited capacity; and
– aligning, and sharing knowledge between, finance and service improvement teams to improve schools’ experience of these services.
� Support better purchasing by: – raising schools’ awareness of high quality alternative
providers of traded services, including them in any portfolio of traded services;
– identifying schools spending more than others on items of procurement and support them to find savings;
– ensuring that schools use electronic procurement systems to minimise purchasing costs; and
– encouraging schools to collaborate on purchasing to benefit from economies of scale.

7Valuable lessonsAudit Commission
Recommendations
� Strengthen accountability for value for money by: – ensuring that internal audit provides assurance to governing
bodies and councils on questions of resource management and recommends value for money improvements as a matter of course; and
– ensuring that school improvement partners (SIPs) consider resource deployment as part of their role. Councils may need to provide further training to SIPs to support them.
� Ensure that accessible financial training is available for all governing bodies. Training should cover value for money and the links between finance and school performance.
� With their schools forums, consider funding these recommendations through, for example, traded services, refocusing existing resources on economy and efficiency, self-funding initiatives or persuading schools to use balances to invest in their own abilities to manage finances.
The Audit Commission will: � work with Ofsted to review and improve the criteria for
assessing value for money and the information inspectors need to make judgements on economy and efficiency;
� provide separate guidance for councils, governors and school staff with financial responsibilities;
� update our Managing School Resources tool that helps schools self-assess whether they are getting the best from their budgets; and
� provide a tool to help schools cost workforce expenditure and compare this with performance.

8 Recommendations

Introduction

10 Introduction
1 Over 7 million children attend nearly 25,000 maintained schoolsi in England (Ref. 1).ii In 2007/08, maintained primary and secondary schools in England spent more than £31 billion (Ref. 2). Schools have received substantial real terms funding increases in the last ten years. The Audit Commission’s focus is on the way this significant public resource is spent, as it is essential that it provides good value for money. This is even more important in the context of future public spending constraints.
2 Schools have made considerable progress in recent years, although they have not met all of the government’s targets. At key stage 4, results for 16 year-olds have improved, and the 2008 results surpassed the government’s target.iii Attainment in core subjects at key stages 2 (11 year-olds) and 3 (14 year-olds) have improved steadily, but the government’s targets have not been met.
3 In recent years, public sector organisations have been required to report on the extent to which the services they provide offer good value for money (Refs. 3, 4 and 5). Defining value for money in public services is particularly challenging because of the complexity of the services delivered and the competing perspectives on what constitutes value. Schools are no different.
4 The widely accepted definition of value for money in schools, supported by the DCSF in its own guidance, refers to three elements described as the ‘three Es’: economy; efficiency; and effectiveness. In simple terms, this means making the best use of available resources, including getting better outcomes for the same spend, or freeing up resources that are being used inefficiently for other purposes. Box 1 illustrates this.
i The scope of this report is restricted to local authority maintained primary and secondary schools.It therefore does not include academies, city technology colleges or independent schools.
ii National data referred to in this report relate to England unless otherwise stated.iii As measured by the percentage of pupils achieving the equivalent of five or more A* to C GCSE
grades. The 2008 figure of nearly 65 per cent compared to the target of 60 per cent. In 2008, 47 per cent of pupils achieved the equivalent of five or more A* to C GCSE grades including English and Maths.

11Valuable lessonsAudit Commission
Introduction
5 The focus of regulation and accountability in the schools sector is on promoting well-being and raising standards, or in other words effectiveness. Ofsted inspections, and the publication of comparative attainment and achievement data, ensure accountability for this aspect of value for money.i However, value for money comprises all three components, which is why the economy and efficiency elements of value for money are the subject of this study.
6 In 2007, the Office for National Statistics sought to assess the extent to which additional schools funding since 1996 provided good value for money. The findings suggested a decline in productivity between 1996 and 2006, although the authors accepted that this resulted from the methodology employed, commenting that ‘it is unlikely that a single measure of productivity change will ever capture all the costs and benefits of the education sector’ (Ref. 6).ii
i Attainment refers to the level obtained in assessments, for example GCSE grades, while achievement looks at attainment in relation to pupils’ ability and expected progress, for example value added scores.
ii The Office for National Statistics defined productivity as the volume of output from education (including an estimate of change in the quality of service) relative to the volume of inputs, adjusted for pay and price increases.
Box 1: The three components of value for money
Definition Example
Economy Minimising the costs of resources used for a good, service or activity
Are school supplies purchased at the best available price?
Efficiency The relationship between outputs and the resources used to produce them
Does the timetable make best use of teachers?
Effectiveness The extent to which objectives have been achieved
To what extent has the deployment of teaching assistants raised levels of attainment and pupil well-being?
Source: Audit Commission

12 Introduction
7 English schools possess considerable autonomy. The Organisation for Economic Cooperation and Development (OECD) reported that English secondary schools are the second most autonomous of 25 OECD countries with regard to decision making, with 85 per cent of decisions relating to schools taken by the schools themselves (Ref. 7). In a separate study on autonomy in budget allocations within the school, Britain was ranked third of 32 countries (Ref. 8).
8 Due to the nature of school funding and the way in which outcomes are defined and measured in schools, it is difficult to provide meaningful comparative school-based assessments of value for money. The Commission’s work therefore examined economy and efficiency at the level of individual schools, considering what actions they and other stakeholders are taking to improve economy and efficiency.
9 This report contains messages for national policymakers from Commission research undertaken during the autumn term of 2008. Appendix 1 describes the methodology. Separate reports present the messages for councils, school staff with financial responsibilities, and governing bodies. Our Managing School Resources online self-evaluation tool supports schools in improving value for money.i The case studies within the updated tool recognise the diversity and different size of schools, but the reports set out principles that we consider apply to all primary and secondary schools.
10 The Commission supports and challenges public bodies to improve value for money. Our other reports and resources to support schools include: � Keeping Your Balance and Getting the Best from Your Budget (2000); � Education Funding (2004); and � Special Educational Needs and Additional Educational Needs value for
money resource pack (2008).
i An updated version is available in autumn 2009.

National expenditure 14
Efficiency savings 17
Local funding allocations 17
Expenditure within schools 18
Expenditure inschools
Chapter 1

14 Expenditure in schools
National expenditure
11 In the first two years of the first term of the Blair government, the commitment to match the outgoing government’s spending plans meant that there were limited increases in education expenditure. From 1999 onwards, the government prioritised spending on education, resulting in substantial funding increases. Overall revenue expenditure in primary and secondary schools increased by 56 per cent in real terms between 1997/98 and 2007/08. Reduced school rolls mean this represents a 65 per cent real terms increase in per pupil funding (Figure 1).i
Figure 1: There has been substantial growth in per pupil funding over the last ten years
0
1,000
2,000
3,000
4,000
5,000
1998
/99
1999
/200
020
00/0
1
2005
/06
2001
/02
2007
/08
2006
/07
2004
/05
2003
/04
2002
/03
£
1997
/98
Rev
enue
fund
ing
per
sch
ool p
upil,
ad
just
ed t
o 20
06/0
7 p
rices
Source: DCSF Departmental Report, 2008
56% increase in overall revenue expenditure in primary and secondary schools in real terms between 1997/98 and 2007/08
i Full-time equivalent pupil numbers fell from 7.33 million in 1997 to 7.25 million in 2008 (these data include city technology colleges and academies).

15Valuable lessonsAudit Commission
Expenditure in schools
12 The three-year funding allocation covering the period 2008/09 to 2010/11 provides slower real terms funding growth than schools have become accustomed to (Figure 2). The House of Commons Children, Schools and Families Committee has remarked that:
‘Come the next Spending Review, the likelihood is that…the rate of growth in expenditure will be minimal. Those in charge of schools…need to be planning now for ways of coping with a much more austere future’ (Ref. 9).
13 Forecasts for public expenditure beyond 2010/11 suggest a tighter settlement. The government has announced that annual real terms growth in current expenditure across all public services will drop to 0.7 per cent between 2011/12 and 2013/14 (Ref. 10).
PHOTO REDACTED DUE TO THIRD PARTY RIGHTS OR OTHER LEGAL ISSUES

16 Expenditure in schools
Figure 2: Growth in schools funding has slowed since 2005/06
0
1
2
3
4
5
6
7
8
9
1019
98/9
919
99/2
000
2000
/01
2005
/06
2001
/02
2007
/08
2006
/07
2004
/05
2003
/04
2002
/03
%A
nnua
l rea
l ter
ms
per
cent
age
incr
ease
in s
choo
ls
exp
end
iture
/fun
din
g
2008
/09
2009
/10
2010
/11
Expenditure
Funding
Source: Audit Commission analysis of data from DCSF Departmental Report 2008; DCSF Dedicated Schools Grant allocation 2008/09 – 2010/11; and HM Treasury Budget Report 2009

17Valuable lessonsAudit Commission
Expenditure in schools
Efficiency savings
14 DCSF reported that its schools directorate contributed over £3 billion of efficiency savings against the 2004 spending review efficiency target (Ref. 11). However, the House of Commons Children, Schools and Families Committee has questioned progress against the 2004 target:
‘Other than reductions in numbers of staff employed, much of the rest of the [efficiency] programme as it relates to DCSF appears to be an accounting exercise rather than a reduction in the amount of resource expended’ (Ref. 9).
15 DCSF is expecting schools to contribute a further £3.7 billion of cash-releasing savings from 2008/09 to 2010/11, to help deliver the 2007 comprehensive spending review efficiency target.i As part of this, a 1 per cent efficiency saving, worth £307 million, has been incorporated into schools funding for the period from 2008/09 to 2010/11 (Ref. 10).
Local funding allocations
16 The allocation of funding to individual schools is described in Appendix 2. Under current arrangements, the amount of funding per pupil provided through the dedicated schools grant varies significantly from council to council, as does the proportion of this funding that is based on indicators of deprivation (Ref. 12). Each council then agrees, with schools, a fair funding formula to distribute funds. Schools therefore find themselves in very different financial positions.
17 Rather than commenting on funding mechanisms or the overall volume of funding for schools, this report explores how to improve the economy and efficiency of spending in schools.
i The overall departmental savings target has since increased by an additional £650 million in the 2009 Budget, although it is not yet clear how much of this will be from schools (Ref. 10).

18 Expenditure in schools
Expenditure within schools
18 Nationally, 78 per cent of schools’ expenditure is on workforce costs.i Teaching staff account for 55 per cent of expenditure, with the remaining workforce costs split between education support staff and other employees. Running costs account for 22 per cent of expenditure (Figure 3).
Figure 3: More than three-quarters of expenditure in primary and secondary schools is on the workforce
Source: DCSF section 52 data
78% of schools’ expenditure is on workforce costs
i School level expenditure is reported according to the consistent financial reporting (CFR) categorisation. These data show how schools spend their budgets and enable schools to compare expenditure with other similar schools through benchmarking (see Chapter 3).
Teaching staff
Running expenses
Other employee costs
Education support staff

Regulatory incentives to improve economy and efficiency are weak 20
Efficiency savings in the minimum funding guarantee have not encouraged schools to prioritise economy and efficiency 23
The increasing size of school balances represents poor value for money 24
Councils can help improve economy and efficiency 28
Governing bodies can help improve economy and efficiency 29
Incentives for schoolsto improve economy and efficiency
Chapter 2

20 Incentives for schools to improve economy and efficiency
19 A school’s budget, driven primarily by pupil numbers, determines the extent to which it considers and prioritises economy and efficiency. Schools can be encouraged to prioritise economy and efficiency through incentives built into regulatory or funding systems, by councils, or by their own governing bodies.
Regulatory incentives to improve economy and efficiency are weak
Ofsted20 Under the leadership and management component of Ofsted’s school inspections, Ofsted assesses ‘how effectively and efficiently resources, including staff, are deployed to achieve value for money’.i
21 This judgement correlates closely with schools’ overall effectiveness (Figure 4). Schools and councils perceived that the judgement takes account of effectiveness rather than economy or efficiency. Many believed that it is based mainly on value added measures of achievement, places little weight on the resources used and is a low priority for inspectors. Where schools had reduced tariff inspections due to previous high performance, inspections were more targeted and in some cases had not provided a value for money assessment.ii Some high-performing schools expressed surprise that Ofsted inspectors had not looked at their finance or strategic planning in more depth.
i Ofsted undertakes school inspections under section 5 of the Education Act 2005.ii Reduced tariff inspections are lighter-touch section 5 inspections where data and other
information indicate that schools are unlikely to be judged inadequate. They are being phased out under the revised inspection framework to be introduced in September 2009.

21Valuable lessonsAudit Commission
Incentives for schools to improve economy and efficiency
Figure 4: Ofsted’s overall effectiveness and value for money judgements correlate closely
0
25
50
75
100
%
Per
cent
age
of s
choo
ls w
here
Ofs
ted
’s o
vera
ll ef
fect
iven
ess
and
va
lue
for
mon
ey a
sses
smen
ts w
ere
the
sam
e, 2
005/
06 t
o 20
07/0
8
2005/06 2006/07 2007/08
Primary schoolsSecondary schools
Source: Audit Commission analysis of Ofsted data
FMSiS22 FMSiS (Box 2) has helped improve financial management. Our findings are broadly consistent with the published evaluation of FMSiS (Ref. 13). Schools and councils identified that FMSiS: � promotes the importance of good financial management among head
teachers and governors; � clarifies the roles and responsibilities of governors and the type of
information provided to them, enabling them to support and challenge heads more effectively; and
� assists schools to identify previously unknown financial skills and develop the skills of school staff and governors.

22 Incentives for schools to improve economy and efficiency
23 However, FMSiS focuses on processes rather than achievement of economy and efficiency. Schools have not drawn an explicit link between its introduction and value for money. One head summarised a frequently held view that:
‘it’s easy to have good documentation for bad decision making.’
24 There is also some uncertainty within schools about the relationship between Ofsted value for money judgements and FMSiS accreditation. A few schools thought that passing FMSiS would satisfy Ofsted’s assessment criteria. No such relationship exists, although confusion is understandable, as schools are asked to identify their FMSiS position under Ofsted’s guidance for self-evaluation.
25 DCSF has announced that, following an independent evaluation, the standard will remain in its current form until at least March 2010. However, DCSF also noted the need to place a greater emphasis on value for money. It ‘will shortly begin consulting with stakeholders on the introduction of an additional, non-mandatory, measure on which schools can demonstrate effective management of resources’ (Ref. 14).
Box 2: The Financial Management Standard in Schools in summary
FMSiS was introduced to improve financial management and reporting. The standard is a statement of what a school that is managed well financially would look like, and covers: � leadership and governance; � people management; � policy and strategy; � partnerships and resources; and � processes.
Adoption of the standard was initially a matter for each school, but compliance is now mandatory. Secondary schools should have met the standard by March 2007, and primary, middle and special schools will comply with the standard in a phased rollout between 2008 and 2010.

23Valuable lessonsAudit Commission
Incentives for schools to improve economy and efficiency
26 We support, in principle, this potential development of FMSiS and suggest, in this report, management information on workforce deployment (see Chapter 5) that would help in the pursuit of economy and efficiency. This information may also encourage comparison across schools.
Efficiency savings in the minimum funding guarantee have not encouraged schools to prioritise economy and efficiency
27 Efficiency savings are commonplace throughout the public sector, but were only incorporated into schools’ funding settlements in 2008/09. A recurring 1 per cent efficiency gain was included within the minimum funding guarantee for each of the years from 2008/09 to 2010/11. The Minister of State for Schools and Learners noted that this reflects ‘the substantial improvement in efficiency which we expect to be achieved across the schools sector and the public sector as a whole’ (Ref. 12).
28 However, schools see this measure as a means of controlling the overall level of funding rather than an incentive to change behaviour and improve economy and efficiency. Schools recognise the need to work within the budget they receive. However, this efficiency saving has not reduced schools’ budgets. Rather, it has meant that schools’ budgets have increased by less than they otherwise would have. Not all schools are aware of the 1 per cent efficiency gain. Understandably, there was more awareness in schools in lower-funded areas.
29 The Commission has been critical of the use of the minimum funding guarantee, which is designed to ensure stability of funding, as it does not target resources to need (Ref. 15). It also fails to ensure that all schools improve economy and efficiency. The extent to which it acts as an incentive depends on whether a school is in receipt of the minimum funding guarantee alone, or whether it receives additional funding increases.
1% efficiency gain was included within the minimum funding guarantee for the years 2008/09 and 2010/11

24 Incentives for schools to improve economy and efficiency
The increasing size of school balances represents poor value for money
30 Excessive school revenue balances represent an inefficient use of public money (Ref. 15). In 2007/08, primary and secondary schools held balances of £1.76 billion. From 1999/2000 to 2007/08, overall levels of balances have increased in real terms by 79 per cent in primary schools and by 197 per cent in secondary schools. From 2006/07 to 2007/08, aggregate school balances increased in real terms by 22 per cent in secondary schools and 7 per cent in primary schools (Figure 5). Both committed and uncommitted balances have continued to increase.i
Figure 5: Revenue balances continue to increase in both primary and secondary schools
0
200
400
600
800
1,000
1,200
£ million
Agg
rega
te le
vel o
f rev
enue
bal
ance
in s
choo
ls
2000
/01
2005
/06
2001
/02
2007
/08
2006
/07
2004
/05
2003
/04
2002
/03
1999
/200
0
Primary schoolsSecondary schools
Source: Audit Commission analysis of DCSF data
i In theory, committed balances may be evidence of good financial management. However, there is no consistently applied definition of a committed balance.

25Valuable lessonsAudit Commission
Incentives for schools to improve economy and efficiency
31 A primary school should hold no more than 8 per cent and a secondary school no more than 5 per cent of income in its balance (Ref. 16). Excessive balances have been more prevalent in primary schools, but the number with excessive balances has decreased since 2001/02. There is no sign of a decrease in secondary schools. Nearly 40 per cent of schools exceed the maximum levels suggested (Figure 6).
Figure 6: Nearly 40 per cent of schools hold excessive balances
0
10
20
30
40
50
60
%
Pro
por
tion
of s
choo
ls w
ith e
xces
sive
rev
enue
bal
ance
s
2000
/01
2005
/06
2001
/02
2007
/08
2006
/07
2004
/05
2003
/04
2002
/03
1999
/200
0
Primary schools
Secondary schools
Source: Audit Commission analysis of DCSF data
32 Although the majority of schools have balances, a significant minority are in deficit. The proportion of secondary schools in deficit has fallen from 24 per cent in 1999/2000 to 15 per cent in 2007/08. The proportion of primary schools has fallen from 8 per cent to 6 per cent in the same period.

26 Incentives for schools to improve economy and efficiency
33 If all primary schools with excessive balances reduced their balances to 8 per cent of total revenue income, £270 million could be released. Similarly, if all secondary schools with excessive balances reduced them to 5 per cent of total revenue income, it would free up £260 million. Our reports for governors and school staff with financial responsibilities encourage them to review their balances.
34 Balances are likely to continue to increase without stronger intervention. Surpluses grow as a response to uncertainty about future funding (Ref. 15). Such uncertainty is likely to feature more strongly as funding increases are likely to be smaller. The right response to such uncertainty is good financial management, rather than retaining resources. The government should consult on more effective measures to reduce and redistribute school balances.
35 In summary, the range of pressures from national regulatory and funding mechanisms to ensure that money is spent economically and efficiently, for the benefit of current pupils, do not create a coherent accountability framework for how schools use their resources. Ofsted’s value for money assessment has focused more on effectiveness than economy and efficiency. The FMSiS focuses on process rather than the real achievement of economy and efficiency. The 1 per cent efficiency gain in the minimum funding guarantee is unlikely to cause schools to change how they spend their money. And revenue balances have continued to increase, representing an inefficient use of money.
36 The Commission supports the delegation of financial and operational decision making to frontline providers of public services (Ref. 17). However, this needs to be balanced by appropriate accountability, to provide assurance that money is well spent. The national accountability framework to ensure value for money in schools is weaker than for other sectors (Table 1). In contrast with other providers of local public services, schools do not face a robust assessment of their use of resources and are not required to report efficiency savings.
£530m could be released nationally from schools’ excess balances

27Valuable lessonsAudit Commission
Tab
le 1
: Acc
ou
nta
bili
ty f
or
eco
no
my
and
effi
cien
cy is
mo
re li
mit
ed in
sch
oo
ls t
han
in o
ther
loca
l pu
blic
ser
vice
s
Sec
tor
Tota
l es
tim
ated
ex
pen
dit
ure
(200
8/09
)
Nu
mb
er o
f o
rgan
isat
ion
sQ
ual
ity
asse
ssm
ent
Use
of
reso
urc
es
asse
ssm
ent
Rep
ort
ing
of
savi
ng
s
Sav
ing
s ta
rget
(2
008/
09 t
o
2010
/11)
Au
dit
ar
ran
gem
ents
Sch
ools
£37.
7 b
n22
,708
Ofs
ted
Ofs
ted
val
ue
for
mon
ey
asse
ssm
ent
No
req
uire
men
t£3
.7 b
nC
ounc
il in
tern
al a
udit
Loca
l go
vern
men
t (e
xclu
din
g sc
hool
s)
£59.
8 b
n35
3C
omp
rehe
nsiv
e A
rea
Ass
essm
ent
(and
Car
e Q
ualit
y C
omm
issi
on fo
r so
cial
car
e)
Aud
it C
omm
issi
on U
se
of R
esou
rces
as
sess
men
t
Nat
iona
l In
dic
ator
179
£5.5
bn
Ext
erna
l aud
it
Fire
and
re
scue
£2.4
bn
46C
omp
rehe
nsiv
e A
rea
Ass
essm
ent
Aud
it C
omm
issi
on U
se
of R
esou
rces
as
sess
men
t
Ann
ual
Effi
cien
cy
Sta
tem
ents
£0.1
bn
Ext
erna
l aud
it
Pol
ice
£12.
2 b
n39
Her
Maj
esty
’s
Insp
ecto
rate
of
Con
stab
ular
y
Aud
it C
omm
issi
on U
se
of R
esou
rces
as
sess
men
t
With
in P
olic
e U
se o
f R
esou
rces
ev
alua
tion
Loca
lly
agre
edE
xter
nal a
udit
Nat
iona
l H
ealth
S
ervi
ce
£96.
4 b
n44
6C
are
Qua
lity
Com
mis
sion
Aud
it C
omm
issi
on U
se
of R
esou
rces
as
sess
men
t or
M
onito
r
No
req
uire
men
t (b
ut e
ffici
enci
es
refle
cted
in
tarif
f)
£10.
5 b
nE
xter
nal a
udit
Sou
rces
: Aud
it C
omm
issi
on a
naly
sis
of p
ublic
ly a
vaila
ble
dat
a

28 Incentives for schools to improve economy and efficiency
Councils can help improve economy and efficiency
37 Since 1988, schools have gained greater autonomy from councils (Ref. 18). While councils’ accountability for money spent by schools is similar to other areas of council expenditure, they have less influence on financial decisions. Council roles still include: � responsibility for financial control, which remains with the section 151
officer at the council, despite budget delegation to schools; � provision of internal audit; � responsibility to monitor, challenge, support and intervene in school
improvement; and � power to intervene in schools causing concern.
38 More generally, DCSF has encouraged councils to focus on: monitoring and improving school performance; providing the infrastructure to support schools; and challenging underperformance (Ref. 19). Other sections of this report comment on councils’ roles in benchmarking, encouraging collaboration in schools and supporting school procurement.
39 Internal audit is principally concerned with internal control and financial probity. However, it can also provide wider assurance to governing bodies and councils on resource management. The frequency of visits, the use of risk assessment to determine programmes of work, and the extent to which visits cover and provide assurance on wider questions of resource management vary between councils. Our separate report for councils describes how one internal audit function has developed a database of 100 efficiency savings that schools can achieve.i
40 Schools’ perceptions of council support for resource and financial management have improved (Ref. 20). However, the financial support that councils provide is based on process and monitoring rather than strategic support on resource deployment. Councils and schools both reported that support tends to be focused on schools in financial difficulties, rather than ensuring optimal value for money in all schools. One head commented that:
‘there tends to only be training or guidance for head teachers when something goes wrong.’
i Available at www.audit-commission.gov.uk/valuablelessons
The financial support that councils provide is based on process and monitoring rather than strategic support on resource deployment

29Valuable lessonsAudit Commission
Incentives for schools to improve economy and efficiency
41 Councils can also support incentives to improve value for money through their appointment of SIPs.i DCSF’s guidance on the role of SIPs refers to value for money, but there was limited awareness of this in the schools we visited, and there was no evidence that SIPs were using benchmarking data or challenging schools about their resource management.
42 Finally, even though substantial funds are at stake, councils’ ability to support improvement in economy and efficiency in schools is constrained. The central expenditure limit constrains councils from increasing spending on central services by more than the individual schools budget. Councils that want to provide additional support to schools on value for money may find it difficult to resource, except as traded services. Our report for councils suggests some of the ways councils might resource additional functions.
Governing bodies can help improve economy and efficiency
43 Governors can provide incentives to prioritise and improve economy and efficiency. Good practice that we identified included a school with a value for money committee that considers every major purchase. Another school has ensured that a small but expert steering committee supports the school to improve value for money. More generally, schools noted that FMSiS had improved governors’ ability to challenge on value for money. One primary head commented that:
‘until recently, some governors thought that to challenge the head was to undermine authority, but they now realise this is part of the role.’
i SIPs link to individual schools, monitoring and challenging standards and support the school in improving pupil outcomes. SIPs are accredited and are often serving head teachers.

30 Incentives for schools to improve economy and efficiency
44 In other schools, there was little evidence of governors challenging school leaders to improve value for money. In one school, the governing body had yet to reject any proposal and was seen simply as a rubber stamp. Elsewhere, governors were described by heads as too polite or having too close a relationship. Occasionally, difficult circumstances, for example receiving an Ofsted notice to improve, caused a school to reflect that the relationship was not challenging enough. In its survey of workforce remodelling, a key component of ensuring value for money, Ofsted has also reported that many schools receive insufficient support from governing bodies (Ref. 21). This reflects our findings in other parts of the public sector, where those with governance roles are not always challenging enough (Ref. 22). Our findings also revealed variation in the level of governor financial skills.
45 We have developed a briefing for governors, based on supporting and challenging schools to improve economy and efficiency.i
i Available at www.audit-commission.gov.uk/valuablelessons
Governors can challenge schools to improve economy and efficiency, but this challenge is not always strong enough.
PHOTO REDACTED DUE TO THIRD PARTY RIGHTS OR OTHER LEGAL ISSUES

Strategic planning is not sufficiently aligned with financial implications 32
More schools should use the national financial benchmarking tool 34
Schools need to make better use of financial information 35
Schools can make significant savings through greater collaboration 36
Chapter 3
School managementprocesses

32 School management processes
46 Schools we visited described value for money as obtaining the best outcomes for pupils with the resources available. However, few know which management processes to employ to ensure, and demonstrate, that their school provides value for money. Schools are experienced users of data and information to raise standards, but are less clear about how they can use data to help them operate economically and efficiently. The following management processes should support schools in putting resources to best effect and help them respond to tighter financial circumstances: � aligning strategic plans with their financial implications; � exploiting the potential of benchmarking; � using financial information well; and � collaborating with other schools.
47 Our report for school staff with financial responsibilities and the Managing School Resources toolkit help schools review and improve these processes.i
Strategic planning is not sufficiently aligned with financial implications
48 The use of school development plans, although not statutory, has become commonplace. The plans present schools’ overall aims and objectives and the development and improvement activities that will enable them to meet these objectives. When undertaken effectively, strategic planning supports decisions about how to deploy available resources. Plans should include resource implications (Ref. 23), and can only contribute to improvements in economy and efficiency if they take account of expenditure.
49 In the plans we reviewed, schools had not taken sufficient account of the financial implications of their strategic goals (Box 3). In most cases, workforce resource costs were either not included or presented in limited detail.
Strategic plans can only contribute to improvements in economy and efficiency if they take account of expenditure
i Other guidance and tools include DCSF’s national benchmarking website, its strategic planning guide (Ref. 23) and the funded consultancy programme for schools.

33Valuable lessonsAudit Commission
School management processes
50 Councils should challenge schools to provide well-costed development plans, and to improve their ability to do so, by offering resource management training to schools as part of the council’s financial package.
51 From 2008/09 to 2010/11, schools have had indicative three-year funding allocations for the first time. Schools agreed that this enabled a more strategic approach to the management of their financial resources. Three-year allocations set the context for more productive strategic planning, forecasting and budgeting. However, schools also identified barriers that prevented them from responding effectively to three-year allocations (Box 4).
Box 3: Weaknesses in addressing the financial implications of school development plans include that: � not all plans we reviewed were costed; � costs in plans reflected a small proportion of the overall budget; and � the financial implications of initiatives in the plan were focused on goods and services rather
than the more significant workforce costs.
Box 4: Barriers to responding effectively to three-year funding allocations include: � insufficient guidance on multi-year planning; � concerns that schools are forecasting sizeable deficits in their three-year plans, and that these
forecasts are likely to encourage the retention of school balances; � the fact that three-year allocations are not rolling and therefore strategic planning cannot be
undertaken accurately after the first of the three years; and � difficulties in predicting in-year grants and allocations. These may also contribute to school
balances if they arrive late in the year.

34 School management processes
More schools should use the national financial benchmarking tool
52 Benchmarking helps organisations improve by comparing their expenditure, processes or performance with others. The national schools financial benchmarking site can help schools improve economy and efficiency.i They can compare their expenditure with similar schools to identify the potential for savings.
53 Too few schools use this tool. Only about half used the site in the year to July 2008 (Ref. 24). There is also variation in the extent of usage at council level (Figure 7). However, regular usage is increasing, probably due to the encouragement of benchmarking within FMSiS.
Figure 7: Usage of the national benchmarking website varies at council level
0
5
10
15
20
25
30
35
40
Num
ber
of c
ounc
ils
0-10
11-2
021
-30
31-4
041
-50
51-6
0
61-7
071
-80
81-9
091
-100
Percentage of schools using DCSF benchmarking in the year from August 2007 to July 2008
Source: Audit Commission analysis of DCSF data
i Available at https://sfb.teachernet.gov.uk/login.aspx

35Valuable lessonsAudit Commission
School management processes
54 Schools find the site easy to use and helpful in comparing spending with similar schools. Benchmarking enables them to consider their spending levels and initiate discussion with their governing bodies or other schools about potential savings and how to achieve them.
55 However, schools had some concerns about the national site, which highlight either that insufficient use is made of the site, or that the potential of benchmarking is misunderstood: � Schools found it difficult to identify comparators, or felt that the
comparators were not valid because of different funding levels. Some of these concerns are outdated following updates to the tool, but they reflect a need for DCSF to communicate more effectively.
� Many schools felt that benchmarking could not account for their unique circumstances. This reflects a misunderstanding. Benchmarking’s usefulness comes from comparison with others to understand why differences exist.
� One school said its local council had encouraged it to use the site to increase uptake, without guidance on how to get the most from it. A council commented that benchmarking is generally only used when an Ofsted inspection or FMSiS assessment is imminent.
56 In addition to the national benchmarking site, many councils provide schools with their own financial benchmarking information. However, just repackaging information provided on the national benchmarking site is not value for money. One council we visited had stopped providing this service and asked schools to use the national site.
Schools need to make better use of financial information
57 Schools make good use of performance data and information to raise standards (Ref. 25). Fewer make good use of the financial data available to them.
58 Information should be relevant, of good quality and well presented to improve governors’ understanding and support effective decision making (Ref. 26). Schools now have access to a great deal of financial data. Consistent financial reporting (CFR), introduced in 2003, provides a standard set of data for use in setting budgets and monitoring income and expenditure. However, these financial data have weaknesses: � Unit costs of goods and services are not available. Schools record
total expenditure in an area of procurement, but not the quantity of purchases. It would not be sensible to add this information for all items

36 School management processes
of spending, but DCSF should collect unit costs for high-cost items, such as energy, to improve the comparative information available to schools.
� It provides less detail on workforce expenditure. Although the workforce accounts for 78 per cent of overall expenditure, there are 8 codes for workforce costs compared with 24 for spending on goods and services. The teaching staff code accounts for 54 per cent of expenditure, but this information is difficult to interpret as it is not broken down by subject, department, year group or level of responsibility (Ref 2). We will be providing, from autumn 2009, a tool to help schools to cost workforce expenditure, building on our finance template for special and additional educational needs.i
59 Better use can be made of performance and finance data. Schools compare performance in different subjects with similar schools, but they cannot compare the financial inputs with other schools at a relevant level of detail, such as expenditure in different subjects in secondary schools. If they cannot compare financial inputs against outcomes they cannot assess value for money. Our tool will help schools compare workforce expenditure and outcomes in order to help them make this assessment.
Schools can make significant savings through greater collaboration
60 Value for money can be enhanced by collaborating with other schools. Collaboration can take different forms, ranging from informal networks to formal federationsii (Figure 8), and can bring a number of benefits, including: � sharing information and awareness about markets for goods and
services; � economies of scale in purchasing; � sharing leadership and other staff resources; and � mutual specialisation.
i Available at www.sen-aen.audit-commission.gov.ukii The term federation describes different types of collaborative and partnership arrangements
between schools.

37Valuable lessonsAudit Commission
School management processes
Informal networks61 Informal networks, allowing head teachers, bursars or administrative staff to share knowledge and information, are commonplace. Many of these groups discuss the availability, price and quality of local suppliers, which can raise awareness of economical purchasing options.
Geographical clusters62 Geographical clusters can deliver savings. Two councils we visited are encouraging geographical clusters of neighbouring schools and expect this to support joint commissioning. Schools and partner public bodies can improve their understanding of the needs in an area, and their ability to fulfil those needs jointly. One of the councils had supported these groups with a live, online dataset profiling the local community. However, it is too early to assess the outcomes of this approach.i Another council is supporting 27 locally-based groups of approximately 15 schools to undertake joint work on finance, workforce remodelling and human resources. There is a particular focus on increasing capacity in primary schools.
i This example is included as a case study in our separate report for councils.
Figure 8: Collaboration in schools takes different forms
Informal networks
Geographicalclusters
Sharingpersonnel
Soft/hardfederation
Source: Audit Commission

38 School management processes
Federation63 While there may be increased costs through federation – for example, increased travel and integration of computer systems – there can also be significant cost savings, for example by: � making a broader curriculum more cost-effective; � making joint appointments; � achieving economies of scale, for example by aggregating
purchasing; and � saving on planning and administrative time.
64 The update to our Managing School Resources tool provides examples from both primary and secondary federations. The secondary school example demonstrates how, by employing an executive principal and administrative staff across two schools and having single department heads, the management and administrative costs for one school have reduced from £633,000 to £447,000, a reduction of nearly 30 per cent. This is approximately 6 per cent of the school’s £3 million total annual revenue expenditure.
65 In another example, a secondary school has federated with two local middle schools and two local first schools. Net annual savings include £120,000 from rationalising the leadership structure and £100,000 through joint procurement. This represents approximately 2 per cent of overall revenue expenditure for the federation as a whole.
66 Shared governance and joint leadership can also provide structures that enable one school to support another in raising standards. Federations also create foundations for broader partnerships, including between primary and secondary schools, or with other providers.
67 In summary, schools can and should adopt management practices that will help them achieve economy and efficiency. But schools need support to improve. Councils should challenge schools to provide well-costed development plans. DCSF needs to continue to promote benchmarking and help schools improve the way they use financial and performance data, so that costs and outcomes of interventions can be assessed. Finally, schools and governing bodies should consider whether they cooperate effectively with other schools to share knowledge and capture economies of scale.
While there may be increased costs through federation there can also be significant cost savings

Chapter 4
Improving economyand efficiency ofprocurement

40 Improving economy and efficiency of procurement
68 Primary and secondary schools have increased expenditure on goods and services from £4.0 billion in 1999/2000 to £6.8 billion in 2007/08, a real terms increase of 40 per cent. The extent of spending increases on different items since 2003/04 varies.i There have been significant increases in utilities costs and bought-in professional services (Figures 9 and 10).
Figure 9: Increases in expenditure on goods and services in primary schools
0 100 200 300 400 500 600 700 800 9000
10
20
30
40
50
60
Per
cent
age
real
ter
ms
incr
ease
in e
xpen
ditu
re 2
003/
04
to 2
007/
08
%
Expenditure 2007/08 (£ million)
Utilities
Learning resources(ICT)
Catering
Bought-in professional services
Maintenance
All other goods and services
Learning resources(not ICT)
Source: Audit Commission analysis of DCSF section 52 data
i Consistent itemised data are only available from 2003/04.
40% increase in expenditure on goods and services by primary and secondary schools

41Valuable lessonsAudit Commission
Improving economy and efficiency of procurement
Figure 10: Increases in expenditure on goods and services in secondary schools
0 200 400 600 800 1,000 1,200 1,4000
10
20
30
40
50
60
70
80
Per
cent
age
real
ter
ms
incr
ease
in e
xpen
ditu
re
2003
/04
to 2
007/
08
%
Expenditure 2007/08 (£ million)
Utilities
Learning resources(ICT)
Catering
Bought-in professional services
MaintenanceAll other goods and services
Learning resources(not ICT)
Source: Audit Commission analysis of DCSF section 52 data
69 We found considerable variation in schools’ expenditure on different items, even when comparing schools of similar sizes and geographic and socio-economic contexts.i This variation implies that some schools may be spending substantially more than necessary. By identifying patterns of variation for different items (Appendix 3) we can estimate the potential for savings.
70 Even if only the highest spending quartile of schools, compared with their statistical nearest neighbours, reduced their expenditure on certain items to the upper quartile level, substantial savings are possible (Table 2). For the items that we reviewed, more than 80 per cent of primary and secondary schools are in the upper quartile of per pupil expenditure, relative to their statistical neighbours, for at least one item.
i See Appendix 3 for more details on the methodology.

42 Improving economy and efficiency of procurement
71 There are reasonable explanations for some of the variations in expenditure. In some cases, for example energy, there are factors that cannot be controlled for in such analysis, such as the age and condition of buildings. To compensate for this we have made relatively modest assumptions that only schools in the highest quartile of per pupil expenditure should be able to reduce their costs and only to the upper quartile level.
Table 2: Substantial savings are possible even if only the highest spending schools reduce their expenditurei
Area of expenditure Potential savings: primary schools
Potential savings: secondary schools
Potential total savings
Learning resources (non-ICT)
£45m £65m £110m
Cateringii £55m £40m £95m
Cleaning and caretaking
£35m £45m £80m
Administrative supplies
£25m £40m £65m
Energy £20m £20m £40m
Insurance premiums £15m £10m £25m
Total £195m £220m £415m
Source: Audit Commission
i The savings in this table are rounded to the nearest £5 million. ii Catering savings will accrue to different recipients depending on local subsidy arrangements.

43Valuable lessonsAudit Commission
Improving economy and efficiency of procurement
72 We also found that the savings per pupil were greater in small schools (Figure 11). However, at school level, the total of potential savings may be greater in larger schools, as these have more pupils.i
Figure 11: Potential savings in per pupil expenditure are greater in small schools
0
50
100
150
200
250
£
Pot
entia
l ave
rage
sav
ings
per
pup
il, b
y si
ze o
f sch
oolii
Small Medium Large
Primary schoolsSecondary schools
Size of school
Source: Audit Commission
i Small schools are defined in this analysis as those with fewer than 200 pupils in primary schools and fewer than 500 pupils in secondary schools. Medium schools are those with between 200 and 400 pupils in primary schools, and between 500 and 1,000 pupils in secondary schools. Large schools are those with more than 400 pupils in primary schools and those with more than 1,000 pupils in secondary schools.
ii If savings identified in Table 2 are delivered. Average is across all schools, not just those in upper quartiles.

44 Improving economy and efficiency of procurement
73 Achieving savings from procurement requires a thorough understanding of four elements: � how well the good or service meets the needs of the school; � the market for the particular good or service; � the purchasing process; and � how to use goods and services efficiently.
74 Our products for schools and councils explain how schools can achieve these savings, and how councils can support them. We provide case studies in our update to the Managing School Resources tool and our report for councils. This section explains the relevant national messages.
Evaluating how well goods and services meet the needs of schools
75 Schools should undertake appropriate and proportionate monitoring and evaluation for all goods and services purchased. There is evidence that this type of evaluation is lacking in many schools. A recent Ofsted report on ICT procurement found that only about half of the schools visited showed evidence of systematic evaluation of the impact of ICT goods and services in improving learning and raising standards (Ref. 27).
Different markets for goods and services require different approaches
Councils’ traded services76 Councils offer many services to schools as traded services. These include finance support, catering, caretaking and school transport. Schools in our research fell broadly into two groups: those that purchase all, or almost all, of the available council services, and those that behave more autonomously (Box 5).
Schools should undertake appropriate and proportionate monitoring and evaluation for all goods and services purchased.

45Valuable lessonsAudit Commission
Improving economy and efficiency of procurement
77 In many, but not all, cases, procuring traded services from a council will represent good value for money for schools. One primary school saved £133,000 over three years by moving from a councils’ traded caretaking service to in-house provision. This represents just over 2 per cent of the school’s revenue budget. Schools should understand the different options available to them, and where in-house provision does not offer good value for money, they should consider the full range of potential providers (Ref. 28).
78 Schools will get poor value for money if either they fail to take advantage of the economies of scale that councils can secure, or they default to councils’ traded services due to familiarity, when cheaper or better alternatives are available. Good councils provide information to schools on a range of alternative providers to assist them in becoming better-informed purchasers.
High-volume items79 Schools purchase many goods in competitive markets, particularly high-volume goods such as administrative supplies and learning resources. In these markets, there tend to be several suppliers and it is easier to compare prices and products. Public sector buying organisations are used extensively for these items.
Box 5: Schools take different approaches to councils’ traded services
Schools that predominantly buy councils’ traded services:
Schools that behave more autonomously:
� perceive that the council provides the best available service;
� emphasise trust, loyalty and strong relationships;
� prefer to outsource operational management functions; or
� in some circumstances have few realistic alternatives.
� have the capacity, confidence or skills to undertake their own market testing;
� are dissatisfied with the quality or cost of existing council services; or
� have joint purchasing arrangements with other schools that provide better value.

46 Improving economy and efficiency of procurement
80 ICT systems have been established to support economical procurement in these markets. These include council e-procurement systems and DCSF’s new national system for schools, Online Procurement for Educational Needs (OPEN).i Schools we visited appreciated many features of e-procurement systems, in particular their ease of use and the ability to access them at any time. We have not analysed whether OPEN is cost-effective, but the impact for schools should be positive in widening access to suppliers.
Unique markets81 Some markets exhibit unique characteristics and should be considered separately from those considered above. A good example is the market for energy. Better aggregation of demand and greater energy efficiency can help deliver the £40 million of savings identified in Table 2.
82 The Office of Government Commerce has stated that, in the last three years, public sector buying organisations have delivered 5 per cent cost reductions for their customers, compared with the wholesale market. Furthermore, aggregating volumes can reduce costs in other areas, leading to an additional 5 per cent in savings (Ref. 29).
83 In one secondary school, energy costs increased by 55 per cent in one year, despite being purchased through the council’s corporate contract. The corporate supplier is tied to the council for another seven years. The school is reviewing whether it can find better value elsewhere, but thinks it unlikely, considering its relative buying power compared with the council. A primary school experienced a 100 per cent increase in energy costs and the head stated that he did ‘not have the time and skills to play the energy market’.
84 We agree that schools should not play the energy market, but those purchasing energy should be aware of the different options available to schools, and the relative risks in terms of obtaining the best available prices and providing long-term stability. Options include purchasing directly, using private sector consultants, buying into council contracts or professional buying organisations. The Office for Government Commerce recommends purchasing through professional buying organisations, which are able to buy in bulk through multiple trades over long time periods, and has provided guidance for schools (Ref. 29).
i OPEN enables schools to access local contracts and to compare these with wider regional and national contracts that may offer better value for money.

47Valuable lessonsAudit Commission
Improving economy and efficiency of procurement
85 Another unique market is that for school meals. The National Audit Office has reported that there is little aggregation of purchasing and that some schools and local authorities are ‘paying uncompetitive prices for ingredients and catering services’. Furthermore, about 70 per cent of contracted catering services are provided by three companies (Ref. 30). The School Food Trust has also stated that greater efficiency can be achieved alongside the promotion of sustainability (Ref. 31).
Using goods and services efficiently
86 In addition to cost-effective buying, schools can of course make savings by using less of certain goods and services. Schools can save money by reducing energy consumption.i The Department of Energy and Climate Change is planning to spread examples of good practice between councils and schools (Ref. 32). Our Managing School Resources tool includes an example of a secondary school that, working with the Carbon Trust, improved its energy efficiency rating and saved nearly £25,000 on its energy bills over three years. Another school saved £2,500 a year by introducing a controlled stock cupboard for books and other study materials.
i Schools are now required to save energy under the carbon reduction commitment and councils will be required to include schools in their emissions for the carbon reduction commitment. To obtain eco-school status, schools are also required to carry out an energy audit as part of their environmental review and then set targets for reducing energy use through an action plan.
PHOTO REDACTED DUE TO THIRD PARTY RIGHTS OR OTHER LEGAL ISSUES

48 Improving economy and efficiency of procurement
87 In summary, the variation in spending by similar schools for different goods and services implies savings of over £400 million are possible. Schools should ensure that goods and services meet their needs, that they understand different markets adequately, that the purchasing process is undertaken effectively, and that they use goods and services efficently. Value for money may also be at risk when schools continue to buy councils’ traded services without adequate market testing.
£400m savings are possible from improved procurement of goods and services

The numbers and costs of classroom staff have increased significantly 50
The national workload agreement and the national curriculum set the context in which schools make workforce deployment decisions 52
Schools retain some flexibility in deployment of classroom staff 53
Schools need to use information to ensure economic and efficient deployment 58
Schools should ensure that their approaches to absence cover are economic and efficient 58
Schools should ensure that non-education staff are deployed efficiently 59
Improving economyand efficiency ofworkforce deployment
Chapter 5Chapter 5

50 Improving economy and efficiency of workforce deployment
The numbers and costs of classroom staff have increased significantly
88 Primary and secondary schools spent more than £24 billion on their workforce in 2007/08, representing 78 per cent of all revenue expenditure (Ref. 2). The deployment of classroom staff is the most important financial decision in a school. Providing good quality teaching is the most important factor, but schools should also ensure that their staffing allocation reflects the balance of their priorities. Teachers and teaching assistants should be deployed where they will bring the greatest benefit.
89 The government has sought to increase the number of qualified teachers and support staff, including teaching assistants. Teacher numbers have increased by 3 per cent in nursery and primary schools since 1997 and by nearly 14 per cent in secondary schools. There have been much larger increases in the number of teaching assistants, from just over 40,000 in 1997 to 115,000 in 2008 in nursery and primary schools, and from fewer than 8,000 to nearly 38,000 in secondary schools in the same period. Over the same period, pupil numbers fell by almost 315,000, a 7 per cent decrease, in primary schools and rose by over 230,000, a 8 per cent increase, in secondary schools.i
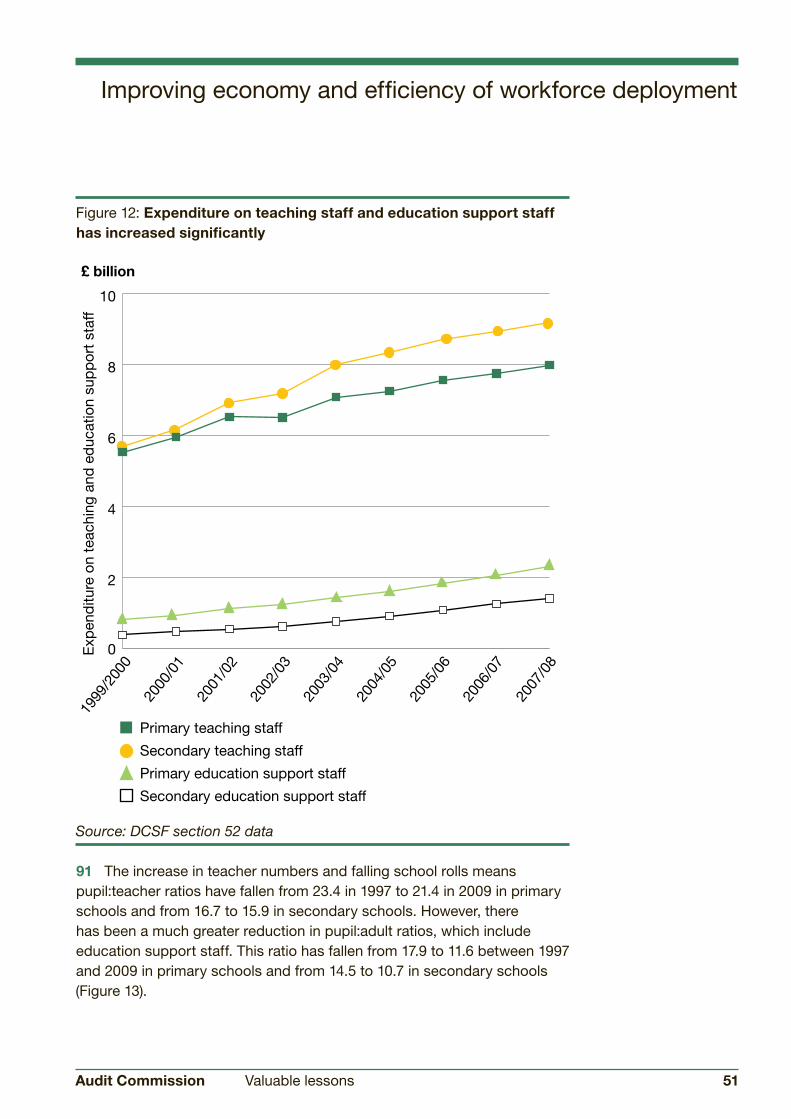
90 Expenditure data reflect these increases. Between 1999/2000 and 2007/08, expenditure on teaching staff increased from £11.2 billion to nearly £17.2 billion, a real terms increase of 25 per cent. During the same period, expenditure on education support staff increased by more than 150 per cent in real terms, from £1.2 billion to £3.7 billion (Figure 12).
£24bn was spent by primary and secondary schools on their workforce in 2007/08
i Numbers in this paragraph refer to full-time equivalents, and compare 1997 and 2008. Pupil numbers data include pupils at city technology colleges and academies.
51Valuable lessonsAudit Commission
Improving economy and efficiency of workforce deployment
Figure 12: Expenditure on teaching staff and education support staff has increased significantly
0
2
4
6
8
10
Exp
end
iture
on
teac
hing
and
ed
ucat
ion
sup
por
t st
aff
£ billion
Primary teaching staff
Secondary teaching staff
2000
/01
2005
/06
2001
/02
2007
/08
2006
/07
2004
/05
2003
/04
2002
/03
1999
/200
0
Primary education support staff
Secondary education support staff
Source: DCSF section 52 data
91 The increase in teacher numbers and falling school rolls means pupil:teacher ratios have fallen from 23.4 in 1997 to 21.4 in 2009 in primary schools and from 16.7 to 15.9 in secondary schools. However, there has been a much greater reduction in pupil:adult ratios, which include education support staff. This ratio has fallen from 17.9 to 11.6 between 1997 and 2009 in primary schools and from 14.5 to 10.7 in secondary schools (Figure 13).

52 Improving economy and efficiency of workforce deployment
Figure 13: There have been reductions in pupil:teacher ratios and more substantial reductions in pupil:adult ratios
Source: DCSF census data (2009 data are provisional)
The national workload agreement and the national curriculum set the context in which schools make workforce deployment decisions
92 The largest influences on the ability of schools to respond flexibly have been the national agreement on raising standards and tackling workload (Box 6) and the requirements of the national curriculum.
0
5
10
15
20
25
Pup
il:ad
ult
and
pup
il:te
ache
r ra
tios,
prim
ary
and
sec
ond
ary
scho
ols
Primary - pupil:teacher ratio
Primary - pupil:adult ratio
1998
2003
1999
2005
2004
2002
2001
2000
1997
2006
2007
2008
2009
Secondary - pupil:adult ratio
Secondary - pupil:teacher ratio

53Valuable lessonsAudit Commission
Improving economy and efficiency of workforce deployment
93 The statutory requirements for curriculum content also specify what subjects must be taught in key stages 1 to 4.
94 Schools’ ability to deploy their classroom staff in different ways is constrained by their size. Small primary schools will have less flexibility, and fewer opportunities through staff turnover, to reallocate resources than large secondary schools.
Schools retain some flexibility in deployment of classroom staff
95 It is difficult to identify the most economic and efficient use of resources, due to the different circumstances that schools face and the range of variables involved in the decision (Figure 14). Even among high-performing schools, there is no consistent approach to the allocation of classroom staff (Ref. 33).
Box 6: The national agreement on raising standards and tackling workloadThe national agreement was signed by the government, employers and school workforce unions in 2003. It introduced significant changes to teachers’ conditions of service in order to address unacceptable workloads. The agreement also addressed the important roles played by school support staff, including teaching assistants and school business managers. The main conditions of the national agreement were the: � routine delegation of administrative and clerical tasks; � introduction of work/life balance clauses; � introduction of leadership and management time for those with corresponding responsibilities; � introduction of new limits on covering for absent colleagues (38 hours per year); � introduction of guaranteed time for planning, preparation and assessment; � introduction of dedicated headship time; and � introduction of new invigilation arrangements.

54 Improving economy and efficiency of workforce deployment
96 Schools have flexibility in how they deploy teaching assistants and some resources dedicated to particular subjects or year groups.
Use of teaching assistants97 The increase in the numbers of teaching assistants means schools now have more flexibility in how they deploy classroom staff. Schools’ financial returns demonstrate the variation in deployment. In 2007/08, more than 5 per cent of primary schools spent over £500 on education support staff (including teaching assistants) for every £1,000 spent on teachers. By contrast, more than 25 per cent of primary schools spent under £250
The increase in the numbers of teaching assistants means schools now have more flexibility in how they deploy classroom staff.
Figure 14: Schools need to consider a range of variables when thinking about economic and efficient classroom resource deployment
Current teacher contact time against aspired level of contact
The mix of teachers and teaching assistantsby subject and year, and the appropriateness of tasks carried out
Curriculum: range of optional subjects offered pupil time spent on different subjects by year
Cost of teaching staff:+
spend by subject class sizes by subject and across ability groups class sizes by year
+ not all these variables are relevant for all phases of education
Are we achieving the deployment we want at an affordable cost? Where can we make adjustments to improve efficiency? What will changing deployment cost? How do we compare with other schools?
Source: Audit Commission

55Valuable lessonsAudit Commission
Improving economy and efficiency of workforce deployment
for every £1,000 spent on teaching staff. In secondary schools, the ratios differ but variation remains. Nearly 9 per cent of secondary schools spent over £250 on education support staff for every £1,000 spent on teachers, while over 25 per cent spent under £120 for every £1,000 spent on teachers (Figure 15).
Figure 15: Schools’ decisions on the ratios of teachers to education support staff vary
0
100
200
300
400
500
600
Sp
end
on
educ
atio
n su
pp
ort
staf
f per
£1,
000
spen
t on
te
ache
rs, 2
007/
08i
£
Primary schoolsSecondary schools
5 15 25 554535 7565 9585
Percentage of schools (cumulative)
Source: Audit Commission analysis of DSCF section 52 data
98 Teaching assistants undertake a wide range of different tasks. Although schools can deploy teaching assistants differently, there is little published research or guidance, other than an early pathfinder study (Ref. 34) on the cost-effectiveness of various options to inform schools’ i This analysis excludes schools where spend on education support staff was not supplied to us
by DCSF because of data protection rules. This was the case for 2,080 primary schools and 149 secondary schools.

56 Improving economy and efficiency of workforce deployment
decisions.i One head teacher had sought advice from local schools in balancing numbers of teachers and teaching assistants, but had found no helpful advice or guidance. In the absence of guidance, schools have taken different approaches. In the schools that we visited, some had used savings from remodelling the workforce to buy extra teaching time to support priority learners.ii
Resource allocated to subjects and year groups99 There are no statutory requirements for the time that should be spent on each subject, but the Qualifications and Curriculum Authority has published guidance on the hours per week it would expect schools to provide (Table 3). This demonstrates that schools retain some flexibility to deploy resources according to their own priorities.
Table 3: Schools spend the vast majority of their time delivering the national curriculum, but also retain some flexibility to deploy resources
Key stage 1 Key stage 2 Key stage 3
Total minutes 1,100 to 1,250
1,195 to 1,395
1,320
Total hours 18:20 to 20:50
19:55 to 23:15
22:00
Normal school week (hours)
25:00 25:00 27:30
Proportion of school week recommended for compulsory curriculum
73 to 83% 80 to 93% 80%
Source: Teachernetiii
i The government is currently undertaking a review of teaching assistants as part of its Public Value Programme.
ii Priority learners may be pupils who are struggling in the early stages of primary or secondary school, or the middle ability groups whose pass rates need to be improved.
iii The table reflects the requirement for two hours of PE per week. The source table does not refer specifically to the literacy and numeracy hour required at key stages 1 and 2. The table also omits the statutory collective act of worship, registration and travel time.

57Valuable lessonsAudit Commission
Improving economy and efficiency of workforce deployment
100 Schools can prioritise the level of resource allocated to different subjects or year groups. Our updated Managing School Resources tool provides examples of schools that have reviewed and changed resource deployment by subject, with consequent improvements in attainment. But, we found performance made little difference to decisions on allocating resources to subjects (Figure 16). Actual or perceived constraints in delivering the curriculum may drive this, or difficulties in recruiting suitably qualified teachers.
Figure 16: There is little difference in the resource allocation decisions made by secondary schools, regardless of relative performance in core subjects
0
100
200
300
400
500
600
700
£
Tota
l sp
end
on
clas
sroo
m s
taff
per
pup
il in
sec
ond
ary
scho
ols
Similar Maths better than English
English better than Maths
Varies
How English and Maths results compare over two years
-1%
-10%-10% -10%
English
Maths
Source: Audit Commission analysis of DCSF census and attainment data

58 Improving economy and efficiency of workforce deployment
Schools need to use information to ensure economic and efficient deployment
101 Schools should take account of the variables outlined in Figure 14 when taking decisions on classroom staff deployment. Schools have developed their own information to consider economic and efficient deployment. In our update to the Managing School Resources tool, we provide a case study of a secondary school that uses and monitors information effectively to optimise contact ratios and teaching load. Unfortunately, existing research does not provide clear answers about associations between the variables that relate to economy and efficiency, and pupils’ educational performance.
‘Factors such as reduced class size and improved teacher quality may play a role in raising the level of student outcomes, but in general the relationship between measurable school inputs and pupil performance is uncertain.’ (Ref. 35)
102 National stakeholders therefore need to consider how they can improve the research base, and the information and guidance available to schools and governors, so that decision making on classroom staff deployment can take better account of economy and efficiency without compromising effectiveness.
Schools should ensure that their approaches to absence cover are economic and efficient
103 Previous research has found that cover for absence is one area of the budget that has a high propensity for overspend (Ref. 33).
104 Schools provide cover in different ways. The workload agreement of 2003 introduced limits on the amount of cover that teachers can do. Other cover options include cover supervisors, directly employed supply teachers or cover sourced from agencies. The best value for money option will vary with local circumstances. In our separate report, we encourage school staff with financial responsibilities to compare their approaches with the full range of options to ensure value for money.
National stakeholders need to consider how they can improve the research base

59Valuable lessonsAudit Commission
Improving economy and efficiency of workforce deployment
105 Expenditure on agency staff has increased, while expenditure on directly employed supply staff has fallen (Figure 17).i
Figure 17: Schools have reduced expenditure on directly employed supply teachers, but increased expenditure on agency provided cover
-80
-60
-40
-20
0
20
40
60
Rea
l ter
ms
chan
ge in
exp
end
iture
on
sup
ply
sta
ff in
sc
hool
s, 2
002/
03 t
o 20
07/0
8 (£
mill
ion,
200
7/08
pric
es)
Primary schools Secondary schools
£ million
Directly employed
Agency sourced
Source: DCSF section 52 data
Schools should ensure that non-education staff are deployed efficiently
106 There has been a substantial increase in the number of other support staff, from 33,900 in 1997 to 57,600 in 2008 in nursery and primary schools and from 34,700 in 1997 to 79,900 in 2008 in secondary schools (Ref. 1).ii
Expenditure on agency staff has increased, while expenditure on directly employed supply staff has fallen
i These data need to be interpreted carefully. The use of teaching assistants as cover supervisors has increased as a result of the national workload agreement, but these staff are coded to a different expenditure category. Nor do these data include teaching staff providing cover, which constitutes 0.6 per cent of teachers’ time in primary schools and 1.2 per cent of teachers’ time in secondary schools (Ref. 36).
ii Numbers in this paragraph refer to full-time equivalents.

60 Improving economy and efficiency of workforce deployment
107 As a result, expenditure on non-education staff in schools has increased over the last decade. Primary schools increased their expenditure in real terms by 37 per cent, from £800 million in 1999/2000 to £1.3 billion in 2007/08. Secondary schools increased their expenditure from just over £600 million to more than £1.5 billion, or 97 per cent in real terms in the same period (Figure 18).
Figure 18: Expenditure on non-education staff has increased substantially
0
0.4
0.8
1.2
1.6
Exp
end
iture
on
non-
educ
atio
n st
aff
£ billion
Primary schools
Secondary schools
2000
/01
2005
/06
2001
/02
2007
/08
2006
/07
2004
/05
2003
/04
2002
/03
1999
/200
0
Source: DCSF section 52 data

61Valuable lessonsAudit Commission
Improving economy and efficiency of workforce deployment
108 Some of these increases are driven by the national agreement on raising standards and tackling workload, due to the transfer of administrative tasks from teachers. The Institute of Education is currently undertaking research on the deployment and impact of support staff. In our research, we have observed three ways in which schools can manage non-education staff more efficiently. One of these is federation (see Chapter 3). The others we saw were: � Buying or selling specific skills between local schools. In one example,
a school employed a full-time ICT technician and generated income from this by contracting with other schools, which benefited from only purchasing the level of support they required. A secondary school operated a similar model, employing five maintenance staff and contracting out to four primary schools.
� Ensuring non-education staff support wider school outcomes. Schools are taking better account of school improvement priorities in deployment decisions (Ref. 37). Finance, data and administrative staff have reduced the workload of school leaders who, as a result, are able to devote more time to monitoring the quality of teaching and learning.
109 The Audit Commission indicated in its 2009/10 national studies consultation that we intend to discuss with Ofsted the potential for more research on value for money in the schools workforce.
PHOTO REDACTED DUE TO THIRD PARTY RIGHTS OR OTHER LEGAL ISSUES

62 Improving economy and efficiency of workforce deployment

Chapter 6
Conclusion

64 Conclusion
110 Since 1997, schools have received substantial real terms funding increases. With this money, schools have increased the numbers of teachers, teaching assistants and other support staff. Spending on goods and services has also increased. However, schools are not putting all of this money to good use. Schools could save over £400 million through better procurement of goods and services. Reducing excessive balances to reasonable levels would release £530 million.
111 The challenging financial future increases the necessity for economy and efficiency in schools. Schools are already receiving more limited real terms increases in funding, and national economic circumstances suggest that this will continue beyond the current three-year funding allocation.
112 With autonomy and delegated funding, schools, as opposed to councils or central government, make most decisions about resource deployment. The Commission supports the principle of devolved decision making, but it is important that taxpayers can be confident that public money is being spent well. However, accountability for ensuring and reporting on value for money is less comprehensive in schools than in other sectors. Schools have not been subject to the same efficiency disciplines as most other providers of public services, and have therefore been under less pressure to spend their money well.
113 DCSF, councils, Ofsted, governing bodies, and school leaders and managers all have roles to play in maximising value for money. The examples used in this report, its associated products and our recommendations illustrate the specific roles each can play.
The Commission supports the principle of devolved decision making, but it is important that taxpayers can be confident that public money is being spent well

Appendix 1: Research method 66
Appendix 2: The funding system for schools 68
Appendix 3: Analysis of variation in schools’ procurement expenditure 70
Appendix 4: References 77
Appendices

66 Appendices
Appendix 1: Research method
Research for this study took place between July and December 2008. The study team used a mixed methods approach, with a focus on local authority maintained schools and their host councils. There were three main parts to the research: � A literature review of academic evidence
and recent government policy on value for money in schools.
� Documentary analysis, data collection and semi-structured interviews in a sample of 23 case study schools, in seven council areas. We interviewed 60 individuals (including head teachers, governors and others with responsibilities for finance) in schools and 24 officers in councils. Although not representative, councils were selected to reflect different types of authority in different parts of the country. Case study schools were selected in each council based on a range of Ofsted value for money assessment scores. The Commission thanks the councils and schools that took part in this work: – Abington High School, Leicestershire – Ashfield Valley Primary School, Rochdale – Blackpool Church of England Primary
School, Devon – Brixington Community Nursery and
Primary School, Devon – Crossways Junior School, South
Gloucestershire – Countesthorpe Community College,
Leicestershire – Hornsey School for Girls, Haringey – Littleham Church of England Primary
School, Devon – Lutterworth Grammar School and
Community College, Leicestershire – Middleton Technology School, Rochdale – Newbridge High School, Leicestershire – Prendergast School, Lewisham
– Queen Elizabeth’s Community College, Devon
– Sidmouth College, Devon – St Luke’s Science and Sports College,
Devon – St Margaret’s Church of England Primary
School, Rochdale – St Mary’s School, South
Gloucestershire – St Patrick’s Roman Catholic Primary
School, Rochdale – The Castle School, Somerset – Trinity Primary School, Somerset – Wardle High School, Rochdale – Weston Park Primary School, Haringey – Woodland Community Primary School,
Rochdale � Analysis of secondary data on school
finance, attainment and workforce deployment. The most complex analysis was undertaken to review the variation in schools’ expenditure on goods and services. A fuller explanation of the approach taken is set out in Appendix 3.

67Valuable lessonsAudit Commission
Appendices
Nigel Terrington, Benjamin Day, Sharon Wordsworth and Simon Mahony researched and managed the study. Chloe Schneider provided additional support. John Kirkpatrick was the project director. The study team consulted and shared its findings with representatives of the following organisations: � Association of Directors of Childrens
Services � Department for Children, Schools
and Families � HM Treasury � Local Government Association � National Association of Head Teachers � National Association of School Business
Managers � National Association of School Masters
Union of Women Teachers � National Audit Office � National Governors’ Association � Ofsted
The Audit Commission thanks all those who were involved. However, the views expressed in this report are those of the Audit Commission alone.

68 Appendices
Appendix 2: The funding system for schools
In a recent report, the CfBT Education Trust explained the school funding system by setting out six stages through which funding is allocated (Figure 19). The first four stages involve decisions about the amount of funding allocated by central government to 152 single and upper tier councils, while the final two concern decisions made within the council about allocations to individual schools.
The dedicated schools grant is the main funding mechanism for schools, accounting for 83.5 per cent of all grant funding in 2008/09 (Ref. 39). It is allocated effectively on a spend plus basis, with a per pupil increase on the previous year’s funding supplemented by amounts provided to support ministerial priorities. Historically, allocations were calculated as a basic per pupil amount topped up with an area cost adjustment, which took account of deprivation and intake. DCSF is currently undertaking a review of the dedicated schools grant with the aim of developing a single, transparent formula that will be used as the basis for distributing funding from 2011/12 onwards.
At council level, fair funding formulae are agreed with schools. Although these formulae are locally agreed, they are subject to three main constraints: � the factors that must be taken into account
in developing the formulae are restricted; � schools are guaranteed a minimum per
pupil increase, with the minimum funding guarantee overriding the local formula if a school would otherwise receive an increase below the minimum level; and
� the number of funding streams where grants are allocated directly from central government to schools has grown (Ref. 38).

69Valuable lessonsAudit Commission
Appendices
Figure 19: The funding system for schools
Stage 1 : Total education spending for England
Amount allocated by the government for
total education expenditure in England
Stage 6 : Funds allocated to an individual school
From both fair funding formula and
individual grants
Stage 2 : Schools spending for England
Most of the spending allocated to
education (DCSF)
Stage 3 : Dedicated schools grant
Most of the
schools budget
Stage 3 : Other specific grants
eg Schools standards
grant
Stage 3 : Learning and skills council funding
Sixth-form funding
Stage 2 : Non-schools education spending for Englandeg Universities (DIUS)
Stage 5 : Individual schools budgetMoney allocated to individual schools
through local fair funding formula
Stage 5 : Central servicesMoney retained by local authority to pay
for pupil services, eg high cost special
educational needs provision and pupil
referral units
Stage 4 : Local authority schools budget
Money that local authorities spend on
pupils in their area
Stage 4 : Other sources of fundseg Council tax revenues
Source: Adapted from CfBT Education Trust

70 Appendices
Appendix 3: Analysis of variation in schools’ procurement expenditure
We undertook analysis to control for the different contexts of schools and to understand the extent of variation in expenditure that remained. In this analysis, schools were clustered according to geographical location and the presence or absence of a sixth-form for secondary schools. Primary and secondary schools were split into different clusters. Within these clusters, schools were assigned 25 statistical nearest neighbours based on a range of indicators that took account of attainment, number of pupils, number and qualifications of teachers and other staff, eligibility for free school meals, pupils with special educational needs and pupils with English as an additional language. Expenditure data were then analysed by consistent financial reporting codes to compare the per pupil expenditure on different items between similar schools.
This type of analysis is only meaningful for some items, in particular those where the costs are relatively stable, applicable to all schools, and there are no substitution effects. For example, if undertaking analysis of workforce costs on this basis, a proportion of any variation would be attributable to legitimate local choices about staffing composition, rather than other differences in costs.
We therefore focused this analysis on items that are applicable to all schools and not sensitive to substitution effects (Figures 20 to 25).

71Valuable lessonsAudit Commission
Appendices
Figure 20: Per pupil energy expenditure relative to schools’ statistical neighbours, 2007/08
-200
-150
-100
-50
0
50
100
150
200
Sp
end
ing
per
pup
il re
lativ
e to
med
ian
of n
eare
st n
eigh
bou
rs
for
ener
gy e
xpen
ditu
re (C
FR c
ode
E16
)
£
Primary schools
Secondary schools
Percentage of schools
0 10 20 30 40 50 60 70 80 90 100
Source: Audit Commission

72 Appendices
Figure 21: Per pupil catering expenditure relative to schools’ statistical neighbours, 2007/08
-500
-400
-300
-200
-100
0
100
200
300
400
500
Sp
end
ing
per
pup
il re
lativ
e to
med
ian
of n
eare
st n
eigh
bou
rs
for
cate
ring
exp
end
iture
(CFR
cod
es E
06 a
nd E
25)
£
Primary schoolsSecondary schools
Percentage of schools
0 10 20 30 40 50 60 70 80 90 100
Source: Audit Commission

73Valuable lessonsAudit Commission
Appendices
Figure 22: Per pupil insurance expenditure relative to schools’ statistical neighbours, 2007/08
-100
-75
-50
-25
0
25
50
75
100
Sp
end
ing
per
pup
il re
lativ
e to
med
ian
of n
eare
stne
ighb
ours
for
othe
r in
sura
nce
exp
end
iture
(CFR
cod
e E
23)
£
Primary schoolsSecondary schools
Percentage of schools
0 10 20 30 40 50 60 70 80 90 100
Source: Audit Commission

74 Appendices
Figure 23: Per pupil premises expenditure relative to schools’ statistical neighbours, 2007/08
-200
-150
-100
-50
0
50
100
150
200
Sp
end
ing
per
pup
il re
lativ
e to
med
ian
of n
eare
st n
eigh
bou
rs
for
pre
mis
es e
xpen
ditu
re (C
FR c
odes
E04
and
E14
)
£
Primary schoolsSecondary schools
Percentage of schools
0 10 20 30 40 50 60 70 80 90 100
Source: Audit Commission

75Valuable lessonsAudit Commission
Appendices
Figure 24: Per pupil learning resources expenditure relative to schools’ statistical neighbours (excluding ICT and averaged over 2002/03 to 2007/08 to account for volatility)
-200
-150
-100
-50
0
50
100
150
200
Sp
end
ing
per
pup
il re
lativ
e to
med
ian
of n
eare
st
neig
hbou
rs fo
r p
rem
ises
exp
end
iture
(CFR
cod
e E
19) £
Primary schoolsSecondary schools
Percentage of schools
0 10 20 30 40 50 60 70 80 90 100
Source: Audit Commission

76 Appendices
Figure 25: Per pupil administrative supplies expenditure relative to schools’ statistical neighbours (averaged over 2002/03 to 2007/08 to account for volatility)
-200
-150
-100
-50
0
50
100
150
200
Sp
end
ing
per
pup
il re
lativ
e to
med
ian
of n
eare
st n
eigh
bou
rs
for
adm
inis
trat
ive
sup
plie
s ex
pen
ditu
re (C
FR c
ode
E22
) £
Primary schoolsSecondary schools
Percentage of schools
0 10 20 30 40 50 60 70 80 90 100
Source: Audit Commission

77Valuable lessonsAudit Commission
Appendices
Appendix 4: References
1 Department for Children, Schools and Families, School Census, Department for Children, Schools and Families, 2008.
2 Department for Children, Schools and Families, Section 52 Data Archive, Department for Children, Schools and Families, 2007/08.
3 Sir Peter Gershon, Releasing Resources to the Front Line, HM Treasury, 2004.
4 HM Treasury, Spending Review, HM Treasury, 2004.
5 HM Treasury, Pre-budget Report and Comprehensive Spending Review, HM Treasury, 2007.
6 Office of National Statistics, Public Service Productivity: Education – Paper 1, Office of National Statistics, September 2007.
7 Organisation for Economic Co-operation and Development, Improving School Leadership: Volume 1 – Policy and Practice, Organisation for Economic Co-operation and Development, Paris, August 2008.
8 Organisation for Economic Co-operation and Development, Programme for International Student Assessment 2006: Science Competencies for Tomorrow’s World, Organisation for Economic Co-operation and Development, Paris, 2007.
9 House of Commons Children, Schools and Families Committee, Public Expenditure: First Report of Session 2008/09, House of Commons, London: The Stationery Office Limited, December 2008.
10 HM Treasury, Budget 2009: Building Britain’s Future, HM Treasury, 2009.
11 Department for Children, Schools and Families, Autumn Performance Report 2008: Progress Against Public Service Agreements, Department for Children, Schools and Families, 2008.
12 Department for Children, Schools and Families, School Funding Settlement for 2008/09 to 2010/11 (Statement to Parliament by the Minister of State for Schools and Learners), Department for Children, Schools and Families, 2007.
13 Hedra, Evaluation of the Implementation of the Financial Management Standard in Schools, Mouchel, 2008.
14 Department for Children, Schools and Families, FMSiS Re-assessments, January 2009 (accessible at www.fmsis.info/news/?id=38)
15 Audit Commission, Education Funding: The Impact and Effectiveness of Measures to Stabilise School Funding, Audit Commission, 2004.
16 Department for Children, Schools and Families, Applying Clawback Mechanisms to Surplus School Revenue Balances, Department for Children, Schools and Families, July 2008.

78 Appendices
17 Audit Commission, A Prescription for Partnership: Engaging Clinicians in Financial Management, Audit Commission, 2007.
18 Department for Education and Employment, The Role of the Local Education Authority in School Education, DfEE Publications, 2000.
19 Department for Children, Schools and Families, Learning From Experience: Schools Commissioning by Local Authorities, Department for Children, Schools and Families, 2008.
20 Audit Commission, National School Survey Results, Audit Commission, 2008.
21 Ofsted, Remodelling the School Workforce, Ofsted, 2005.
22 Audit Commission, Taking it on Trust: A Review of How Boards of NHS Trusts and Foundation Trusts Get Their Assurance, Audit Commission, 2009.
23 Department for Children, Schools and Families, Strategic Planning: the Key to Financial Sustainability, Department for Children, Schools and Families, 2008.
24 Department for Children, Schools and Families, Benchmarking Data 2008, unpublished.
25 Ofsted, Using Data; Improving Schools, Ofsted, 2008.
26 Audit Commission, In the Know: Using Information To Make Better Decisions, Audit Commission, 2008.
27 Ofsted, The Importance of ICT: Information and Communication Technology in Primary and Secondary Schools, Ofsted, 2005/2008.
28 Audit Commission, Healthy Competition: How Councils Can Use Competition and Contestability To Improve Services, Audit Commission, 2007.
29 Office of Government Commerce, Decision Making in Energy Procurement, Office of Government Commerce, November 2008.
30 National Audit Office, Smarter Food Procurement in the Public Sector, National Audit Office, 2006.
31 School Food Trust, A Fresh Look at School Food Procurement Efficiency and Sustainability, School Food Trust, 2008.
32 Department for Environment, Food and Rural Affairs, Policy Decision in Schools and Proposed Scheme-wide Amendments for the Carbon Reduction Commitment, Department for Environment, Food and Rural Affairs, July 2008.
33 Dodd, A., Investigating the Effective Use of Resources in Secondary Schools, Hedra Consulting, 2006.
34 Thomas, H. et al., Transforming the Schools Workforce Pathfinder Project, Department for Education and Skills, 2004.
35 Davidson, A., Miskelly, J. and Kelly, A., Value for Money in Schools: Literature and Data Review, FGS, 2008.

79Valuable lessonsAudit Commission
Appendices
36 School Teachers’ Review Body, School Teachers’ Workload Survey, BMRB Social Research, 2008.
37 Ofsted, The Deployment, Training and Development of the Wider Workforce, Ofsted, 2008.
38 CfBT Education Trust, Level Playing Field? The Implications of School Funding, CfBT, June 2008.
39 Chartered Institute of Public Finance and Accountancy, An Introductory Guide to Education Finance in England: Fully Revised Third Edition, Chartered Institute of Public Finance and Accountancy, 2008.

80

Printed in the UK for the Audit Commission by Trident Printing ServicesDesign and production by the Audit Commission Publishing Team
© Audit Commission 2009This document is available on our website at: www.audit-commission.gov.uk
If you require a copy of this document in large print, in Braille, on tape, or in a language other than English, please call: 0844 798 7070
If you require a printed copy of this document, please call: 0800 50 20 30 or email: [email protected]
For further information on the work of the Commission please contact: Audit Commission1st FloorMillbank TowerMillbank London SW1P 4HQ
Telephone: 0844 798 1212 Fax: 0844 798 2945 Textphone (minicom): 0844 798 2946
www.audit-commission.gov.uk
We welcome your feedback. If you have any comments on this report, are intending to implement any of the recommendations, or are planning to follow up any of the case studies, please email: [email protected]

Audit Commission 1st Floor Millbank Tower Millbank London SW1P 4HQ
Telephone: 0844 798 1212 Fax: 0844 798 2945Textphone (minicom): 0844 798 2946
www.audit-commission.gov.uk
Price £15Stock code: LNR3539
09-0
161


