AUTHOR'S DECLARATION FOR ELECTRONIC SUBMISSION OF A THESIS I hereby declare that I am the sole author of this thesis. This is a true copy of the thesis, including any required final revisions, as accepted by my examiners. I understand that my thesis may be made electronically available to the public.
iii
Abstract
The wettability of contact lenses has become an area of intense research, with the belief
that the more “hydrophilic” or wettable the lens surface is, the more comfortable the lens may be,
as the posterior surface of the eyelid will move more smoothly over it, hence increasing comfort.
There are many ways to assess the wettability of a given material, namely sessile drop,1
captive bubble 2 or Wilhelmy plate. 3 This thesis used the sessile drop method to determine the
surface wettability of various hydrogel contact lens materials, by measuring the advancing contact
angle made between the lens surface and a pre-determined volume of HPLC-grade water. This was
followed by measuring the surface wettability following periods in which the lens materials were
soaked in various contact lens care regimens. Further studies determined wettability of lens
materials after various periods of in-eye wear and finally a study was undertaken to evaluate if a
novel biological technique could be used to differentiate proteins that deposit on hydrogel lens
materials that may affect wettability and cause discomfort.
A variety of hydrogel lenses, taken directly from their packaging and after soaking in
various care regimens, were analyzed to determine their sessile drop advancing contact angles, in
vitro. These studies indicated that poly-2-hydroxyethylmethacrylate (pHEMA)-based lenses are
inherently more wettable than silicone-based lenses, unless they have a surface treatment that
completely covers the hydrophobic siloxane groups. Additionally, certain combinations of lens
materials and care regimens produce inherently more wettable surfaces when measured in vitro.
Suitable methods to assess contact lens wettability ex vivo, or after subjects had worn
lenses for set periods of time, were developed. It was determined that using latex gloves to remove
lenses had no impact upon the lens surface wettability and that rinsing of the lens surface after
removal from the eye was required to determine the wettability of the underlying polymer.
iv
The final wettability studies involved an analysis of various lens materials from clinical
studies conducted within the Centre for Contact Lens Research (CCLR). These studies investigated
differences in wettability between silicone hydrogel lenses manufactured from differing polymers
and variations in ex vivo wettability of several combinations of lens materials and solutions, worn
for varying periods of time.
A novel method to investigate proteins extracted from lenses using 2D-Difference in Gel
Electrophoresis (DIGE) found that this technique could be used to analyze proteins extracted from
contact lenses. The data obtained showed that there was no difference between a group of subjects
who were symptomatic of lens-induced dryness or a control group, and that care solutions had a
minimal influence on the pattern of deposition seen.
The overall conclusion of these studies is that hydrogel lens wettability is affected by the
polymer composition and that care regimen components can modify the surface wettability.
v
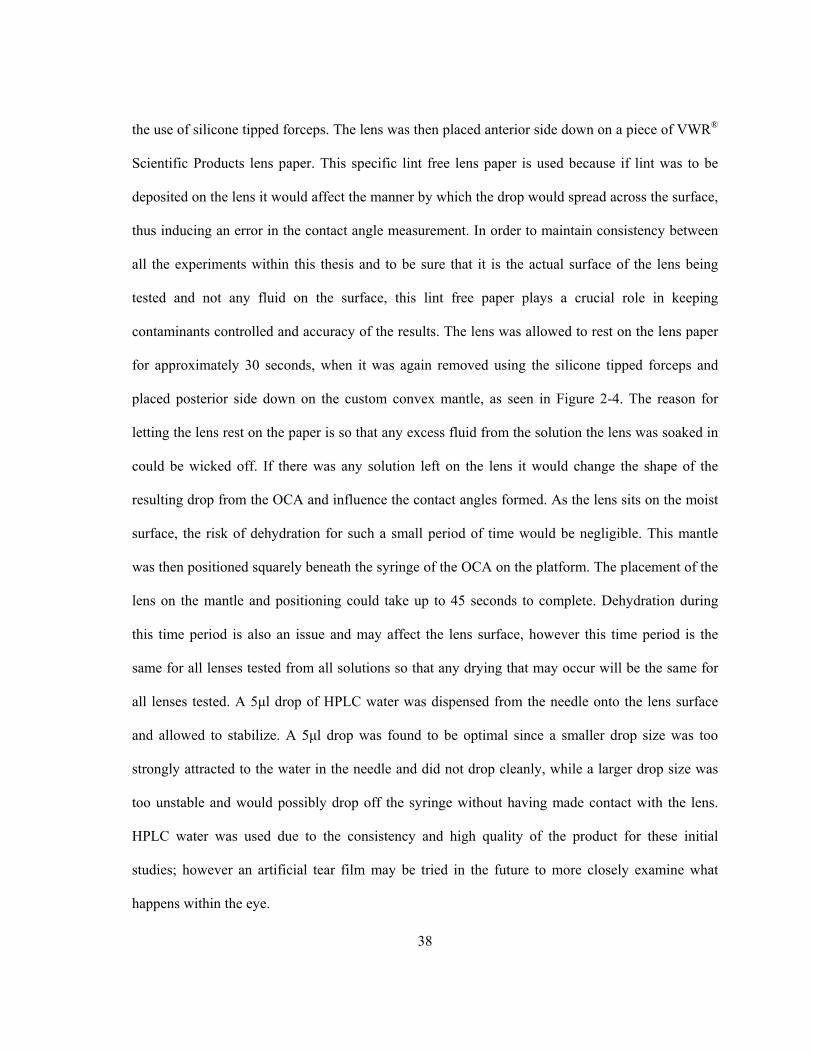
Acknowledgements
The research involved in this thesis was undertaken through the support of numerous
people, for whom I have a great deal of respect and gratitude. Because of your unfaltering
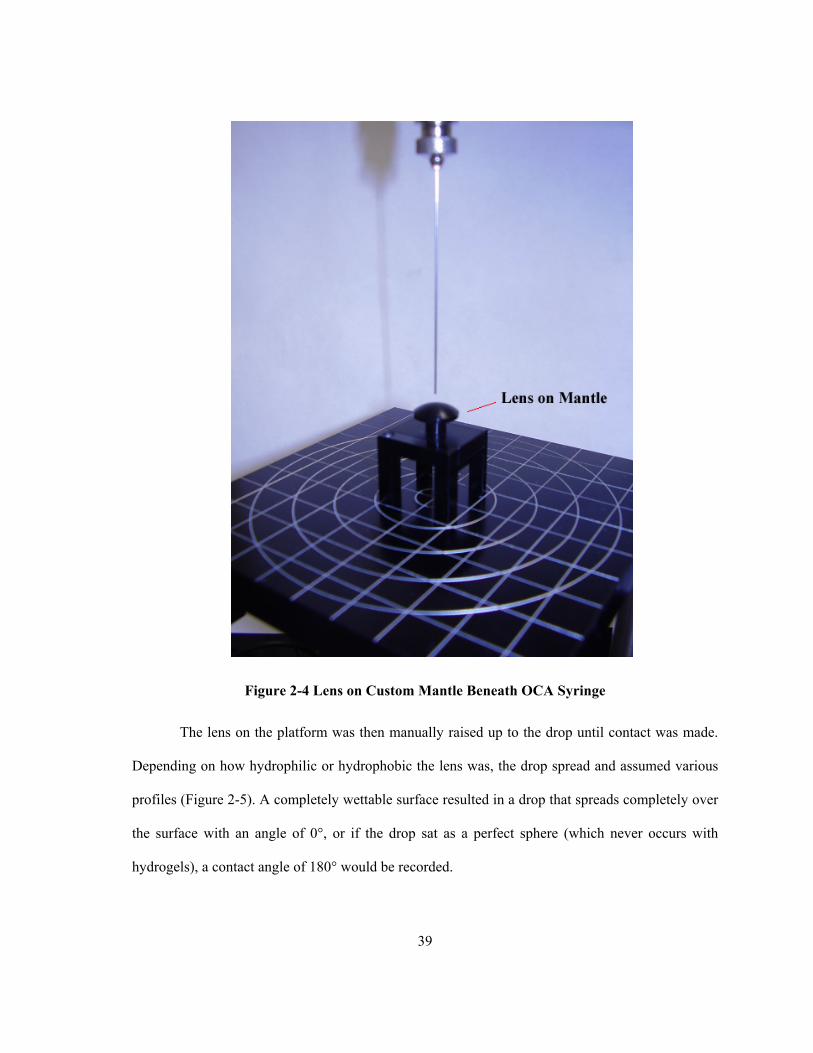
assistance and genuine friendships over this time, I have gained much more than simply a degree.
Thanks goes to my two supervisors, Dr. Lyndon Jones and Dr. Matt Vijayan who have
given me guidance and access to their incredibly deep vaults of information as I made my way
through these uncharted waters.
I also need to express my appreciation to my committee members, Dr. Trefford Simpson
and Dr. Brendan McConkey without whom I would still be struggling though an aspect of vision
science or biology of which they were integral in pointing me the right way.
I would also like to acknowledge all the support that I received in the laboratories. From
Mary-Ann Glasier, Elizabeth Heikkila, Miriam Heynen and Andrea Spires, you truly were my four
wise (wo)men that always had a smile and an answer for my unending barrage of questions. I do
not know if I can ever thank you all enough.
Thanks also goes to Alcon Research Ltd for all the financial support through these two
years. I truly appreciate all the opportunities you have afforded me.
I would also like to thank all the support that I have received from fellow graduate students
from both vision science and biology, who gave constant friendship and understanding though all
the ups and downs.
Thanks to everyone at the school of optometry who truly make working there a joy.
vi
Last but not least, thanks to my family and loved ones whose resolute encouragement has
made this whole process an adventure that has made me a better person in the end. Thank you for
loving me back.
All of you together are so much greater than the parts.
vii
Table of Contents ABSTRACT ........................................................................................................................................ III ACKNOWLEDGEMENTS......................................................................................................................V TABLE OF CONTENTS ..................................................................................................................... VII LIST OF TABLES ............................................................................................................................... IX LIST OF FIGURES................................................................................................................................X CHAPTER 1 INTRODUCTION .............................................................................................................. 1
1.1 CONTACT LENS HISTORY ....................................................................................................... 1 1.2 MEASURING WETTABILITY..................................................................................................... 6 1.3 CONTACT LENS CARE SOLUTIONS........................................................................................ 15 1.4 TEAR FILM COMPONENTS AND CONTACT LENSES ............................................................... 23 1.5 TECHNIQUES TO ANALYSE PROTEIN DEPOSITION ON HYDROGEL LENSES .......................... 25
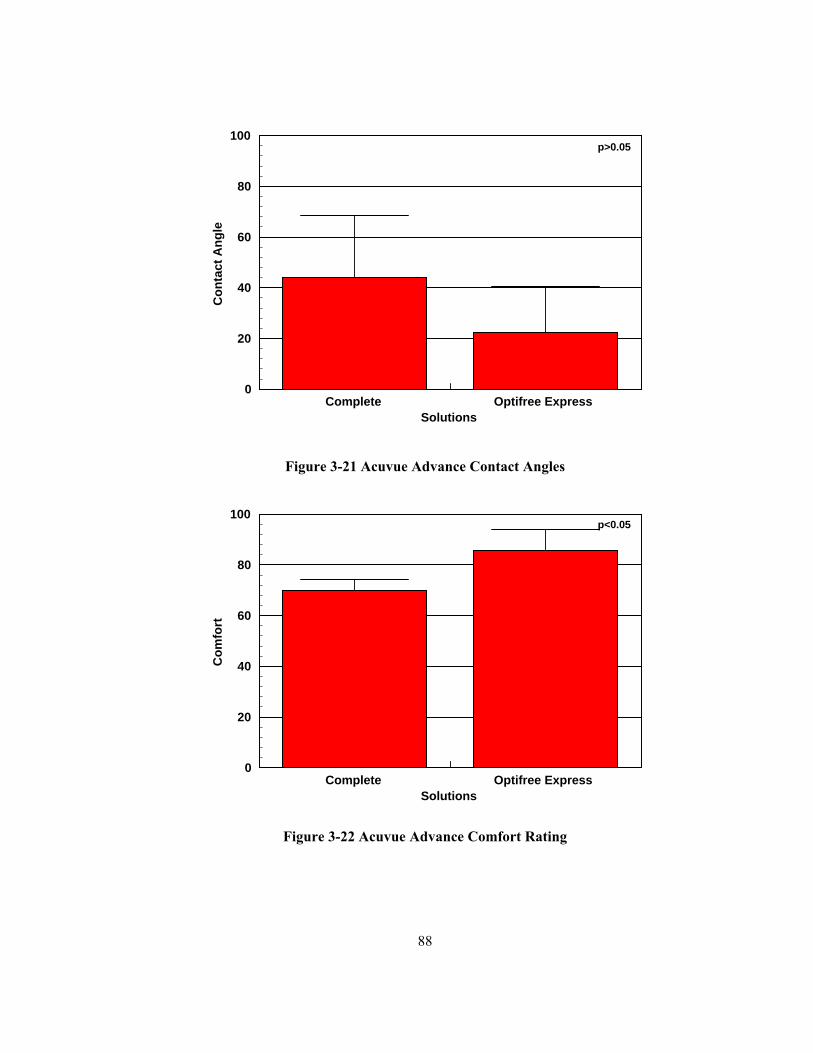
3.2 EX VIVO DATA...................................................................................................................... 80 3.2.1 Impact of Lens Removal on Ex Vivo Wettability Study ............................................... 80 3.2.2 Influence of Rinse vs Saline Soak Study...................................................................... 81 3.2.3 Influence of Saline Cycling on Contact Angle Assessment Study ............................... 84 3.2.4 Influence of Presoaking Galyfilcon A With Care Regimens ....................................... 87
viii
3.3 CLINICAL TRIALS.................................................................................................................. 89 3.3.1 DOSL Study................................................................................................................. 89 3.3.2 Influence of Presoaking Etafilcon A on Short Term Wettability ................................. 91
3.4 PROTEIN DEPOSITION ANALYSIS BY 2D GEL ELECTROPHORESIS ...................................... 106 3.4.1 Protein Assay – First Trial........................................................................................ 106 3.4.2 Protein Assay Final Samples .................................................................................... 109 3.4.3 2D DIGE Gels........................................................................................................... 112 3.4.4 Protein Identification ................................................................................................ 118
CHAPTER 4 SUMMARY AND FURTHER WORK ............................................................................. 122 4.1 IN VITRO WETTABILITY STUDIES ....................................................................................... 122 4.2 EX VIVO WETTABILITY STUDIES........................................................................................ 126 4.3 EX VIVO CLINICAL TRIAL ASSESSMENT OF LENS WETTABILITY ...................................... 127 4.4 PROTEIN DEPOSITION STUDIES........................................................................................... 129 4.5 SUMMARY ........................................................................................................................... 131
ix
List of Tables TABLE 1-1 FDA CATEGORIZATION OF CONVENTIONAL HYDROGELS................................................ 3 TABLE 1-2 MEDICINAL INGREDIENTS OF CONTACT LENS CARE SOLUTIONS46 ................................ 17 TABLE 1-3 HYDROPHOBIC AND HYDROPHILIC GROUPS USED WITHIN SURFACTANTS54 .................. 20 TABLE 2-1 DAILY DISPOSABLE CONTACT LENSES ........................................................................... 30 TABLE 2-2 PHEMA-BASED FREQUENT REPLACEMENT LENSES....................................................... 31 TABLE 2-3 CHARACTERISTICS OF SILICONE BASED CONTACT LENSES............................................ 32 TABLE 2-4 CONTACT LENS CARE SOLUTIONS .................................................................................. 34 TABLE 2-5 SDS EQUILIBRATION BUFFER ......................................................................................... 44 TABLE 2-6 EXPERIMENTAL DESIGN FOR DIGE CYDYE - SUBJECT COMBINATION .......................... 45 TABLE 2-7 POLYACRYLAMIDE GEL COMPOSITION............................................................................ 47 TABLE 2-8 CYDYE WAVELENGTH ACTIVATION ............................................................................... 47 TABLE 3-1 PHEMA BLISTER PACK SOLUTIONS CHARACTERISTICS ................................................ 50 TABLE 3-2 SILICONE HYDROGEL BLISTER PACK SOLUTION CHARACTERISTICS ............................. 50 TABLE 3-3 STATISTICALLY SIGNIFICANT DIFFERENCES - ACUVUE ADVANCE SOAKED LENSES ..... 64 TABLE 3-4 STATISTICALLY SIGNIFICANT DIFFERENCES - NIGHT AND DAY SOAKED LENSES ......... 66 TABLE 3-5 STATISTICALLY SIGNIFICANT DIFFERENCES - O2 OPTIX SOAKED LENSES ..................... 68 TABLE 3-6 STATISTICALLY SIGNIFICANT DIFFERENCES - PUREVISION SOAKED LENSES................. 70 TABLE 3-7 STATISTICALLY SIGNIFICANT DIFFERENCES - ACUVUE OASYS SOAKED LENSES ........ 72 TABLE 3-8 STATISTICALLY SIGNIFICANT DIFFERENCES - PROCLEAR SOAKED LENSES ................... 75 TABLE 3-9 STATISTICALLY SIGNIFICANT DIFFERENCES - SOFLENS 66 SOAKED LENSES ................. 77 TABLE 3-10 STATISTICALLY SIGNIFICANT DIFFERENCES WITH ACUVUE 2 SOAKED LENSES .......... 79 TABLE 3-11 CONTACT ANGLE RESULTS FOR GLOVE IMPACT STUDY .............................................. 81 TABLE 3-12 WETTABILITY MEASUREMENTS, CONTACT ANGLES (OUT OF EYE METHOD) ................ 92 TABLE 3-13 WETTABILITY MEASUREMENTS (RINSE METHOD)......................................................... 97 TABLE 3-14 WETTABILITY MEASUREMENTS (SOAK METHOD) ....................................................... 101 TABLE 3-15 PRELIMINARY PROTEIN ASSAY CONCENTRATIONS .................................................... 107 TABLE 3-16 FINAL PROTEIN ASSAY CONCENTRATIONS................................................................. 110 TABLE 3-17 FINAL 2-D GEL VOLUMES........................................................................................... 111 TABLE 3-18 CONTACT LENS TEAR FILM PROTEINS72 ..................................................................... 121
x
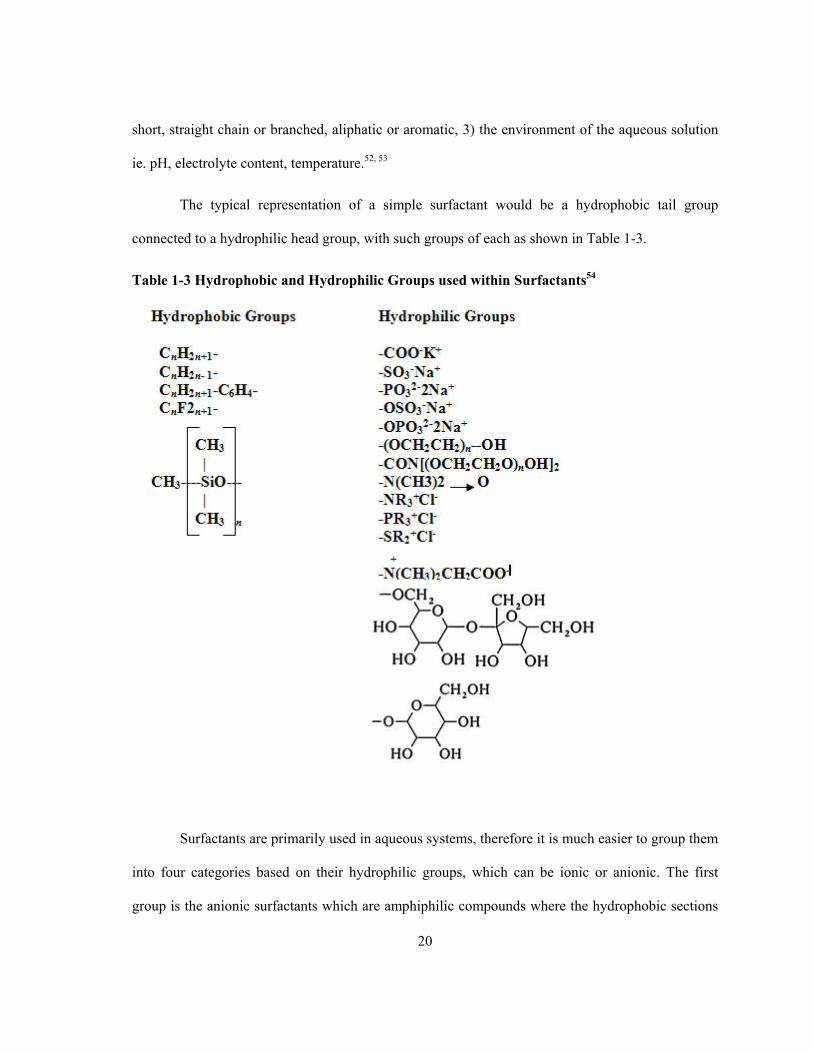
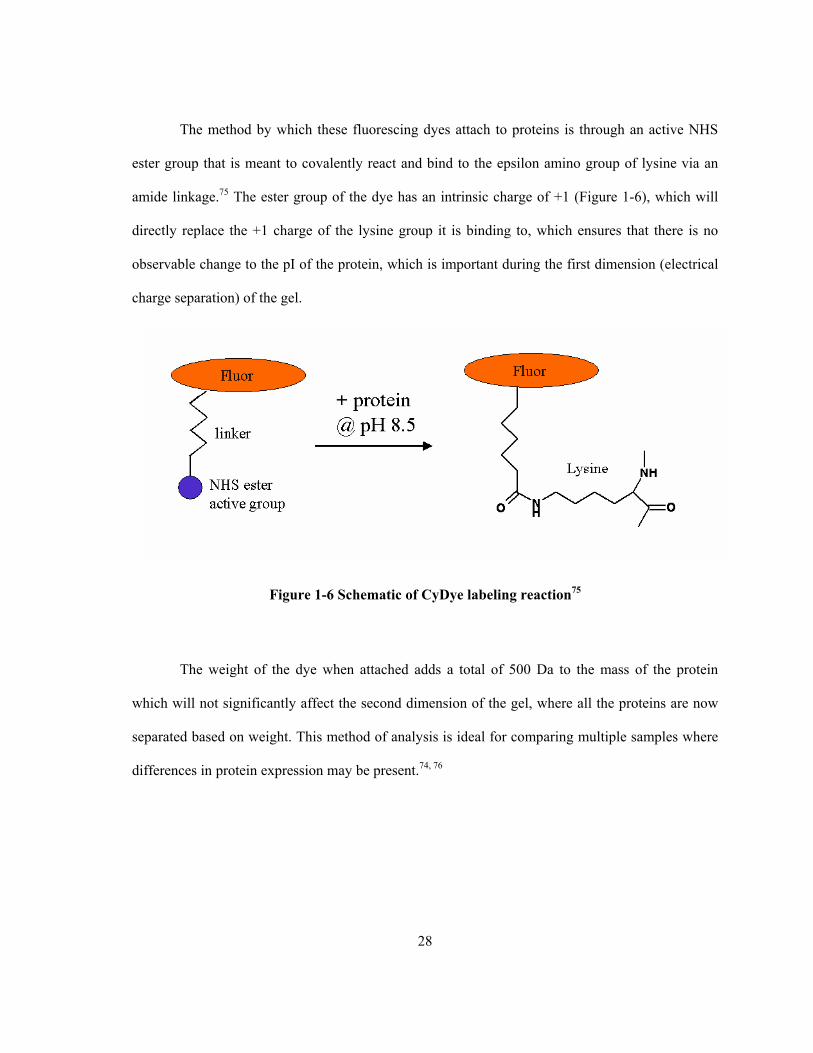
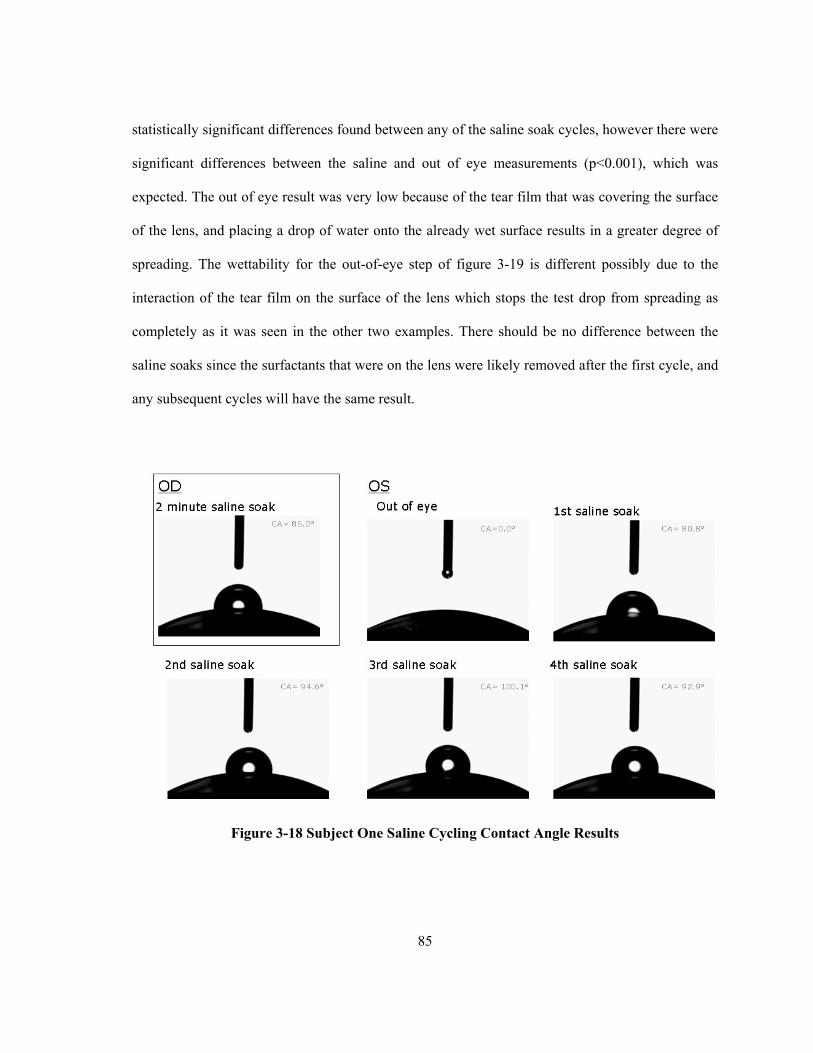
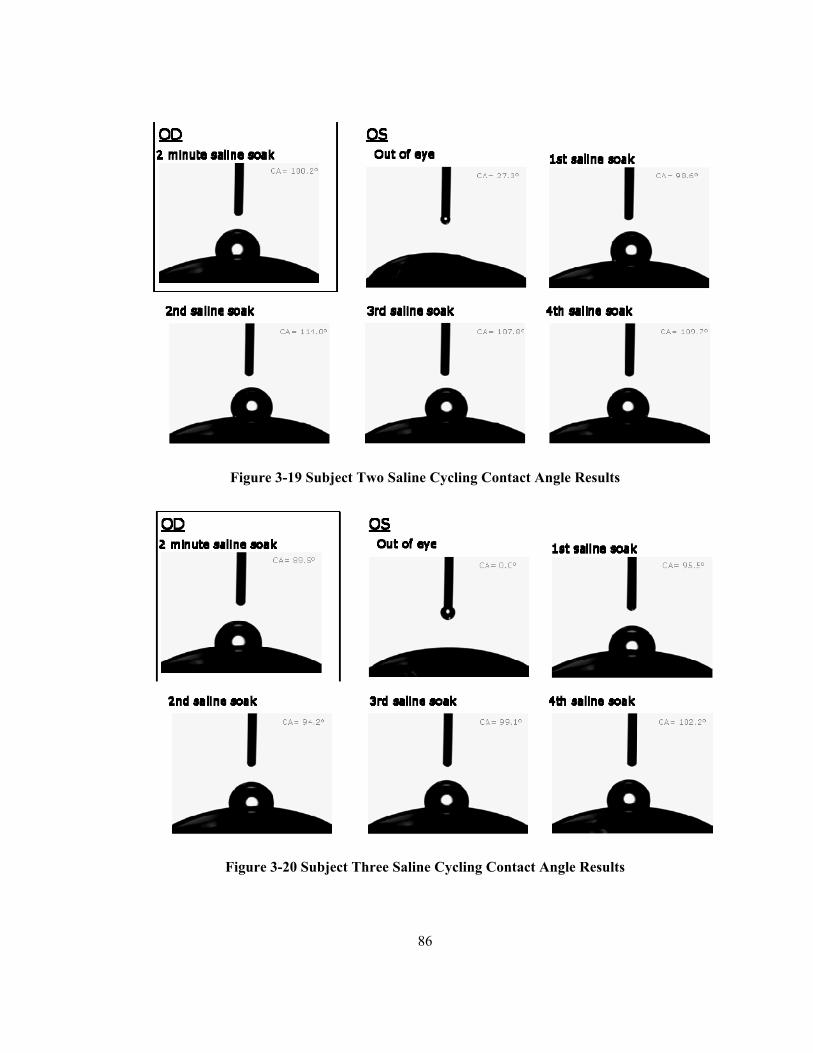
List of Figures FIGURE 1-1 ATOMIC FORCE MICROSCOPY OF VARIOUS CONTACT LENS SURFACES............................ 5 FIGURE 1-2 WETTABILITY – EXAMPLE OF THE CAPTIVE BUBBLE TECHNIQUE.................................. 9 FIGURE 1-3 WETTABILITY – EXAMPLE OF THE WILHELMY PLATE TECHNIQUE............................... 11 FIGURE 1-4 WETTABILITY – EXAMPLE OF THE SESSILE DROP TECHNIQUE ..................................... 14 FIGURE 1-5 OUTLINE OF 2D-DIGE PROCESS 75 ................................................................................. 27 FIGURE 1-6 SCHEMATIC OF CYDYE LABELING REACTION75 ............................................................. 28 FIGURE 2-1 MODEL 3320 OSMOMETER............................................................................................. 35 FIGURE 2-2 CAHN DCA 322 ............................................................................................................ 36 FIGURE 2-3 DATAPHYSICS OPTICAL CONTACT ANGLE ANALYZER ................................................. 37 FIGURE 2-4 LENS ON CUSTOM MANTLE BENEATH OCA SYRINGE .................................................. 39 FIGURE 2-5 DROP PROFILE EXAMPLES.............................................................................................. 40 FIGURE 2-6 SCREEN CAPTURE OF SCA SOFTWARE........................................................................... 41 FIGURE 2-7 STANDARD CURVE OF PROTEIN ASSAY......................................................................... 43 FIGURE 3-1 O2 OPTIX (LOTRAFILCON B) SOAKED IN RENU MOISTURELOC.................................... 51 FIGURE 3-2 O2 OPTIX (LOTRAFILCON B) SOAKED IN OPTIFREE EXPRESS ....................................... 53 FIGURE 3-3 ACUVUE 2 (ETAFILCON A) SOAKED IN RENU MOISTURELOC....................................... 54 FIGURE 3-4 ACUVUE 2 (ETAFILCON A) SOAKED IN OPTIFREE EXPRESS .......................................... 56 FIGURE 3-5 ACUVUE 2 (ETAFILCON A) SOAKED IN BOTH SOLUTION, SALINE PRE-WASH................. 57 FIGURE 3-6 DAILY WEAR DAILY DISPOSABLE CONTACT LENSES ................................................... 58 FIGURE 3-7 SILICONE HYDROGELS OUT OF PACK ............................................................................ 60 FIGURE 3-8 ACUVUE ADVANCE IN CARE SOLUTIONS ...................................................................... 63 FIGURE 3-9 FOCUS NIGHT & DAY IN CARE SOLUTIONS ................................................................... 65 FIGURE 3-10 O2 OPTIX IN CARE SOLUTIONS..................................................................................... 67 FIGURE 3-11 PUREVISION IN CARE SOLUTIONS ................................................................................ 69 FIGURE 3-12 ACUVUE OASYS IN CARE SOLUTIONS........................................................................ 71 FIGURE 3-13 PROCLEAR IN CARE SOLUTIONS .................................................................................. 74 FIGURE 3-14 SOFLENS 66 IN CARE SOLUTIONS................................................................................. 76 FIGURE 3-15 ACUVUE 2 IN CARE SOLUTIONS ................................................................................... 78 FIGURE 3-16 SUBJECT ONE RINSE VERSUS SOAK CONTACT ANGLE RESULTS................................. 82 FIGURE 3-17 SUBJECT TWO RINSE VERSUS SOAK CONTACT ANGLE RESULTS................................ 83 FIGURE 3-18 SUBJECT ONE SALINE CYCLING CONTACT ANGLE RESULTS ...................................... 85
xi
FIGURE 3-19 SUBJECT TWO SALINE CYCLING CONTACT ANGLE RESULTS ..................................... 86 FIGURE 3-20 SUBJECT THREE SALINE CYCLING CONTACT ANGLE RESULTS .................................. 86 FIGURE 3-21 ACUVUE ADVANCE CONTACT ANGLES ....................................................................... 88 FIGURE 3-22 ACUVUE ADVANCE COMFORT RATING ....................................................................... 88 FIGURE 3-23 DOSL EX VIVO WETTABILITY .................................................................................... 90 FIGURE 3-24 EX VIVO WETTABILITY FOR SOLUTIONS OVER TIME (OUT-OF-EYE METHOD) ............... 93 FIGURE 3-25 EX VIVO WETTABILITY FOR THE TWO GROUPS OVER TIME (OUT-OF-EYE METHOD) ..... 93 FIGURE 3-26 EX VIVO WETTABILITY FOR GROUPS VS SOLUTIONS (OUT-OF-EYE METHOD) ............... 94 FIGURE 3-27 EX VIVO WETTABILITY FOR GROUPS (OUT-OF-EYE METHOD)....................................... 94 FIGURE 3-28 EX VIVO WETTABILITY OVER TIME (OUT-OF-EYE METHOD) ......................................... 95 FIGURE 3-29 EX VIVO WETTABILITY FOR THE LENS CARE REGIMENS (OUT-OF-EYE METHOD) ........ 95 FIGURE 3-30 EX VIVO WETTABILITY FOR SOLUTIONS OVER TIME (RINSE METHOD).......................... 97 FIGURE 3-31 EX VIVO WETTABILITY FOR THE TWO GROUPS OVER TIME (RINSE METHOD)................ 98 FIGURE 3-32 EX VIVO WETTABILITY FOR GROUPS VS SOLUTIONS (RINSE METHOD) ......................... 98 FIGURE 3-33 EX VIVO WETTABILITY FOR GROUPS (RINSE METHOD) ................................................. 99 FIGURE 3-34 EX VIVO WETTABILITY OVER TIME (RINSE METHOD).................................................... 99 FIGURE 3-35 EX VIVO WETTABILITY FOR THE LENS CARE REGIMENS (RINSE METHOD)................. 100 FIGURE 3-36 EX VIVO WETTABILITY FOR SOLUTIONS OVER TIME (SOAK METHOD) ........................ 102 FIGURE 3-37 EX VIVO WETTABILITY FOR THE TWO GROUPS OVER TIME (SOAK METHOD) .............. 102 FIGURE 3-38 EX VIVO WETTABILITY FOR GROUPS VS SOLUTIONS (SOAK METHOD) ........................ 103 FIGURE 3-39 EX VIVO WETTABILITY FOR GROUPS (SOAK METHOD)................................................ 103 FIGURE 3-40 EX VIVO WETTABILITY OVER TIME (SOAK METHOD) .................................................. 104 FIGURE 3-41 EX VIVO WETTABILITY FOR THE LENS CARE REGIMENS (SOAK METHOD) ................. 104 FIGURE 3-42 EFFECT OF RINSE AND SOAK METHOD ON CONTACT ANGLES.................................. 105 FIGURE 3-43 PRELIMINARY PROTEIN ASSAY SILVER STAINING SYMPTOMATIC SAMPLE ............. 108 FIGURE 3-44 PRELIMINARY PROTEIN ASSAY SILVER STAINING ASYMPTOMATIC SAMPLE ........... 108 FIGURE 3-45 CYDYE2 STAINING FOR ALL GELS ............................................................................ 114 FIGURE 3-46 CYDYE3 STAINING FOR ALL GELS ............................................................................ 115 FIGURE 3-47 CYDYE5 STAINING FOR ALL GELS ............................................................................ 116 FIGURE 3-48 2D DIGE PROTEIN IDENTIFICATION ........................................................................... 120
1
Chapter 1 Introduction
1.1 Contact Lens History
Contact lenses, as we know them today, have been in use for just over half a century. A
large number of materials have been experimented with and the problems regarding each have
challenged manufacturers to produce more advanced and biocompatible devices. The origin of
these lenses dates back to the 1940’s, with the debut of perspex or polymethyl methacrylate
(PMMA). The major disadvantage of PMMA is that it was impermeable to oxygen and interferes
with corneal metabolism, due to the chronic hypoxia induced by the reduced oxygen supply. New
materials were needed that were permeable to oxygen and other gases, resulting in the development
of two new types of lens materials, one of which contained water (hydrogels) and one which was
water-free (gas permeable or GP materials). 4 The GP materials consisted of a combination of
PMMA and silicone or fluorine-based monomers, both of which greatly increased the transmission
of oxygen to the cornea. A benefit of these lenses was that the silicone/fluorine monomers were
chemically bound within the rigid lens matrix and thus cannot reorient themselves towards the
surface, resulting in a hydrophobic, lipophilic surface.5
Due to their initial discomfort and increased complexity when being fitted, softer, more
flexible hydrogel lenses have dominated the market since their development in the early 1970’s,
with over 90% of patients wearing this lens type.4 The dominance of hydrogels was primarily due
to their increased initial comfort and reduced sensation of dryness compared with GP lenses.
However, despite their success, an estimated 3 million wearers per year worldwide still “drop-out”
or cease lens wear due to irritation.6-11
The first hydrogel material was poly-2-hydroxyethyl methacrylate (pHEMA).12 Lenses
made from this material are cheap to manufacture and very consistent, due to the fact that changes
2
in temperature, pH and tonicity have relatively little effect on their water content, resulting in a lens
that is very stable to changes in their dimensions.13 Lenses based on this monomer are widely used
and are still extensively fitted today. The only disadvantage of this material is that it is still
relatively impermeable to oxygen when worn, which leads to various hypoxic conditions such as
slowing of mitosis, a reduced number of hemidesmosomes, as well as the occurrence of epithelial
microcysts.14
Oxygen transmission through contact lenses can be expressed by quoting a value based on
the amount of oxygen that gets though the thickness of the lens. This is referred to as the oxygen
transmissibility or “Dk/t” of the lens, with D representing the diffusion coefficient, or how fast
dissolved oxygen moves through a given material, k representing the constant of dissolved oxygen
molecules within the material and t the thickness of the lens in mm.
Manufacturers have developed variations of the polyHEMA material by adding other
monomers to polyHEMA, in an attempt to increase the water content and therefore increase the
amount of oxygen getting through to the cornea. The method by which this was initially achieved
was to add strongly hydrophilic monomers such as N-vinylpyrolidinone (NVP) and methacrylic
acid (MAA) to the matrix.15
The surface properties of these hydrogel materials and the way they interact with the tear
film is determined by the bulk properties of the lens, as well as the method by which it was created,
which is typically by cast molding or via a lathing technique.5 The choice of monomers used
depends on numerous factors, such as the stability and safety of the material as well as how it
interacts with the tear film. A highly important factor is the ionic charge of these monomers, which
directly affects the way the eventual lens material behaves on the eye. Materials consisting of
monomers that are relatively neutral in their charge tend to attract low amounts of protein from the
3
tear film, while those that are higher in charge attract materials of lower isoelectric point.5 Tear film
components that can be detected on hydrogel lenses include lactoferrin, albumin16-18 and
lysozyme.19-22
This family of polyHEMA-based materials is commonly referred to as “Conventional
Hydrogels” and the United States Food and Drug Administration (FDA) has developed a grading
system to differentiate them into one of four categories, based on their water content and charge
(Table 1-1). The classification of charge is determined by the amount of these hydrophilic
monomers (usually MAA) within the matrix, with >0.2% causing the surface of the material to
have a net negative charge.
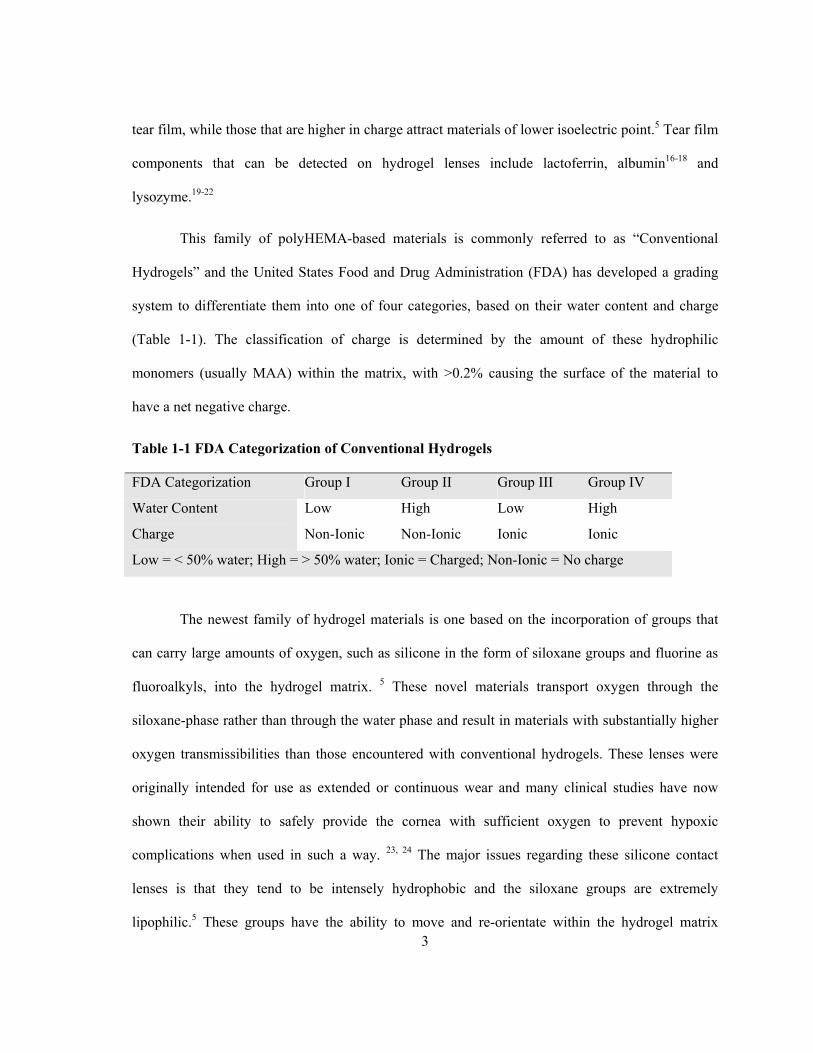
Table 1-1 FDA Categorization of Conventional Hydrogels
FDA Categorization Group I Group II Group III Group IV
Water Content Low High Low High
Charge Non-Ionic Non-Ionic Ionic Ionic
Low = < 50% water; High = > 50% water; Ionic = Charged; Non-Ionic = No charge
The newest family of hydrogel materials is one based on the incorporation of groups that
can carry large amounts of oxygen, such as silicone in the form of siloxane groups and fluorine as
fluoroalkyls, into the hydrogel matrix. 5 These novel materials transport oxygen through the
siloxane-phase rather than through the water phase and result in materials with substantially higher
oxygen transmissibilities than those encountered with conventional hydrogels. These lenses were
originally intended for use as extended or continuous wear and many clinical studies have now
shown their ability to safely provide the cornea with sufficient oxygen to prevent hypoxic
complications when used in such a way. 23, 24 The major issues regarding these silicone contact
lenses is that they tend to be intensely hydrophobic and the siloxane groups are extremely
lipophilic.5 These groups have the ability to move and re-orientate within the hydrogel matrix
4
(which they cannot do within RGP lens materials) and since air is fairly hydrophobic, these groups
orient themselves preferentially to the lens surface. Once these groups have moved to the surface of
the lens they cause numerous problems, such as disrupting the tear film and causing dry areas on
the lens, which may result in discomfort to the wearer, as well as causing a large amount of lipids to
be deposited onto the surface.25
The silicone within these lenses is bound in siloxane groups (–Si(CH3)2–O–) and these are
primarily intended to carry the oxygen to the cornea, while the traditional hydrogel elements
control the movement of fluids and prevent the lens binding to the cornea.5
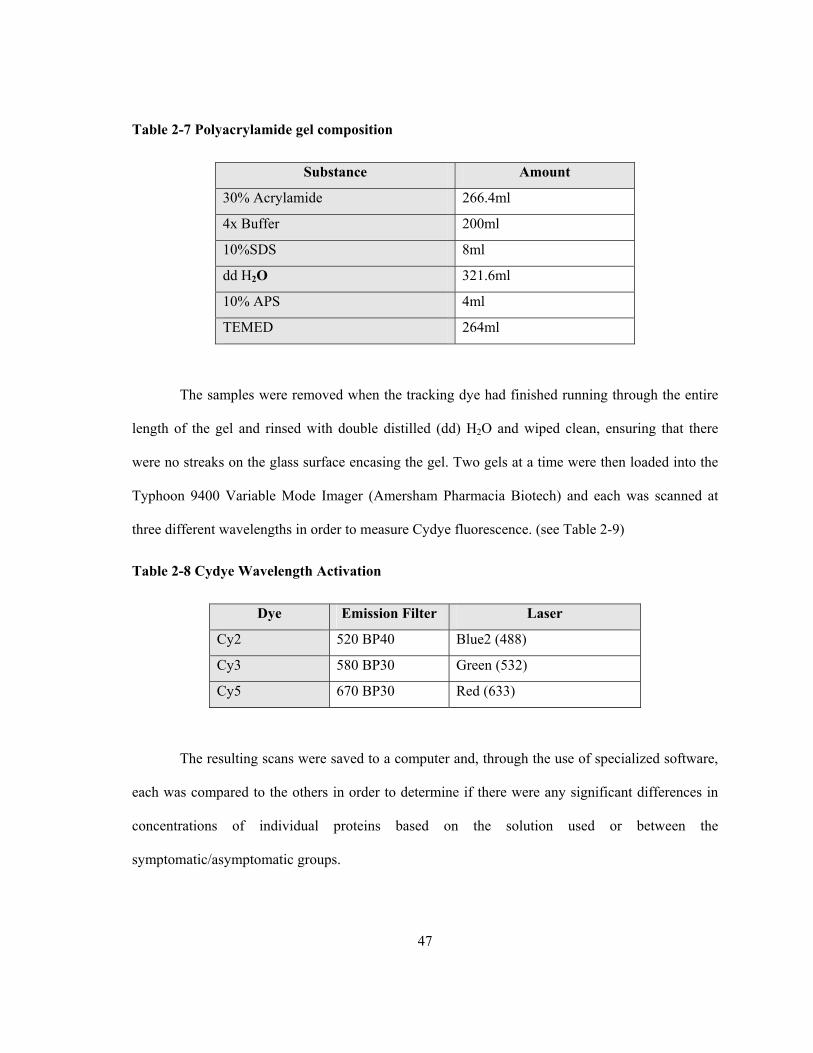
The other monomers included in silicone hydrogels are listed in Table 2-3. Through two
decades of research, manufacturers have finally been able to create a group of lens materials that
allow for greater oxygen transmissibility to the cornea, as well as more comfortable wear. At this
point, there are currently five different silicone-containing contact lenses available on the market,
each with its own specific characteristics (see Table 2-3).
To overcome the inherent hydrophobicity of siloxane lenses, companies have to modify the
surface of the lens material to “hide” the siloxane groups by using a variety of surface-treatment
strategies. One of the methods used is to place the lenses in a gas plasma reactive chamber to create
a “permanent, ultrathin, high refractive index, continuous hydrophilic surface”,15, 26, 27 as seen for
lotrafilcon A, in Figure 1-1. Another method used to modify the surface of the lens material is
found in the balafilcon A material, whereby the silicone components form silicate islands whose
hydrophilicity is meant to bridge over the fundamental hydrophobic nature of the silicone
material.27 This process aims to modify these groups in order to place more polar and wettable
groups at the surface and hide the hydrophobic components beneath. Both of these treatments can
be compared to the galyfilcon A material, which has no surface treatment.
5
Figure 1-1 Atomic force microscopy of various contact lens surfaces at area of 100μm2 28 (This
Figure was taken from Gonzalez-Meijome et al. Microscopic observation of unworn siloxane-hydrogel soft
contact lenses by atomic force microscopy. J Biomed Mater Res B Appl Biomater 2006; 76(2): 412-418.
Permission was granted to reproduce this figure from Dr. Gonzalez-Meijome and Wiley Publishers)
The two lens materials, Acuvue Advance and Acuvue OASYS have different durface
properties from the others because they have not been surface treated. However, they contain an
internal wetting agent named Hydraclear™, which is based upon polyvinyl-pyrrolidone (PVP), a
long chain, high molecular weight molecule. This wetting agent is slowly released from the lens
surface, “hiding” the silicone and creating a hydrophilic environment. It is considered highly
effective due to its ability to bind to water molecules and retain moisture.27
One of the main goals behind using this method to keep the lens wettable was to keep the
modulus or stiffness of the lens very low. Modulus is defined as the force per unit area required to
compress a material by a certain amount.29 The high volume of silicone in the other lenses, they
have a relatively high modulus, results in a greater lens awareness within the eye and a longer
period of time for adaptation.29 With a greater amount of water within the lens the goal is to create a
material that more closely resembles conventional hydrogel stiffness, ensuring a more comfortable
feel.
This new generation of contact lenses has been able to overcome the difficulties associated
with oxygen transmission; however there remains the issue of protein adsorption, and in what ways
6
this could potentially impact upon the comfort for the wearer. This issue shall be analyzed in an
upcoming section (Section 1.3).
1.2 Measuring Wettability
The majority of patients who cease lens wear do so because of problems relating to in-eye
compatibility, with discomfort and dryness being the principle reasons.6-11 Problems associated with
lens comfort may be inherently linked to wettability of the lens surfaces, as more wettable surfaces
may produce less interaction between the front surface of the lens and the back surface of the
eyelid.
Wettability may be determined either in-eye, by measuring the break-up time of the tears
over the lens surface,30, 31 or by using a variety of laboratory techniques that primarily determine the
“contact angle” of a fluid upon the lens surface.1-3, 32-35 When a fluid is placed on a given surface,
the degree to which it spreads dictates how hydrophilic or hydrophobic that material is to that given
liquid. As discussed earlier, when the contact lens surface has molecules that are hydrophilic or the
surface has been modified to be hydrophilic the resulting contact angles will be low. When a liquid
such as water is placed on an intensely hydrophobic surface such as silicone, it will not want to
spread at all, resulting in very high contact angles.
The goal of the experiments described in this thesis is to determine how these materials will
perform within the ocular environment. Within the eye, various elements will determine how they
function, most important being how the monomers on the surface react to being placed in a fluid
environment (eye closed) to that of a hydrophobic air environment (eye open). The monomers will
want to “flip back and forth”, exposing the side of the molecule that best interacts with the relative
environment it is in. This flipping, called chain rotation,34, 36 will ultimately determine how wettable
a lens material will be.
7
Holly et al.36 explained this chain rotation in their research in the 1970’s discussing the way
by which hydrophobic and hydrophilic parts of the hydrogel lens matrix will react to the
environment they are in. They state that the matrix of pHEMA hydrogels contains numerous
binding sites for water due to the hydroxyl groups within it, so that when this material is placed in
water there is sufficient energy from the interaction to overcome the hydrophobicity of the polymer
backbone. When the matrix of the gel is exposed to the air, in order to have the lowest surface free
energy, the polymer will orientate so that the hydrophobic side groups (non-polar parts of polymer
matrix) are in contact with the air interface, while the polar sites are buried into the aqueous phase
of the gel. This occurs because the molecular forces of the water molecules in the air interface are
much weaker than in the water interface. Therefore the lens surface appears hydrophobic regardless
of all the hydrophilic binding sites within the gel. When the lens in this configuration is then placed
in water the groups would re-orientate themselves, again to have the lowest surface free energy, so
that the hydrophobic sides are now buried into the matrix and the hydrophilic hydroxyl groups are
now exposed to the surface. This ability to ‘rotate’ within the gel matrix is an aspect of this
material’s surface structure which is very dynamic, as opposed to material the lenses made of
PMMA which have a surface that is locked in its conformation.36
When analyzing the wettability on the surface of these contact lenses, there are three
principle methods by which contact angles are determined on contact lens material:
The first method is the “Captive Bubble” technique. This method was used to determine the
surface free energy of filters for water management systems.35 This surface energy could affect the
way bacteria and proteins are adsorbed onto the filters and by looking at contact angles, which are
an aspect of that energy, they could determine how those proteins would adhere. When utilizing the
captive bubble method, Zhang et al.35 inverted the substance of interest into a beaker of highly
distilled water, and then very carefully expanded a bubble of air through a fine tube until it made
8
contact with the surface. As the bubble of air makes contact it spreads to varying degrees, based on
how hydrophobic or hydrophilic the material is. In terms of contact lens research, this process
involves placing an inverted lens into a solution and blowing a bubble of air onto its surface and
seeing what contact angles are formed between the bubble and lens surface. In these preliminary
experiments, pictures were taken of the bubble and surface and they were then analyzed to
determine the contact angle (Figure 1-2). The equation by which the angles are determined is called
the Young-Dupree equation, which is as follows: cos θ = (γSV - γSL)/ γLV. , where θ is the contact
angle and γ represents the interfacial tension or energy between two phases. (S = solid, L = liquid,
V = vapor)2 The value that was modified in the experiments of this thesis were the interfacial
tension between the solid and liquid, with the other values remaining constant.
9
Figure 1-2 Wettability – Example of the Captive Bubble Technique
Recent work using this method has been conducted by Cheng et al.2 who were interested in
the advancing and receding contact angles on two silicone hydrogel lenses, Purevision and Focus
Night and Day, as well as a conventional pHEMA lens, Acuvue. Advancing contact angles can be
described as the spreading of the liquid on the surface, or in the case of the captive bubble
technique, the removal of the bubble of air. The receding angle can be calculated when the bubble
is expanded onto the surface and pushes the liquid aside. The difference in angle between these two
measurements is called “hysteresis”. When there is no difference between the advancing and
receding contact angles and they approach angles of zero, hysteresis disappears and the lens is
considered completely wettable. These researchers record both of these angles because they
10
represent what happens within the eye during each blink cycle. As you close your eye, the
advancing tear film creates advancing angles as it pushes over dry spots on the lens surface, and as
the eye is opened dry spots begin to form which create receding contact angles. Through their use
of this method they found that all the lenses had results which indicated low receding angles,
however they all had very high advancing angles when placed in an isotonic solution. When tear
film proteins were added to the solutions, it was observed that the high contact angles were reduced
to near zero levels, indicating that there was a definite effect upon the lens surface. In this solution,
they were unable to discriminate between the various lenses, and therefore the surface treatments
each has. A major result of this study was their suggestion that protein adsorption on the lens is
perhaps not a bad thing, and might be necessary to keep a lens wettable.
This method of determining contact angles has its problems due to the difficulties involved
in accurately expanding and contracting the air bubble onto the surface of the lens.3 Since the lens
is constantly submerged in a liquid, it is also seen as somewhat inaccurate when compared to the
actual characteristics of a lens in the eye, which most of the time is exposed to the air between
blinks.
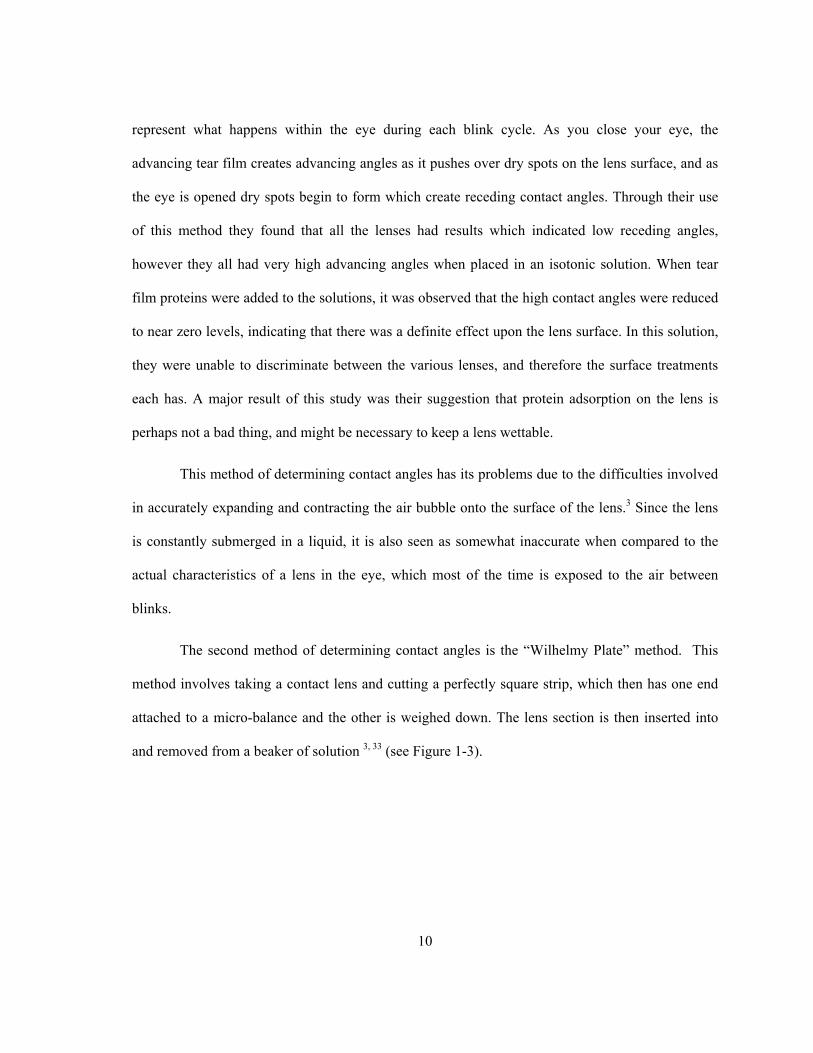
The second method of determining contact angles is the “Wilhelmy Plate” method. This
method involves taking a contact lens and cutting a perfectly square strip, which then has one end
attached to a micro-balance and the other is weighed down. The lens section is then inserted into
and removed from a beaker of solution 3, 33 (see Figure 1-3).
11
Figure 1-3 Wettability – Example of the Wilhelmy Plate Technique
As the lens is inserted and removed from the solution, readings of force are recorded using
a computer controlled device and these are then translated into contact angles, through the use of
the Young equation. This technique has been used by Tonge et al.34 who took Acuvue 2 lenses and
determined the advancing and receding angles after they had been soaked in various solutions. The
12
two solutions were saline based (control) and one that contained a surface active ingredient,
poloxamine 1107. The reason that this technique was used in this case is due to the fact that it is
more objective and does not rely on subjective assessment of an image and the consequent contact
angles that are derived from it.
Once again, this method aims to reproduce the effects that are seen within the eye, with the
advancing angle representing the closing of the lid and the receding angle that of it opening. The
primary goal of this study was to determine what effects lens wear had on contact angle assessment,
as well as looking at the impact of surfactants upon the measured results. It was determined that
lenses that were soaked in the surfactant had significantly lower advancing contact angles, and most
importantly, a greater degree of comfort.
In a recent study by Maldonado-Codina and Efron 3 the same technique was used, however,
it was slightly modified. As opposed to cutting the lens into a square strip, they use the whole lens
which is attached by suction to an arm that is held in place while a beaker of saline was raised until
contact is made and the forces involved in the advancing and receding solution are recorded. Titled
“Maximum Adherent Force (MAF) Method”, they looked at the differences that might exist
between various manufacturing methods, namely lathe-cutting, spin-casting and cast-moulding.
Another method they developed, again to investigate the differences between manufacturing
techniques, combines both the traditional Wilhelmy plate method along with the imaging of the
captive bubble method. Using a cut strip, the square piece of lens is lowered and removed from
solution, however as opposed to measuring the forces involved, pictures are taken and the angles
directly measured. They found that there was no significant difference between the various
manufacturing methods using both techniques.
13
There are downfalls to both of these procedures. For instance, with MAF the use of the
suction might change the shape of the lens as well the method used to remove the liquid that was on
the lens when removed from packaging may differ between trials. The photographic method suffers
from similar problems that all Wilhelmy plate analysis experiences, namely the difficulties
associated with cutting the lens into strips that are identical as well as the major concern of
dehydration while setting up the whole procedure. Considering these problems, this method was
also ruled out for use in this thesis.
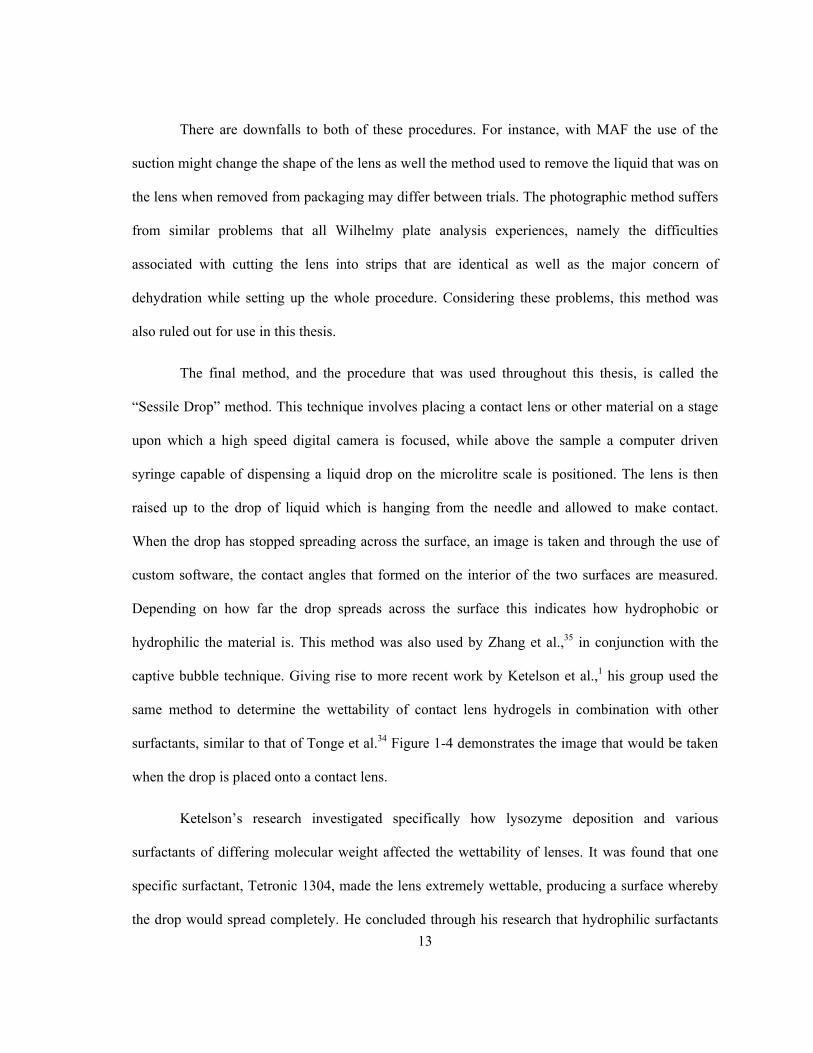
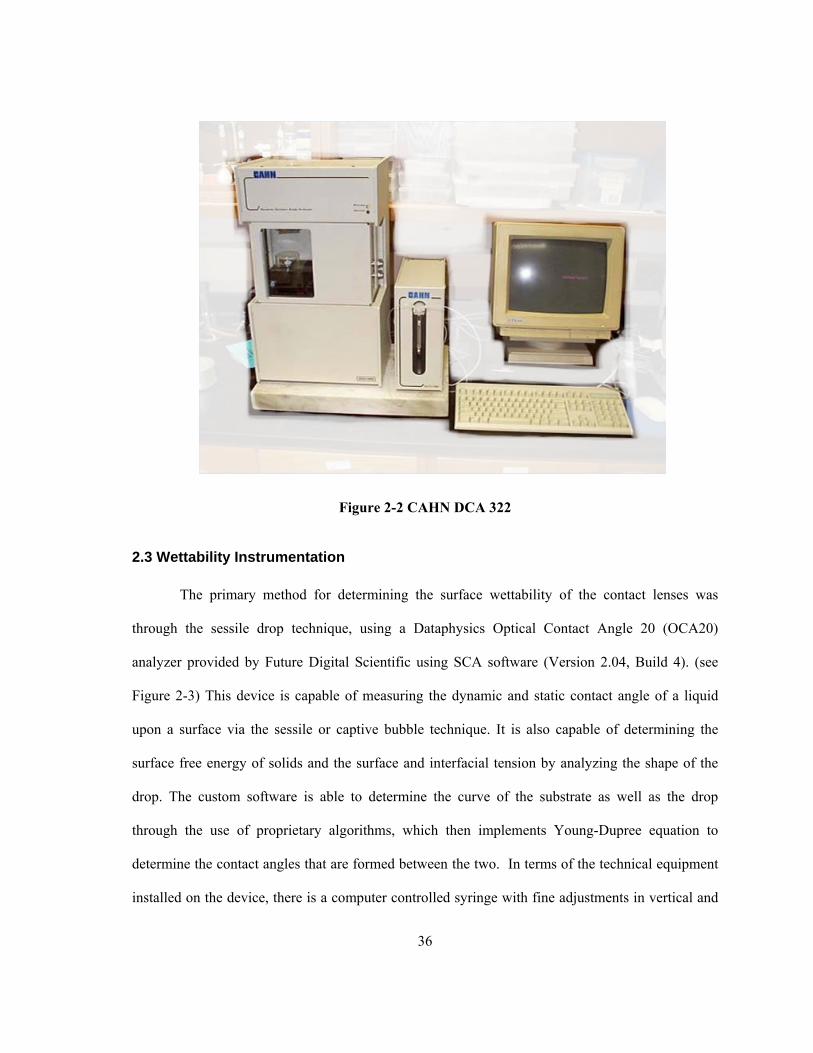
The final method, and the procedure that was used throughout this thesis, is called the
“Sessile Drop” method. This technique involves placing a contact lens or other material on a stage
upon which a high speed digital camera is focused, while above the sample a computer driven
syringe capable of dispensing a liquid drop on the microlitre scale is positioned. The lens is then
raised up to the drop of liquid which is hanging from the needle and allowed to make contact.
When the drop has stopped spreading across the surface, an image is taken and through the use of
custom software, the contact angles that formed on the interior of the two surfaces are measured.
Depending on how far the drop spreads across the surface this indicates how hydrophobic or
hydrophilic the material is. This method was also used by Zhang et al.,35 in conjunction with the
captive bubble technique. Giving rise to more recent work by Ketelson et al.,1 his group used the
same method to determine the wettability of contact lens hydrogels in combination with other
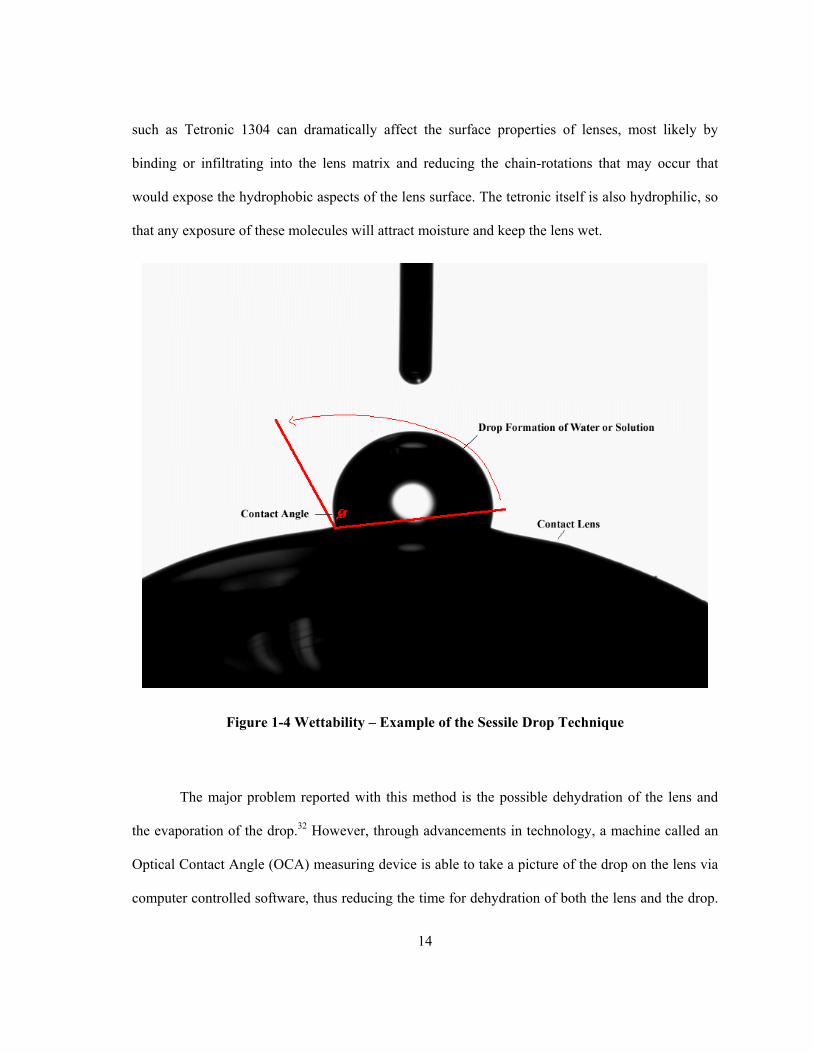
surfactants, similar to that of Tonge et al.34 Figure 1-4 demonstrates the image that would be taken
when the drop is placed onto a contact lens.
Ketelson’s research investigated specifically how lysozyme deposition and various
surfactants of differing molecular weight affected the wettability of lenses. It was found that one
specific surfactant, Tetronic 1304, made the lens extremely wettable, producing a surface whereby
the drop would spread completely. He concluded through his research that hydrophilic surfactants
14
such as Tetronic 1304 can dramatically affect the surface properties of lenses, most likely by
binding or infiltrating into the lens matrix and reducing the chain-rotations that may occur that
would expose the hydrophobic aspects of the lens surface. The tetronic itself is also hydrophilic, so
that any exposure of these molecules will attract moisture and keep the lens wet.
Figure 1-4 Wettability – Example of the Sessile Drop Technique
The major problem reported with this method is the possible dehydration of the lens and
the evaporation of the drop.32 However, through advancements in technology, a machine called an
Optical Contact Angle (OCA) measuring device is able to take a picture of the drop on the lens via
computer controlled software, thus reducing the time for dehydration of both the lens and the drop.
15
This machine is capable of both the sessile drop method and captive bubble; however all the
experiments in this thesis used the sessile drop method, because it was deemed to most closely
replicate the effects of a lens in the eye, as well as having the fewest possible complications.
The sessile drop method can report both advancing and receding angles of the drop, and
throughout the work of this thesis, the advancing angle is that which is reported. This is because the
advancing angle represents the movement of the inner surface of the eyelid as it moves over the
front surface of the contact lens. If the contact lens is wettable then the eyelid should move
smoothly over the surface and reduce any discomfort that would be felt if the eyelid had to move
over a non-wettable surface. The receding angle is seen when liquid is removed from the lens
surface, which in essence describes what is happening when the eye lid opens and how it slides
over the contact lens. Since the lens at this point is covered by the tear film, when the eyelid opens
there is minimal friction that would occur, causing no discomfort, which is the major problem
regarding contact lens wear.
All three methods have various advantages and disadvantages. However, as stated
previously, the sessile drop method was chosen for the research conducted in this thesis. It was
found that this technique most closely represents in-eye contact lens wear and the primary
drawbacks of dehydration are no longer an issue, in part due to the speed at which the lens can be
removed and tested.
1.3 Contact Lens Care Solutions
The most important factor for any care solution is how well it disinfects the lens and
prevents any buildup of bacteria, fungus and viruses. All the solutions that were used in this study,
which are aimed at eradicating these pathogens, are listed in section 2.2. Numerous studies have
been published indicating the efficacy of solutions against certain types of bacterial infections, such
16
as the most recently released product, ReNu MoistureLoc.37 Due to an epidemiological outbreak of
fungal keratitus related to the same solution it has since been removed from the market.38, 39 Fungal
keratitus is an infection that gains access to the corneal stroma through a defect in the epithelium
which then multiplies and causes necrosis of the tissue and an inflammatory response. This
infection can be very difficult to treat and may result in severe visual loss or even loss of the eye.40-
42
Many solutions have been tested in vivo and in vitro for efficacy in cleaning, with certain
regimens performing better or causing less complications. In a very recent study by Lievens et al.,43
they compared Complete Moisture Plus, ReNu MultiPlus and OptiFree Express and looked for
adverse clinical conditions that may have resulted in the cessation of use of the specific product
(drop-out). They reported that ReNu MultiPlus, when used frequently, may have contributed to
higher drop-outs, as compared to the other two solutions, due to corneal staining and a reduced tear
break up time. Abnormal tear break-up time is when a break in the film occurs in less than 10
seconds as measured by a fluorescein is staining.44, 45 This is important to contact lens wearers
because as mentioned previously, as the tear film breaks up it represents the receding angle on the
lens. When the lens is dry, the posterior surface of the upper eye lid has to move over this dry
surface which might be a cause of discomfort.
Solutions that are dispensed within Canada must follow strict regulations regarding the
medicinal ingredients that are used and the concentrations at which they can be found, as shown in
Table 1-2.
17
Table 1-2 Medicinal Ingredients of Contact Lens Care Solutions46
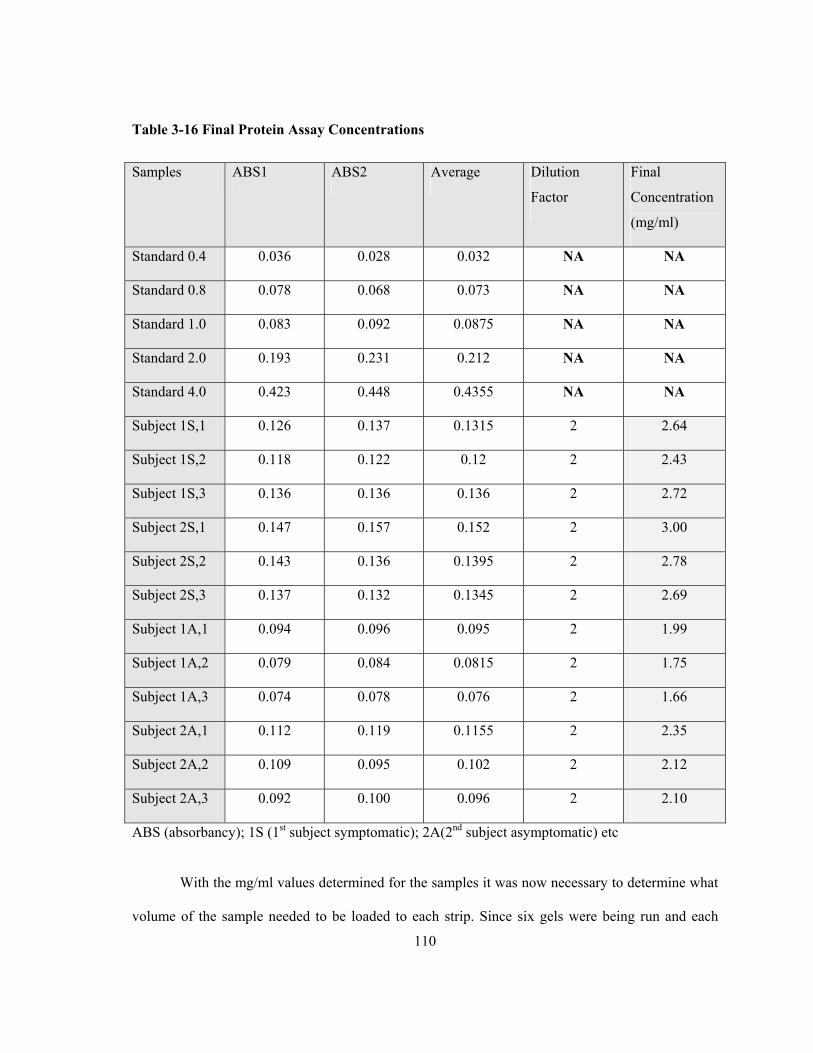
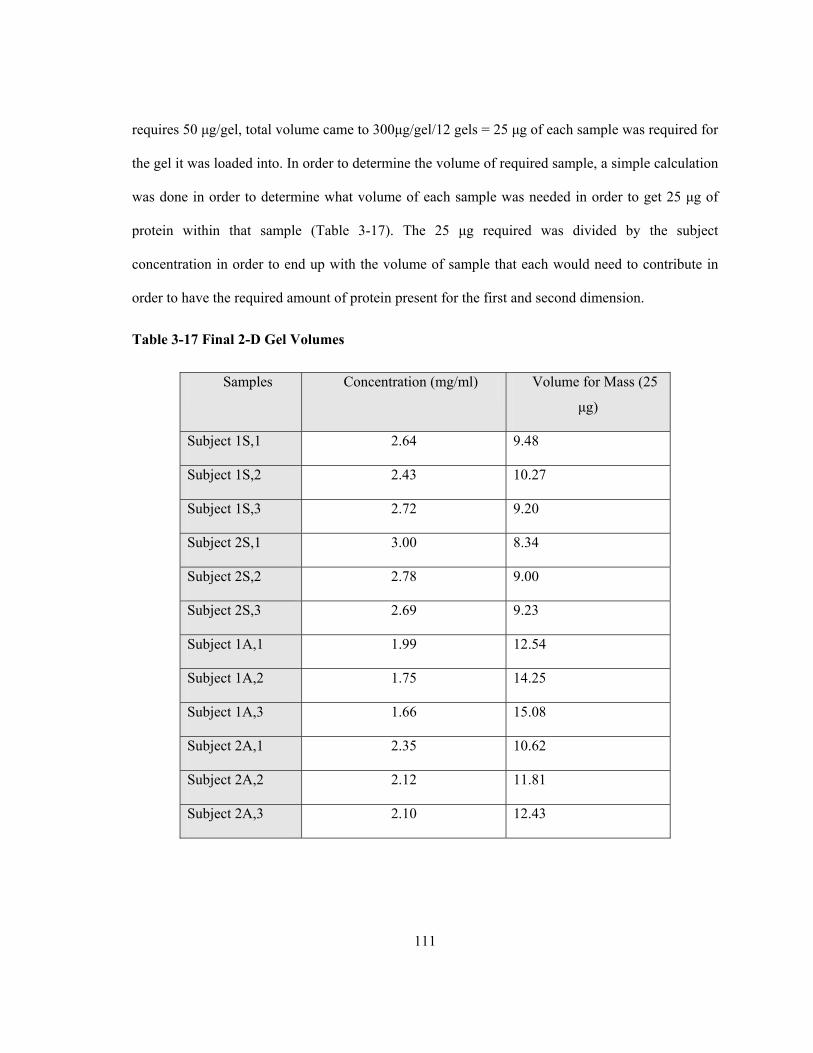
With the mg/ml values determined for the samples it was now necessary to determine what
volume of the sample needed to be loaded to each strip. Since six gels were being run and each
111
requires 50 μg/gel, total volume came to 300μg/gel/12 gels = 25 μg of each sample was required for
the gel it was loaded into. In order to determine the volume of required sample, a simple calculation
was done in order to determine what volume of each sample was needed in order to get 25 μg of
protein within that sample (Table 3-17). The 25 μg required was divided by the subject
concentration in order to end up with the volume of sample that each would need to contribute in
order to have the required amount of protein present for the first and second dimension.
Table 3-17 Final 2-D Gel Volumes
Samples Concentration (mg/ml) Volume for Mass (25
μg)
Subject 1S,1 2.64 9.48
Subject 1S,2 2.43 10.27
Subject 1S,3 2.72 9.20
Subject 2S,1 3.00 8.34
Subject 2S,2 2.78 9.00
Subject 2S,3 2.69 9.23
Subject 1A,1 1.99 12.54
Subject 1A,2 1.75 14.25
Subject 1A,3 1.66 15.08
Subject 2A,1 2.35 10.62
Subject 2A,2 2.12 11.81
Subject 2A,3 2.10 12.43
112
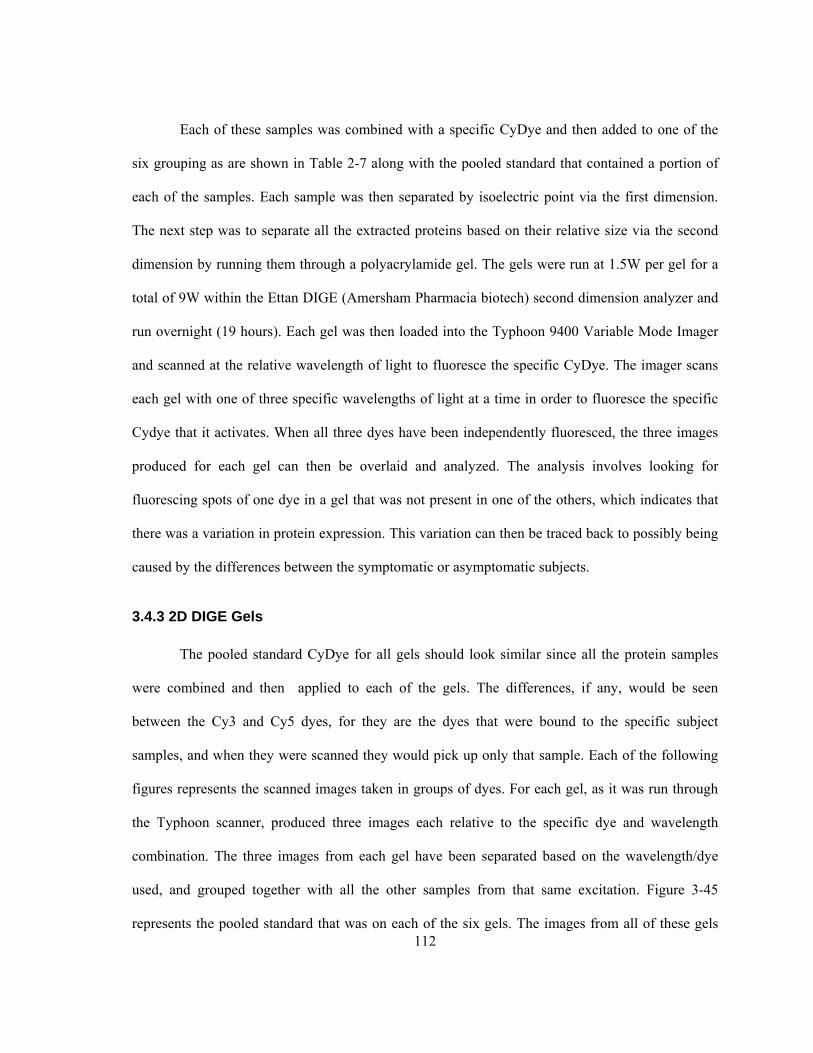
Each of these samples was combined with a specific CyDye and then added to one of the
six grouping as are shown in Table 2-7 along with the pooled standard that contained a portion of
each of the samples. Each sample was then separated by isoelectric point via the first dimension.
The next step was to separate all the extracted proteins based on their relative size via the second
dimension by running them through a polyacrylamide gel. The gels were run at 1.5W per gel for a
total of 9W within the Ettan DIGE (Amersham Pharmacia biotech) second dimension analyzer and
run overnight (19 hours). Each gel was then loaded into the Typhoon 9400 Variable Mode Imager
and scanned at the relative wavelength of light to fluoresce the specific CyDye. The imager scans
each gel with one of three specific wavelengths of light at a time in order to fluoresce the specific
Cydye that it activates. When all three dyes have been independently fluoresced, the three images
produced for each gel can then be overlaid and analyzed. The analysis involves looking for
fluorescing spots of one dye in a gel that was not present in one of the others, which indicates that
there was a variation in protein expression. This variation can then be traced back to possibly being
caused by the differences between the symptomatic or asymptomatic subjects.
3.4.3 2D DIGE Gels
The pooled standard CyDye for all gels should look similar since all the protein samples
were combined and then applied to each of the gels. The differences, if any, would be seen
between the Cy3 and Cy5 dyes, for they are the dyes that were bound to the specific subject
samples, and when they were scanned they would pick up only that sample. Each of the following
figures represents the scanned images taken in groups of dyes. For each gel, as it was run through
the Typhoon scanner, produced three images each relative to the specific dye and wavelength
combination. The three images from each gel have been separated based on the wavelength/dye
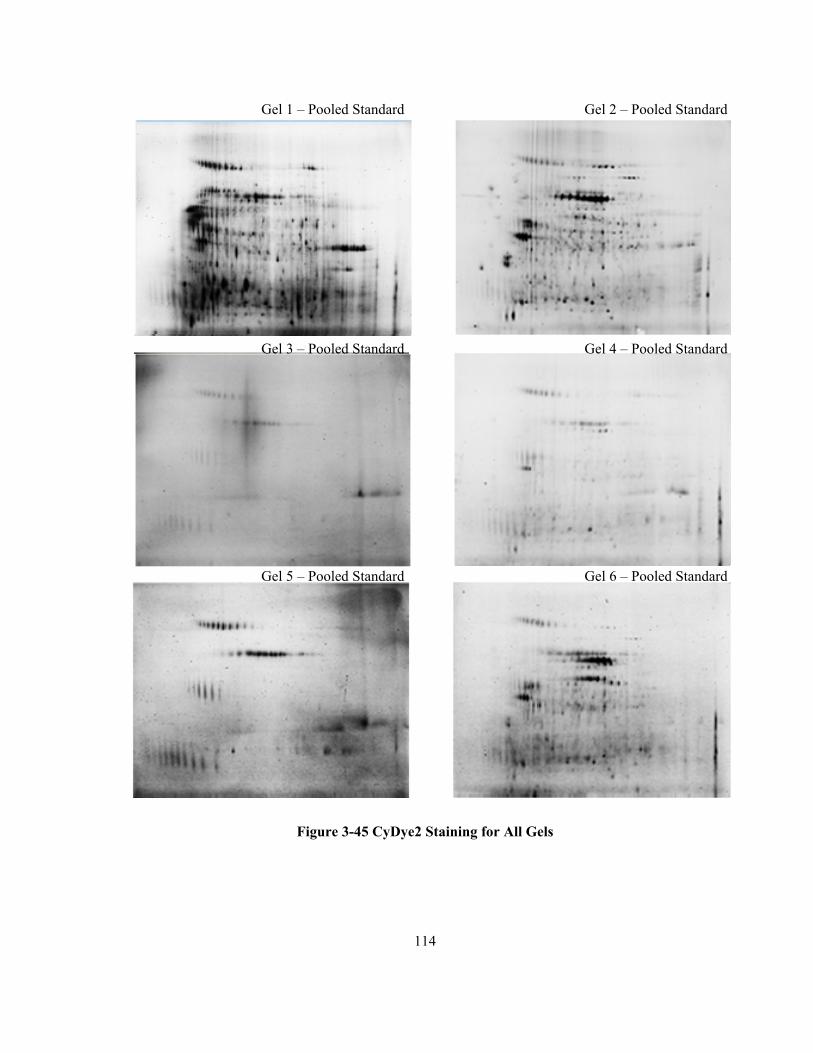
used, and grouped together with all the other samples from that same excitation. Figure 3-45
represents the pooled standard that was on each of the six gels. The images from all of these gels
113
should be the same because it was the same sample that was applied to all of them. Figure 3-46
represents all the scans for the Cydye3 within all six gels, while 3-47 represents all the scans that
were taken for the Cydye5 within all of the gels.
114
Gel 1 – Pooled Standard Gel 2 – Pooled Standard
Gel 3 – Pooled Standard Gel 4 – Pooled Standard
Gel 5 – Pooled Standard Gel 6 – Pooled Standard
Figure 3-45 CyDye2 Staining for All Gels
115
Gel 2 – Subject 1A, 2Gel 1 – Subject 2S, 1
Gel 4 – Subject 2A, 1 Gel 3 – Subject 2S, 3
Gel 6 – Subject 2A, 3 Gel 5 – Subject 1S, 2
Figure 3-46 CyDye3 Staining for All Gels
116
Gel 1 – Subject 1A, 1 Gel 2 – Subject 2S, 2
Gel 3 – Subject 1A, 3 Gel 4 – Subject 1S, 1
Anomaly
Gel 6 – Subject 1S, 3Gel 5 – Subject 2A, 2
Figure 3-47 CyDye5 Staining for All Gels
117
The images were then compared using the program Imagemaster and DeCyder, which ran
algorithms to match up the relative spots to their counterparts on the other gels. The software was
able to pick up spots too faint for the human eye to detect and indicate whether or not the match
was statistically significant. The spots that were found were then double checked by a technician to
ensure that the significance was not occurring from a speck of dust that happens to be in the same
relative place. One image that was found to be completely different from all others was that of
subject 1S in combination with the CyDye5 scan. The possible reason this occurred may be due to
improper loading technique or contamination, which would cause the overexpression seen.
However it is possible an insufficient mixing and binding of the dye to the proteins within the
sample might have also been a problem.
The first comparison that was looked at was between the symptomatic and asymptomatic
groups, and whether or not there were any statistically significant differences in protein volume
found. Through the use of the inherent ANOVA analysis of the program, it was shown that there
were no statistically significant points between either the symptomatic or asymptomatic groups (all
spots p>0.1).
However, qualitatively there seems to be two different types of gels that occurred both
within and between the symptomatic and asymptomatic groups as is seen between 1A3Cy3 and
1S2Cy3 as compared to 2S1Cy3 and 2S3Cy3 The two former gels look similar even though they
are from the different groups while the two latter groups look similar, but different from the first
two. This may be a result of certain epithelial cells that may have adhered to the lens or possibly
bacterial/fungal cells that might be present from an infection. Since these similarities were seen in
both the symptomatic and asymptomatic groups, when all the data for each group was combined it
might explain why no statistically significant difference was found.
118
When comparing between the solutions more proteins were found to be statistically
significant. The computer algorithm compared the gels of all three solutions, which found 27 spots
that were significant (p<0.005). However when they were visually inspected it was determined that
they were either flecks of dust on the glass or the computer made an incorrect position match
between proteins on the different gels. The computer will attempt to match proteins based on the
expression profile caused by the laser excitation on numerous gels, however it is still no perfect and
will match proteins that are obviously not the same when visually inspected. All the protein values
thought to be significant turned out to be false positives. Due to there being no significant
differences between the gels, it was decided that mass spectroscopy would not be used and a purely
qualitative comparison would be conducted on previous tear film papers. Mass spectroscopy is very
effective in determining the exact type of protein that is within a gel, and is especially powerful
when one protein is expressed in one sample while another is not. Since there was no significant
difference in protein expression found between the symptomatic or asymptomatic group, or
between the three solutions the idea of running a mass spectroscopy experiment was deemed not
worthwhile. For comparison purposes, the gel with the best resolution was used to exemplify the
proteins extracted from the contact lenses, even though all gels expressed the same proteins.
3.4.4 Protein Identification
The identification of the tear film proteins that were extracted from the contact lenses were
compared to the work of Molloy et al72 and Herber et al70 and numerous proteins were found to be
similar. These are laid out in Table 3-19. The proteins labeled 1-4 in Figure 3-48 represent von
Ebner’s gland tear protein, otherwise known as lipocalin. Just below these spots are 5-7, which are
separated by a dark horizontal band, are different isoforms of the same protein however these are
119
based on size. The separation that occurs on the horizontal gradient was due to the various charges
of the same protein. The proteins that are marked 8-11 were also present in the Molloy et al study.72
However, they were unable to identify them within the SWISS-PROT protein database, and they
were not found within other articles that were looked at. Proteins 12-15 were found to be the
various charges of zinc-α-2-glycoprotein while the large spot at the bottom of the gel labeled 16,
which is similar to human mammaglobin, however with all qualitative comparisons it is difficult to
say for sure whether it was or not. Spot 17 has similar abundances and charge as that of crystatin
SN as identified by the SWISS-PROT accession number72, and the very dark spot to the right of it,
19, was lysozyme. At the top of the gel are two horizontal bands with no real distinction in charges
across the gradient. The protein that has the upper band, spot 18, was lactoferrin while the bottom
streak (20) has not yet been identified, even though there was a large portion of protein present
within this area.
120
Figure 3-48 2D Dige Protein Identification
121
Table 3-18 Contact Lens Tear Film Proteins as compared to Molloy et al. (SWISS-PROT)72
Spot Number Protein Identification (SWISS PROT, Molloy et al.)
1/2/3/4 von Ebner’s Gland Tear Protein (lipocalin)
5/6/7 N-terminally Processed Lipocalin
8/9/10/11 No significant Homology
12/13/14/15 Zinc-α-2-Glycoprotein
16 Similarity to Human Mammaglobin
17 Crystatin SN
18 Lactoferrin
19 Lysozyme
20 No Significant Homology
122
Chapter 4
Summary and Further Work
The overall goal of this research was to examine modern day contact lenses and attempt to
clarify some of the factors that impact contact lens wettability and potentially comfort.
4.1 In Vitro Wettability Studies
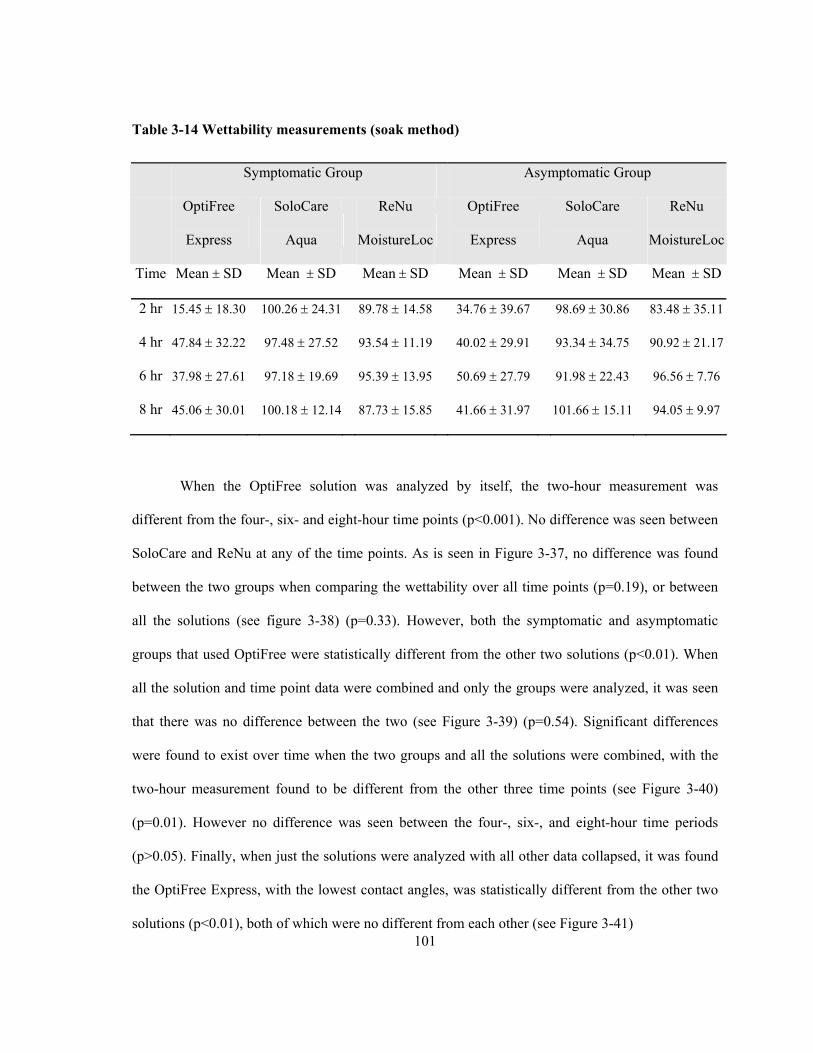
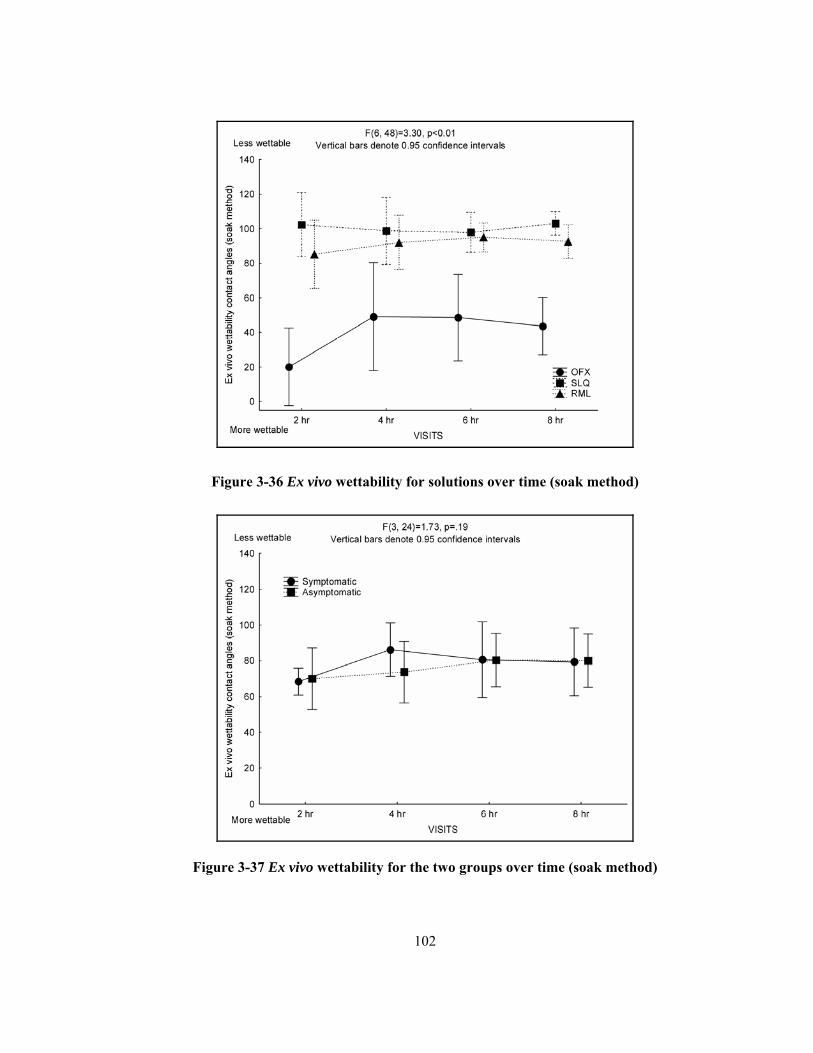
The first studies undertaken were conducted to determine how long a lens should be soaked
for the relative surface active agents within the contact lens solutions to adequately bind to the lens
surface. The two lens types (pHEMA and siloxane-based) were soaked for 12, 24 or 48 hours. The
wettability of the silicone hydrogel material (lotrafilcon B; O2 Optix) when soaked in ReNu
MoistureLoc did not vary based upon the three soak times. It was seen that the shortest soaking
time was sufficient for the lens to become maximally wettable and that longer soak times did not
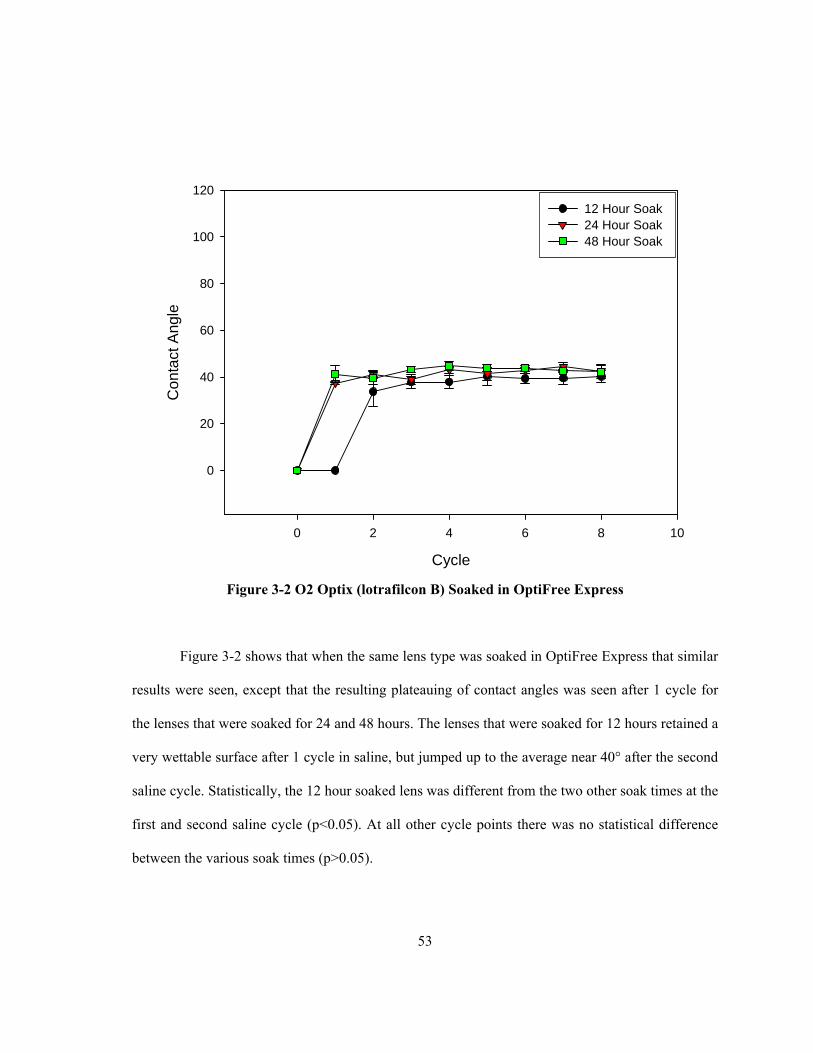
improve the wettability. Similar results were found for lotrafilcon B lenses soaked in OptiFree
Express.
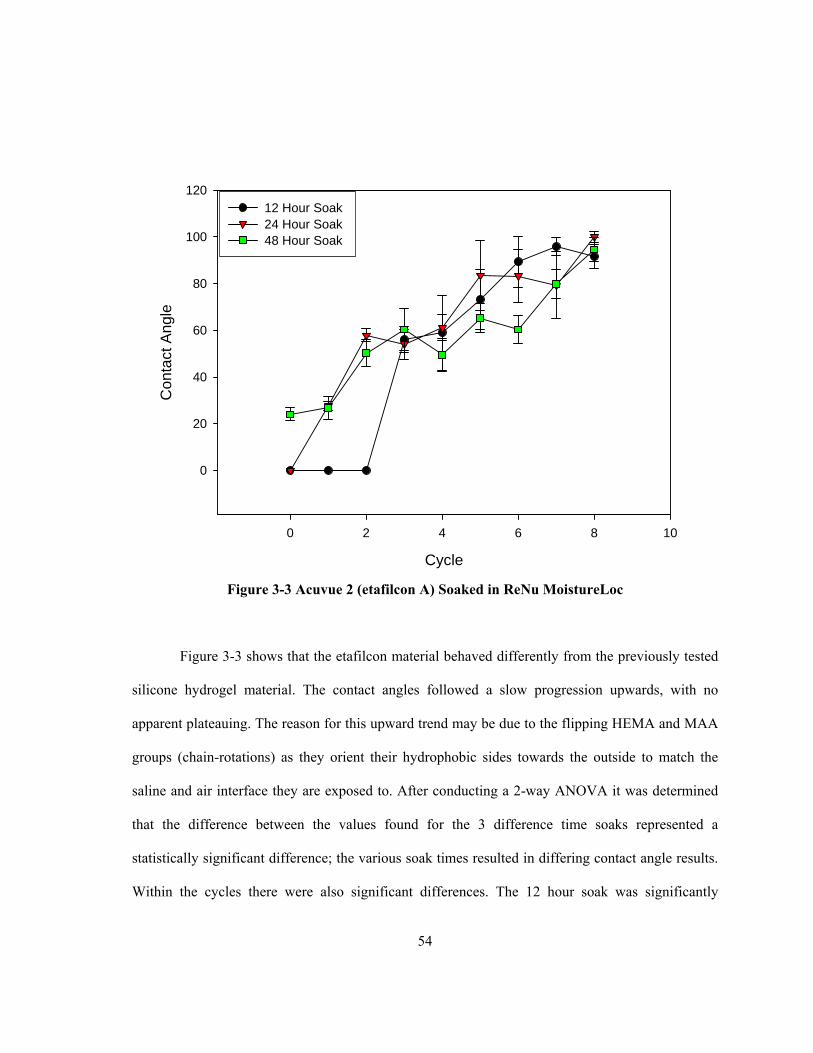
When the polyHEMA-based material (etafilcon A; Acuvue 2) was soaked in ReNu
MoistureLoc there were significant differences between soak times, even though no “formal
pattern” could be established. The 12 hour soak time had the lowest contact angles at the beginning
of the cycling period, and this was potentially due to the surfactants present within the blister pack
not being completely rinsed off the lens in the short period of soaking time, while the 24 and 48
hour time periods allow for the blister solution to be rinsed away. The most significant of the results
seen in this experiment was that the etafilcon material soaked in OptiFree Express exhibited contact
angles with all three soak times of 0° through all subsequent saline cycling. It was apparent that the
surface active agents within OptiFree Express most probably bound tenaciously to the etafilcon
123
surface and were unable to be removed by saline cycling. 1 This was not the case with the ReNu
MoistureLoc care system, where the surfactants may have only adhered for short periods of time.
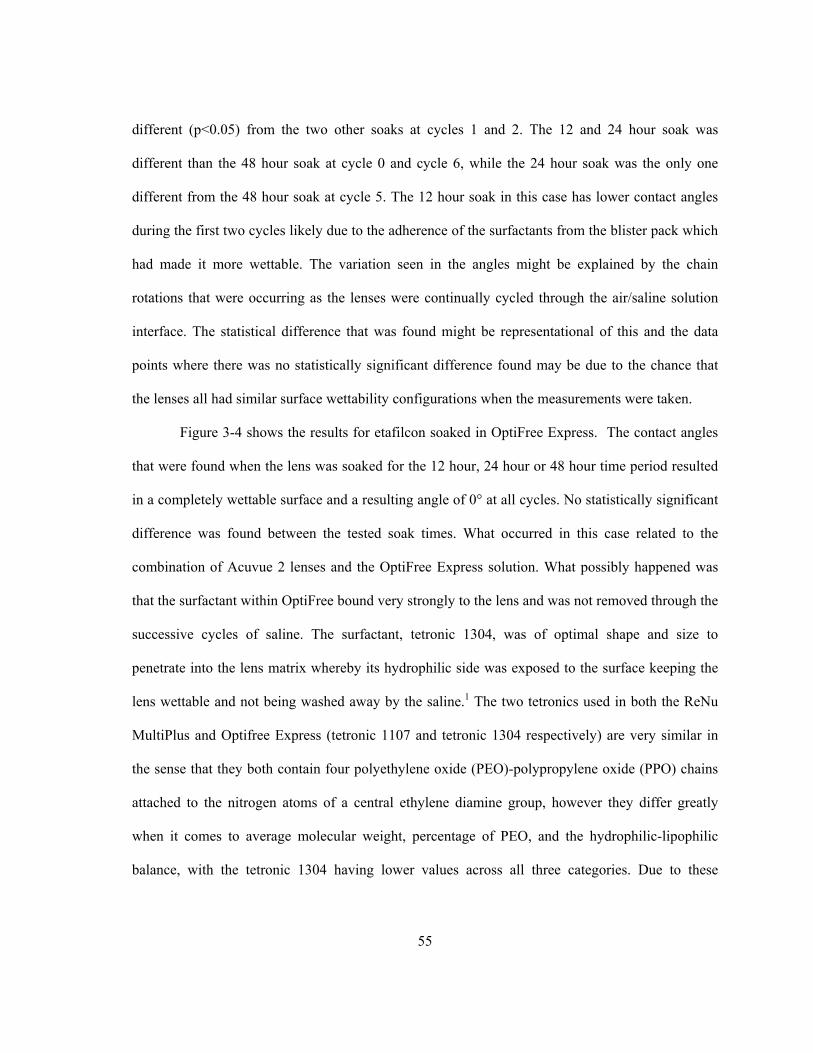
The next step of these in vitro experiments was to investigate the influence of a saline pre-
wash on lens wettability, to determine if packaging solutions had an effect on the subsequent
wettability measured. Lenses soaked in OptiFree Express had contact angles of 0° through all
cycles, regardless of the pre-cycling of the lenses. However, lenses soaked overnight in SoloCare
Aqua did display higher contact angles when previously soaked in saline. It would appear that
improved wettability offered by the blister pack solution was removed by the saline soak and thus
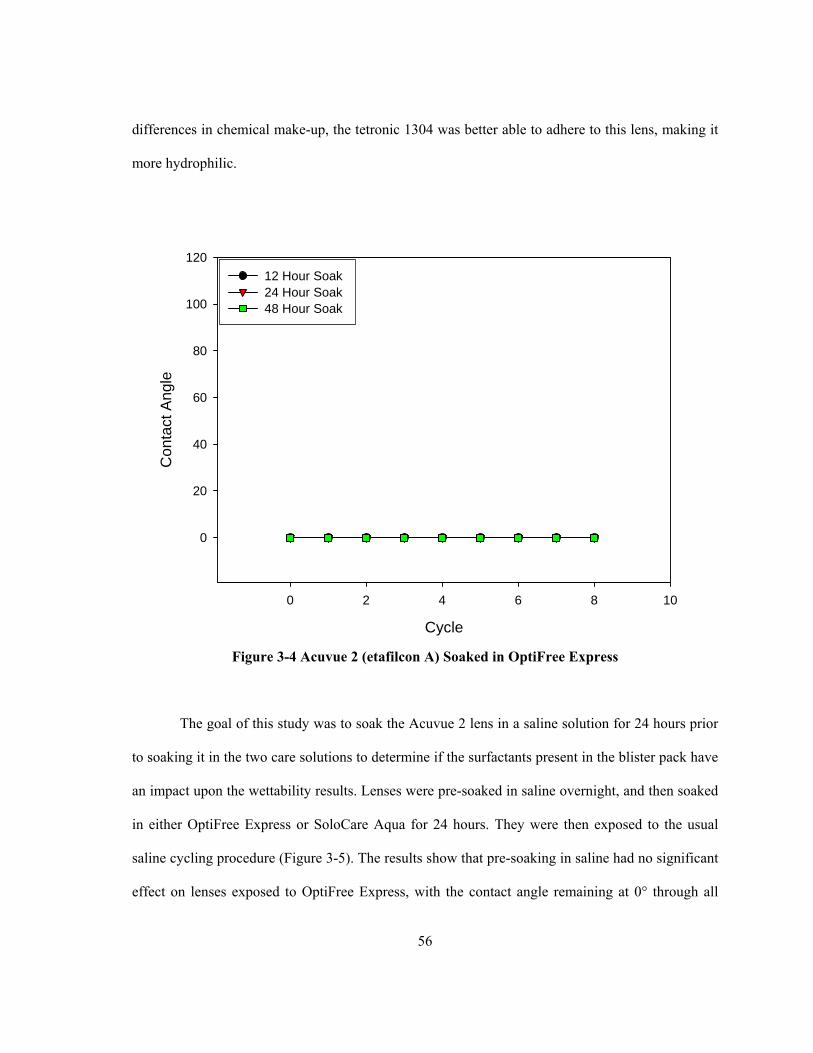
for some care regimens the lens packaging solution may be advantageous on the first day of wear.
Subsequent in vitro studies investigated the wettability of numerous contact lenses directly
from their packaging solutions, as well as after soaking in various care solutions. The first group of
pHEMA-based lens materials to be analyzed was the daily disposable lenses. The two major trends
seen were the constant rising or plateauing of contact angles, as seen in Figure 3-6. The two FDA
group II lenses tended to exhibit contact angles at approximately 65°, while the two FDA group IV
lenses continued rising though the last saline cycle. The difference between these two lenses was
that group II lenses have no charge (non-ionic), while the group IV lenses are charged (ionic). The
interaction between the saline and the charged surface caused a further dewetting of the lens, which
did not occur with the group II lenses. One possible explanation for this is the chain rotations that
occur within the Type IV lenses which continue to re-orientate themselves possibly due to the
charge within the lens itself from the MAA. As the lens was continually cycled these groups
continue to flip their hydrophobic ends towards the surface of the lens, which was seen as less
spreading of the drop from the OCA, in turn leading to successively higher contact angles. The
group II lenses with no charge might simply be losing whatever surfactant had adhered to the
124
surface of the lens, at which point they plateau since there was no major rotating of the polymers
within the matrix.
When investigating the silicone hydrogel lenses directly out of the pack, two important
trends were seen. The first was that the only lens that had a highly wettable surface was the
galyfilcon material (Acuvue Advance). This possibly occurs because of the surfactants within the
blister pack, which remain on the lens for the initial contact angle assessment. However, these were
rapidly washed away after one cycle in saline (see Figure 3-7). The second important trend was the
separation of the groups of lenses into those that are above 100° and those that hover near 60°. The
three lens types that have the higher contact angles either have no surface treatment (galyfilcon A
and senofilcon A) or a surface treatment that leaves a large amount of silicone still exposed
(balafilcon A), which might be repelling any water placed on its surface. The other two lenses
(lotrafilcon A and lotrafilcon B) have a plasma surface treatment that completely hides the silicone
undersurface, which in turns results in lower contact angles.
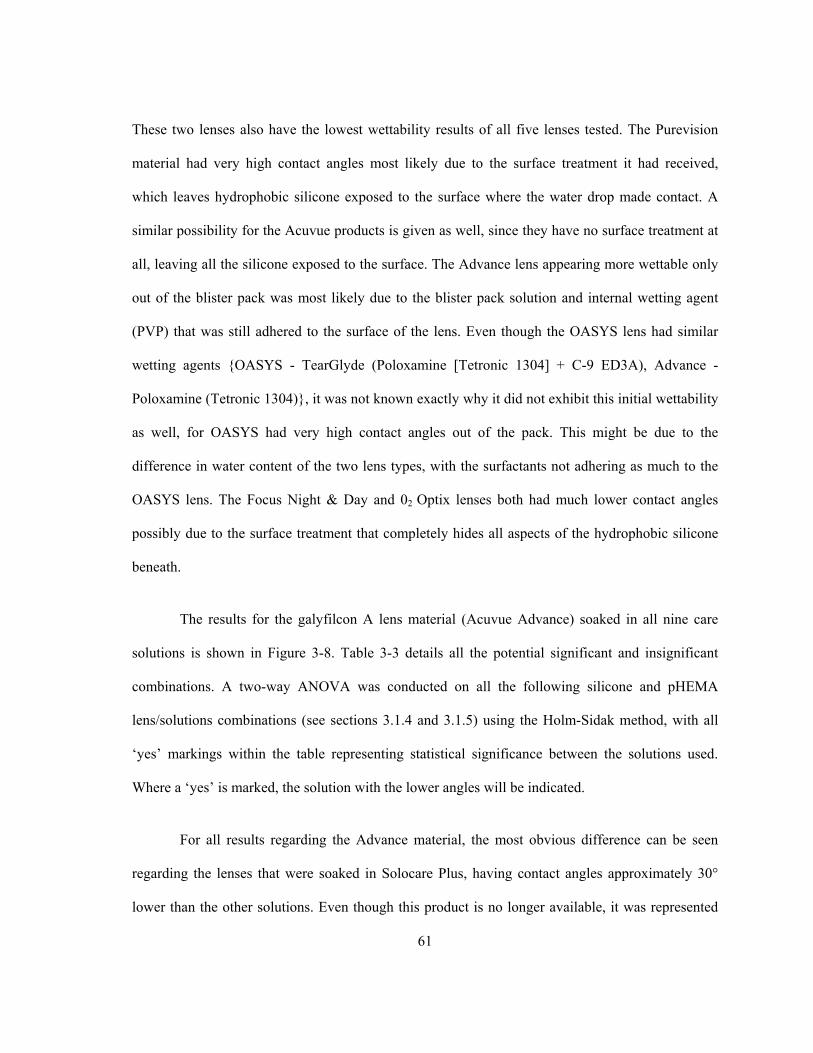
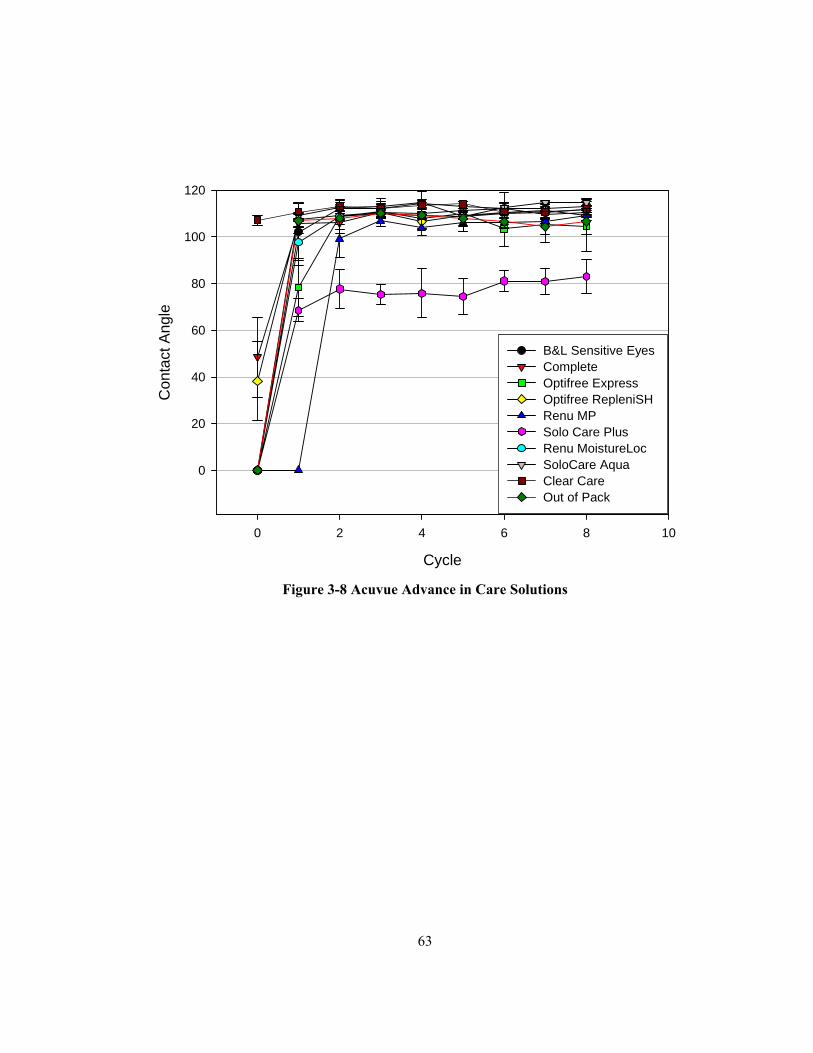
Examining the results seen when the galyfilcon material (Acuvue Advance) was soaked in
all solutions, the most interesting result comes from the SoloCare Plus solution, which gives a
lower contact angle than all other products (see Figure 3-8). Even though this solution was no
longer on the market it shows that these silicone hydrogel materials can be manipulated and
changed to produce a lower contact angle. A similar result was also seen for the senofilcon (Acuvue
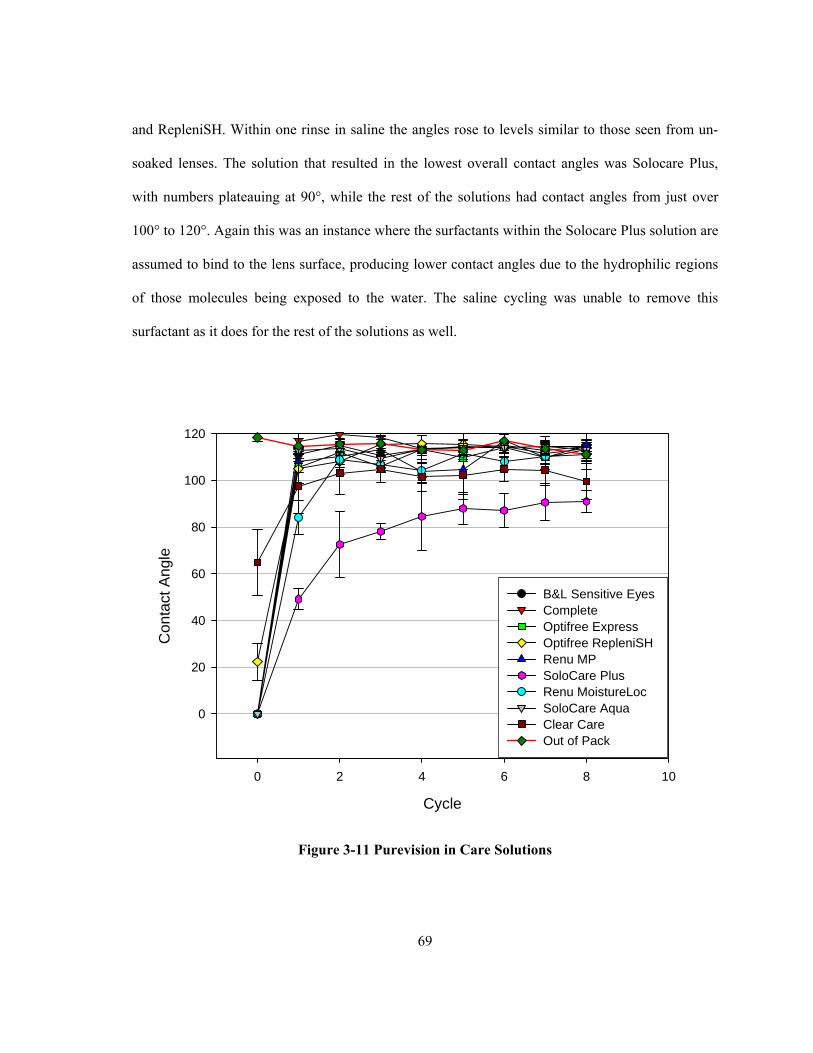
Oasys) and balafilcon (Purevision) lenses (see Figures 3-11 and 3-12).
Lotrafilcon A (Focus Night and Day) and lotrafilcon B (O2 Optix) exhibited similar results
to each other (they have identical surface treatments) but very differing results to the other silicone
hydrogels, due to their unique surface treatment. ReNu MoistureLoc gave the lowest contact angles
for the lotrafilcon A material, while lower contact angles were found for lotrafilcon B with
125
OptiFree and ClearCare. Even though the lenses have the same surface treatment, they differ in
their water content, with the lotrafilcon B material having 33% and lotrafilcon A having 24%. The
various surfactants within each of the solutions are most likely penetrating differently into each of
the lenses due to this difference in water content, resulting in different contact angles.
The most important aspect of this component was that most of the solutions managed to
reduce the initial contact angle. Even though the substantivity was not very long lasting, it still
demonstrates that various solutions can make the lens more wettable for initial insertion, which
may make them more comfortable. However, further work on the influence of presoaking lenses in
various solutions or packaging solutions is warranted.
The final group of lenses examined in these in vitro studies was the multi-use pHEMA-
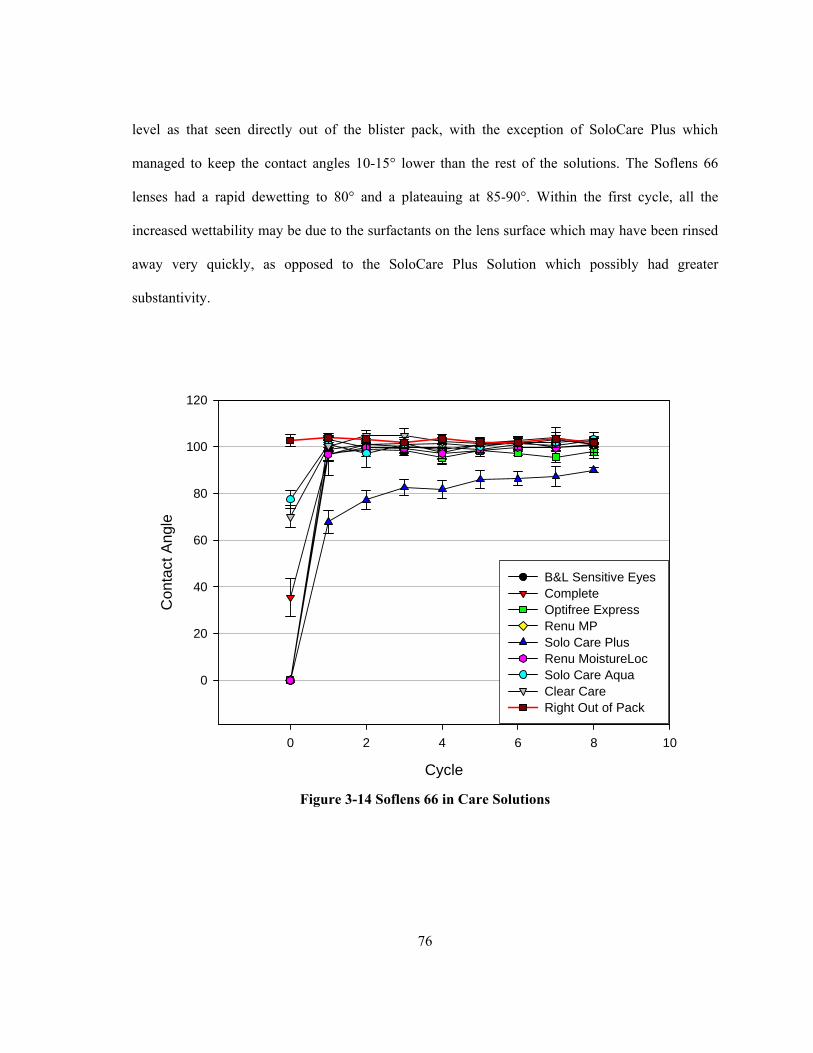
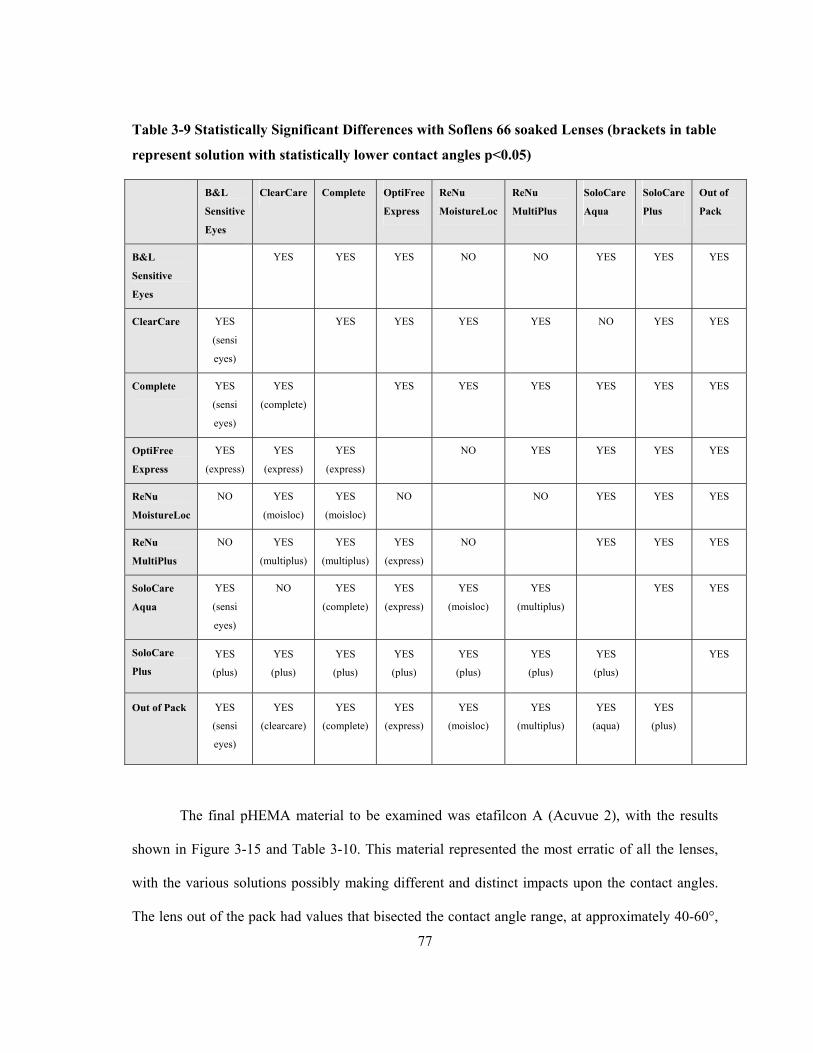
based materials. Two of these lens materials (omafilcon; Proclear and alphafilcon; Soflens 66)
behaved very similarly to the lenses tested previously, with the SoloCare Plus solution once again
having the greatest impact upon the wettability. The third lens material (etafilcon; Acuvue 2)
demonstrated an unusual and highly specific interaction between its polymer surface and the
surface active agents within one solution. When soaked for even short periods of time in OptiFree
Express, the surface becomes highly wettable and the surfactants within OptiFree Express cannot
easily be removed, despite soaking for many saline cycles (Figure 3-15).
One important aspect regarding all the lens materials, and it was especially visible with the
etafilcon A material, was the variation in contact angles measured and the relatively large standard
errors (see Figure 3-15). This has possibly been explained as the molecular motion and relaxation
that polymeric materials exhibit. 86 The purpose behind the rotations of the hydrophilic-to-
hydrophobic groups and back again was to minimize the amount of surface free energy present
within the system.34 When there was a solution present on that surface, the polymer will again react
126
accordingly in order to bring the surface free energy to its lowest possible point. The reason that
this can change on a contact lens may be due to the surfactants that were present on the lens
becoming bound and unbound while the dynamic hydrogel material flips between hydrophilic and
hydrophobic groups. Due to the nature of hydrogels and the interactions that occur with solutions,
there was going to be a certain degree of error within most of the combinations.
4.2 Ex Vivo Wettability Studies
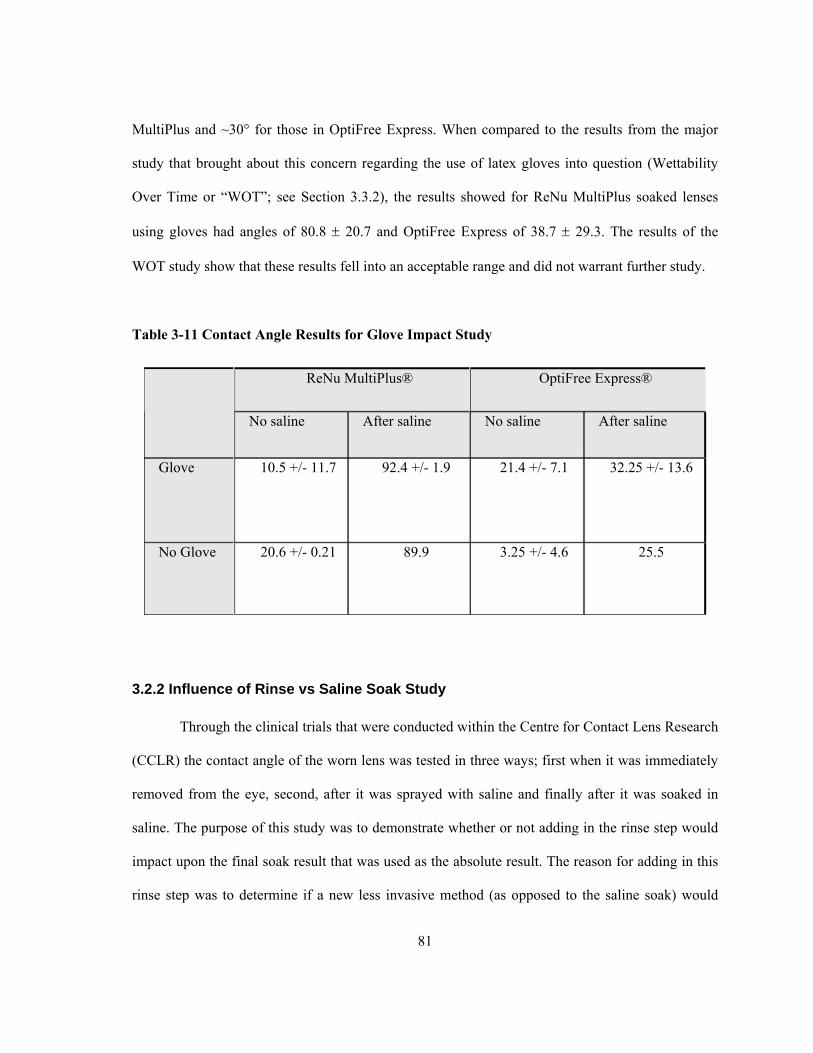
Some preliminary studies were initially undertaken to investigate if the use of latex gloves
to remove lenses had any impact on lens wettability. This was important to consider as skin lipids
and other contaminants coming into contact with the lens surface during removal could affect
wettability. It was determined that the use of latex gloves in the ex vivo studies did not have a
detrimental effect upon the contact angles subsequently assessed.
A second preliminary study was conducted to determine if the various stages of the out-of-
eye/rinse/soak steps would interfere with subsequent contact angle measurement. None of the
measurements impacted upon the following stage in the process, most importantly, the rinse step
did not adversely affect the soak steps results, for those were the measurements that were used in all
subsequent clinical studies.
The final ex vivo preliminary study was an investigation looking at the impact of
wettability on the galyfilcon A silicone hydrogel material, following a period of soaking overnight
in two care regimens. The lenses were then worn for a period of time (4 hours), after which lenses
were removed and comfort and wettability measured. This study was the first to bring in the aspect
of comfort as it relates to wettability. As the results point out (Figures 3-22 and 3-23), there was no
statistically significant difference regarding the wettability of the two soaked lenses, however there
127
was difference in comfort. This difference in comfort can most likely be attributed to the small
sample size as opposed to actual differences of soaking solutions.
4.3 Ex Vivo Clinical Trial Assessment of Lens Wettability
The clinical trials were the culmination of all the previous work, with the goal of
comparing the wettability of numerous lenses in a clinical setting, while also testing for the comfort
while these lenses were being worn.
In a silicone hydrogel study (see Section 3.3.1), two different silicone hydrogel lens
materials were worn in a contralateral fashion for one month, after which wettability and comfort
were assessed. This study showed that newer silicone hydrogel lens materials were more wettable
than older materials, however no statistically significant difference could be found regarding
comfort. A correlation was found to exist between the less wettable surface having a lower comfort
rating, however there was no correlation regarding the more wettable surface having higher comfort
scores. These correlations may be related to the material properties such as modulus, since lenses
with a higher modulus may be more noticeable in the eye, resulting in lower comfort. In this case
the higher modulus material also happened to have high contact angles, however they may not be
related.
The final clinical study, which used a conventional polyHEMA-based material, was a
comprehensive look at one lens type (etafilcon A), in three various solutions, one of which was
known to make the lens more wettable (OptiFree Express), while the other two do not. Subjects
were either asymptomatic or symptomatic of dryness when wearing lenses.
Ex vivo wettability was assessed in three ways. During the immediate “out-of-eye method”,
in which lenses were examined immediately upon removal from the eye, no difference in contact
angle was seen between the three solutions or the two subject groups over time. However when
128
subjects and care regimen data were all collapsed into one group, with variations in time alone
being investigated, a difference was seen at the six and eight hour measurements, with reduced
wettability being seen at these points in time. This was to be expected since the lens was losing
whatever increased wettability it had gained from the care solution, in addition to the dewetting
influence of the deposited proteins and lipids from the tear film on the surface of the lens. SoloCare
Aqua was the only solution that was statistically different from the other two solutions, however
only by a few degrees. The only solution that came close to being similar to its actual in vitro
angles was the OptiFree solution, while the other two were much lower than expected. It was seen
from this work that contact angles obtained immediately upon removal of the lens from the eye will
have a lower value than in vitro lab measures possibly due to a residual tear film remaining on the
surface. Similar to placing a drop of water onto an already wet surface, the angles may not always
be representative of actual values.
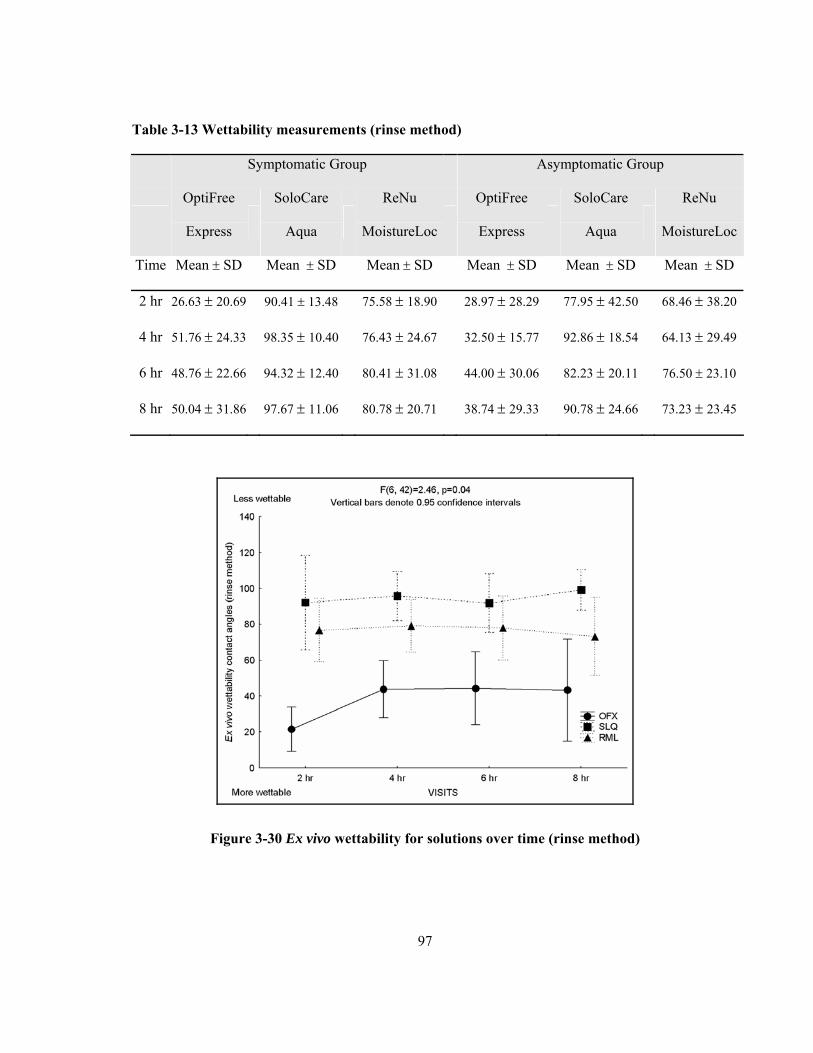
To remove this adhered tear film, lenses were briefly rinsed in saline, resulting in the “rinse
method” data. Once again there were no statistical differences between groups, however the
difference between solutions became more apparent and more closely matched the in vitro work. At
this stage all three solutions had contact angles that were statistically different from each other, with
the OptiFree solution showing that the surfactants present were most likely better able to bind to the
etafilcon material and provide a more wettable surface. The other two solutions showed that they
were unable to bind to the lens for a substantial period of time (one saline cycle), as shown in the
previous in vitro studies.
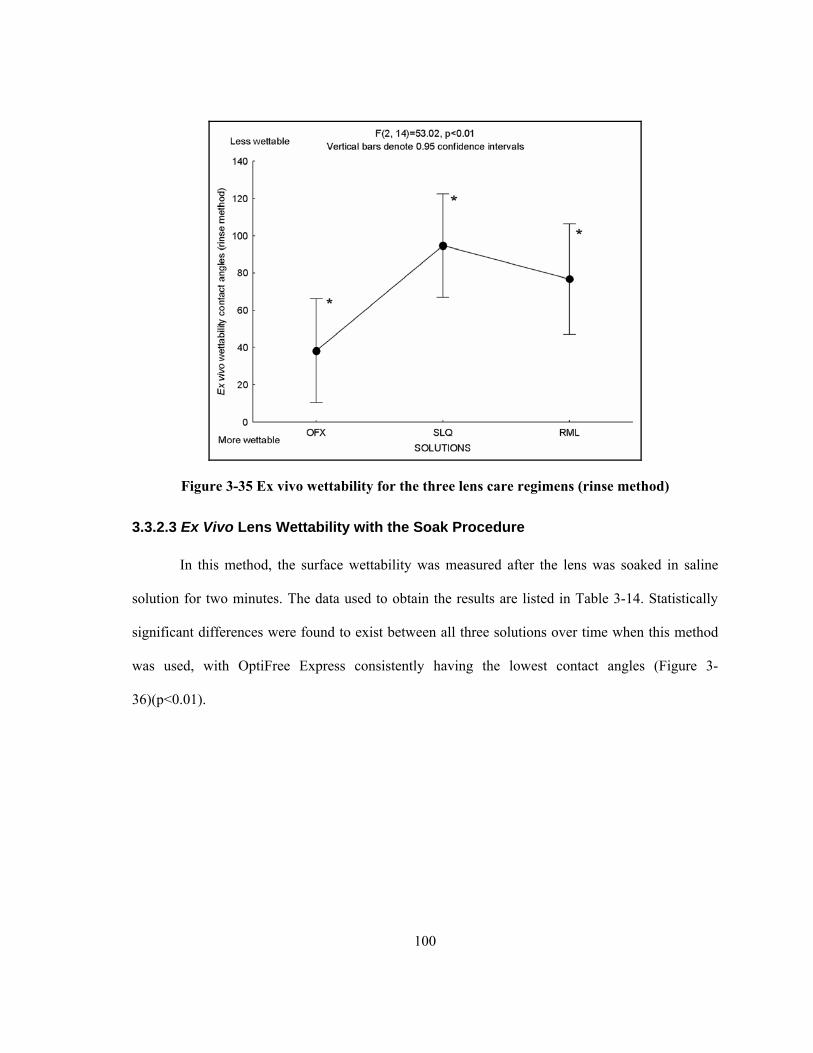
The final “soak method” results provided the most obvious differences between products.
Using this method a statistically significant difference was found over time between the OptiFree
solution and the other two products. However, no difference was seen between the two subject
groups. The last comparison of solutions when all times and groups were collapsed together shows
129
how the only solution that had an impact upon the lens was OptiFree Express. The other two
solutions, as seen in the in vitro work (Figure 3-16) match up very closely with the ex vivo angles,
but the OptiFree soaked lenses were higher than would be expected. This was believed to be due to
the adhesion of proteins and other tear film components to the surface of the lens 58 that can change
the wettability of the surface.3
4.4 Protein Deposition Studies
The goal behind the 2D-DIGE protein work was to determine if it was possible to map
proteins extracted from worn contact lenses by this method, and if successful, determine any
differences in protein expression between a small sample of symptomatic and asymptomatic
groups, and between three care solutions.
Through the preliminary protein assay and ensuing silver stain, it was seen that proteins
could be processed using this methodology, hence the CyDye technique was applied to the actual
samples. Knowing that protein deposition on lenses increases with time 61 this now gives a great
opportunity to discover what possible proteins may cause discomfort for the wearer. Unfortunately,
because no proteins were found to exist in the symptomatic lenses as opposed to the asymptomatic
lenses, mass spectroscopy was not conducted.
Since this was a preliminary study to determine if two-dimensional difference gel
electrophoresis (2D-DIGE) was capable of this sort of analysis, the sample size was also kept small.
Due to this small size there was not enough comparative data in order to conclude definitively that
the group or solution had an impact upon the protein patterns. Possible suggestions for further work
would require the separation of group and solution into their own distinct studies, or increasing the
number of replicates. Even having the three solutions may have created too much variability within
130
this specific study with such a small sample size in order for statistical agreement to occur, and
cutting out solutions and increasing the number or subjects would help resolve these issues.
This was a great step in the direction of utilizing an extremely powerful tool within contact
lens research. There have been a few papers published utilizing this method to examine the tear
film, 70-72 yet none to date involving contact lenses and extracted tear proteins. The use of this
method may result in greater localization of protein expression for contact lens wearers who suffer
from complications to wear.
131
4.5 Summary
This thesis has demonstrated that contact angle analysis is a useful indicator of hydrogel
material wettability. Research to date suggests that in vitro analysis is a good predictor of ex vivo
performance but further work in this area is warranted, particularly with novel materials and care
systems.
First generation silicone hydrogel materials that have not been surface treated in order to
mask the inherent nature of this material (such as galyfilcon and senofilcon) are more hydrophobic
than their pHEMA counterparts. Newer silicone hydrogel materials (such as comfilcon) exhibit
good wettability, despite not having a surface treatment.
Silicone-based materials can benefit from being soaked in certain care solutions. Some
solutions work preferentially with certain lenses.
Contact angles and comfort seem to be linked in certain circumstances.
Proteins can be extracted from contact lenses and identified via 2d-DIGE. However, larger
studies need to be run in order to determine the impact of “solutions/symptoms and proteins” and
how they correlate to comfort.
132
References
1. Ketelson, H. and e. al., Dynamic wettability properties of a soft contact lens hydrogel. Colloids and Surfaces B: Biointerfaces, 2005(40): p. 1-9.
2. Cheng, L., S.J. Muller, and C.J. Radke, Wettability of silicone-hydrogel contact lenses in the presence of tear-film components. Curr Eye Res, 2004. 28(2): p. 93-108.
3. Maldonado-Codina, C. and N. Efron, Dynamic wettability of pHEMA-based hydrogel contact lenses. Ophthalmic Physiol Opt, 2006. 26(4): p. 408-18.
6. Young, G., Veys, J, et al., A multi-centre study of lapsed contact lens wearers. Ophthalmic and Physiological Optics, 2002. 22(6): p. 516-527.
7. Fonn, D., Preventing contact lens dropouts. Contact Lens Spectrum, 2002. 17(8): p. 26-32.
8. Schlanger, J., A study of contact lens failures. J Am Optom Assoc, 1993. 64(3): p. 220-224.
9. Doughty, M., Fonn, D, et al, A patient questionnaire approach to estimating the prevalence of dry eye symptoms in patients presenting to optometric practices across Canada. Optom Vis Sci, 1997. 74(8): p. 624-631.
10. Fonn, D., Discontinuation of contact lens wear and its effect on the growth of the business. Contact Lens Spectrum (supple). 1996. 11(9): p. 4-5.
11. Pritchard, N., Fonn,D, et al., Discontinuation of contact lens wear: a survey. Int Cont Lens Clin, 1999. 26: p. 157 - 162.
12. Wichterle, O., Lim, D, Hydrophilic gels for biological use. Nature, 1960. 185: p. 117-118.
14. Sweeney, D.F., Clinical signs of hypoxia with high-Dk soft lens extended wear: is the cornea convinced? Eye Contact Lens, 2003. 29(1 Suppl): p. S22-5; discussion S26-9, S192-4.
15. Nicolson, P., Vogt, J, Soft contact lens polymers: an evolution. Biomaterials, 2001. 22: p. 3273-3283.
16. Franklin, V., Bright, A, Pearce, E, Tighe, B, Hydrogel lens spoilation Part 5: Tear proteins and proteinaceous films. Optician, 1992. 204: p. 16-26.
133
17. Wedler, F., Illman, BL, Horensky, DS, Mowrey-McKee, K, Analysis of protein and mucin components deposited on hydrophilic contact lenses. Clin Exp Optom, 1987. 70: p. 59-68.
18. Wedler, F.C., Analysis of biomaterials deposited on soft contact lenses. J Biomed Mater Res, 1977. 11(4): p. 525-35.
19. Bohnert, J.L., et al., Adsorption of proteins from artificial tear solutions to contact lens materials. Invest Ophthalmol Vis Sci, 1988. 29(3): p. 362-73.
20. Castillo, E.J., et al., Protein adsorption on hydrogels. II. Reversible and irreversible interactions between lysozyme and soft contact lens surfaces. Biomaterials, 1985. 6(5): p. 338-45.
21. Garrett, Q., R.W. Garrett, and B.K. Milthorpe, Lysozyme sorption in hydrogel contact lenses. Invest Ophthalmol Vis Sci, 1999. 40(5): p. 897-903.
22. Sack, R.A., et al., Specificity and biological activity of the protein deposited on the hydrogel surface. Relationship of polymer structure to biofilm formation. Invest Ophthalmol Vis Sci, 1987. 28(5): p. 842-9.
23. Jones, L., Dumbleton, K., Silicone hydrogel contact lenses: Part 1 Evolution and current status. Optometry Today, 2002. 42: p. 26-31.
24. Jones, L., Modern contact lens materials: A clinical performance update. Contact Lens Spectrum, 2002. 17: p. 24-35.
25. Senchyna, M., et al., Quantitative and conformational characterization of lysozyme deposited on balafilcon and etafilcon contact lens materials. Curr Eye Res, 2004. 28(1): p. 25-36.
26. Grobe, G., Surface engineering aspects of silicone-hydrogel lenses. Contact Lens Spectrum (supple). 1999: p. 14-17.
27. Steffen, R., Schnider, CM, A next generation silicone hydrogel lens for daily wear. Part 1 - Material properties. Optician, 2004. 227: p. 23-25.
28. Gonzalez-Meijome, J.M., et al., Microscopic observation of unworn siloxane-hydrogel soft contact lenses by atomic force microscopy. J Biomed Mater Res B Appl Biomater, 2006. 76(2): p. 412-8.
29. Franklin, A., Stiffness and elasticity of contact lens materials. Optician, 2004. 227: p. 27-34.
30. Szczesna, D.H., et al., Interferometric measurements of dynamic changes of tear film. J Biomed Opt, 2006. 11(3): p. 34028.
31. Wang, J., et al., Precorneal and pre- and postlens tear film thickness measured indirectly with optical coherence tomography. Invest Ophthalmol Vis Sci, 2003. 44(6): p. 2524-8.
134
32. Fatt, I., Prentice Medal lecture: contact lens wettability--myths, mysteries, and realities. Am J Optom Physiol Opt, 1984. 61(7): p. 419-30.
33. Sarver M, B.L., Bauman E, DiMartino R, Lau D, Umeda W, Wettability of some gas-permeable hard contact lenses. ICLC, 1984. 11: p. 479-488.
34. Tonge, S., et al., The ex vivo wettability of soft contact lenses. Curr Eye Res, 2001. 23(1): p. 51-9.
35. Zhang, W., Walgren, M, Sivik, B, Membrane Characterization by the Contact Angle Technique II. Characterization of UF-Membranes and Comparison between the Captive Bubble and Sessile Drop as Methods to obtain Water Contact Angles. Desalination, 1989. 72: p. 263-273.
36. Holly, F. and M. Refojo, Wettability of hydrogels 1. Poly(2-hydroxyethyl methacrylate). J Biomed Mater Res, 1975. 9: p. 315–326.
37. Manuj, K., et al., Efficacy of contact lens disinfecting solutions against Staphylococcus aureus and Pseudomonas aeruginosa. Eye Contact Lens, 2006. 32(4): p. 216-8.
38. Update: Fusarium keratitis--United States, 2005-2006, in MMWR Morb Mortal Wkly Rep. 2006. p. 563-4.
39. Khor, W.B., et al., An outbreak of Fusarium keratitis associated with contact lens wear in Singapore. Jama, 2006. 295(24): p. 2867-73.
40. Florakis, G.J., et al., Scanning slit confocal microscopy of fungal keratitis. Arch Ophthalmol, 1997. 115(11): p. 1461-3.
41. Keyhani, K., et al., The incidence of fungal keratitis and endophthalmitis following penetrating keratoplasty. Cornea, 2005. 24(3): p. 288-91.
42. Rosa, R.H., Jr., D. Miller, and E.C. Alfonso, The changing spectrum of fungal keratitis in south Florida. Ophthalmology, 1994. 101(6): p. 1005-13.
43. Lievens, C.W., N. Hakim, and A. Chinn, The effect of multipurpose solutions on the ocular surface. Eye Contact Lens, 2006. 32(1): p. 8-11.
44. Dogru, M., et al., Tear function and ocular surface changes in keratoconus. Ophthalmology, 2003. 110(6): p. 1110-8.
45. Lemp, M.A., et al., The precorneal tear film. I. Factors in spreading and maintaining a continuous tear film over the corneal surface. Arch Ophthalmol, 1970. 83(1): p. 89-94.
46. Canada, G.o. Contact Lens Disinfectants. Non-Prescription Drugs: Category IV Monograph 1996 [cited; Available from: http://www.hc-sc.gc.ca/dhp-mps/prodpharma/applic-demande/guide-ld/cat-iv-mono/len_cat4_e.html.
47. Leung, P., M.V. Boost, and P. Cho, Effect of storage temperatures and time on the efficacy of multipurpose solutions for contact lenses. Ophthalmic Physiol Opt, 2004. 24(3): p. 218-24.
48. Beattie, T.K., et al., Determination of amoebicidal activities of multipurpose contact lens solutions by using a most probable number enumeration technique. J Clin Microbiol, 2003. 41(7): p. 2992-3000.
49. Codling, C.E., J.Y. Maillard, and A.D. Russell, Performance of contact lens disinfecting solutions against Pseudomonas aeruginosa in the presence of organic load. Eye Contact Lens, 2003. 29(2): p. 100-2.
50. McGrath, D., et al., Comparative antimicrobial activity of no-rub multipurpose lens care solutions in the presence of organic soil. Eye Contact Lens, 2003. 29(4): p. 245-9.
51. Brennan, N.A. and M.L. Coles, Extended wear in perspective. Optom Vis Sci, 1997. 74(8): p. 609-23.
52. Rosen, M.J., Surfactants and interfacial phenomena. 3rd ed. 2004, Hoboken, N.J.: Wiley-Interscience. xiii, 444 p.
53. Aveyard, R., Adsorption at the Air/Liquid, Liquid/Liquid and Soli/Liquid Interface, in Surfactants, T.F. Tadros, Editor. 1984, Academic Press: London. p. 153-174.
54. Ullmann, F., et al. Ullmanns Encyclopaedia of Industrial Chemistry. 2005 [cited; Available from: http://link.library.utoronto.ca/eir/EIRdetail.cfm?Resources__ID=55578&T=R.
55. Minarik, L. and J. Rapp, Protein deposits on individual hydrophilic contact lenses: effects of water and ionicity. Clao J, 1989. 15(3): p. 185-8.
56. Hart, D.E., R.R. Tidsale, and R.A. Sack, Origin and composition of lipid deposits on soft contact lenses. Ophthalmology, 1986. 93(4): p. 495-503.
57. Jones, L., et al., Lipid and protein deposition of N-vinyl pyrrolidone-containing group II and group IV frequent replacement contact lenses. Clao J, 1997. 23(2): p. 122-6.
58. Jones, L., et al., An in vivo comparison of the kinetics of protein and lipid deposition on group II and group IV frequent-replacement contact lenses. Optom Vis Sci, 2000. 77(10): p. 503-10.
59. Nason, R.J., et al., Multisite comparison of contact lens modalities. Daily disposable wear vs. conventional daily wear in successful contact lens wearers. J Am Optom Assoc, 1994. 65(11): p. 774-80.
60. Bowers, R.W. and B.J. Tighe, Studies of the ocular compatibility of hydrogels. A review of the clinical manifestations of spoilation. Biomaterials, 1987. 8(2): p. 83-8.
61. Jones, L., et al., Spoilation and clinical performance of monthly vs. three monthly Group II disposable contact lenses. Optom Vis Sci, 1996. 73(1): p. 16-21.
62. Leahy, C.D., R.B. Mandell, and S.T. Lin, Initial in vivo tear protein deposition on individual hydrogel contact lenses. Optom Vis Sci, 1990. 67(7): p. 504-11.
63. Refojo, M., Leong, FL, Microscopic determination of the penetration of proteins and polysaccharides on poly- (hydroxyethylmethac) similar hydrogels. Journal of Polymer Science, Part C Polymer Symposium, 1979. 66: p. 227.
64. Minno, G.E., et al., Quantitative analysis of protein deposits on hydrophilic soft contact lenses: I. Comparison to visual methods of analysis. II. Deposit variation among FDA lens material groups. Optom Vis Sci, 1991. 68(11): p. 865-72.
65. Jones, L., et al., Lysozyme and lipid deposition on silicone hydrogel contact lens materials. Eye Contact Lens, 2003. 29(1 Suppl): p. S75-9; discussion S83-4, S192-4.
66. Gudmundsson, O.G., et al., Identification of proteins in contact lens surface deposits by immunofluorescence microscopy. Arch Ophthalmol, 1985. 103(2): p. 196-7.
67. McArthur, S.L., et al., XPS and surface-MALDI-MS characterisation of worn HEMA-based contact lenses. Biomaterials, 2001. 22(24): p. 3295-304.
68. Glasson, M., F. Stapleton, and M. Willcox, Lipid, lipase and lipocalin differences between tolerant and intolerant contact lens wearers. Curr Eye Res, 2002. 25(4): p. 227-35.
69. Willcox, M.D. and J. Lan, Secretory immunoglobulin A in tears:functions and changes during contact lens wear. Clin Exp Optom, 1999. 82(1): p. 1-3.
70. Herber, S., et al., Two-dimensional analysis of tear protein patterns of diabetic patients. Electrophoresis, 2001. 22(9): p. 1838-44.
71. Koo, B.S., et al., Comparative analysis of the tear protein expression in blepharitis patients using two-dimensional electrophoresis. J Proteome Res, 2005. 4(3): p. 719-24.
72. Molloy, M.P., et al., Establishment of the human reflex tear two-dimensional polyacrylamide gel electrophoresis reference map: new proteins of potential diagnostic value. Electrophoresis, 1997. 18(15): p. 2811-5.
73. Seal, D.V., The effect of ageing and disease on tear constituents. Trans Ophthalmol Soc U K, 1985. 104 (Pt 4): p. 355-62.
74. Unlu, M., M.E. Morgan, and J.S. Minden, Difference gel electrophoresis: a single gel method for detecting changes in protein extracts. Electrophoresis, 1997. 18(11): p. 2071-7.
75. Amersham-Biosciences, Ettan DIGE User Manual, in User Manual Proteomics. 2002, Amersham Biosciences: Buckinghamshire. p. 386.
137
76. Tonge, R., et al., Validation and development of fluorescence two-dimensional differential gel electrophoresis proteomics technology. Proteomics, 2001. 1(3): p. 377-96.
77. Wu, T.L., Two-dimensional difference gel electrophoresis. Methods Mol Biol, 2006. 328: p. 71-95.
78. Fodor, I.K., et al., Statistical challenges in the analysis of two-dimensional difference gel electrophoresis experiments using DeCyder. Bioinformatics, 2005. 21(19): p. 3733-40.
79. Subbaraman, L.N., et al., Rewetting drops containing surface active agents improve the clinical performance of silicone hydrogel contact lenses. Optom Vis Sci, 2006. 83(3): p. 143-51.
80. Keith, D., B. Hong, and M. Christensen, A novel procedure for the extraction of protein deposits from soft hydrophilic contact lenses for analysis. Curr Eye Res, 1997. 16(5): p. 503-10.
81. Tang, I.e.a., The pH of multi-purpose soft contact lens solutions. Optom Vis Sci, 1996(73): p. 746-749.
82. Tomlinson, A. and S. Khanal, Assessment of tear film dynamics: quantification approach. The Ocular Surface, 2005. 3(2): p. 81-95.
83. Tiffany, J.M., J.C. Pandit, and A.J. Bron, Soluble mucin and the physical properties of tears. Adv Exp Med Biol, 1998. 438: p. 229-34.
84. Pandit, J.C., et al., Physical properties of stimulated and unstimulated tears. Exp Eye Res, 1999. 68(2): p. 247-53.
85. BASF, Cremophor RH Grades Technical Leaflet, in ME 125e (848). 1992.
86. Andrade J., C.-Y., Probing polymer surface and interface dynamics. Surface and Interface Analysis, 1986. 8(6): p. 253-256.