58
Management Quality and Carbon Performance of Industrials and Materials Companies: February 2020 Simon Dietz, Glen Gostlow, Valentin Jahn, Michal Nachmany, Jolien Noels and Rory Sullivan

Management Quality and Carbon Performance of Industrials and Materials Companies: February 2020
Simon Dietz, Glen Gostlow, Valentin Jahn, Michal Nachmany, Jolien Noels and Rory Sullivan

2
Research Funding Partners
We would like to thank our Research Funding Partners for their ongoing support to the TPI and their enabling the research behind this report and its publication.

Our Supporters

Key messagesThis is TPI’s latest assessment of industrials and materials companies, comprising 100 companies in aluminium, cement, chemicals, paper and steel production.
We perform a sector-wide assessment of chemical companies’ Management Quality for the first time.
On Management Quality, industrials/materials companies are currently halfway between Levels 2 and 3 on average, i.e. transitioning from building capacity to
integrating climate change into operational decision making. Paper is currently the worst performing of these sectors on Management Quality. The chemicals
sector performs best and outperforms all other TPI sectors.
In aggregate, industrials/materials companies’ Management Quality has improved since our previous assessment in mid-2018, but only marginally. 26% of
companies for which we have trend data have moved up at least one level, but 14% have moved down at least one level, and most have not moved.
On Carbon Performance, 30% of companies are aligned with the least ambitious Paris Pledges benchmark and 19% are aligned with a path to keep global
warming at 2C or below. These shares are similar to the TPI average. Currently paper has the best Carbon Performance in the industrials/materials sector and
the second-best Carbon Performance of all TPI sectors. Chemical companies are not included in the Carbon Performance assessment.
Alignment with the Paris goals and pledges has improved compared to our previous assessment. This is driven largely by cement and paper. Emissions
disclosure has also improved, particularly by companies listed in Asia (especially China), as well as Russia.
4

About the Transition Pathway Initiative

About TPI and this slide setTPI is a global initiative led by Asset Owners and supported by Asset
Managers. Established in January 2017, TPI now has over 60 supporters
with more than $18 trillion of combined Assets Under Management and
Advice.*
Using publicly disclosed data, TPI assesses the progress companies are
making on the transition to a low-carbon economy, supporting efforts to
mitigate climate change:
• In line with the recommendations of TCFD;
• Providing data for the Climate Action 100+ initiative.
All TPI data are published via an open-access online tool:
www.transitionpathwayinitiative.org.
This slide set presents our latest assessment of the industrials and
materials sector, including aluminium, cement, chemicals, paper and steel
producers. This is our first dedicated assessment of chemical companies’
Management Quality.
*as of January 2020
6

TPI strategic relationships
The Grantham Research Institute on Climate Change and the
Environment, a research centre at the London School of
Economics and Political Science (LSE), is TPI’s academic partner. It
has developed the assessment framework, provides company
assessments, and hosts the online tool.
FTSE Russell is TPI’s data partner. FTSE Russell is a leading global
provider of benchmarking, analytics solutions and indices.
The Principles for Responsible Investment (PRI) manages and
provides supporter coordination to TPI. PRI is an international
network of investors implementing the six Principles for
Responsible Investment.
7

TPI Steering Committee
TPI Co-Chairs

TPI design principles
Disclosure-based: Company assessments are based only on
publicly available information
Accessible and easy to use: Outputs are designed to be useful
to Asset Owners and Asset Managers, especially with limited
resources to assess climate change
Not seeking to add unnecessarily to the reporting burden:
Aligned with existing initiatives and disclosure frameworks,
such as CDP and TCFD
Corporate level: Pitched at a high level of aggregation
9

Overview of the TPI Tool
TPI’s company assessments are divided into 2 parts:
1. Management Quality covers companies’
management/governance of greenhouse gas emissions and the
risks and opportunities arising from the low-carbon transition;
2. Carbon Performance assessment involves quantitative
benchmarking of companies’ emissions pathways against the
international targets and national pledges made as part of the
2015 UN Paris Agreement, for example limiting global warming
to below 2°C.
Both of these assessments are based on company disclosures.
10

Management QualityLevel 0
Unaware
Level 1
Awareness
Level 2
Building capacity
Level 3
Integrating into operational decision making
Level 4
Strategic assessment
Company has set long-term quantitative targets (>5 years) for reducing its GHG emissions
Company has nominated a board member/committee with explicit responsibility for oversight of the climate change policy
Company has incorporated climate change performance into executive remuneration (modified question)
Company has set quantitative targets for reducing its GHG emissions
Company has incorporated climate change risks and opportunities in its strategy
Company has set GHG emission reduction targets
Company reports on its Scope 3 GHG emissions
Company undertakes climate scenario planning
Company recognises climate change as a relevant risk/opportunity for the business
Company has published info. on its operational GHG emissions
Company has had its operational GHG emissions data verified
Company discloses an internal carbon price
Company does not recognise climate change as a significant issue for the business
Company has a policy (or equivalent) commitment to action on climate change
Company supports domestic & internationalefforts to mitigate climate change
Company ensures consistency between its climate change policy and position of trade associations of which it is a member (new question)
Company discloses membership and involvement in trade associations engaged on climate (new question)
Company has a process to manage climate-related risks
Company discloses Scope 3 GHG emissions from use of sold products (selected sectors only)
TPI’s Management Quality framework is based on 19 indicators, each of which tests whether a company has implemented a particular carbon management practice. These 19 indicators are used to map companies on to 5 levels/steps. The data are provided by FTSE Russell. See our latest Methodology and Indicators Report, version 3.0, for more detail.
11

Carbon PerformanceTPI’s Carbon Performance assessment tests the alignment of company
targets with the UN Paris Agreement goals.*
We use 3 benchmark scenarios for each sector, which in the
industrials/materials sector are:
1. Paris Pledges, consistent with emissions reductions pledged by
countries as part of the Paris Agreement (i.e. NDCs; note these
are insufficient to limit global warming to 2C or below);
2. 2 Degrees, consistent with the overall aim of the Paris
Agreement, albeit at the low end of the range of ambition (at
least a 50% chance of limiting warming to 2°C);
3. Below 2 Degrees, consistent with a more ambitious interpretation
of the Paris Agreement’s overall aim (50% chance of limiting
warming to 1.75°C).
Benchmarking is sector-specific and based on emissions intensity (e.g.
grams of CO2 per tonne of crude steel). See TPI website for further
details.
12
Company A is not aligned with any of the benchmarks
Company B is eventually aligned with the Paris Pledges, but neither 2C/ nor Below 2C
Company C is aligned with all Paris benchmarks, including Below 2C
*We use the Sectoral Decarbonization approach (SDA), which was created by CDP, WWF & WRI in 2015
& is also used by the Science Based Targets Initiative.
Car
bo
n In
ten
sity

Reducing TPI’s Carbon Performance data to a single indicator of alignment with ParisOur Carbon Performance data cover multiple years. How can they be used
to answer the simple question: is a company aligned with the Paris goals?
To do this we compare a company’s emissions intensity in the last year for
which we have data with the benchmarks at the end of the horizon, which
is 2030 for the industrials/materials sectors we assess. Thus, for example:
• Company with a 2030 emissions reduction target – the company’s
expected 2030 emissions intensity is compared with the benchmark
emissions intensities in 2030;
• Company with no emissions reduction target – the company’s
historical emissions intensity is compared with the benchmark
emissions intensities in 2030 (i.e. a comparison of where the
company is now with where it would need to be in 2030).
13

The state of transition in the
industrials/materials sector:
overview of results
Al

TPI coverage of industrials/materials
This latest TPI report covers 100 of the world’s largest and highest-emitting public
companies in industrials/materials. They are grouped into five sectors:
aluminium, cement, chemicals, paper and steel.
Four of these sectors, aluminium, cement, paper and steel, have been assessed
by TPI previously, allowing us to track companies’ progress.
For the first time, we assess the Management Quality of the chemical sector,
covering 21 companies involved in commodity and speciality chemicals. We
cannot yet provide an assessment of chemical companies’ Carbon Performance,
due to data and methodological challenges in the sector. Our Carbon
Performance assessment of aluminium only includes the eight companies
involved in both alumina refining and aluminium smelting.
Together, the direct CO2 emissions from aluminium, cement, chemicals, paper
and steel production make up over 2/3 of direct industrial CO2 emissions (see
chart opposite).
15Sector Companies assessed
on Management
Quality
Companies assessed
on Carbon
Performance
Aluminium 15 8
Cement 22 22
Chemicals 21 0
Paper 18 18
Steel 24 24
Total 100 72
26%
24%
14%
4%2%
30%
Direct emissions from industry, 2017
Cement
Iron and Steel
Chemical andpetrochemical
Aluminium
Pulp and paper
Other industry
Source: IEA’s Tracking Clean Energy Progress, 2019

Management Quality levelLevel 0
Unaware
Level 1
Awareness
Level 2
Building capacity
Level 3
Integrating into operational decision making
Level 4
Strategic assessment
26 Companies: 26%
30 Companies: 30% 4 Aluminium
5 Aluminium 5 Cement
16 Companies: 16% 5 Cement 7 Chemicals
25 Companies: 25% 2 Aluminium 10 Chemicals 4 Paper (including one 4*)
3 Companies: 3% 3 Aluminium 5 Cement 4 Paper 6 Steel
1 Aluminium 7 Cement 2 Chemicals 6 Steel
2 Paper 2 Chemicals 4 Paper
4 Paper 3 Steel
9 Steel
16

Management Quality levelIndustrials/materials companies’ average Management Quality score is now
2.5, meaning the average company is exactly halfway between Levels 2 and 3.
Reaching Level 3 requires both disclosure of operational GHG emissions and
setting emissions reduction targets, so the average company is at the stage of
putting both of these in place.
Within industrials/materials, the various sectors are quite closely matched:
paper companies average 2.2, cement and steel companies both average 2.4,
and aluminium companies average 2.5. Chemicals, the newest addition to TPI’s
database, enters with a high average of 3.0, making it the best performing of
TPI’s main sectors on Management Quality.
Only one company, UK paper company Mondi, satisfies all Management
Quality criteria, earning it a 4* rating. It has become significantly harder to
achieve a 4* rating, due to the inclusion of challenging new and modified
questions about lobbying and executive remuneration respectively. See slide
11 and our latest Methodology and Indicators Report, version 3.0, for more
detail.
17

Trends inManagement QualityWe have trend data on 78 companies in aluminium, cement, paper and steel,
which have now been assessed by TPI at least twice. We find that:
• 47 companies (60%) stayed on the same level as their previous
assessment;
• 20 companies (26%) moved up at least one level;
• 11 companies (14%) moved down at least one level. Four of these drops
are due to companies failing to satisfy our new indicator on disclosing
membership and involvement in trade associations engaged on climate.
As a consequence, the average Management Quality score of cement and
paper companies has increased by 0.1 points. In steel, the average score has
increased significantly, by 0.4 points. The average score in aluminium has
actually fallen by 0.2 points, entirely due to the addition of new companies
that perform worse than the sector average.
0 1 2 3 4
1 17 6 9 14
3
2
3
7
62
11
4
1
18
1

0% 10% 20% 30% 40% 50% 60% 70% 80% 90%100%
L0|1. Acknowledge?
L1|2. Recognises as risk/opportunity?
L1|3. Policy commitment to act?
L2|4. Emissions targets?
L2|5. Disclosed Scope 1&2 emissions?
L3|6. Board responsibility?
L3|7. Quantitative emissions targets?
L3|8. Disclosed any Scope 3 emissions?
L3|9. Had operational emissions verified?
L3|10. Support domestic and intl. mitigation?
L3|11.Disclosed trade association involvement?
L3|12. Process to manage climate risks?
L3|13. Disclosed use of product emissions?
L4|14. Long-term emissions targets
L4|15. Incorporated climate change into exec. rem.?
L4|16. Climate risks/opportunities in strategy?
L4|17. Undertakes climate scenario planning?
L4|18. Discloses an internal price of carbon?
L4|19. Consistency between company and trade assocs.?
Management Quality: indicator by indicator
Most industrials/materials companies implement the basic
carbon management practices, with fewer taking the more
advanced steps. We see this general pattern in all TPI sectors.
Compared with the TPI database as a whole, the
industrials/materials sector underperforms on all indicators,
albeit mostly to a small extent. However, it performs notably
worse than average on disclosing membership and involvement
in trade associations engaged on climate (Q11), and
incorporating climate risks and opportunities in company
strategy (Q16).
Only four companies ensure consistency between their climate
change policy and the positions taken by those trade
associations of which they are a member (Q19).
19 0% 10% 20% 30% 40% 50% 60% 70% 80% 90%100%
L0|1. Acknowledge?
L1|2. Recognises as risk/opportunity?
L1|3. Policy commitment to act?
L2|4. Emissions targets?
L2|5. Disclosed Scope 1&2 emissions?
L3|6. Board responsibility?
L3|7. Quantitative emissions targets?
L3|8. Disclosed any Scope 3 emissions?
L3|9. Had operational emissions verified?
L3|10. Support domestic and intl. mitigation?
L3|11.Disclosed trade association involvement?
L3|12. Process to manage climate risks?
L3|13. Disclosed use of product emissions?
L4|14. Long-term emissions targets
L4|15. Incorporated climate change into exec. rem.?
L4|16. Climate risks/opportunities in strategy?
L4|17. Undertakes climate scenario planning?
L4|18. Discloses an internal price of carbon?
L4|19. Consistency between company and trade assocs.?

Carbon Performance: alignment with the Paris Agreement benchmarks
This Carbon Performance assessment includes 72 companies in the aluminium,
cement, paper and steel sectors. Disclosure limitations and methodological challenges
currently prevent Carbon Performance assessment of chemicals.
30% of industrials/materials companies are aligned with the Paris Pledges, or better.
This is an improvement on our previous assessment of industrials/materials in mid-
2018, when 24% were aligned. The advance is largely driven by the cement and paper
sectors.
In our previous assessment, only five industrials/materials companies (7%) had set a
2030 emissions reduction target that was aligned with at least the Paris Pledges. Now
14 companies (19%) have done so.
The proportion of companies disclosing emissions in the industrials/materials sector
has increased from 61% in our previous assessment to 75% here. Much of the
improvement comes from companies listed in Asia (especially in China), as well as
Russia.
20
1825%
3245%
811%
68%
811%
No Disclosure Not Aligned Paris Pledges
2 Degrees Below 2 Degrees

Carbon Performance: sector breakdown Paper has the strongest Carbon Performance in the industrials/materials sector and it
is the second-best performing sector in the TPI database. Over half of the paper
companies assessed are projected to be aligned with the Paris Pledges by 2030 and
28% with Below 2C.
By contrast, aluminium, cement and steel companies are less likely to be aligned than
the average TPI company. This was also the case last year.
Steel has not improved its Carbon Performance compared to our previous
assessment of the sector. However, both disclosure of emissions and target setting
have improved in steel.
Although the number of cement producers aligned with the Paris Pledges has more
than doubled, the sector still lags behind in terms of both alignment and disclosure.
Those companies that are Paris-aligned do so due to their 2030 targets, rather than
their current emissions intensities.
Aluminium remains one of the worst performing sectors on Carbon Performance.
Only one aluminium company, Norsk Hydro, is expected to be aligned with the Paris
Agreement (Below 2C).
21
52
8
3
13
5 9
5
1
2
5
3
32
1
5
0%
10%
20%
30%
40%
50%
60%
70%
80%
90%
100%
Steel Aluminium Cement Paper
No Disclosure Not Aligned Paris Pledges 2 Degrees Below 2 Degrees

Sector focus:steel makers

Key messages – steel makersThe steel sector’s Management Quality has improved significantly over the past few years, from a low base. In our first assessment of mid-2017, steel’s
average score was only 1.8, while now it is 2.4. Just under 40% of steel makers, for which we have trend data, have moved up at least one level
relative to our previous assessment. Nonetheless steel sector Management Quality remains below the TPI average.
Steel is also relatively weak on Carbon Performance. Only one in four steel makers will be aligned with the Paris Pledges benchmark in 2030. Of those,
only SSAB and Tenaris will be aligned with the Below 2C benchmark. Alignment in the sector has not improved compared to our previous assessment.
However, target setting in the sector has improved. Whereas in our previous assessment no steel company had a target beyond 2020, now six steel
makers have an emissions reduction target extending to 2030 or beyond, of which four are aligned with at least the Paris Pledges.
Moreover, disclosure in the sector has also improved, with four companies that were not previously assessable on Carbon Performance included for
the first time this year. All four of these companies also moved up at least one Management Quality level.
Companies with a higher Management Quality score are not necessarily more likely to be aligned on Carbon Performance. For example, Voestalpine
and JSW Steel both moved up to Level 4, but set a 2030 target that is not Paris-aligned.
23

Management Quality levelCompanies’ Management Quality ratings may not always reflect their most up-to-date disclosures. TPI updates its assessments once a year.
Level 0
Unaware
Level 1
Awareness
Level 2
Building capacity
Level 3
Integrating into operational decision making
Level 4
Strategic assessment
6 Companies: 25%
6 Companies: 25% Arcelor Mittal
JSW Steel
Posco
SSAB
ThyssenKrupp
Voestalpine
Acerinox
China Steel
Hyundai Steel
JFE Holdings
Nippon Steel
Tata Steel
3 Companies: 13%
9 Companies: 38% Bluescope Steel
Gerdau
Severstal0 Companies: 0% Erdemir
Evraz
Kobe Steel
Nisshin Steel
Novolipetsk Steel
Nucor
Steel Dynamics
Tenaris
United States Steel
24

Management Quality levelOur assessment of the steel sector includes the world’s 23 largest
steel makers by market capitalisation, as well as a further CA100+
company (SSAB).
The average Management Quality score of the sector is 2.4, which
makes it the second best-performing industrials/materials sector,
after chemicals (1st) and level with cement.
This stands in stark contrast to the historical performance of the steel
sector. In our State of Transition report from mid-2019, steel was still
the worst performing sector on Management Quality, with a score of
below 2 (1.96). Even so, steel remains below the current TPI-wide
average of 2.7.
50% of steel companies are now on Levels 3 or 4. There is a clear
divide between leaders and laggards, with 9 companies still on Level
1. There are no 4* companies.
25

Trends inManagement Quality
Of the 23 steel companies for which we have trend data, 10 remain
at the same level as our previous assessment, while nine have
progressed at least one level.
There are no longer any Level 0 companies, because Novolipetsk
Steel has acknowledged climate change as a significant issue for its
business for the first time.
Three companies have jumped two levels: Nippon Steel and JFE Steel
go from Level 1 to 3, while Voestalpine goes from Level 2 to 4.
Voestalpine has improved on no fewer than 11 indicators and is now
only two indicators short of Level 4*.
Four companies (Hyundai Steel, Nucor, Tata and US Steel) have
moved down a level. Hyundai Steel and Tata move down in part
because they do not disclose their involvement in trade associations
engaged on climate.
0 1 2 3 4
6 2 1
1
2
2
2
1
1
26
2
3

Management Quality: indicator by indicator
Steel makers underperform the average TPI company on most
indicators. They perform considerably worse than average on
transparency about climate lobbying, with only 25% of
companies disclosing their membership and involvement in
trade associations engaged on climate issues (Q11).
One notable exception is disclosing an internal price of carbon
(Q18), where steel makers perform better than average. Four
of the companies for which we have trend data introduced an
internal price of carbon last year: Hyundai Steel,
Thyssenkrupp, US Steel and Voestalpine.
27 0% 10% 20% 30% 40% 50% 60% 70% 80% 90%100%
L0|1. Acknowledge?
L1|2. Recognises as risk/opportunity?
L1|3. Policy commitment to act?
L2|4. Emissions targets?
L2|5. Disclosed Scope 1&2 emissions?
L3|6. Board responsibility?
L3|7. Quantitative emissions targets?
L3|8. Disclosed any Scope 3 emissions?
L3|9. Had operational emissions verified?
L3|10. Support domestic and intl. mitigation?
L3|11.Disclosed trade association involvement?
L3|12. Process to manage climate risks?
L3|13. Disclosed use of product emissions?
L4|14. Long-term emissions targets
L4|15. Incorporated climate change into exec. rem.?
L4|16. Climate risks/opportunities in strategy?
L4|17. Undertakes climate scenario planning?
L4|18. Discloses an internal price of carbon?
L4|19. Consistency between company and trade assocs.?
0% 10% 20% 30% 40% 50% 60% 70% 80% 90%100%
L0|1. Acknowledge?
L1|2. Recognises as risk/opportunity?
L1|3. Policy commitment to act?
L2|4. Emissions targets?
L2|5. Disclosed Scope 1&2 emissions?
L3|6. Board responsibility?
L3|7. Quantitative emissions targets?
L3|8. Disclosed any Scope 3 emissions?
L3|9. Had operational emissions verified?
L3|10. Support domestic and intl. mitigation?
L3|11.Disclosed trade association involvement?
L3|12. Process to manage climate risks?
L3|13. Disclosed use of product emissions?
L4|14. Long-term emissions targets
L4|15. Incorporated climate change into exec. rem.?
L4|16. Climate risks/opportunities in strategy?
L4|17. Undertakes climate scenario planning?
L4|18. Discloses an internal price of carbon?
L4|19. Consistency between company and trade assocs.?

Carbon Performance: alignment with the Paris Agreement benchmarks
Disclosure in the steel sector is improving; historical Carbon Performance can now be
calculated for 79% of steel makers (compared to 65% in our previous assessment).
Alignment in the sector has not improved, but the sector has become more forward-
looking over the past year.
One in four steel makers is aligned with the Paris Pledges benchmark in 2030. This is
similar to our previous assessment. Two companies are aligned with a Below 2C
scenario: SSAB and Tenaris. Three more companies are aligned with 2C in 2030:
Acerinox, Hyundai Steel and Thyssenkrupp. BlueScope Steel is aligned with the Paris
Pledges. Companies with the best Carbon Performance have set more ambitious
emissions targets and make more use of electric arc furnaces, recycling and
renewable energy.
In our previous assessment, no steel maker had a company-wide, quantitative
emissions target beyond 2020. Now 50% have a target for 2020 or beyond.
Moreover, six companies have set a target for 2030 or beyond.
28
521%
1354%
14%
313%
28%
No Disclosure Not Aligned Paris Pledges
2 Degrees Below 2 Degrees

Alignment of steel makers, scaled by market cap.
Source for market capitalisation: FTSE Russell (31/12/2019), average of last 4 quarters (before investibility weight)
29
SSAB

Sector focus:Aluminium producers
Al

Key messages – aluminium
The aluminium sector performs above average on Management Quality relative to the industrials/materials sector as a whole, but slightly
below average compared to the entire TPI database. 60% of aluminium companies are now on Levels 3 or 4.
Unusually, among aluminium companies for which we have trend data there has been no movement at all on Management Quality: all
companies are on the same level as last year. However, the sector’s average score has fallen from 2.8 to 2.5 due to the inclusion of new
companies, which happen to perform relatively poorly.
On Carbon Performance, we can calculate an emissions intensity for six aluminium companies (see slide 37). Only companies that are
involved in both alumina refining and aluminium smelting fit the TPI methodology, which results in excluding seven companies. Two
further companies provide inadequate emissions disclosure.
Carbon Performance varies widely between companies. This can be explained to a large extent by the source of electricity that companies
use for smelting aluminium, i.e. fossil or renewable. Only half of the companies assessed on Carbon Performance have aluminium-specific
targets to 2030 and only one of them (Norsk Hydro) is aligned with at least one of the benchmarks in 2030 (Below 2C).
31

Management Quality levelCompanies’ Management Quality ratings may not always reflect their most up-to-date disclosures. TPI updates its assessments once a year.
Level 0
Unaware
Level 1
Awareness
Level 2
Building capacity
Level 3
Integrating into operational decision making
Level 4
Strategic assessment
4 Companies: 27%
5 Companies: 33% Alcoa
Glencore
Rio Tinto
South32
Alumina
Arconic
Nippon Light Metal
Norsk Hydro
Vedanta
2 Companies: 13%
3 Companies: 20% Mitsui & Co
UACJ
1 Company: 7% Chalco
China Zhongwang
Press Metal QAMCO
32

Management Quality levelOur assessment of this sector includes the world’s 15 largest
aluminium companies by market capitalisation.
We no longer assess Russian aluminium company UC Rusal*, but
have added three companies: Glencore, Mitsui & Co, and QAMCO.
The average Management Quality score is 2.5, which is down from
2.8 last year. The drop is caused by the new additions Mitsui & Co,
and QAMCO. As a result, aluminium is above the
industrials/materials average, but is now below the TPI-wide average
of 2.7.
More than half of companies are now on Levels 3 or 4, but there are
no 4* companies.
There have been no changes in company levels compared to last
year.
*UC Rusal is not researched by FTSE Russell.
33

Management Quality: indicator by indicator
Aluminium companies perform better than average on some
governance and strategy indicators, including: nominating a board
member or board committee with explicit responsibility for oversight
of the companies’ climate change policy (Q6), having processes in
place to manage climate-related risks (Q12), incorporating climate
risks and/or opportunities into strategy (Q16), and undertaking
climate scenario planning (Q17).
Despite this, aluminium companies generally underperform
compared to the average TPI company, particularly on setting
quantitative emissions targets (especially long-term targets; Q14),
and disclosing an internal price of carbon (Q18).
34 0% 10% 20% 30% 40% 50% 60% 70% 80% 90%100%
L0|1. Acknowledge?
L1|2. Recognises as risk/opportunity?
L1|3. Policy commitment to act?
L2|4. Emissions targets?
L2|5. Disclosed Scope 1&2 emissions?
L3|6. Board responsibility?
L3|7. Quantitative emissions targets?
L3|8. Disclosed any Scope 3 emissions?
L3|9. Had operational emissions verified?
L3|10. Support domestic and intl. mitigation?
L3|11.Disclosed trade association involvement?
L3|12. Process to manage climate risks?
L3|13. Disclosed use of product emissions?
L4|14. Long-term emissions targets
L4|15. Incorporated climate change into exec. rem.?
L4|16. Climate risks/opportunities in strategy?
L4|17. Undertakes climate scenario planning?
L4|18. Discloses an internal price of carbon?
L4|19. Consistency between company and trade assocs.?
0% 10% 20% 30% 40% 50% 60% 70% 80% 90%100%
L0|1. Acknowledge?
L1|2. Recognises as risk/opportunity?
L1|3. Policy commitment to act?
L2|4. Emissions targets?
L2|5. Disclosed Scope 1&2 emissions?
L3|6. Board responsibility?
L3|7. Quantitative emissions targets?
L3|8. Disclosed any Scope 3 emissions?
L3|9. Had operational emissions verified?
L3|10. Support domestic and intl. mitigation?
L3|11.Disclosed trade association involvement?
L3|12. Process to manage climate risks?
L3|13. Disclosed use of product emissions?
L4|14. Long-term emissions targets
L4|15. Incorporated climate change into exec. rem.?
L4|16. Climate risks/opportunities in strategy?
L4|17. Undertakes climate scenario planning?
L4|18. Discloses an internal price of carbon?
L4|19. Consistency between company and trade assocs.?

Carbon Performance: alignment with the Paris Agreement benchmarks
Of the 15 aluminium companies included in this report, only eight are assessed on
Carbon Performance. Only companies that are involved in both alumina refining and
aluminium smelting fit the TPI methodology.
The aluminium sector is one of the worst performing TPI sectors in terms of Carbon
Performance. It does only slightly better than oil and gas producers, and airlines.
Only one company is aligned with a Paris benchmark in 2030, namely Norsk Hydro,
which is already aligned with the Below 2C scenario based on its current emissions
intensity. Although Alcoa’s and Rio Tinto’s current emissions intensities are aligned
with the Paris Pledges, they are no longer by 2030.
There is wide variation in emissions intensity across companies, mainly due to the
source of electricity used for smelting.
35
225%
562%
113%
No Disclosure Not Aligned Paris Pledges
2 Degrees Below 2 Degrees

Alignment of aluminium cos., scaled by production
Source: Company disclosures
36
Alumina

Sector focus:cement producers

Key messages – cement
Compared with other sectors in the TPI database, cement is below average on Management Quality. No cement company is on Level 0, meaning all
companies acknowledge climate change as a business issue. On average, the sector is just over halfway between Levels 2 and 3, so it is moving towards
integrating climate change into operational decision making. Just under half of the cement companies we assess are now on Levels 3 and 4, indicating
they are integrating climate change into operational decision making, or even taking a strategic approach to climate change.
The average Management Quality score of cement companies has remained almost unchanged compared with our previous assessment in mid-2018,
but this conceals a number of moves at the company level. No fewer than 48% of companies have changed level relative to our previous assessment,
with as many moving up as down.
There has been a considerable improvement in the cement sector’s Carbon Performance. The percentage of companies disclosing the information
required to carry out a Carbon Performance assessment in the cement sector has gone up from 52% in our previous assessment to 64% now. Alignment
with at least one of the Paris benchmarks has more than doubled from 10% to 23%. The sector is also taking a longer view on Carbon Performance, with
five companies’ emissions reduction targets now extending to 2030 or beyond.
38

Management Quality levelCompanies’ Management Quality ratings may not always reflect their most up-to-date disclosures. TPI updates its assessments once a year.
Level 0
Unaware
Level 1
Awareness
Level 2
Building capacity
Level 3
Integrating into operational decision making
Level 4
Strategic assessment
5 Companies: 23%
5 Companies: 23% Ambuja Cements
Asia Cement
Boral
LafargeHolcim
Shree Cements
Cemex
CRH
HeidelbergCement
Siam Cement
UltraTech Cement
5 Companies: 23%
7 Companies: 32% Adelaide Brighton
Dangote Cement
Eagle Materials
Fletcher Building
Martin Marietta Materials
0 Companies: 0% Anhui Conch Cement
China National Building Materials
China Resources
Semen Indonesia
Sumitomo Osaka Cement
Taiheiyo Cement
Taiwan Cement
39

Management Quality level
Cement companies’ average Management Quality score is now 2.4,
putting the average company in this sector just short of halfway between
“Building capacity” (Level 2) and “Integrating into operational decision
making” (Level 3). This average is only marginally higher than last year
(2.3).
There are no cement companies on Level 0; all companies are
acknowledging climate change as a business issue, either explicitly or
implicitly. There is a fairly even distribution of companies across Levels 1
to 4, so we do not see the separation of the sector into leaders and
laggards like we do in aluminium and steel, for example.
Just under half of the cement companies assessed (10) are now on Level
3 or 4. However, there are still no 4* cement companies, meaning none
satisfy all 18 applicable Management Quality criteria.
40

Trends inManagement QualityThe average Management Quality score of cement companies has risen very
slightly from 2.33 in mid-2018 to 2.36 in this assessment. This is despite
considerable movement of individual companies.
Of the 21 cement companies for which we have trend data, 11 (52%) remain
at the same level as their last assessment. Five of these are already on Level 3
or 4.
A total of five companies have moved up at least one level and five have
moved down at least one level. Progress can be observed mostly towards the
bottom of the TPI staircase, while regression is mostly from the top.
Progress is mainly due to explicitly recognising climate change as a business
risk/opportunity, and introducing a policy commitment to act on climate
change. Three of the 4 drops from Level 4 to 3 are due to companies failing to
satisfy the new TPI indicator on disclosure of involvement in trade
associations that are active on climate issues.
0 1 2 3 4
5 1 1 4
1
1
1
4
1
2
41

Management Quality: indicator by indicator
All cement companies we assess acknowledge climate change as as a
significant issue for the business (Q1) and have a policy commitment
to act on climate change (Q3).
Conversely cement companies are weaker than average on all other
indicators, in particular on disclosing involvement in trade
associations engaged on climate issues (Q11), having processes in
place to manage climate-related risks (Q12), incorporating climate
risks/opportunities in company strategy (Q16) and undertaking
climate scenario planning (Q17).
No cement company currently ensures consistency between its
climate change policy and the positions taken by those trade
associations of which it is a member (Q19).
42 0% 10% 20% 30% 40% 50% 60% 70% 80% 90%100%
L0|1. Acknowledge?
L1|2. Recognises as risk/opportunity?
L1|3. Policy commitment to act?
L2|4. Emissions targets?
L2|5. Disclosed Scope 1&2 emissions?
L3|6. Board responsibility?
L3|7. Quantitative emissions targets?
L3|8. Disclosed any Scope 3 emissions?
L3|9. Had operational emissions verified?
L3|10. Support domestic and intl. mitigation?
L3|11.Disclosed trade association involvement?
L3|12. Process to manage climate risks?
L3|13. Disclosed use of product emissions?
L4|14. Long-term emissions targets
L4|15. Incorporated climate change into exec. rem.?
L4|16. Climate risks/opportunities in strategy?
L4|17. Undertakes climate scenario planning?
L4|18. Discloses an internal price of carbon?
L4|19. Consistency between company and trade assocs.?
0% 10% 20% 30% 40% 50% 60% 70% 80% 90%100%
L0|1. Acknowledge?
L1|2. Recognises as risk/opportunity?
L1|3. Policy commitment to act?
L2|4. Emissions targets?
L2|5. Disclosed Scope 1&2 emissions?
L3|6. Board responsibility?
L3|7. Quantitative emissions targets?
L3|8. Disclosed any Scope 3 emissions?
L3|9. Had operational emissions verified?
L3|10. Support domestic and intl. mitigation?
L3|11.Disclosed trade association involvement?
L3|12. Process to manage climate risks?
L3|13. Disclosed use of product emissions?
L4|14. Long-term emissions targets
L4|15. Incorporated climate change into exec. rem.?
L4|16. Climate risks/opportunities in strategy?
L4|17. Undertakes climate scenario planning?
L4|18. Discloses an internal price of carbon?
L4|19. Consistency between company and trade assocs.?

Carbon Performance: alignment with the Paris Agreement benchmarks
The Carbon Performance of cement producers has improved over the past year due to the
introduction of new, long-term targets by ambitious companies, as well as improved disclosure.
The proportion of companies we can assess on Carbon Performance has gone up from 52% in mid-
2018 to 64% now, due to improved disclosure. We can benchmark three Asian companies – Anhui
Conch Cement, Asia Cement and China Resources Cement Holdings – for the first time. However,
disclosure in the cement sector still lags behind other TPI sectors. A feature of the cement sector is
that emissions intensity needs to be disclosed in a particular form developed by the Cement
Sustainability Initiative, and so basic company financial and ESG disclosures do not suffice.
Alignment with the Paris benchmarks has more than doubled from 10% to 23%. This is down to five
companies that have set 2030 targets aligned with at least the Paris Pledges. Ambuja Cements,
Shree Cement and Siam Cement are aligned with the 2C benchmark. LafargeHolcim and
HeidelbergCement are aligned with the Paris Pledges. However, the majority of companies are still
not aligned and cement performs only slightly better than aluminium on Carbon Performance.
43
836%
941%
29%
314%
No Disclosure Not Aligned Paris Pledges
2 Degrees Below 2 Degrees

Alignment of cement producers, scaled by market cap.
Source for market capitalisation: FTSE Russell (31/12/2019), average of last 4 quarters (before investibility weight)
44

Sector focus: paper producers

Key messages – paper
The paper sector performs poorly on Management Quality. Averaging 2.2, it has one of the lowest Management Quality scores among
industrials/materials sectors and among all TPI sectors. Over half of the paper producers we assess are on Level 2 or below, and two
companies, Muda Holdings and Nine Dragons, are on Level 0.
It is notable that less than 40% of paper producers have their operational emissions verified. Only one paper company, UPM-Kymmene,
assures consistency between its climate change policy and the positions taken by trade associations of which it is a member.
The paper sector has shown little improvement in Management Quality. Although four companies moved up at least one level, two
companies moved down one level. However, UK paper maker Mondi is now the first industrials/materials company to receive a 4* rating.
In contrast to their Management Quality, the Carbon Performance of paper companies is relatively strong, with over half of the companies
projected to be aligned with the Paris Pledges in 2030. Moreover, 28% of companies will be aligned with the Below 2C benchmark in 2030.
Alignment is either achieved through ambitious emissions reduction targets, or because current emissions intensities are already below
what is required in 2030. The paper sector is the second-best TPI sector on Carbon Performance.
46

Management Quality levelCompanies’ Management Quality ratings may not always reflect their most up-to-date disclosures. TPI updates its assessments once a year.
Level 0
Unaware
Level 1
Awareness
Level 2
Building capacity
Level 3
Integrating into operational decision making
Level 4
Strategic assessment
4 Companies: 22%
4 Companies: 22% Mondi*
Sappi
Stora Enso
UPM-Kymmene
Domtar
DS Smith
International Paper
Oji
4 Companies: 22%
4 Companies: 22% CMPC
Ence Energia y Celulosa
Nippon Paper
Suzano
2 Companies: 11% Daio
Hokuetsu
Lee & Man
Shandong Chenming
Muda Holdings
Nine Dragons
47

Management Quality level
This is TPI’s third assessment of the paper sector. We now assess the
sector’s 18 largest publicly owned companies, selected on the basis of
market capitalisation.
The average Management Quality score of the paper companies
assessed is 2.2, marginally up from 2.1 last year. This puts the average
company between Level 2, building capacity, and Level 3, integrating
climate change into operational decision making.
This is the lowest average Management Quality score of any
industrials/materials sector. In fact, the paper sector is one of the worst
performing sectors on Management Quality in the TPI database at
present. More than half of companies are on Level 2 or below.
That said, there are some high performers in the sector, with eight
companies on Levels 3 or 4, including one 4* company.
48
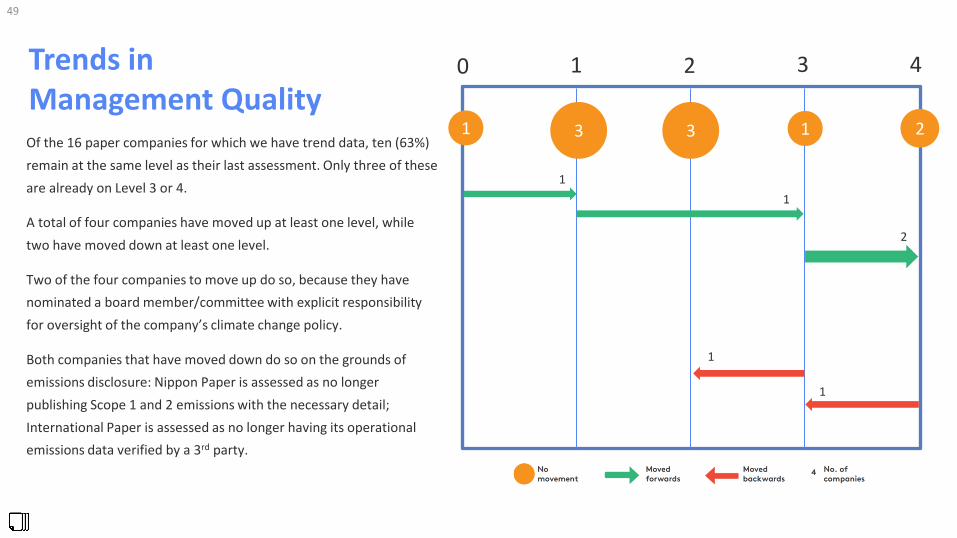
Trends inManagement QualityOf the 16 paper companies for which we have trend data, ten (63%)
remain at the same level as their last assessment. Only three of these
are already on Level 3 or 4.
A total of four companies have moved up at least one level, while
two have moved down at least one level.
Two of the four companies to move up do so, because they have
nominated a board member/committee with explicit responsibility
for oversight of the company’s climate change policy.
Both companies that have moved down do so on the grounds of
emissions disclosure: Nippon Paper is assessed as no longer
publishing Scope 1 and 2 emissions with the necessary detail;
International Paper is assessed as no longer having its operational
emissions data verified by a 3rd party.
49
0 1 2 3 4
31 1 2
1
1
1
1
3
2

Management Quality: indicator by indicatorIn keeping with the sector’s low average Management Quality, paper
companies perform relatively poorly on almost all of TPI’s individual
Management Quality indicators.
This is particularly true for:
• explicitly recognising climate change as a business risk/opportunity
(Q2);
• disclosing and verifying emissions data (Qs 5 & 9);
• Setting long-term, quantified emissions reduction targets (Q14);
• Incorporating climate change into executive remuneration (Q15).
However, paper companies are more likely than the average TPI
company to disclose their membership and involvement in trade
associations engaged in climate issues (Q11).
50 0% 10% 20% 30% 40% 50% 60% 70% 80% 90%100%
L0|1. Acknowledge?
L1|2. Recognises as risk/opportunity?
L1|3. Policy commitment to act?
L2|4. Emissions targets?
L2|5. Disclosed Scope 1&2 emissions?
L3|6. Board responsibility?
L3|7. Quantitative emissions targets?
L3|8. Disclosed any Scope 3 emissions?
L3|9. Had operational emissions verified?
L3|10. Support domestic and intl. mitigation?
L3|11.Disclosed trade association involvement?
L3|12. Process to manage climate risks?
L3|13. Disclosed use of product emissions?
L4|14. Long-term emissions targets
L4|15. Incorporated climate change into exec. rem.?
L4|16. Climate risks/opportunities in strategy?
L4|17. Undertakes climate scenario planning?
L4|18. Discloses an internal price of carbon?
L4|19. Consistency between company and trade assocs.?
0% 10% 20% 30% 40% 50% 60% 70% 80% 90%100%
L0|1. Acknowledge?
L1|2. Recognises as risk/opportunity?
L1|3. Policy commitment to act?
L2|4. Emissions targets?
L2|5. Disclosed Scope 1&2 emissions?
L3|6. Board responsibility?
L3|7. Quantitative emissions targets?
L3|8. Disclosed any Scope 3 emissions?
L3|9. Had operational emissions verified?
L3|10. Support domestic and intl. mitigation?
L3|11.Disclosed trade association involvement?
L3|12. Process to manage climate risks?
L3|13. Disclosed use of product emissions?
L4|14. Long-term emissions targets
L4|15. Incorporated climate change into exec. rem.?
L4|16. Climate risks/opportunities in strategy?
L4|17. Undertakes climate scenario planning?
L4|18. Discloses an internal price of carbon?
L4|19. Consistency between company and trade assocs.?

Carbon Performance: alignment with the Paris benchmarks
Unlike Management Quality, the Carbon Performance of the largest publicly
owned companies in the paper sector is relatively good.
The paper sector is the second-best TPI sector on Carbon Performance. For the
first time, over half (56%) of the paper producers we assess are aligned with the
Paris Pledges, at least. This makes up nearly half of all companies aligned with the
Paris Pledges in industrials/materials.
Five out of 18 companies are aligned with the Below 2C benchmark over the
whole research period. Five more companies are aligned with the Paris Pledges in
2030. Half of the aligned companies are on the basis of current emissions or 2020
targets, rather than 2030 targets. CMPC, DS Smith, Stora Enso and UPM-
Kymmene have the most ambitious targets.
Three Asian paper companies improved disclosure and can be benchmarked for
the first time: Daio Paper, Lee & Man Paper Manufacturing and Nine Dragons
Paper Industries.
51
316%
528%
528%
528%
No Disclosure Not Aligned Paris Pledges
2 Degrees Below 2 Degrees

Source for market capitalisation: FTSE Russell (31/12/2019), average of last 4 quarters (before investibility weight)
Alignment of paper producers, scaled by market cap.
52
Muda Holdings

Sector focus: chemical companies

Key messages – chemicals
This is our first assessment of the chemicals sector. We assess the 20 largest publicly owned companies active in the production of chemicals, selected
on the basis of market capitalisation, as well as one additional large chemical company that is part of the CA100+ initiative. We focus on Management
Quality.
We find that the sector performs well on Management Quality, with the average chemicals company above the average company in other
industrials/materials sectors and in our database as a whole. In fact, chemicals outperforms every principal TPI sector we assess. 81% of companies are
already on Level 3 or 4 and the average level is 3.0. This means that the average chemicals company has already integrated climate change into
operational decision making and is beginning to take a more strategic approach to climate change.
However, despite the sector’s strong performance on Management Quality, there is no 4* company. Although the sector performs well on many
indicators, it is relatively weak on the most advanced indicators. For example, only 19% of companies undertake climate scenario planning. The largest
chemicals company by market capitalisation, DowDuPont, is only on Level 1.
The chemical sector is characterised by a complex, heterogeneous array of products and production processes, making Carbon Performance assessment
difficult. While chemical companies readily disclose aggregate emissions, more granular emissions and production data would be required to normalise
company emissions using a physical intensity measure. That level of detail is not currently provided.
54

Management Quality levelCompanies’ Management Quality ratings may not always reflect their most up-to-date disclosures. TPI updates its assessments once a year.
Level 0
Unaware
Level 1
Awareness
Level 2
Building capacity
Level 3
Integrating into operational decision making
Level 4
Strategic assessment
7 Companies: 33%
10 Companies: 48% Air Liquide
Air Products And Chemcom
BASF
Ecolab
Intl Flavours & Fragrances
Sasol
Toray Industries
Asahi Kasei
Celanese
Covestro
Givaudan
LG Chemical
LyondellBasell Industries
Nan Ya Plastics
PPG Industries
Royal DSM
Shin-Etsu Chemical
2 Companies: 10%
2 Companies: 10% Formosa Chemicals & Fibre
Formosa Plastics
0 Companies: 0% DowDuPont
Nutrien
55

Management Quality level
This is TPI’s first assessment of the chemicals sector. We now assess the
sector’s 20 largest publicly owned companies, selected on the basis of
market capitalisation, as well as one CA100+ focus company (Toray
Industries).
The average Management Quality score of chemical companies is 3.0,
making it the best performing of the TPI’s principal sectors, slightly ahead
of automobile manufacturers and electricity utilities. The average
company has already integrated climate change into operational decision
making and is starting to take more strategic actions.
Almost 90% of companies are already on Level 3 or 4, highlighting the
strong performance of this sector.
That said, there are some low performers in the sector. In particular,
DowDuPont, the world’s largest chemical company by market
capitalisation, is only on Level 1. No company currently satisfies all
Management Quality criteria, which would earn a 4* rating.
56
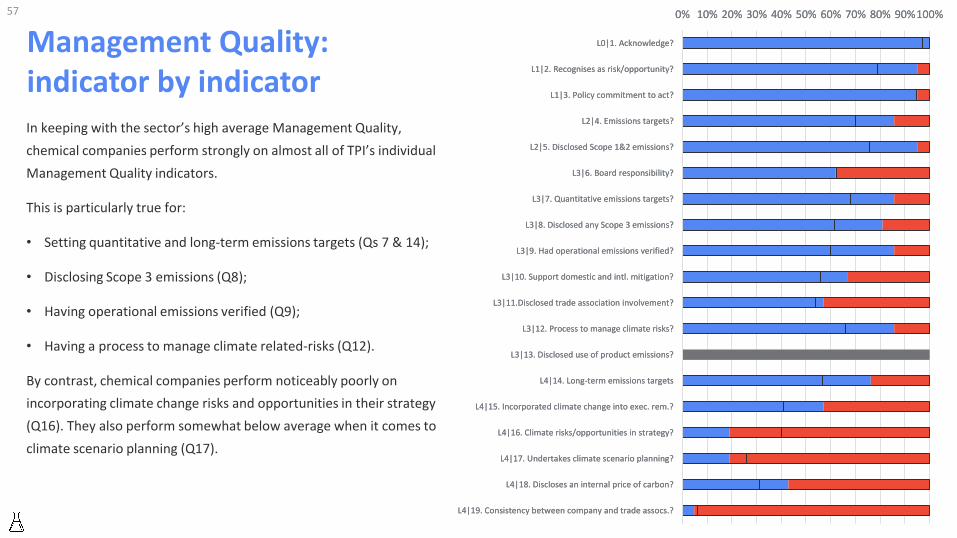
Management Quality: indicator by indicatorIn keeping with the sector’s high average Management Quality,
chemical companies perform strongly on almost all of TPI’s individual
Management Quality indicators.
This is particularly true for:
• Setting quantitative and long-term emissions targets (Qs 7 & 14);
• Disclosing Scope 3 emissions (Q8);
• Having operational emissions verified (Q9);
• Having a process to manage climate related-risks (Q12).
By contrast, chemical companies perform noticeably poorly on
incorporating climate change risks and opportunities in their strategy
(Q16). They also perform somewhat below average when it comes to
climate scenario planning (Q17).
57 0% 10% 20% 30% 40% 50% 60% 70% 80% 90%100%
L0|1. Acknowledge?
L1|2. Recognises as risk/opportunity?
L1|3. Policy commitment to act?
L2|4. Emissions targets?
L2|5. Disclosed Scope 1&2 emissions?
L3|6. Board responsibility?
L3|7. Quantitative emissions targets?
L3|8. Disclosed any Scope 3 emissions?
L3|9. Had operational emissions verified?
L3|10. Support domestic and intl. mitigation?
L3|11.Disclosed trade association involvement?
L3|12. Process to manage climate risks?
L3|13. Disclosed use of product emissions?
L4|14. Long-term emissions targets
L4|15. Incorporated climate change into exec. rem.?
L4|16. Climate risks/opportunities in strategy?
L4|17. Undertakes climate scenario planning?
L4|18. Discloses an internal price of carbon?
L4|19. Consistency between company and trade assocs.?
0% 10% 20% 30% 40% 50% 60% 70% 80% 90%100%
L0|1. Acknowledge?
L1|2. Recognises as risk/opportunity?
L1|3. Policy commitment to act?
L2|4. Emissions targets?
L2|5. Disclosed Scope 1&2 emissions?
L3|6. Board responsibility?
L3|7. Quantitative emissions targets?
L3|8. Disclosed any Scope 3 emissions?
L3|9. Had operational emissions verified?
L3|10. Support domestic and intl. mitigation?
L3|11.Disclosed trade association involvement?
L3|12. Process to manage climate risks?
L3|13. Disclosed use of product emissions?
L4|14. Long-term emissions targets
L4|15. Incorporated climate change into exec. rem.?
L4|16. Climate risks/opportunities in strategy?
L4|17. Undertakes climate scenario planning?
L4|18. Discloses an internal price of carbon?
L4|19. Consistency between company and trade assocs.?

Disclaimer1. All information contained in this report and on the TPI website is derived from publicly
available sources and is for general information use only. Information can change without
notice and The Transition Pathway Initiative does not guarantee the accuracy of information in
this report or on the TPI website, including information provided by third parties, at any
particular time.
2. Neither this report nor the TPI website provides investment advice and nothing in the report or
on the site should be construed as being personalised investment advice for your particular
circumstances. Neither this report nor the TPI website takes account of individual investment
objectives or the financial position or specific needs of individual users. You must not rely on
this report or the TPI website to make a financial or investment decision. Before making any
financial or investment decisions, we recommend you consult a financial planner to take into
account your personal investment objectives, financial situation and individual needs.
3. This report and the TPI website contain information derived from publicly available third party
websites. It is the responsibility of these respective third parties to ensure this information is
reliable and accurate. The Transition Pathway Initiative does not warrant or represent that the
data or other information provided in this report or on the TPI website is accurate, complete or
up-to-date, and make no warranties and representations as to the quality or availability of this
data or other information.
4. The Transition Pathway Initiative is not obliged to update or keep up-to-date the information
that is made available in this report or on its website.
5. If you are a company referenced in this report or on the TPI website and would like further
information about the methodology used in our publications, or have any concerns about
published information, then please contact us. An overview of the methodology used is
available on our website.
6. Please read the Terms and Conditions which apply to use of the website.
For the avoidance of doubt, clause 3.3 of the LSE Terms and Conditions shall be varied and
replaced by the following clause:
3.3. You may download information from the Website for personal or commercial use. In the
event of any copying, redistribution or publication of copyright material, no changes in or
deletion of author attribution, trademark legend or copyright notice shall be made. You
acknowledge that you do not acquire any ownership rights by downloading copyright material.
58


