+ All Categories
Home > Documents > Industry Perspective on Lifecycle Management and...

Industry Perspective on Lifecycle Management and...

Date post: 01-Aug-2018
Category:
Upload: vohanh
View: 216 times
Download: 0 times
Share this document with a friend
31
Building the Best title here 1 Industry Perspective on Lifecycle Management and Post-Approval Changes Focus on Quality by Design FDA/PQRI Conference on Evolving Product Quality Sep. 16-17, 2014 Michael Kimball Executive Director, Transdermal Development Actavis plc Salt Lake City, Utah
Transcript

Building the Best title here

1

Industry Perspective on Lifecycle Management and Post-Approval Changes Focus on Quality by Design

FDA/PQRI Conference on Evolving Product Quality Sep. 16-17, 2014 Michael Kimball Executive Director, Transdermal Development Actavis plc Salt Lake City, Utah

2

Disclaimer

The views expressed herein are strictly those of the presenter and are not necessarily

the views of Actavis plc or its affiliates

3

Topics . . .

Scientific Perspective on Prior-Approval Supplement Process (PAS)

Quality by Design

Prior Knowledge

Quality Target Product Profile (QTPP)

Risk Assessment

Examples

Equipment Change Case Study - Drying Oven

A Transdermal Patch Case Study

Process Analytical Technology (PAT) Case Study
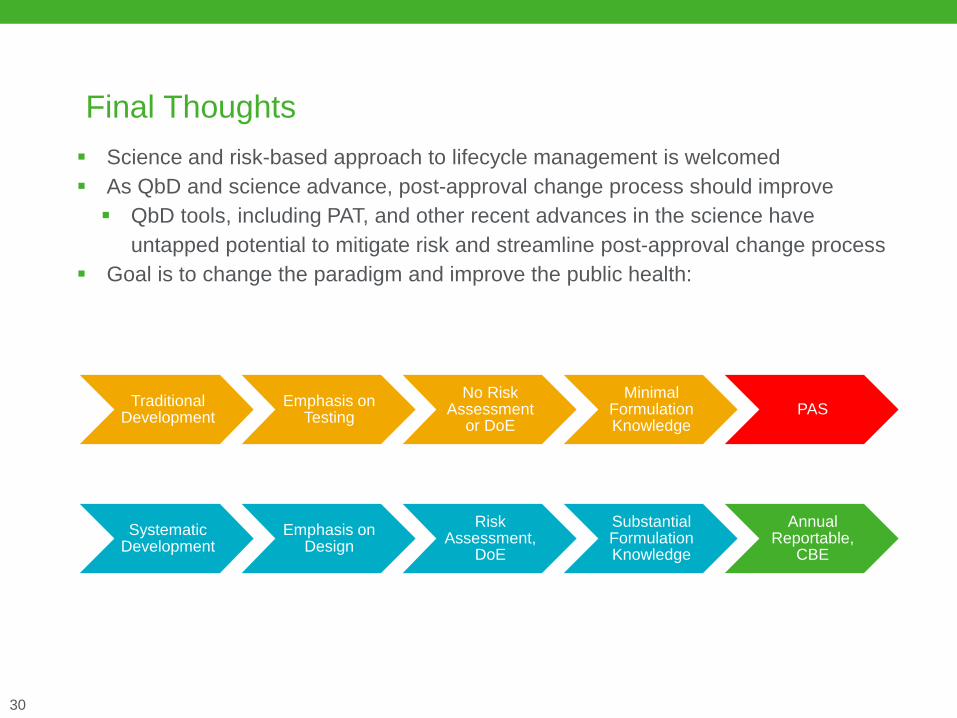
Final Thoughts

4

“Resting on what's considered great has always been a

recipe for decline.”

- Robert K. Cooper

5

Post-Approval Changes – Scientific Perspective

“Simply stated: Is the drug product made after the change equivalent to the drug product made before the change?” -- Guidance for Industry: Changes to an Approved NDA or ANDA (2004)

Science and Risk-Based Approach

Future of Guidances (SUPAC, etc.)?

Dosage Form Complexity

Modified Release

QbD Integration with Post-Approval Change Process

QTPP

Risk Assessment

PAT

Other Tools

6

QbD Definition

QbD defined: “A systematic approach to

development that begins with predefined

objectives and emphasizes product and

process understanding and process control,

based on sound science and quality risk

management.” (ICH Q8)

7

Overview of QbD

Target Design and Implementation

Understanding

Labeled Use

Safety and Efficacy

(TPP)

DEFINE Quality Target

Product Profile (QTPP)

DESIGN Formulation

and Process

IDENTIFY Key Quality

Attributes, Raw

Material Attributes and

Process Parameters

CONTROL

Materials and

Process

Lawrence Yu. Pharm. Res. 25:781-791 (2008)

8

QbD, Scale-up, and Product Lifecycle

Business /

Therapeutic Need

Target Product

Profile

Quality Target

Product Profile

Process Design /

Experimentation

Risk

Management /

Control Strategy

Lab-Scale /

Formulation

Pilot Plant

Commercial

Plant

TPP Elements

Patient / Consumer Population

Labeling

Indication

Dosage Form

Route of Administration

QTPP Elements

Design Elements

CQA’s

CMP’s

Risk Assessment

Iterative Process

· Re-assess risk

· Design Space

Prior Knowledge

Design of

Experiments

Modelling

Pilot Plant Scale-up

R&D Focus

Post-Approval

· Lifecycle management

· Continual improvement

9

Quality by Design

Complex / modified release dosage forms especially benefit from QbD

Quality Target Product Profile (QTPP)

Cornerstone of QbD

Generics: Design for Equivalence

Should include clinically-relevant specifications

Importance of prior knowledge

Comprehensive and appropriate

Framework of change assessment

Regulatory and scientific perspective

10

QTPP: Appropriate and Comprehensive?

Scope of QTPP As Defined

11

QTPP: Appropriate and Comprehensive?

Prior knowledge

Risk assessment

Appropriate process and product

characterization

May evolve during development

12

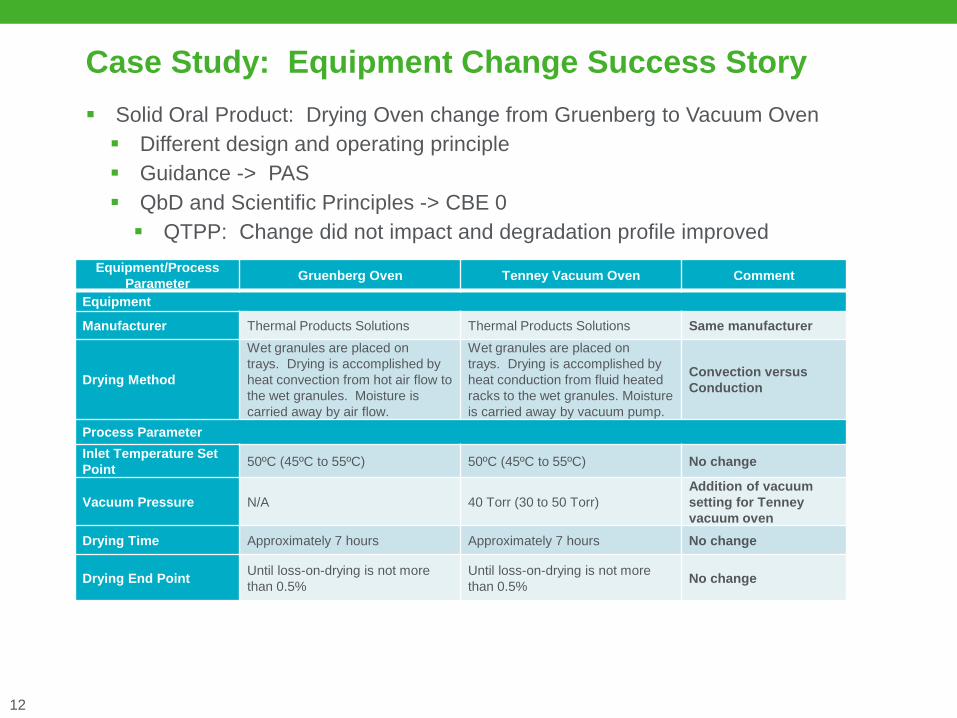
Case Study: Equipment Change Success Story

Solid Oral Product: Drying Oven change from Gruenberg to Vacuum Oven

Different design and operating principle

Guidance -> PAS

QbD and Scientific Principles -> CBE 0

QTPP: Change did not impact and degradation profile improved

Equipment/Process

Parameter Gruenberg Oven Tenney Vacuum Oven Comment

Equipment

Manufacturer Thermal Products Solutions Thermal Products Solutions Same manufacturer

Drying Method

Wet granules are placed on

trays. Drying is accomplished by

heat convection from hot air flow to

the wet granules. Moisture is

carried away by air flow.

Wet granules are placed on

trays. Drying is accomplished by

heat conduction from fluid heated

racks to the wet granules. Moisture

is carried away by vacuum pump.

Convection versus

Conduction

Process Parameter

Inlet Temperature Set

Point 50ºC (45ºC to 55ºC) 50ºC (45ºC to 55ºC) No change

Vacuum Pressure N/A 40 Torr (30 to 50 Torr)

Addition of vacuum

setting for Tenney

vacuum oven

Drying Time Approximately 7 hours Approximately 7 hours No change

Drying End Point Until loss-on-drying is not more

than 0.5%

Until loss-on-drying is not more

than 0.5% No change

13

Case Study: Transdermal Patch (Hypothetical)

14

Background: Side View of a Typical

Transdermal Patch

Backing Film

Release Liner

Drug Reservoir Adhesive Layer

(Adhesive A)

Skin-Contact Adhesive Layer

(Adhesive B)

Each adhesive contains several constituents (i.e., polymers, diluent, tackifier, etc.)

Consider: post-approval change: removal of minor constituent from Adhesive A

In addition to Design Space, QbD-based development introduces other tools

that have potential to reduce regulatory burden

15

Example QTPP: Transdermal Patch

QTTP Element Target Measure of Equivalency: Post-Change

Active Ingredient Match RLD Unchanged

Dosage Form

Film,

Controlled

Release

Unchanged

Dosage Form

Appearance and

Characteristics

Similar to RLD Unchanged

Patch,

rectangular Unchanged

Route of

Administration Transdermal Unchanged

Dosage Strength Match RLD Unchanged

Container

Closure System

Equivalent to

RLD Unchanged

16

Example QTPP: Transdermal Patch, cont’d QTTP Element Target Measure of Equivalency: Post-Change

Drug Product

and Quality

Attributes

Appearance

Continued compliance with established specifications

Assay

Content

Uniformity

Identity

Residual

Solvents

Degradation

Liner Peel

Physical Tests

Drug Release

Microbial Limits

Cold Flow

Stability

At least 24 month

shelf life at 25˚C

(15 – 30˚C

permitted)

QbD - > Excipient compatibility, formulation challenge studies:

mechanistic understanding of degradation pathway(s)

Bioequivalence

1. Non-inferior

Adhesion

2. Non-inferior

Irritation/

Sensitization

3. Equivalent PK

Profile

1. Skin-contact adhesive is unchanged; lab assessment of patch

integrity

2. (see 1, and no components added)

3. In-vitro Franz cell testing (cadaver skin and/or synthetic

membranes)

17

Formulation Understanding is Increasing

QbD -> Excipient Compatibility or Similar Formulation Challenge Studies

Mechanistic understanding of degradation and role each excipient plays

Stability documentation required?: “Customized based on risk assessment and

product sensitivities.” [1] (context of PAT)

Repeat excipient compatibility with modified adhesive?

(Simulated) Excipient Compatibility: Total Impurities and Degradation

Products, %

Time API +

Adhesive A

API +

Adhesive B

API +

Backing API + Liner API

Zero 0 0 0 0 0

2wk 25C 0 0 0 0 0

2wk 40C 0 0 0 0 0.4

2wk 60C 2.6 2.7 2.7 2.1 3.2

4wk 25C 0 0 0 0 0

4wk 40C 1.8 1.4 0.8 1.1 1.6

4wk 60C 4.3 4.2 4.1 4.5 3.9

1. Van Buskirk, et.al. Best Practices for the Development, Scale-up, and Post-approval

Change Control of IR and MR Dosage Forms in the Current Quality-by-Design Paradigm.

AAPS Pharmscitech Vol 15 no 3, June 2014

18

In Vitro Release Testing (Franz Cell): API Diffusion

through Cadaver Skin, Before and after Change

0 3 6 9 12 15 18 21 24

Inte

rval

Flu

x (

µg

/cm

²/h

r)

Time (hrs)

Demonstrates non-

criticality of change

Advances in IVRT

Synthetic

Membranes

19

Risk Assessment

QTTP Element Target Measure of Equivalency and Risk: Post-Change Risk Assessment

Active

Ingredient Match RLD Unchanged Low

Dosage Form Film, Controlled

Release Unchanged

Low

Dosage Form

Appearance and

Characteristics

Similar to RLD Unchanged Low

Patch,

Rectangular Unchanged

Low

Route of

Administration Transdermal Unchanged

Low

Dosage

Strength Match RLD Unchanged

Low

Stability

At least 24

month shelf life

at 25˚C (15 –

30˚C permitted)

QbD - > Excipient compatibility, formulation challenge

studies: mechanistic understanding of degradation

pathway(s)

Low

Bioequivalence

1. Non-inferior

Adhesion

2. Non-inferior

Irritation/

Sensitization

3. Equivalent

PK Profile

1. Skin-contact adhesive is unchanged; lab assessment of

patch integrity

2. (see 1, and no components added)

3. In-vitro Franz cell testing (cadaver skin and/or

synthetic membranes)

Low

20

Risk Assessment

QTTP

Element Target Measure of Equivalency and Risk: Post-Change Risk Assessment

Drug

Product

and

Quality

Attributes

Appearance

Continued compliance with established specifications Low

Assay

Content Uniformity

Identity

Residual Solvents

Degradation

Liner Peel

Physical Tests

Drug Release

Microbial Limits

Cold Flow

Container

Closure

System

Equivalent to RLD Unchanged Low

21

The Point Being . . .

Industry is embracing the tools offered by QbD-based development, meaningful and

intelligent risk assessment, and other recent advances in the science, which provide an

improved framework to reassess change guidance

“Mechanistic understanding and review of formulation design could reduce the need for

testing and expand the design space beyond past experience.” (emphasis mine) (R.

Lionberger)

How will this look moving forward?

PQRI white paper on IR and MR Dosage Forms (June, 2014)

22

Use of Process Analytical Technology (PAT) to Mitigate

Risk for Scale-up, Site Change, and Equipment Change

OPQ: “Innovation is not increasing” [1]

Various uses in oral formulation processes

Endpoint semi-solid/liquid mixing processes

Solvent coating / extrusion processes (patches, oral thin films, etc.)

Others

1. Iser, Robert. Office of Pharmaceutical Quality. Global Drug Development and its Impact on CDER’s Drug

Review Process Symposium, June, 2014
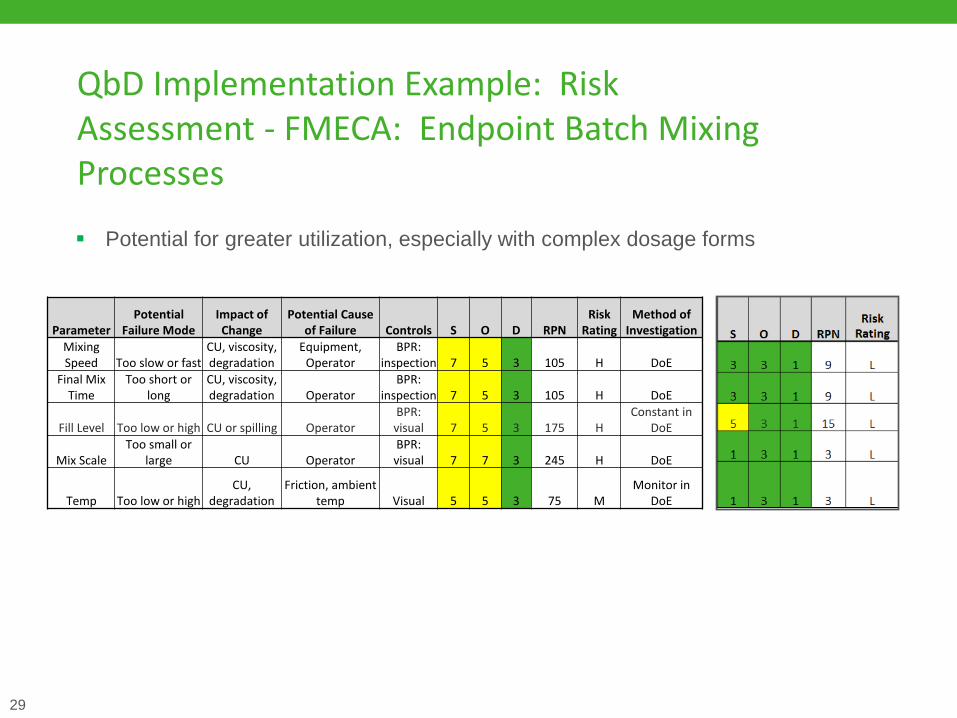
23

Endpoint Mixing Processes: Key Measures

Homogeneity

Viscosity

Time to dissolve or disperse components

Lends itself to Process Analytical Technology (PAT)

24

Case Study: Realizing PAT in Process Development by Implementation of NIRS: Mitigate Risk for Scale-up, Site Change, and Equipment Change Work published in Sep/Oct 2013 issue of Pharmaceutical Engineering (Fowler, et. al.)

25

Hydrogel Mixing: Realizing PAT in Process Development by Implementation of NIRS

IR spectrums recorded for each raw material

- Can be used for release, reference, investigations

26

Case Study: Realizing PAT in Process Development by

Implementation of NIRS

Flat spectrum = homogeneity

Viscosity prediction / modeling

27

Case Study: Realizing PAT in Process Development by Implementation of NIRS

Stage Pre-PAT

Process Mix #1 Mix #2 Mix #3

Stage 1 30 mins 21 mins 15 mins 22 mins

Stage 2 30 mins 28 mins 17 mins 4 mins

Stage 4 15 mins 12 mins 11 mins 5 mins

Cumulative Mix

Time 75 mins 61 mins 43 mins 31 mins

% of Control Mix

Time N/A 81% 57% 41%

Viscosity (cP) N/A 1,435 ~1,485 N/A

Result: Increased Process Understanding and Efficiency

Uniformity controlled via scale-independent method (NIR) =>

Mitigation of reporting requirement for significant scale or site change?

28

Industry is embracing PAT – including generic Gx R&D

Great potential for risk mitigation in a variety of process, equipment, scale-up, and

site change scenarios

Consideration of PAT in lifecycle management and future/ongoing discussion of

change guidance

Perspective on Process Analytical Technology

29

QbD Implementation Example: Risk Assessment - FMECA: Endpoint Batch Mixing Processes

Parameter Potential

Failure Mode Impact of Change

Potential Cause of Failure Controls S O D RPN

Risk Rating

Method of Investigation

Mixing Speed Too slow or fast

CU, viscosity, degradation

Equipment, Operator

BPR: inspection 7 5 3 105 H DoE

Final Mix Time

Too short or long

CU, viscosity, degradation Operator

BPR: inspection 7 5 3 105 H DoE

Fill Level Too low or high CU or spilling Operator BPR: visual 7 5 3 175 H

Constant in DoE

Mix Scale Too small or

large CU Operator BPR: visual 7 7 3 245 H DoE

Temp Too low or high CU,

degradation Friction, ambient

temp Visual 5 5 3 75 M Monitor in

DoE

Potential for greater utilization, especially with complex dosage forms

30

Final Thoughts

Science and risk-based approach to lifecycle management is welcomed

As QbD and science advance, post-approval change process should improve

QbD tools, including PAT, and other recent advances in the science have

untapped potential to mitigate risk and streamline post-approval change process

Goal is to change the paradigm and improve the public health:

Traditional Development

Emphasis on Testing

No Risk Assessment

or DoE

Minimal Formulation Knowledge

PAS

Systematic Development

Emphasis on Design

Risk Assessment,

DoE

Substantial Formulation Knowledge

Annual Reportable,

CBE

31

Thank You

Acknowledgements

PQRI

Gordon Johnston

Susan Rosencrance, U.S. Food and Drug Administration

Francois Menard, (former) Vice President, R&D, Watson Pharmaceuticals

Janie Gwinn, Director, Regulatory Affairs, Actavis plc

Michael Fowler, Principal Engineer, Actavis plc


Recommended