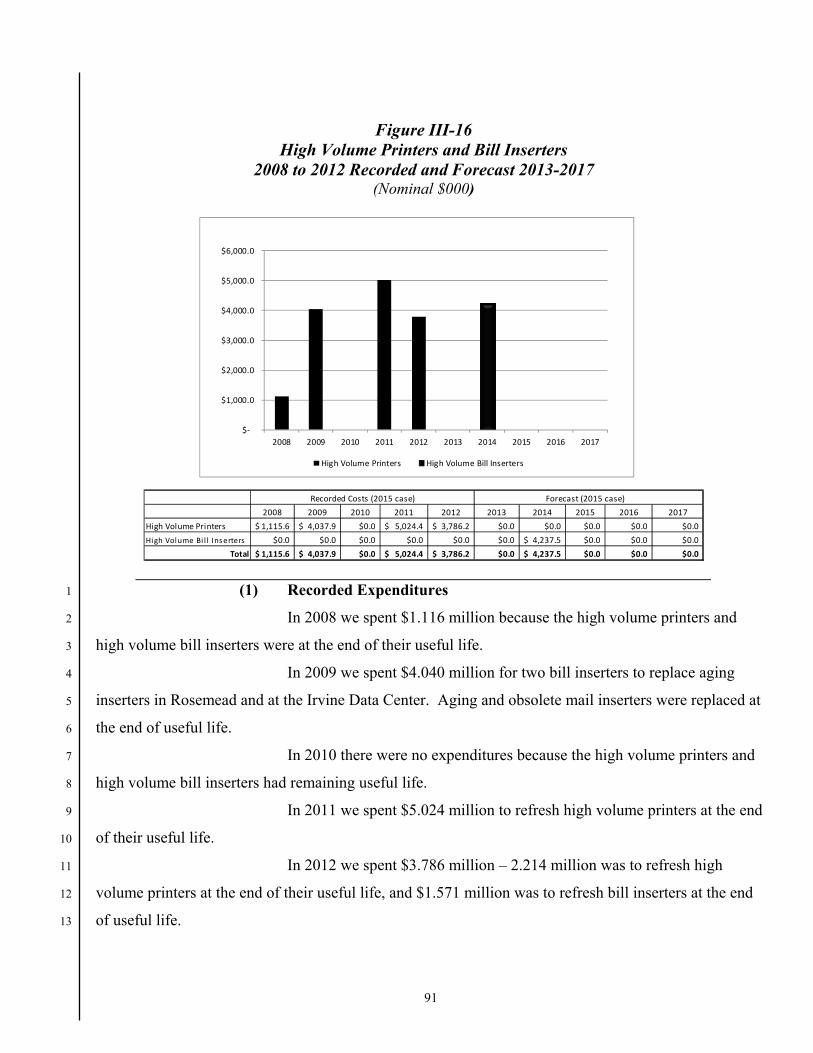
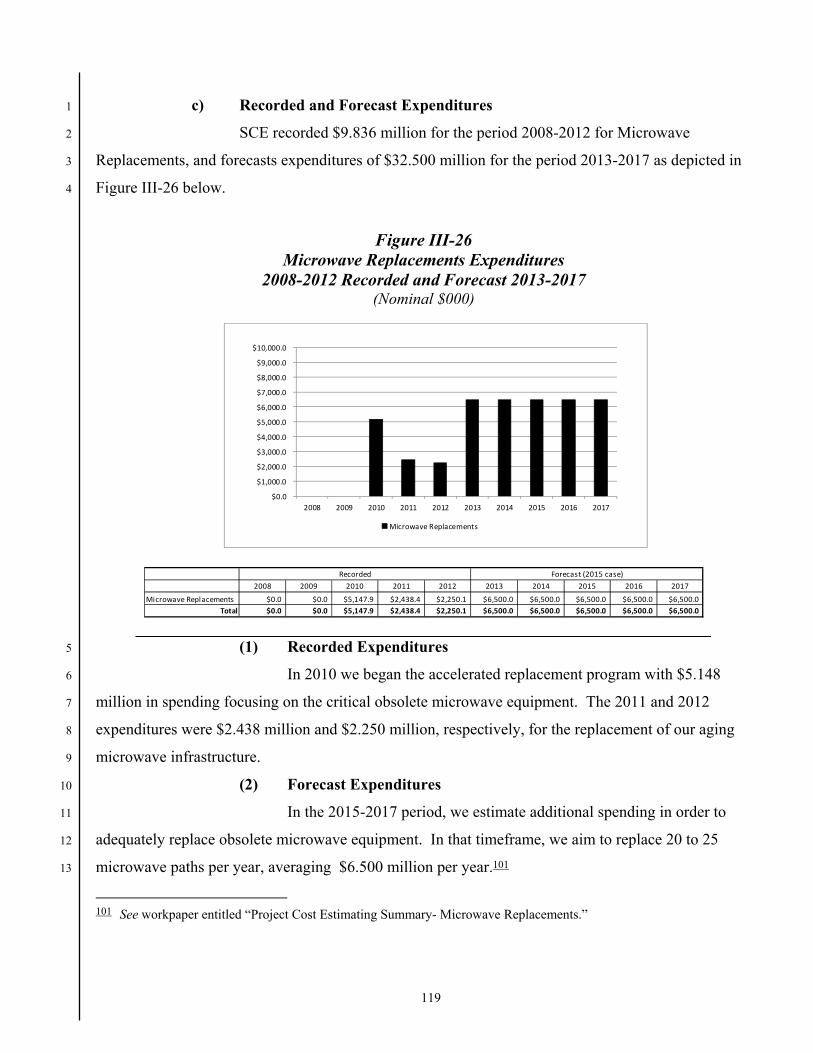
Application No.: Exhibit No.: SCE-05, Vol. 01 Witnesses: C. Carazo
J. Castleberry G. Haddox T. Inlander J. Kelly K. Sweetser
(U 338-E)
2015 General Rate Case
Information Technology (IT) Volume 1 – Overview, O&M and Capital
Before the
Public Utilities Commission of the State of California
Rosemead, CaliforniaNovember 2013
Summary
Information Technology Operating Unit (IT) forecasts capital hardware expenditures of $788.273 million for 2013-2017 and a total of $235 million in operation and maintenance (O&M) expenses1 for Test Year 2015.
The O&M 2015 expense level reflects required costs for the following:
Strengthening Cyber Security
Growth in Software License & Maintenance Agreements
Incremental O&M to support new capitalized software applications
The capital expenditures will support hardware refresh, growth, disaster recovery, and regulatory requirements.
IT provides support services that directly contribute to SCE’s ability to deliver reliable electric service at a reasonable cost, while maintaining a safe work environment for our employees and complying with current and evolving laws and regulations.
IT maintains thousands of miles of fiber optic cable and microwave communication paths in order to support SCE’s business and data communications needs throughout its 50,000 square mile service territory.
IT proactively prevents security incidents from disrupting business operations, while allowing employees, business partners, and other entities access to SCE over the Internet and other cyber gateways.
IT faces major challenges, such as the evolving regulatory environment and the continued pace of technological change.
1 IT’s O&M forecast reflects savings for supporting SCE’s Operational Excellence (OpX) Goal as discussed in the
Overview section of this testimony.
SCE 05: Information Technology Volume 1 - Overview, O&M and Capital
Table Of Contents
Section Page Witness
-i-
I. OVERVIEW ......................................................................................................1 T. Inlander
A. Summary of Request ..............................................................................1
1. Capital summary ........................................................................1
2. O&M Summary .........................................................................2
B. Support For SCE’s Operational Excellence (OpX) Goal ......................3
C. The Continuing Challenge of Cybersecurity .........................................5
D. Changes to the IT Operating Unit ..........................................................6
E. Commission directives from the 2012 GRC Final Decision .................7
II. OPERATIONS & MAINTENANCE (O&M) EXPENSES ..............................9
A. Development of O&M Test Year Estimate ...........................................9
1. Historical Adjustments...............................................................9
2. Methodologies............................................................................9
B. Infrastructure Technology Services .....................................................10 C. Carazo
1. Infrastructure Technology Services Division (ITS) .................10
a) Infrastructure Technology Services .............................10
b) Automation Services Group .........................................11
c) Computing Services Group ..........................................13
d) Grid Services Group ....................................................15
e) Service Operations Group ............................................17
f) Service Management and Planning Group ..................19
2. Analysis of Operations & Maintenance Expense by FERC Account .........................................................................21
a) FERC Account 920/921 – ITS .....................................21
SCE 05: Information Technology Volume 1 - Overview, O&M and Capital
Table Of Contents (Continued)
Section Page Witness
-ii-
(1) Analysis of Recorded Cost...............................21
(2) Estimating Methodology and Test Year Forecast ...................................................22
(3) Analysis of Recorded Cost...............................24
(4) Estimating Methodology and Test Year Forecast ...................................................26
b) FERC Account 931- Infrastructure Technology Services ....................................................26
(1) Analysis of Recorded Cost...............................28
(2) Estimating Methodology And Test Year Forecast ...................................................29
C. Technology Delivery & Maintenance Division ...................................29 J. Castleberry
1. Technology Delivery &Maintenance Division (TDM) ......................................................................................29
a) Description of Activities ..............................................29
b) Technology Solutions by Operating Unit: ...................30
(1) Enterprise Asset Management Solutions Group ...............................................30
(2) Supply and Operations Solutions Group ...............................................................31
(3) Human Capital Management and Compliance ......................................................31
(4) Energy – Nuclear Solutions Group ..................32
(5) Energy – Non Nuclear Solutions Group ...............................................................32
(6) Finance and Legal Solutions Group .................34
SCE 05: Information Technology Volume 1 - Overview, O&M and Capital
Table Of Contents (Continued)
Section Page Witness
-iii-
(7) Transmission and Distribution Solutions Group ...............................................34
(8) Customer Service Solutions .............................35
(9) Technology Solutions and Support Group ...............................................................37
2. Analysis of Operations & Maintenance Expense by FERC Accounts .......................................................................39
a) FERC Account 920/921 – TDM ..................................39
(1) Analysis of Recorded Costs .............................39
3. Estimating Methodology and Test Year Forecast ....................41
a) Labor Expenses ............................................................42
b) Non-Labor Expenses ....................................................42
c) FERC Account 517 – TDM .........................................43
(1) Analysis of Recorded Costs .............................43
(2) Estimating Methodology and Forecast ............................................................45
D. Cybersecurity & IT Compliance ..........................................................46 G. Haddox
1. Cybersecurity & IT Compliance Division (C&C) ...................46
a) Description of Activities ..............................................46
(1) Cybersecurity Function ....................................47
(2) IT Compliance Function ..................................50
2. Analysis of Operations & Maintenance Expense by FERC Accounts .......................................................................52
a) FERC Account 920/921 – C&C ..................................52
(1) FERC Account 920/921 (C&C) .......................52
SCE 05: Information Technology Volume 1 - Overview, O&M and Capital
Table Of Contents (Continued)
Section Page Witness
-iv-
E. Enterprise Information Management & Architecture ..........................56 J. Kelly
1. Enterprise Information Management & Architecture Division (EIM&A) ...................................................................56
a) Description of Activities ..............................................56
(1) Enterprise Architecture ....................................56
(2) Enterprise Information Management ...............58
(3) Technology Innovation ....................................59
(4) Technology Standards Management ................60
b) Optimization of Experience .........................................60
2. Analysis of O&M Expense for Enterprise Information Management and Architecture: ............................62
a) FERC Account 920/921 – EIM&A..............................62
(1) Analysis of Recorded Costs .............................62
3. Estimating Methodology and Test Year Forecast ....................63
F. Client Services & Planning ..................................................................64 K. Sweetser
1. Client Services & Planning Division (CS&P) .........................64
a) Description of Activities ..............................................64
b) Metrics Measuring Productivity Results from Information Technology Solutions .....................67
2. Analysis of O&M Expenses by FERC Accounts ....................69
a) FERC Account 920/921 – CS&P Client Services and Planning ..................................................69
(1) Analysis of Recorded Cost...............................69
(2) Estimating Methodology and Forecast ............................................................71
SCE 05: Information Technology Volume 1 - Overview, O&M and Capital
Table Of Contents (Continued)
Section Page Witness
-v-
G. Incremental O&M for New Software ..................................................71 J. Castleberry
a) Description of Activities ..............................................71
b) Analysis of O&M Expenses for New Software Application by FERC Account .....................72
(1) FERC Accounts 920/921 – O&M for New Software Applications .............................72
III. CAPITAL EXPENDITURES ..........................................................................75 C. Carazo
A. Hardware Replacement ........................................................................75
1. Overview ..................................................................................75
2. Mainframe Servers ...................................................................77
a) Background ..................................................................77
b) Business Requirements ................................................77
c) Recorded and Forecast Expenditures ...........................78
(1) Recorded Expenditures ....................................78
(2) Forecast Expenditures ......................................79
d) Conclusion ...................................................................80
3. Midrange Enterprise Servers Hardware ...................................80
a) Background ..................................................................80
b) Business Requirements ................................................81
c) Recorded and Forecast Expenditures ...........................81
(1) Recorded Expenditures ....................................82
(2) Forecast Expenditures ......................................83
d) Conclusion ...................................................................84
4. Disk and Tape Storage Refresh................................................84
SCE 05: Information Technology Volume 1 - Overview, O&M and Capital
Table Of Contents (Continued)
Section Page Witness
-vi-
a) Background ..................................................................85
b) Business Requirements ................................................86
c) Recorded and Forecast Expenditures ...........................86
(1) Recorded Expenditures ....................................87
(2) Forecast Expenditures ......................................88
d) Conclusion ...................................................................89
5. High Volume Printers and Bill Inserters Refresh ....................89
a) Background ..................................................................90
b) Business Requirements ................................................90
c) Recorded and Forecast Expenditures ...........................90
(1) Recorded Expenditures ....................................91
(2) Forecast Expenditures ......................................92
d) Conclusion ...................................................................92
6. Personal Computers (PCs) – Desktop/Notebook and Ruggedized Laptops Refresh ...................................................93
a) Background ..................................................................93
b) Business Requirements ................................................94
(1) Office Environment .........................................94
(2) Field Environment ...........................................94
c) Recorded and Forecast Expenditures ...........................95
(1) Recorded Expenditures ....................................97
(2) Forecast Expenditures ......................................97
(3) Ruggedized Laptops .........................................98
SCE 05: Information Technology Volume 1 - Overview, O&M and Capital
Table Of Contents (Continued)
Section Page Witness
-vii-
d) Conclusion .................................................................101
7. Data and Voice Network Replacements ................................101
a) Background ................................................................102
b) Business Requirements ..............................................102
c) Recorded and Forecast Expenditures .........................102
(1) Recorded Expenditures ..................................103
(2) Forecast Expenditures ....................................103
d) Conclusion .................................................................104
8. Transmission Network & Facilities .......................................105
a) Background ................................................................105
b) Business Requirements ..............................................106
c) Recorded and Forecast Expenditures .........................107
(1) Recorded Expenditures ..................................108
(2) Forecast Expenditures ....................................108
d) Conclusion .................................................................109
9. Copper Wire Replacement .....................................................110
a) Background ................................................................110
b) Business Requirements ..............................................111
c) Recorded and Forecast Expenditures .........................112
(1) Recorded Expenditures ..................................113
(2) Forecast Expenditures ....................................114
d) Conclusion .................................................................114
10. Fiber Cable Replacements .....................................................115
SCE 05: Information Technology Volume 1 - Overview, O&M and Capital
Table Of Contents (Continued)
Section Page Witness
-viii-
a) Background ................................................................115
b) Business Requirements ..............................................115
c) Recorded and Forecast Expenditures .........................116
(1) Recorded Expenditures ..................................117
(2) Forecast Expenditures ....................................117
d) Conclusion .................................................................118
11. Microwave Replacements ......................................................118
a) Background ................................................................118
b) Business Requirements ..............................................118
c) Recorded and Forecast Expenditures .........................119
(1) Recorded Expenditures ..................................119
(2) Forecast Expenditures ....................................119
d) Conclusion .................................................................120
12. Mobile Radio System Replacement .......................................120
a) Background ................................................................120
b) Business Requirements ..............................................120
c) Recorded and Forecast Expenditures .........................121
(1) Recorded Expenditures ..................................121
(2) Forecast Expenditures ....................................121
d) Conclusion .................................................................122
B. Risk Management ..............................................................................123
1. Disaster Recovery ..................................................................123
a) Background ................................................................123
SCE 05: Information Technology Volume 1 - Overview, O&M and Capital
Table Of Contents (Continued)
Section Page Witness
-ix-
b) Business Requirements ..............................................124
c) Recorded and Forecast Expenditures .........................124
(1) Recorded Expenditures ..................................125
(2) Forecast Expenditures ....................................126
d) Conclusion .................................................................126
Appendix A Witness Qualifications ................................................................................
SCE 05: Information Technology Volume 1 - Overview, O&M and Capital
List Of Figures
Figure Page
-x-
Figure I-1 2012 Capital GRC Authorized to Actual Recorded ....................................................................2
Figure I-2 2012 O&M GRC Authorized to Actual Recorded ......................................................................3
Figure I-3 IT Operating Unit........................................................................................................................7
Figure II-4 Summary of Operations – Information Technology Services Accounts
920/921 by Labor/Non-Labor/Other Recorded and Adjusted 2008-2012/Forecast
2013-2015 (Constant 2012 $000) .......................................................................................................21
Figure II-5 Summary of Operations –ITS Support for Nuclear Account 517 by
Labor/Non-labor/Other Recorded 2008-2012 /Forecast 2013-2015 (Constant 2012
$000) ....................................................................................................................................................24
Figure II-6 Summary of Operations – Information Technology Services – Rents Account
931 by Labor/Non-labor/Other Recorded 2008-2012 /Forecast 2013-2015 (Constant
2009 $000) ...........................................................................................................................................28
Figure II-7 Summary of Operations –Technology Delivery & Maintenance Accounts
920/921 by Labor/Non-Labor/Other Recorded 2008-2012 / Forecast 2013-2015
(Constant 2012 $000) ...........................................................................................................................39
Figure II-8 Summary of Operations –TDM Support for Nuclear Account 517 by
Labor/Non-labor/Other Recorded 2008-2012 /Forecast 2013-2015 (Constant 2012
$000) ....................................................................................................................................................43
Figure II-9 Summary of Operations –Cybersecurity & IT Compliance Accounts 920/921
by Labor/Non-Labor/Other Recorded 2008-2012 / Forecast 2013-2015 (Constant
2012 $000) ...........................................................................................................................................52
Figure II-10 Summary of Operations –Enterprise Information Management &
Architecture Accounts 920/921 by Labor/Non-Labor/Other Recorded 2008-2012 /
Forecast 2013-2015 (Constant 2012 $000) .........................................................................................62
Figure II-11 Summary of Operations – Client Services & Planning Accounts 920/921 by
Labor/Non-Labor/Other Recorded 2008-2012 / Forecast 2013-2015 (Constant 2012
$000) ....................................................................................................................................................69
SCE 05: Information Technology Volume 1 - Overview, O&M and Capital
List Of Figures (Continued)
Figure Page
-xi-
Figure II-12 Summary of O&M for New Software Applications Accounts 920/921 by
Labor/Non-Labor/Other Recorded 2008-2012 / Forecast 2013-2015 (Constant 2012
$000) ....................................................................................................................................................72
Figure III-13 Mainframe Server Refresh Expenditure Recorded 2008-2012 and Forecast
2013-2017 (Nominal $000).................................................................................................................78
Figure III-14 Midrange Enterprise Server Refresh Expenditure Recorded 2008-2012 and
Forecast 2013-2017 (Nominal $000) ..................................................................................................82
Figure III-15 Disk and Tape Storage Refresh Expenditure Recorded 2008-2012 and
Forecast 2013-2017 (Nominal $000) ..................................................................................................87
Figure III-16 High Volume Printers and Bill Inserters 2008 to 2012 Recorded and
Forecast 2013-2017 (Nominal $000) ..................................................................................................91
Figure III-17 PC's and Related Hardware Expenditures Recorded 2008-2012 and Forecast
2013-2017 (Nominal $000).................................................................................................................95
Figure III-18 Desktop and Laptops in use Recorded 2008-2012 and Forecast 2013-2017
(Nominal $000) ....................................................................................................................................96
Figure III-19 PCs Refresh Units 2008-2012 Recorded and Forecast 2013-2017 ......................................97
Figure III-20 Ruggedized Laptops Budget Requirement 2008-2012 Recorded and
Forecast 2013-2017 (Nominal $000) ..................................................................................................99
Figure III-21 Total Number of Ruggedized Laptops In Use 2008-2009 Recorded and
Forecast 2013-2017 ............................................................................................................................100
Figure III-22 Data and Voice Network Replacement Expenditures 2008-2012 Recorded
and Forecast 2013-2017 (Nominal $000) .........................................................................................103
Figure III-23 Transmission Network and Facilities Expenditures 2008-2012 Recorded
and Forecast 2013-2017 (Nominal $000) .........................................................................................108
Figure III-24 Copper Wire Replacement Expenditures 2008-2012 Recorded and Forecast
2013-2017 (Nominal $000)...............................................................................................................113
Figure III-25 Fiber Optic Cable Replacement Expenditures 2008-2012 Recorded and
Forecast 2013-2017 (Nominal $000) ................................................................................................117
SCE 05: Information Technology Volume 1 - Overview, O&M and Capital
List Of Figures (Continued)
Figure Page
-xii-
Figure III-26 Microwave Replacements Expenditures 2008-2012 Recorded and Forecast
2013-2017 (Nominal $000)...............................................................................................................119
Figure III-27 Mobile Radio System Replacement 2008-2012 Recorded and Forecast
2013-2017 (Nominal $000)................................................................................................................121
Figure III-28 Disaster Recovery 2008-2012 Recorded and Forecast 2013-2017 (Nominal
$000) ..................................................................................................................................................125
SCE 05: Information Technology Volume 1 - Overview, O&M and Capital
List Of Tables
Table Page
-xiii-
Table I-1 SCE – IT Summary of Capital Request (Nominal $000,000) .....................................................1
Table I-2 IT O&M Request for 2015 (Constant 2012 $000,000) ................................................................3
Table II-3 O&M Forecast Approach by Division (by FERC Account) (Constant 2012
$000) ....................................................................................................................................................10
Table II-4 Comparison Table for FERC Account 920/921 Recorded/Adjusted 2012 to
2015......................................................................................................................................................22
Table II-5 Comparison Table for FERC Account 517 Recorded/Adjusted 2012 to 2015 .........................26
Table II-6 Comparison Table for FERC Account 931 Recorded/Adjusted 2012 to 2015 .........................29
Table II-7 Technology Delivery & Maintenance Comparison Table for FERC Account
920/921 Recorded/Adjusted 2012 to 2015 ..........................................................................................41
Table II-8 Technology Delivery & Maintenance Comparison Table for FERC Account
517 Recorded/Adjusted 2012 to 2015..................................................................................................45
Table II-9 Cybersecurity & Compliance Comparison Table for FERC Account 920/921
Recorded / Adjusted 2012 to 2015.......................................................................................................54
Table II-10 Enterprise Information Management and Architecture Comparison Table for
FERC Account 920/921 Recorded/Adjusted 2012 to Test Year 2015 (Constant 2012
$000) ....................................................................................................................................................63
Table II-11 Client Services & Planning Comparison Table for FERC Account 920/921
Recorded/Adjusted 2012 to Test Year 2015 (Constant 2012 $000) ....................................................71
Table II-12 Incremental O&M for New Software Comparison Table for FERC Account
920/921 Recorded/Adjusted 2012 to Test Year 2015 (Constant 2012 $000) ......................................73
Table II-13 Capital Projects Used for O&M Analysis For Test Year Forecast O&M ..............................74
Table III-14 Work Breakdown Structure (WBS) ID and Description .......................................................77
Table III-15 Work Breakdown Structure(WBS) ID and Description ........................................................80
Table III-16 Disk and Tape Storage Refresh Work Breakdown Structure(WBS) ID and
Description ...........................................................................................................................................84
Table III-17 High Volume Printers and Bill Inserts Refresh Work Breakdown
Structure(WBS) ID and Description ....................................................................................................89
SCE 05: Information Technology Volume 1 - Overview, O&M and Capital
List Of Tables (Continued)
Table Page
-xiv-
Table III-18 PC and Related Hardware Expenditures ...............................................................................93
Table III-19 Data and Voice Network Replacements Work Breakdown Structure(WBS)
ID and Description .............................................................................................................................101
Table III-20 Transmission Network Facilities Work Breakdown Structure(WBS) ID and
Description .........................................................................................................................................105
Table III-21 Copper Wire Replacement Work Breakdown Structure(WBS) ID and
Description .........................................................................................................................................110
Table III-22 Fiber Cable Replacements Work Breakdown Structure(WBS) ID and
Description .........................................................................................................................................115
Table III-23 Microwave Replacements Work Breakdown Structure(WBS) ID and
Description .........................................................................................................................................118
Table III-24 Mobile Radio System Replacement Work Breakdown Structure(WBS) ID
and Description ..................................................................................................................................120
Table III-25 Risk Management Work Breakdown Structure (WBS) ID and Description .......................123
1
I. 1
OVERVIEW 2
A. Summary of Request 3
This exhibit presents the test year 2015 forecast of Operation and Maintenance (O&M) expenses 4
and capital expenditures of Southern California Edison’s (SCE) Information Technology Operating Unit 5
(IT). IT is responsible for the management of SCE’s applications and technology infrastructure. The 6
current technology environment includes approximately 63 large and midrange servers, 3 mainframes, 7
80,768 terabytes of storage, 3,900 miles of fiber cable, satellite communications, and over 150 8
microwave communication sites. SCE currently operates three primary data centers located in 9
Rosemead, Irvine and Alhambra, California. IT currently employs 1,691 SCE employees and 1,764 10
contractors and serves approximately 20,000 users.2 11
1. Capital summary 12
Table I-1 below summarizes our 2012 historical recorded capital expenditures and our 13
forecast for 2013-2017. 14
Table I-1 SCE – IT Summary of Capital Request
(Nominal $000,000)
Authorized Recorded 2013 2014 2015 2016 2017$437.80 $324.00 $331.13 $328.52 $373.04 $385.88 $355.75 $1,774.32
2012 Historical SCE IT Capital Request 2013 through 2017Total
2 As of 12/31/12.
2
Figure I-1 2012 Capital GRC Authorized to Actual Recorded
As Figure I-1 above illustrates, IT’s 2012 recorded capital expenditures were $113.8 1
million below the amount the California Public Utilities Commission (CPUC or the Commission) 2
authorized in our 2012 GRC. Several factors influenced this variance including the initial impact of our 3
Operational Excellence (OpX)3 initiative as well as the uncertainty of the rate case decision which was 4
adopted on November 29, 2012. Our current forecasts for 2013 and 2014 are significantly below the 5
forecasts for these years in our 2012 rate case. Most of these reductions are attributable to our OpX 6
initiative, which will reduce overall expenditures by focusing on prioritizing non-regulatory work in 7
addition to streamlining our development and support practices. 8
2. O&M Summary 9
Table I-2 below summarizes our 2012 authorized and recorded (adjusted) O&M expenses 10
and our 2015 forecast. 11
3 See Chapter I, Section I.B “Support For SCE’s Operational Excellence (OpX) Goal” of this Overview for further
discussion.
3
Table I-2 IT O&M Request for 2015 (Constant 2012 $000,000)
2012 2012 2015Authorized Recorded/Adjusted Forecast$272.80 $229.61 $234.88
Figure I-2 2012 O&M GRC Authorized to Actual Recorded
Again, as in the case of capital expenditures, in 2012 IT spent $43.2 million less than 1
authorized for O&M primarily due to the uncertainty around the rate case decision. The 2015 forecast 2
illustrates a similar focus on optimization and efficiency that will continue to result from our OpX 3
efforts. 4
Support For SCE’s Operational Excellence (OpX) Goal 5
In SCE’s Policy testimony (SCE-01, Policy) SCE’s President Ron Litzinger states: 6
In this GRC, a significant impact of implementing an Operational 7
Excellence framework can be seen in the significant reductions in O&M 8
expenses, particularly in the Administrative and General (A&G) accounts. 9
We have committed to reducing almost every area of A&G spending across 10
the company. The most significant reductions have occurred in Information 11
4
Technology, Human Resources, Financial Services, and Operational 1
Services. While some of these reductions have been implemented in 2013, 2
more are expected between now and the end of 2015 and those reductions 3
are reflected in our test year estimates.4 4
SCE’s continuing focus on Operational Excellence (OpX) provides a continuing mechanism to 5
challenge our own internal processes and decisions to ensure we are making good investment decisions 6
on behalf of our ratepayers. The IT organization plays a vital role in OpX as our expenditure on systems 7
and support services have grown as a percentage of total company spend over the past 10 years. There 8
are many reasons for this including: 9
1. Responding to the threat of cyber-attacks 10
2. Customer demand for usage information and more interactive services and automation 11
3. Regulatory demand for more information 12
4. Continuing deployment of smart devices on the grid 13
5. Increasing use of information technology throughout the enterprise 14
6. Network build outs to support expansion 15
IT’s 2015 estimates reflect over $30 million5 of operational savings resulting from a combination 16
of headcount reductions together with implementing an expanded sourcing strategy.6 The headcount 17
reductions are the result of extensive efforts to streamline our operations, reduce redundancies, and 18
prioritize our work. These savings are partially offset by approximately $1.7 million of severance for 19
the impacted employees. Worksheets containing the calculation of these savings and offsetting costs 20
can be found in workpapers to this volume.7 These savings and costs are included in the impacted 21
individual divisional O&M 920/921 FERC account sections of this volume.8 SCE is proposing a 50/50 22
split of the anticipated savings for 2015. This savings mechanism both incentivizes SCE to continue to 23
4 See SCE-01, Policy, p. 6.
5 This number is net of estimated sourcing costs.
6 Sourcing is the common term used to describe working with a third party to take over part or all of a business function.
7 See workpaper entitled “IT OpX Savings and Associated Costs.”
8 Id.
5
aggressively look for new ways to reduce costs as well as immediately reward the ratepayer with a 1
reduced request. This type of shared savings has previously been supported by the Commission.9 2
As in the rest of SCE, IT continues to evaluate how we can better serve our internal customers 3
and ultimately our ratepayers while reducing our overall expenditure. As will be seen in our request, 4
many areas have moderated or even reduced their request as a result of our efforts. We will continue to 5
look for areas where we can leverage cost reducing or automating technologies, for consolidation 6
candidates,10 and for additional savings opportunities. 7
One of the primary tools that SCE has implemented to allow us to better manage our technology 8
spend is an enterprise prioritization methodology. We have developed a process and common set of 9
tools that helps us prioritize spending by using SCE’s strategic goals to measure the relative value of 10
each potential project.11 The process challenges each project not only on cost but also benefits 11
(assuming that the projects are not mandated.) The result is a robust discussion and decision process 12
that allows us to focus only on the truly important work that is required for the safe, efficient and cost 13
effective operation of SCE. 14
B. The Continuing Challenge of Cybersecurity 15
Cybersecurity – the protection of SCE systems and data from cyber-attack – has become an 16
increasingly important area of risk management for SCE. Like other companies, SCE is facing more 17
frequent, more destructive, and more sophisticated cyber threats. Attempted attacks include computer 18
viruses, intrusions by hackers into our network gateways, malicious emails containing “phishing” scams, 19
and other exploits. 20
The Internet has allowed unprecedented access to information and has dramatically increased the 21
speed at which information can be transmitted. While this has enabled tremendous increases in 22
productivity, it has also led to security vulnerabilities. The growing dependence on mobile technologies 23
and wireless communications has further exposed business systems to cyber threats. One of SCE’s 24
greatest strategic challenges is to provide timely, actionable warning of cyber threats through effective 25
monitoring and alerting capabilities. 26
9 D.91-12.076, “sharing the…savings between ratepayers and shareholders will provide a solid incentive to Edison to
continue to vigorously pursue cost control goals.”
10 Consolidation candidates are multiple versions of like applications that can be replaced with a single instance resulting in lower operating costs.
11 See workpaper entitled “Project Approval Process.”
6
Cybersecurity is critical to the reliability and resilience of the nation’s electric grid, including 1
SCE’s electric infrastructure. The same defense-in-depth approach SCE uses to protect its corporate 2
network and systems is also being applied to the grid network to provide a flexible framework for 3
improving cybersecurity defenses. 4
As SCE systems become more integrated and business critical, the importance of safeguarding 5
them against cyber threat increases. As technology continues to advance, the complexity of security 6
threats also continues to advance, and SCE’s efforts to defend against them must also advance.12 7
C. Changes to the IT Operating Unit 8
The IT Operating Unit has undergone significant changes since the 2012 GRC case was filed. In 9
addition to substantial leadership changes, the organization has been streamlined and simplified. The 10
reason for this change was to re-establish the focus on our core work. Some of our de-centralized 11
functions (e.g., finance, human resources, supply chain, safety) have been integrated back into their 12
corporate functional areas. The corporate functional areas will provide IT those services in the future. 13
The organization has been flattened and focused to allow for greater line-of-sight accountability, and 14
there has been a reduction of internal support functions (pushing more self-service onto the managers), a 15
reduction in management layers, and an overall simplification of our Operating Unit. We expect to 16
continue to refine our organization over the next few years to improve our efficiency and effectiveness. 17
The improvements we expect to achieve are reflected in our forecasts. The restructured and simplified 18
organization is illustrated in Figure I-3 below. 19
12 See SCE-05, Vol. 2, Chapter II “Cybersecurity & IT Compliance” for further detail.
7
Figure I-3 IT Operating Unit
We believe this new structure will allow for clearer lines of responsibility, eliminate possible 1
redundancy, allow for better and quicker decision making, and increase organizational efficiency. 2
D. Commission directives from the 2012 GRC Final Decision 3
The Commission’s 2012 GRC Decision13 ordered SCE to address several items in this 2015 4
GRC. The following lists those directives as well as where they are addressed in our 2015 testimony. 5
1. A table listing capitalized software projects funded during 2010-2012, as identified in this 6
GRC across all business units. The table shall include, for each project, SCE’s final 2012 7
GRC forecast, as well as authorized and recorded expenditures. This table can be found in 8
our workpapers.14 9
2. Information about whether SCE employs best industry practices in making its capitalized 10
software project cost estimates, particularly as to in-house labor, project management and 11
contingency. IT’s project estimation methodology can be found in SCE-05, Vol. 1, 12
Technology Delivery and Maintenance, section 3) Estimating Methodology and Forecast. 13
3. Information about how SCE is effectively optimizing experience and assets to minimize costs 14
of software development and implementation. A discussion on this subject can be found in 15
SCE-05, Vol. 1, Enterprise Information Management & Architecture, section 1.b) 16
Optimization of Experience. 17
13 D.12-11-051, pp. 435-436, also Ordering Paragraph 27.
14 See workpaper entitled “Capitalized Software Projects Funded During 2010 - 2012 for ALJ Directive No. 1.”
8
4. Information about how SCE is cost effectively planning its system design, including 1
maximizing use of COTS and life extension activities, to meet growing demand for 2
technology solutions. A discussion of this subject can also be found in SCE-05, Vol. 2, 3
Enterprise Information Management & Architecture, section 1.b) Optimization of 4
Experience. 5
5. Information about whether reasonable metrics are available to measure productivity results 6
from IT solutions, and how such metrics would apply to SCE’s 2015-2017 capitalized 7
software projects. A discussion of this subject can also be found in SCE-05, Vol. 1, Client 8
Services & Planning, section 1.b) Metrics Measuring Productivity Results from IT Solutions. 9
9
II. 1
OPERATIONS & MAINTENANCE (O&M) EXPENSES 2
A. Development of O&M Test Year Estimate 3
1. Historical Adjustments 4
SCE reviewed the recorded expenses for each division within the IT Operating Unit from 5
2008 through 2012. Recorded expenses were evaluated for cyclical or unusual expense patterns that 6
were identified as non-recurring. These non-recurring activities were then removed from the recorded 7
expenses. Historical adjustments may either increase or decrease the recorded costs, depending upon the 8
nature of the adjustment. 9
2. Methodologies 10
The methodologies used to establish a basis for IT’s 2015 Test Year O&M request for 11
each division by FERC Account are based on guidance from the CPUC in D.89-12-057 as follows: 12
Averaging: Where recorded expenses for a given division in a FERC Account have 13
shown significant fluctuations from year to year, or are influenced by weather or 14
other external forces beyond SCE’s control, recorded expenses over a period of time 15
(typically four years) are averaged to develop the 2015 Test Year base estimate; 16
Trending or Last Recorded Year: Where recorded expenses for a given division in a 17
FERC Account have shown a trend (rising, falling, or stable) over three or more 18
years, the last recorded year (2012) of recorded expenses is used as the 2015 Test 19
Year base estimate, plus or minus a detailed estimate of future costs and/or savings as 20
appropriate; and 21
Itemized Forecast: Where the 2015 Test Year base estimate is based on a detailed 22
analysis of cost elements expected to be incurred in the Test Year. 23
SCE developed cost estimates by selecting one of the methodologies listed above to 24
forecast each of the FERC Accounts within each division in accordance with CPUC guidance in D.89-25
12-057. In IT’s Testimony for this GRC, the 2012 recorded expenses are used the most frequently as the 26
base, adjusting upward for specific identifiable future cost increases or downward for specific 27
decrements or productivity adjustments. A detailed explanation of each IT division, its associated 28
historical expenses, and the 2015 Test Year request follows. 29
10
Table II-3 O&M Forecast Approach by Division
(by FERC Account) (Constant 2012 $000)
Recorded/Adjusted Test Year ForecastO&M Expenses FERC 2012 2015 Variance Method DriversINFRASTRUCTURE TECHNOLOGY SERVICES Labor 48,588 38,762 (9,826) LRY OpX Savings and Severance Pay INFRASTRUCTURE TECHNOLOGY SERVICES Non-Labor 60,791 74,692 13,901 LRY Software License RenewalTOTAL O&M for INFRASTRUCTURE TECHNOLOGY SERVICES 920-921 109,379 113,454 4,075
INFRASTRUCTURE TECHNOLOGY SERVICES FOR NUCLEAR Labor 3,090 3,090 0 LRY N/AINFRASTRUCTURE TECHNOLOGY SERVICES FOR NUCLEAR (Net of Participant Credits) Non-Labor (17) (17) 0 LRY N/ATOTAL O&M for INFRASTRUCTURE TECHNOLOGY SERVICES FOR NUCLEAR 517 3,073 3,073 0
TOTAL O&M for INFRASTRUCTURE TECHNOLOGY SERVICES -NETWORK RENTS 931 Other 4,107 4,107 0 LRY N/A
TECHNOLOGY DELIVERY & MAINTENANCE Labor 41,100 31,274 (9,826) LRY OpX Savings and Severance Pay TECHNOLOGY DELIVERY & MAINTENANCE Non-Labor 18,960 17,669 (1,291) LRY OpX Savings and Severance Pay TOTAL O&M for TECHNOLOGY DELIVERY & MAINTENANCE 920-921 60,060 48,943 (11,117)
TECHNOLOGY DELIVERY & MAINTENANCE FOR NUCLEAR Labor 3,844 2,067 (1,777) LRY SONGS ClosureTECHNOLOGY DELIVERY & MAINTENANCE FOR NUCLEAR (Net of Participant Credits) Non-Labor 164 551 387 LRY Reduced Participant CreditsTOTAL O&M for TECHNOLOGY DELIVERY & MAINTENANCE FOR NUCLEAR-517 4,008 2,618 (1,390)
CYBERSECURITY & COMPLIANCE Labor 5,254 7,529 2,275 LRY Cyber Engineering workforce additonsCYBERSECURITY & COMPLIANCE Non-Labor 1,224 11,494 10,270 LRY Contracts for testing and toolsTOTAL O&M for CYBERSECURITY & COMPLIANCE 920-921 6,478 19,023 12,545
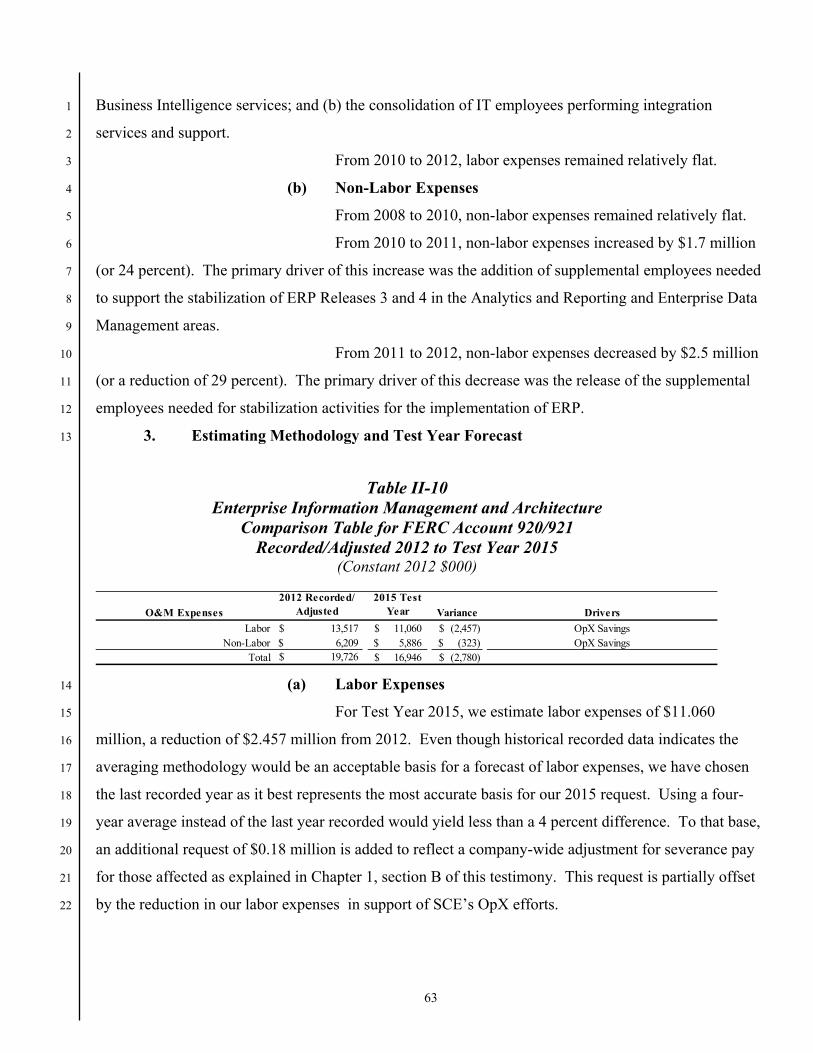
ENTERPRISE INFORMATION MANAGEMENT & ARCHITECTURE Labor 13,517 11,060 (2,457) LRY OpX Savings and Severance Pay ENTERPRISE INFORMATION MANAGEMENT & ARCHITECTURE Non-Labor 6,209 5,886 (323) LRY OpX Savings and Severance Pay TTOTAL O&M for ENTERPRISE INFORMATION MANAGEMENT & ARCHITECTURE 920-921 19,726 16,946 (2,780)
CLIENT SERVICES & PLANNING Labor 19,267 15,440 (3,827) LRY OpX Savings and Severance Pay CLIENT SERVICES & PLANNING Non-Labor 3,514 2,376 (1,138) LRY OpX Savings and Severance Pay TOTAL O&M for CLIENT SERVICES & PLANNING 920-921 22,781 17,816 (4,965)
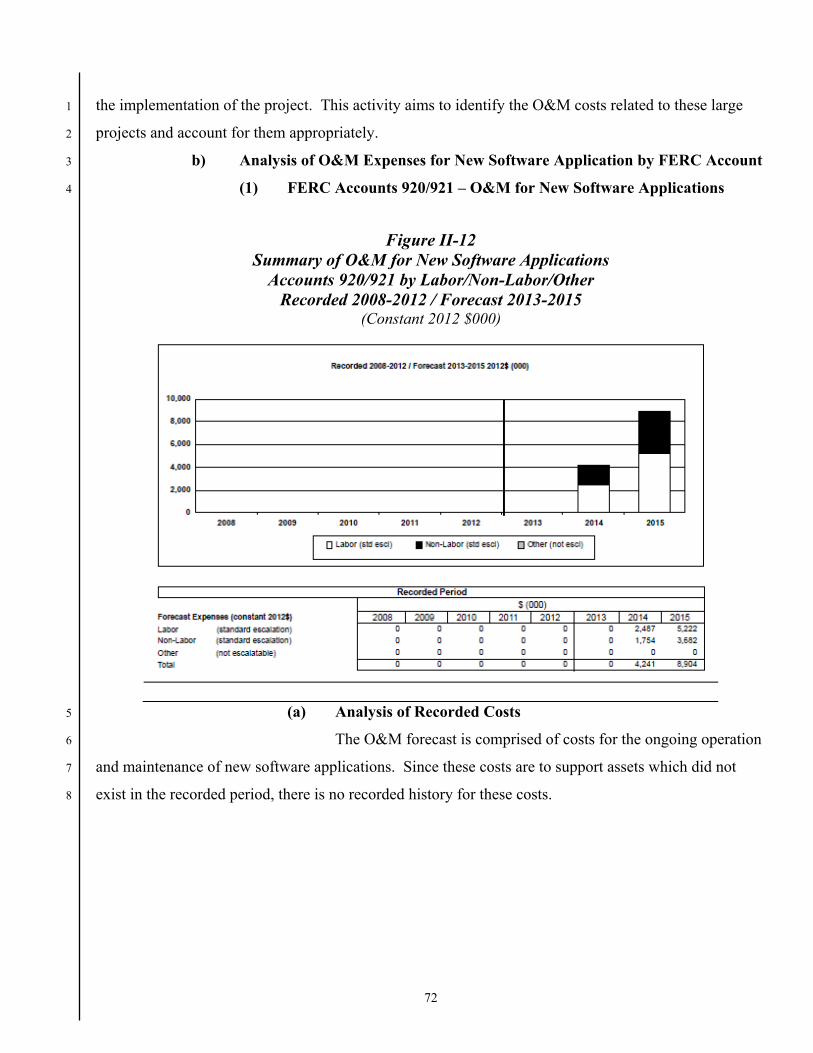
INCREMENTAL O&M FOR NEW SOFTWARE Labor 0 5,222 5,222 IF Various projects >$5MINCREMENTAL O&M FOR NEW SOFTWARE Non-Labor 0 3,682 3,682 IF Various projects >$5MTOTAL O&M for INCREMENTAL NEW SOFTWARE 920-921 0 8,904 8,904
O&M GRAND TOTAL 229,612 234,884 5,272
Forecast Method LevelLRY = Last Recorded YearIF = Itemized ForecastA3 = Three Year AverageA4 = Four Year AverageA5 = Five Year Average
B. Infrastructure Technology Services 1
1. Infrastructure Technology Services Division (ITS) 2
a) Infrastructure Technology Services 3
The primary purpose of the Infrastructure Technology Services Division (ITS) 4
(formerly Infrastructure Operations Division) of SCE’s IT Operating Unit is to provide reliable, 5
responsive, and cost-effective operational IT products and services for more than approximately 20,000 6
SCE and contingent workers across SCE. At year-end 2012, ITS had 758 SCE employees and used 412 7
contractors. 8
11
ITS is comprised of the Automation Services, Computing Services, Service 1
Operations, Grid Services and Service Management & Planning groups. These groups perform, operate, 2
and maintain key infrastructure assets, products and services for SCE, including: 3
Mainframe servers, midrange servers, disk and tape storage 4
Cloud infrastructure and strategy 5
Device engineering 6
IT tools management 7
Identity and access management 8
IT Service Desk (Tier 1, Tier 2, and Tier 3 support) 9
Incident management (desktop & single users – enterprise level) 10
Executive & dedicated support 11
Deployment and order fulfillment 12
Customer bill printing/mailing operations 13
Edison operators 14
Command Center operations 15
Voice/data/satellite network and telecommunications infrastructure 16
Transmission and distribution grid control network 17
Coordination of IT regulatory compliance 18
Management of IT assets 19
Development and management of IT service management processes 20
b) Automation Services Group 21
The Automation Services group in ITS is composed of several prior 22
organizational groups brought together to drive organizational and process efficiencies by planning, 23
building, deploying, and maintaining a collection of tools automating the business of IT. The four 24
primary activities performed by Automation Services are: 25
Device tools activities, which include the deployment, maintenance, and 26
complete management of most desktop software applications, 27
Identity and access management tools activities, which include the 28
deployment, maintenance, and complete management of the identity 29
management systems for IT, 30
12
Application tools activities, which include the deployment, maintenance, and 1
complete management of the tools IT uses to conduct business, such as 2
Service Manager, Citrix, and BMC Remedy, and 3
ManageWare15 and collaboration tools activities, which include the 4
deployment, maintenance, and complete management of most collaboration 5
tools such as Lotus Notes. 6
Device tools activities include design and engineering of end-user devices 7
including end user computer evaluation and configuration, software packaging and automated 8
deployment, monitoring, trouble shooting and problem resolution, and maintenance in support of 9
functional areas throughout SCE. Device tools solutions include support of end-user devices such as 10
business laptops and desktops, ruggedized laptops, office shared printers, and mobile devices such as 11
smart phones and tablets.16 Finally, device tools activities include creation and configuration, packaging 12
and deployment, and version management of operating systems, office productivity software, 13
commercial off-the-shelf productivity software, and custom software. 14
Identity and access management tools activities include designing, engineering, 15
building, implementing, deploying and maintaining identity and access management tools such as IBM 16
Tivoli Identity Manager/Tivoli Access Manager as well as solutions that support Information 17
Technology Infrastructure Library17 process automation. Examples include centralizing the granting of 18
access to applications and servers, and providing the capability to sign on one time to gain access to 19
multiple systems. These teams perform problem analysis and resolution to minimize problem 20
reoccurrence for these identity and access management tools and use these tools to grant access to many 21
different systems. 22
Application tools activities include design, implementation, deployment, and 23
maintenance of client virtual applications and desktops, DevOps,18 application performance 24
15 ManageWare definition: ManageWare encompasses two major functions: (1) The monitoring capability of applications,
servers, and network components that aid in the management of those components, and (2) The ability to remotely push software to networked devices and run reports on where our software is distributed.
16 See workpaper entitled ”Supported Devices 2013.pdf.”
17 See workpaper entitled “ITIL V3: Process Summary Sheets for PinkSCAN” for in-depth definitions and summaries of each ITIL process.
18 DevOps solutions provide virtualized application sequencing deployment, and self-service provisioning into multiple environments.
13
management, and service management solutions. Client virtualization solutions provide infrastructure 1
for hosting and managing virtualized desktops and applications that can be used with any end-point 2
device platform, and enables SCE’s “bring your own device” strategy. Application performance 3
management tools enable performance and capacity monitoring, modeling, and planning at the 4
application level. Service management solutions provide IT process automation tools such as IT call 5
center and data center management tools.19 6
ManageWare and collaboration tools activities include design, implementation, 7
deployment, and maintenance of collaboration and system management tools such as email, corporate 8
instant messaging, and automated deployment and monitoring tools that operate 24 hours a day, seven 9
days a week. These activities enable SCE to communicate to employees, vendors, customers, and other 10
stakeholders. This includes managing information received from telecommunications equipment and 11
data center equipment upon which IT groups can act to resolve equipment or application issues in a 12
timely manner. 13
c) Computing Services Group 14
The Computing Services group in ITS manages and maintains SCE’s mainframe 15
servers, midrange20 servers, disk and tape storage, and operating software. Computing Services 16
activities include building a scalable and reliable applications infrastructure critical to enabling SCE’s 17
business operations and providing business continuity (disaster recovery) services 24 hours a day, and 18
seven days a week. Computing Services focuses on providing the following: 19
Server management 20
Storage management 21
Operating software management 22
Business continuity services 23
Cloud services 24
Data center and sustainability services 25
19 See workpaper entitled “ITIL V3: Process Summary Sheets for PinkSCAN” for in-depth definitions and summaries of
each ITIL process.
20 Midrange computers are a class of computers falling in the middle of the computing spectrum between mainframe computers and personal computers.
14
Server management activities include building, operating and maintaining a 1
secure server environment to run critical business applications. Examples include building servers in 2
support of projects, maintaining server health by applying patches as required by vendors to resolve 3
production problems, performing problem analysis and resolution to minimize problem reoccurrence, 4
and providing ongoing disaster recovery services. 5
Storage management activities include disk and tape storage installation and 6
support services to meet company-wide business requirements. For example, evaluating various disk 7
and tape storage options on the market and selecting the solutions which meet our business requirements 8
for mainframe and midrange computing platforms. 9
Operating software management activities include database and transaction 10
system installation and support services to meet client requirements. For example, providing database 11
tools and support for mainframe server databases, such as DB2, and Oracle and Microsoft SQL server 12
databases on midrange servers. 13
Business continuity services include installing, monitoring and maintaining data 14
backup capabilities and supporting client data restoration requirements. 15
Computing Services also supports SCE’s private cloud services.21 The primary 16
responsibility of SCE’s private cloud services is to reduce time and cost to build SCE business solutions, 17
to test and to implement key applications. In addition, SCE’s private cloud services promote the use of a 18
standard catalog of services to simplify and maintain the currency of SCE solutions and products. 19
SCE data centers in Rosemead, Irvine and Alhambra are also supported by 20
Computing Services. Functional responsibilities of Computing Services for the data centers are in two 21
key areas: (1) IT data center hardware infrastructure facility management; and (2) IT data center and 22
hardware capacity utilization management. 23
The IT data center hardware infrastructure facility management function is 24
performed in close collaboration with the Corporate Resources group of the Financial and Operational 25
Services Operating Unit (F&OS) as it relates to ongoing data center operations. Overall, this is an 26
21 Definition: Cloud computing is a general term for delivering hosted computing services over the internet or intranet.
These services are broadly divided into three categories: Infrastructure-as-a-Service (IaaS), Platform-as-a-Service (PaaS) and Software-as-a-Service (SaaS). A cloud can be private or public. A public cloud is available to the general public on the Internet. A private cloud is a proprietary network or a data center that supplies hosted services to a single client.
15
integrated facility management function to ensure ongoing, continuous (24x7 basis), reliable operation 1
of SCE’s critical production data centers. 2
The IT data center and hardware capacity utilization function measures, reports on 3
and allocates data center space, power and hardware resources to ensure the most cost effective and 4
efficient utilization of SCE data center assets. 5
d) Grid Services Group 6
The Grid Services group in ITS is responsible for designing, engineering, 7
installing, operating, monitoring, repairing, and maintaining the voice, data, and satellite networks for 8
SCE. This includes the hardware (such as fiber optic cable, copper cable, circuits, switches, routers, 9
microwave transmission towers, and radio communication devices), the internal software that operates 10
the equipment, and the software for monitoring the voice and data networks. Grid Services is 11
responsible for SCE’s vast communications network that includes over 3,900 miles of fiber optic cable, 12
over 150 microwave communication sites, nearly 30,000 telephones and related equipment, a dispatch 13
radio system that supports over 4,800 mobile radios, nearly 47,000 NetComm radios,22 over 1,000 sites 14
with telephony,23 and over 300 sites that have a Wide Area Network and Local Area Network 15
connectivity.24 16
The voice and data network enables essential communications among our 17
employees across the company, and includes communications systems for (1) dispatching personnel to 18
restore electric service and activate new service for our customers, (2) operating and maintaining the 19
transmission grid, (3) substation automation, and (4) communicating with our customers. Grid Services 20
manages, operates, and maintains SCE’s communications networks to ensure that the communication 21
infrastructure is available 24 hours a day, 365 days a year. Grid Services also designs, engineers, and 22
integrates new technologies into our existing communications networks such as Voice over IP (VoIP) 23
and video streaming. 24
22 See workpaper entitled “NetComm Radios” for more information on SCE's NetComm system.
23 See workpaper entitled “Telephony Sites.”
24 WAN/LAN definition: A wide area network (WAN) is a computer network that covers a broad area (i.e., any network whose communication links cross metropolitan, regional, or national boundaries. A local area network (LAN) is a computer network covering a small physical area, like an office or small groups of buildings. The defining characteristics of LANs, in contrast to WANs, include their usually higher data-transfer rates, smaller geographic area, and the lack of need for telecommunication lines.
16
Given SCE’s large service territory and diverse types of work, it is necessary to 1
support several means of communications to enable SCE’s employees to perform their responsibilities, 2
including: 3
Transportation of data between various locations within SCE’s service 4
territory 5
Grid automation 6
Employee telephone and voice-mail systems 7
Wireless voice dispatch and mobile data to employees working in the field 8
Broadband remote access to mobile employee base 9
Video conferencing 10
Internet presence 11
Satellite operations 12
These modes of communication help SCE deliver reliable electric service by 13
transporting data such as amps, watts, transformer temperature, and ambient temperature throughout 14
SCE’s service territory to business unit operators, management, planners, and engineers. In this way, 15
SCE is able to monitor the transmission and distribution grid in real-time as necessary to provide safe 16
and reliable service to our customers. 17
Grid Services also performs repair functions to critical communications networks. 18
Outages of these networks are categorized as critical and must be repaired shortly after an outage is 19
reported. Grid Services is responsible for maintaining the ability to continue communication with field 20
command centers by way of mobile radio until the critical communication network service is restored. 21
Grid Services responds to trouble calls concerning SCE’s communications 22
networks. This group also performs preventive maintenance on the voice and data network, and installs 23
components such as fiber optic systems, microwave systems, and telecommunication cable systems, as 24
well as installs and maintains the individual devices on our communications network, such as mobile 25
radios and telephones. Grid Services also provides a dedicated support team for our San Onofre Nuclear 26
Generating Station (SONGS), which performs activities similar to the larger Grid Services group. 27
Grid Services monitors the Energy Management System (EMS) alarms to inform 28
grid operators when a power line becomes overloaded or when a circuit breaker opens due to an 29
abnormal condition. EMS allows the Grid Operator to remotely perform critical functions such as 30
opening and closing circuit breakers to energize or de-energize a line, monitoring load, and gathering 31
17
timely information related to system conditions and reliability. EMS also collects transmission and 1
generation related data and transmits this data to the California Independent System Operator (CAISO) 2
every four seconds. Access to this real-time status information allows the ISO and SCE to effectively 3
coordinate grid operations as required to operate the transmission and distribution infrastructure within 4
safe physical limits. 5
Finally, Grid Services maintains the Distribution Management System (DMS) 6
which enables grid operators to monitor and remotely control specific equipment not included within the 7
scope of EMS such as pole switches and capacitors located on the distribution system. Automating this 8
equipment and providing operators with remote control capability greatly facilitates Transmission & 9
Distribution’s (T&D’s) ability to reduce outage time for its customers. 10
e) Service Operations Group 11
The Service Operations group in ITS is responsible for over 23,500 personal 12
computers (PCs) and over 15,300 wireless communication devices (BlackBerrys, Cellphones, Pagers).25 13
In addition, Service Operations monitors our mainframe servers, midrange servers, disk and tape 14
storage, and applications along with SCE’s vast communications network that has Wide Area Network 15
and Local Area Network connectivity. This group also supports customer bill printing and mailing. 16
Service Operations also provides operator services for handling incoming phone calls. Service 17
Operations provides these services through six key activities: 18
IT Service Desk 19
Executive & Dedicated Support 20
Deployment and Order Fulfillment 21
Customer Bill Printing/Mailing Operations 22
Edison Operators 23
Command Center Operations 24
The IT Service Desk provides a single point of contact for company-wide support 25
of end-to-end service restoration. The Service Desk is a 24 hours a day, 365 days a year operation 26
(leveraging the Data Operations Command Center26 (DOCC) group for afterhours coverage).27 The IT 27
25 See workpaper entitled “Wireless and PC Counts.”
26 See workpaper entitled “DOCC Description of Duties.”
27 After hours coverage is 6pm to 6am, Monday through Friday and 24 hours on weekends and holidays.
18
Service Desk is comprised of three Tiers (of services/support): Tier 1 handles more than 24,000 calls 1
per month28 from employees needing help with PC software, PC hardware, related peripherals and 2
accessories, mainframe applications, distributed computing applications, network problems, phones, 3
pagers, and mobile radios. Unresolved issues are escalated to Tier 2 and, if necessary, dispatched for 4
on-site service to replace or modify hardware and software to restore operational status. Tier 3 is the 5
final stage for resolution of all remaining incidents. 6
The operational goal of the IT Service Desk is to answer calls in a timely manner, 7
restore service for 70 percent of incidents upon first contact, and to restore operational status within 6 8
hours.29 The IT Service Desk also delivers proactive capabilities such as training and knowledge 9
document creation to enable more efficient incident restoration. 10
Executive Support provides direct support for executive management and their 11
assistants. The Dedicated Support group provides dedicated incident management, order fulfillment, 12
and product deployment support to Operating Units that perform SCE critical business functions (such 13
as the Law Department). Both Executive and Dedicated Support serve as a single point of IT contact for 14
their clients. 15
The Deployment and Order Fulfillment capability focuses on the annual refresh 16
and recovery of end-of-life PCs and network connected printers, and the fulfillment of more than 4,800 17
customer orders per month.30 These orders are for approved standard adjustments to hardware, 18
software, and accessories for personal computers and wireless communication devices. Additionally, 19
orders for access to facilities and applications make up a third of the total monthly volume. 20
The Customer Bill Printing and Mailing Operations activities include printing, 21
inserting, reconciling and mailing 250,000 bill statements, letters, and checks per day. High volume 22
printers and bill inserters provide automation for the customer bill printing and mailing operation. 23
The Edison Operators are responsible for SCE’s telephone directory assistance 24
and handle about 46,000 calls per month, providing call assistance to external sources such as vendor 25
companies, media, government officials, customers, emergency services (police & fire departments), 26
and employees. The Edison Operators also perform after hour callouts during emergencies that require 27
28 See workpaper entitled “Call Management Volume.”
29 Actual Service Levels are 70% of incidents resolved upon first contact and 80% incidents resolved within six hours.
30 See workpaper entitled “Order and Request Fulfillment Volume.”
19
assistance from divisions in other Operating Units (OU) such as Corporate Facilities within the Financial 1
& Operational Services OU, Local Public Affairs within the External Relations OU, Environmental 2
Health & Safety, Business Resiliency, and Crisis Management Council Advisor, within the Safety, 3
Security & Compliance OU, and Claims within the Law OU. 4
Command Center Operations monitors the SCE network, telephony systems, 5
computing systems, and applications that are necessary to support SCE’s key business processes. These 6
environments are monitored from Rosemead and Irvine on a 24x7 basis. This group coordinates 7
activities with technicians, subject matter experts, and management to expedite service restoration.31 8
The group also communicates the status of IT systems through daily logs, event pages, and emails. In 9
addition to monitoring, this group is responsible for dispatching repair crews, tracking and isolating 10
service failures, managing service outages and trouble calls, monitoring environmental conditions at key 11
IT facilities (i.e., power and temperature), and other activities such as responding to mobile radio 12
emergency calls, essential for SCE to maintain safe and reliable service for our customers. Command 13
Center Operations also negotiates outage windows and obtains approvals for changes to SCE’s IT 14
infrastructure. This is accomplished by analyzing and identifying impacts causing interruptions to 15
transport systems, circuits and other IT services that may impact SCE business operations. 16
f) Service Management and Planning Group 17
The Service Management and Planning group (SM&P) in ITS is responsible for 18
improving the quality, performance and reliability of IT’s services. By improving the overall cost 19
effectiveness and utility of our IT applications, SM&P allows SCE’s Operating Units to rely on IT to 20
deliver the business systems they need to efficiently conduct business. 21
Modeled along industry best practices such as those described in ITIL V3,32 22
SM&P has the overall responsibility for the development, support and maintenance of the IT service 23
management processes. The primary ITIL processes within scope for SM&P include responsibility for 24
Service Asset and Configuration Management, Release Management, Demand Management, Capacity 25
31 See workpaper entitled “Service Restoration Triage Process.”
32 ITIL Definition: The Information Technology Infrastructure Library (ITIL) is a set of practices for IT service management (ITSM) that focuses on aligning IT services with the needs of business. In its current form (known as ITIL 2011 V3 edition), ITIL is published in a series of five core publications, each of which covers an ITSM lifecycle stage. ITIL describes processes, procedures, tasks and checklists that are not organization-specific, used by an organization for establishing integration with the organization's strategy, delivering value and maintaining a minimum level of competency.
20
Planning, Service Catalog, Problem Management, IT Service Continuity Management, and overall ITIL 1
process strategy and governance.33 SM&P provides support services to other ITS groups such as 2
collection, analysis and reporting on key operational performance and service level indicators. 3
This group also ensures appropriate internal and external regulatory compliance 4
requirements are met and integrated within the overall IT strategy. The sources of these requirements 5
span from the North American Electric Reliability Corporation Critical Infrastructure Program (NERC 6
CIP), Federal Energy Regulatory Commission (FERC) and Sarbanes-Oxley (SOX) to internal SCE 7
audits. 8
SM&P also manages and maintains the budget for all IT software assets 9
throughout their lifecycle. This consolidated management of software license and maintenance 10
contracts, previously distributed among multiple IT groups, enables increased efficiency and price 11
optimization with our software suppliers. 12
33 See workpaper entitled “ITIL V3: Process Summary Sheets for PinkSCAN” for in depth definitions and summaries of
each ITIL process.
21
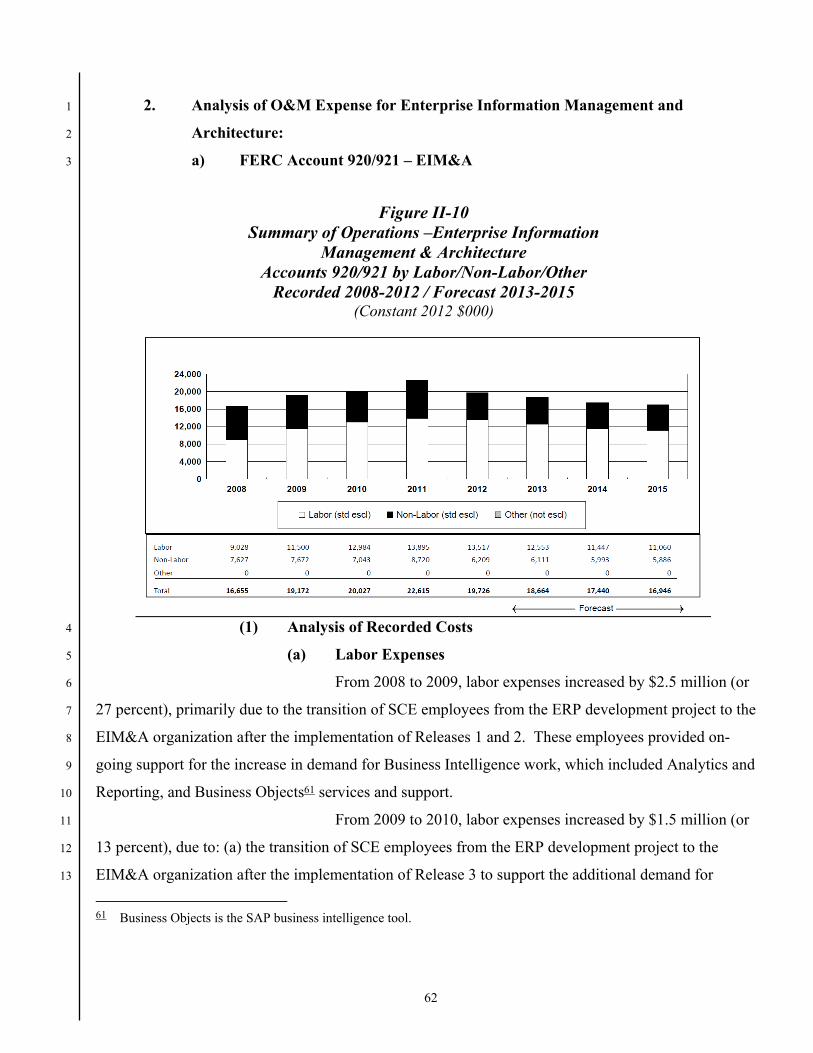
2. Analysis of Operations & Maintenance Expense by FERC Account 1
a) FERC Account 920/921 – ITS 2
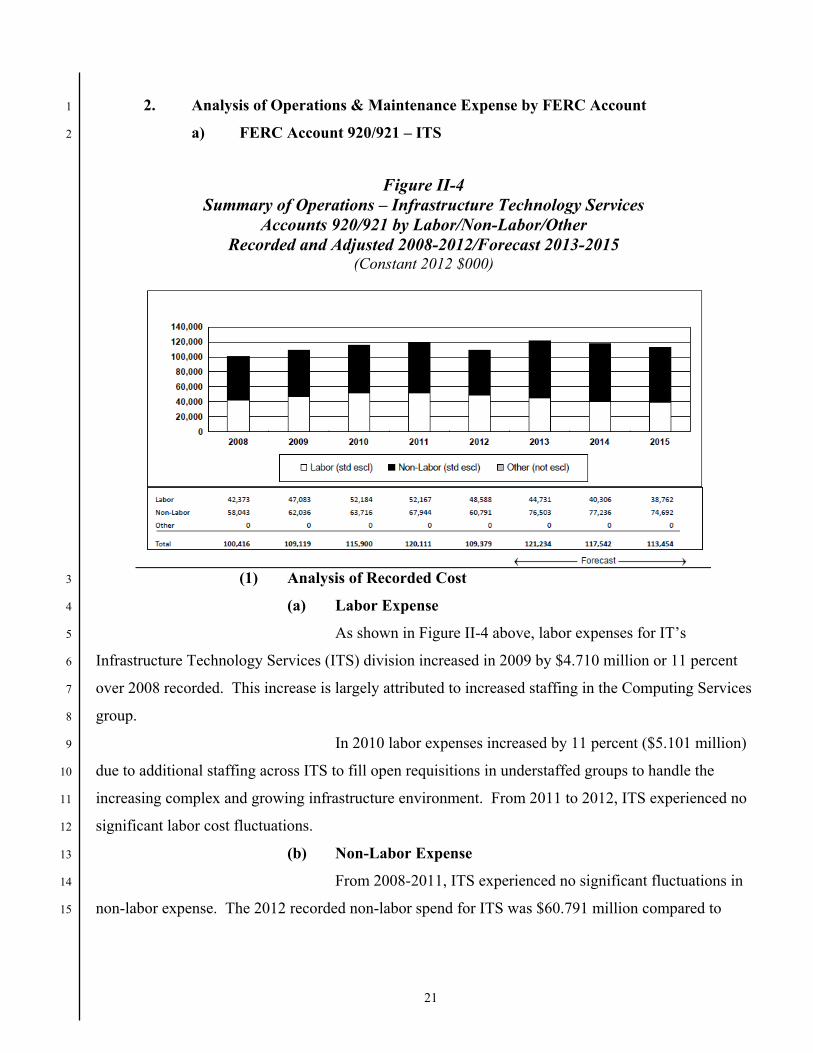
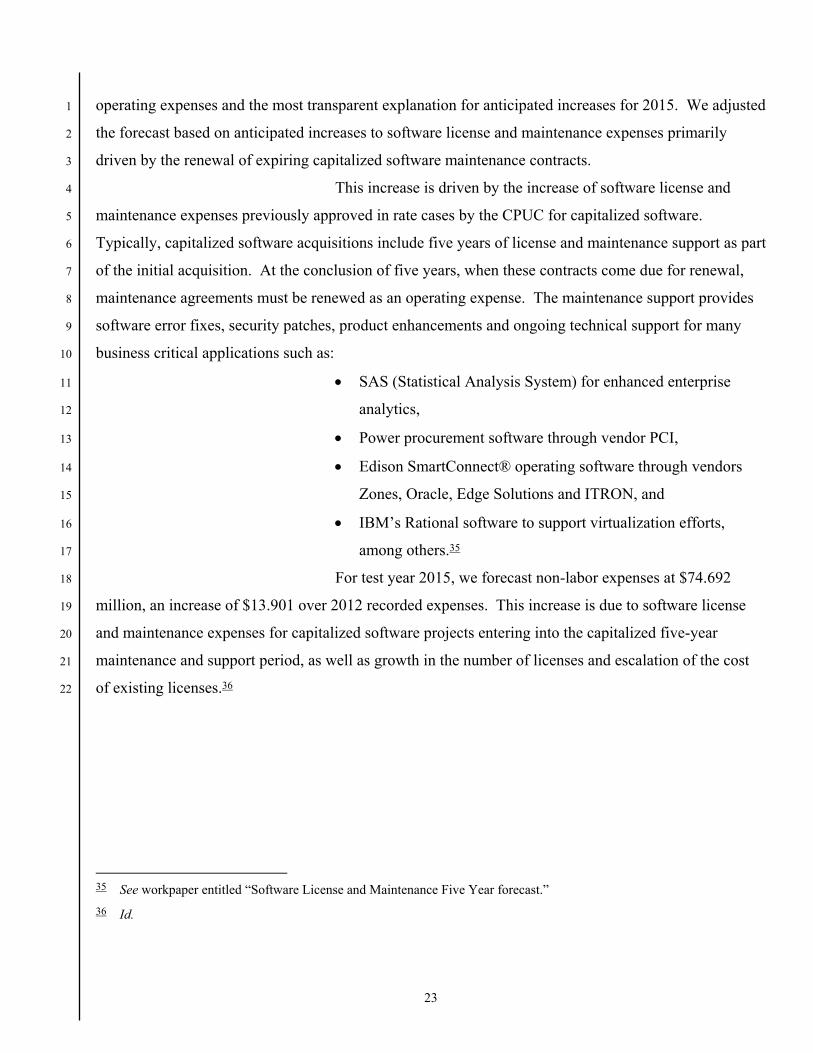
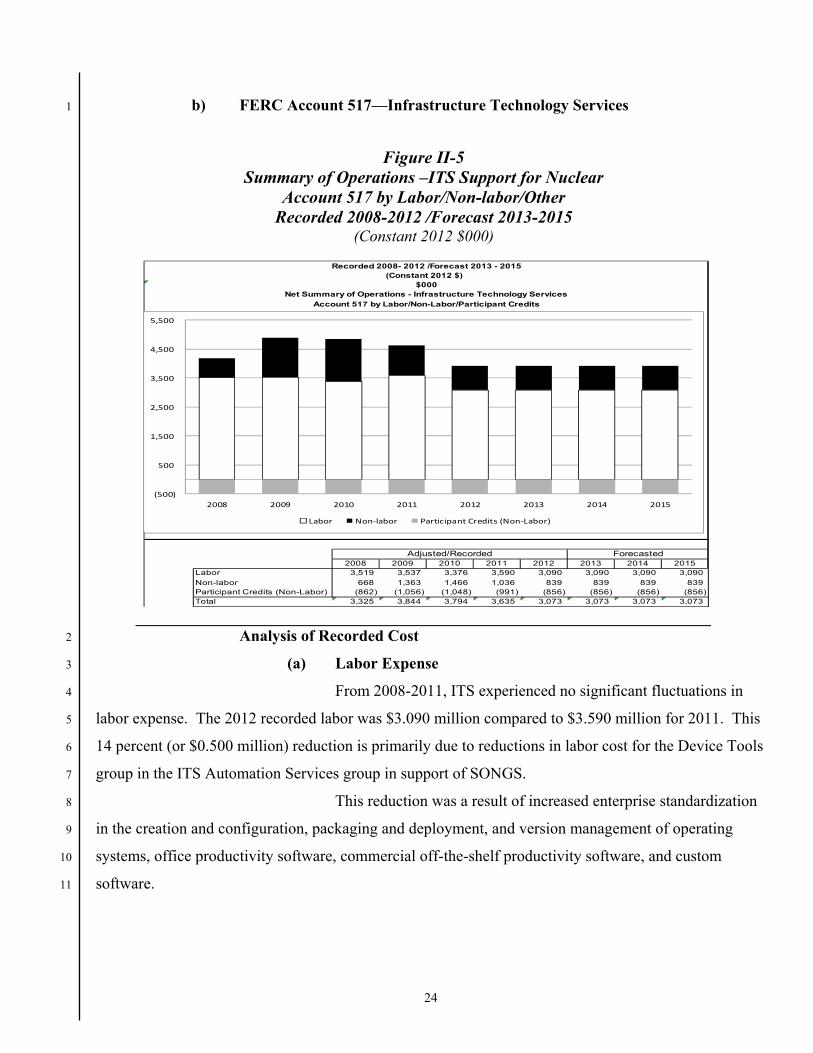
Figure II-4 Summary of Operations – Infrastructure Technology Services
Accounts 920/921 by Labor/Non-Labor/Other Recorded and Adjusted 2008-2012/Forecast 2013-2015
(Constant 2012 $000)
(1) Analysis of Recorded Cost 3
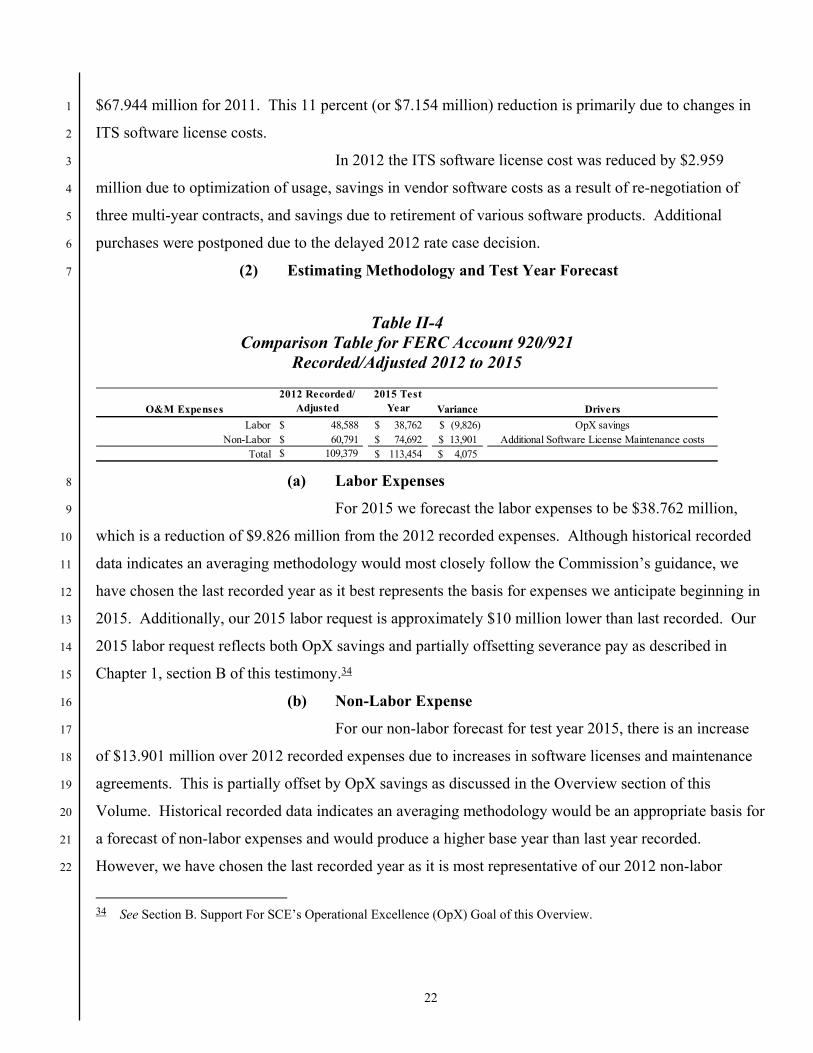
(a) Labor Expense 4
As shown in Figure II-4 above, labor expenses for IT’s 5
Infrastructure Technology Services (ITS) division increased in 2009 by $4.710 million or 11 percent 6
over 2008 recorded. This increase is largely attributed to increased staffing in the Computing Services 7
group. 8
In 2010 labor expenses increased by 11 percent ($5.101 million) 9
due to additional staffing across ITS to fill open requisitions in understaffed groups to handle the 10
increasing complex and growing infrastructure environment. From 2011 to 2012, ITS experienced no 11
significant labor cost fluctuations. 12
(b) Non-Labor Expense 13
From 2008-2011, ITS experienced no significant fluctuations in 14
non-labor expense. The 2012 recorded non-labor spend for ITS was $60.791 million compared to 15
22
$67.944 million for 2011. This 11 percent (or $7.154 million) reduction is primarily due to changes in 1
ITS software license costs. 2
In 2012 the ITS software license cost was reduced by $2.959 3
million due to optimization of usage, savings in vendor software costs as a result of re-negotiation of 4
three multi-year contracts, and savings due to retirement of various software products. Additional 5
purchases were postponed due to the delayed 2012 rate case decision. 6
(2) Estimating Methodology and Test Year Forecast 7
Table II-4 Comparison Table for FERC Account 920/921
Recorded/Adjusted 2012 to 2015
O&M Expenses
2012 Recorded/ Adjusted
2015 Test Year Variance Drivers
Labor $ 48,588 38,762$ (9,826)$ OpX savingsNon-Labor $ 60,791 74,692$ 13,901$ Additional Software License Maintenance costs
Total $ 109,379 113,454$ 4,075$
(a) Labor Expenses 8
For 2015 we forecast the labor expenses to be $38.762 million, 9
which is a reduction of $9.826 million from the 2012 recorded expenses. Although historical recorded 10
data indicates an averaging methodology would most closely follow the Commission’s guidance, we 11
have chosen the last recorded year as it best represents the basis for expenses we anticipate beginning in 12
2015. Additionally, our 2015 labor request is approximately $10 million lower than last recorded. Our 13
2015 labor request reflects both OpX savings and partially offsetting severance pay as described in 14
Chapter 1, section B of this testimony.34 15
(b) Non-Labor Expense 16
For our non-labor forecast for test year 2015, there is an increase 17
of $13.901 million over 2012 recorded expenses due to increases in software licenses and maintenance 18
agreements. This is partially offset by OpX savings as discussed in the Overview section of this 19
Volume. Historical recorded data indicates an averaging methodology would be an appropriate basis for 20
a forecast of non-labor expenses and would produce a higher base year than last year recorded. 21
However, we have chosen the last recorded year as it is most representative of our 2012 non-labor 22
34 See Section B. Support For SCE’s Operational Excellence (OpX) Goal of this Overview.
23
operating expenses and the most transparent explanation for anticipated increases for 2015. We adjusted 1
the forecast based on anticipated increases to software license and maintenance expenses primarily 2
driven by the renewal of expiring capitalized software maintenance contracts. 3
This increase is driven by the increase of software license and 4
maintenance expenses previously approved in rate cases by the CPUC for capitalized software. 5
Typically, capitalized software acquisitions include five years of license and maintenance support as part 6
of the initial acquisition. At the conclusion of five years, when these contracts come due for renewal, 7
maintenance agreements must be renewed as an operating expense. The maintenance support provides 8
software error fixes, security patches, product enhancements and ongoing technical support for many 9
business critical applications such as: 10
SAS (Statistical Analysis System) for enhanced enterprise 11
analytics, 12
Power procurement software through vendor PCI, 13
Edison SmartConnect® operating software through vendors 14
Zones, Oracle, Edge Solutions and ITRON, and 15
IBM’s Rational software to support virtualization efforts, 16
among others.35 17
For test year 2015, we forecast non-labor expenses at $74.692 18
million, an increase of $13.901 over 2012 recorded expenses. This increase is due to software license 19
and maintenance expenses for capitalized software projects entering into the capitalized five-year 20
maintenance and support period, as well as growth in the number of licenses and escalation of the cost 21
of existing licenses.36 22
35 See workpaper entitled “Software License and Maintenance Five Year forecast.”
36 Id.
24
b) FERC Account 517—Infrastructure Technology Services 1
Figure II-5 Summary of Operations –ITS Support for Nuclear
Account 517 by Labor/Non-labor/Other Recorded 2008-2012 /Forecast 2013-2015
(Constant 2012 $000)
2008 2009 2010 2011 2012 2013 2014 2015Labor 3,519 3,537 3,376 3,590 3,090 3,090 3,090 3,090
Non-labor 668 1,363 1,466 1,036 839 839 839 839Participant Credits (Non-Labor) (862) (1,056) (1,048) (991) (856) (856) (856) (856)Total 3,325 3,844 3,794 3,635 3,073 3,073 3,073 3,073
Adjusted/Recorded Forecasted
Recorded 2008- 2012 /Forecast 2013 - 2015(Constant 2012 $)
$000Net Summary of Operations - Infrastructure Technology Services
Account 517 by Labor/Non-Labor/Participant Credits
(500)
500
1,500
2,500
3,500
4,500
5,500
2008 2009 2010 2011 2012 2013 2014 2015
Labor Non‐labor Participant Credits (Non‐Labor)
Analysis of Recorded Cost 2
(a) Labor Expense 3
From 2008-2011, ITS experienced no significant fluctuations in 4
labor expense. The 2012 recorded labor was $3.090 million compared to $3.590 million for 2011. This 5
14 percent (or $0.500 million) reduction is primarily due to reductions in labor cost for the Device Tools 6
group in the ITS Automation Services group in support of SONGS. 7
This reduction was a result of increased enterprise standardization 8
in the creation and configuration, packaging and deployment, and version management of operating 9
systems, office productivity software, commercial off-the-shelf productivity software, and custom 10
software. 11
25
(b) Non-Labor Expense 1
All non-labor expenses for SONGS are net of participant credits. 2
SONGS participant credits are expense offsets received from the minority owners of SONGS that 3
represent their proportionate share of O&M expense billed by SCE.37 4
The ITS non-labor expense fluctuated over the five-year period 5
2008-2012. In 2009 we saw a 258 percent – or $0.501 million – increase from 2008. In 2010, non-labor 6
expense remained relatively flat. In 2011 ITS realized a 90 percent reduction in non-labor expense. 7
Finally, ITS realized an additional 138 percent reduction in non-labor expense in 2012 compared to 8
2011 recorded. 9
In 2009 the two primary attributing factors for the $0.501 million 10
increase were additional software expense in the Technology Delivery and Maintenance (TDM) division 11
of IT and increases for additional support in the Network Operations group in the Grid Services group 12
within ITS. The primary driver for the increase in non-labor expense for TDM software was expenses 13
paid to an asset performance management software company, Ivara. One of the primary drivers for the 14
increase in non-labor expense for the Network Operations group in 2009 was growth in temporary 15
resources to backfill project resources assigned to the ERP program and to the SONGS Lotus Notes 16
program. 17
In 2011 the 90 percent (or $0.373 million) reduction in non-labor 18
expenses was attributed primarily to reductions in TDM software expenses. The primary drivers for the 19
decrease in non-labor expense for TDM Software for FERC account 517 include decreased expenses for 20
Sybase business intelligence software and decreased expenses for Business Genetics analytics software. 21
In 2012 the 138 percent (or $0.062 million) reduction in non-labor 22
expense was attributed primarily to reductions in TDM Software contracts and reductions in IT Service 23
Desk support cost. The primary drivers for the decrease in non-labor expense for TDM Software for 24
517 include refunds for services not rendered for Sybase business intelligence software and decreased 25
37 SCE is the operating agent and majority owner of the San Onofre Nuclear Generating Station (SONGS). SCE owns
78.21 percent of SONGS with San Diego Gas & Electric (SDG&E) and the City of Riverside sharing in the remaining 21.79 percent. Since SCE is the majority owner and operating agent for SONGS, SCE bills the minority participants for their share of costs to operate these facilities. The amounts billed to the participants are recorded as credits (1.2., contra expense).
26
expenses for Business Genetics analytics software. Additional reductions were realized as a result of 1
cancelling the vendor IT service desk support contract and performing this work with SCE employees. 2
(2) Estimating Methodology and Test Year Forecast 3
Table II-5 Comparison Table for FERC Account 517
Recorded/Adjusted 2012 to 2015
O&M Expenses2012 Recorded/
Adjusted2015 Test
YearVariance Drivers
Labor $ 3,090 3,090$ -$ N/ANon-Labor $ (17) (17)$ -$ N/A
Total $ 3,073 3,073$ -$
(a) Labor Expenses 4
For 2013-2015 we forecast labor expenses of $3.090 million, equal 5
to 2012 recorded. Because labor expenses have fluctuated from year to year, the averaging 6
methodology would have been appropriate for forecasting this area. However, although averaging 7
would have produced a higher base year forecast, we have selected the last recorded year, which 8
adequately represents our labor cost needs for the test year. 9
(b) Non-Labor Expenses 10
For 2013-2015, we forecast non-labor expenses of $(17) thousand, 11
which is flat from 2012 recorded. This number represents an expense of $839 thousand with a 12
participant credit38 of $856 thousand resulting in a net non-labor request of $(17) thousand. Because 13
non-labor expenses have fluctuated from year to year, the averaging methodology would have been 14
appropriate for forecasting this area. However, although averaging would have produced a higher base 15
year forecast, we have selected Last Year Recorded as it represents a more accurate 2012 operating 16
expense base from which to project our 2015 test year. For test year 2015, we project that the 2012 17
recorded expense levels adequately represent the needs of our non-labor cost for the test year. 18
c) FERC Account 931- Infrastructure Technology Services 19
Activities recording to FERC account 931 are associated with facility rents and 20
leases, and communication circuit leases that the Network Services group within Grid Services in ITS 21
incurs in support of our communications network. For example, we rent space from government 22
38 Participant credits are credits billed back to SONGS partners for their agreed to share of costs.
27
agencies, private parties, and other public utilities so that we have the necessary space to install our 1
communications hardware such as radio control devices, antennae, and microwave transmission 2
equipment, throughout our service territory. The rented space can be in the form of a communication 3
building, tower, and/or land. These activities allow for voice and data communications needed to 4
support SCE electronic operations and permit employees to communicate and conduct daily business 5
activities with SCE resources, vendors, and customers. 6
The costs associated with rents are a function of our lease terms and of the 7
prevailing real estate market for these types of venues. We will continue to rely on facilities located 8
throughout SCE’s service territory to support our communications networks. 9
FERC Account 931 also includes costs to lease communications circuits from 10
outside vendors, such as AT&T, Sprint, and Verizon. We require these leased circuits to provide 11
network connections in those areas of our service territory where it is not feasible to install our own 12
communication equipment. 13
28
Figure II-6 Summary of Operations – Infrastructure Technology Services – Rents
Account 931 by Labor/Non-labor/Other Recorded 2008-2012 /Forecast 2013-2015
(Constant 2009 $000)
(1) Analysis of Recorded Cost 1
(a) Other Expenses 2
All of the costs recorded to FERC Account 931 by Network 3
Services are classified as “Other” because they are rents and leases and are not subject to labor and non-4
labor escalation. However, costs can fluctuate because certain landlords, such as the Bureau of Land 5
Management and the United States Forest Service do not bill on a monthly or annual basis, but rather in 6
greater intervals (e.g., every two years or more). As such, variances can occur from year to year. 7
In 2009 we recorded $3.896 million in Other expense, a 40 percent 8
increase from 2008 recorded. The primary driver for this increase was the transfer of cost into the Grid 9
Services group within ITS from the Transmission & Distribution Operating Unit (T&D) for satellite 10
communications. 11
From 2010 to 2011, there were no significant fluctuations in FERC 12
account 931. The 10 percent increase from 2011 to 2012 is attributed to increased costs associated with 13
Edison SmartConnect®, such as increased leased circuits and checkpoint firewall maintenance. 14
29
(2) Estimating Methodology And Test Year Forecast 1
In D.89-12-057, the CPUC stated that for those accounts which have 2
shown a general trend, last year recorded is an appropriate methodology. Although there were some 3
small fluctuations from 2009-2012 due to the inconsistent nature of the billings for both the leased sites 4
and leased circuits, there is still a general flat to upward trend. Therefore last recorded year is the most 5
appropriate methodology for base year calculation. We forecast $4.107 million for Other expenses for 6
test year 2015, which is no change from 2012 recorded costs. 7
Table II-6 Comparison Table for FERC Account 931
Recorded/Adjusted 2012 to 2015
O&M Expenses2012 Recorded/
Adjusted2015 Test
YearVariance Drivers
Other $ 4,107 4,107$ -$ N/ATotal $ 4,107 4,107$ -$ N/A
(a) Other Expenses 8
For 2015 we forecast Other expense to be $4.107 million, which is 9
no change from 2012 recorded. 10
C. Technology Delivery & Maintenance Division 11
1. Technology Delivery &Maintenance Division (TDM) 12
a) Description of Activities 13
The Technology Delivery and Maintenance Division (TDM) in IT is responsible 14
for the delivery, maintenance, operations, and end user support for all application systems. This 15
includes providing support for software fixes, enhancements, interfaces, and reporting to meet business 16
operations and information technology needs for SCE. In addition, TDM supports all phases of 17
information technology project implementation including planning, analysis, design, configuration, 18
construction, quality control, testing, and implementation. 19
TDM’s primary function is to support all of SCE’s Operational Units by solving 20
business problems with information technology solutions. TDM’s activities are all traditional “IT” type 21
responsibilities, which include delivering, testing, and maintaining systems for all Operating Units 22
within SCE. Technology, however, continues to change rapidly—the use of information technology has 23
moved beyond isolated problem-based applications to the point where it is now the platform on which 24
all business transactions take place. At SCE, this has meant infusing intelligence into systems and 25
30
processes. Such changes have necessitated significant investments in licensing, hardware, software, and 1
personnel. These investments have allowed existing staff to handle larger volumes of work, improve 2
safety and reliability, replace aging infrastructure, and engage customers in such issues as energy 3
conservation and environmental sustainability. 4
b) Technology Solutions by Operating Unit: 5
The precise application of information technology to support SCE’s business 6
processes and procedures is critical to enabling energy to flow to our customers adequately, reliably, and 7
securely. The following paragraphs describe many of the systems supported by TDM to enable and 8
support SCE’s individual Operating Units in pursuit of these goals. 9
(1) Enterprise Asset Management Solutions Group 10
The Enterprise Asset Management Solutions (EAM) group in TDM 11
provides functionality for all Operating Units, and provide support to the entire enterprise regarding 12
asset management, work management, and environment health and safety processes. The EAM group 13
provides technology services and solutions that enable asset and work management business functions 14
including work initiation, planning, scheduling, execution, and closure capabilities; project and program 15
management capabilities; asset maintenance and life-cycle planning; organization and tracking of asset 16
attributes; and integration of other enterprise processes (such as supply chain, finance, document 17
management, and human resources) in the work execution processes. Activities include assessing 18
proposed changes to processes, making recommendations, initiating procurement of solutions, 19
performing configuration of those solutions, and supporting application systems. 20
Applications within this solution area include: 21
SAP Plant Management 22
SAP Project Scheduling 23
SAP Portfolio & Project Management 24
ActionWay for SONGS’ Corrective Action Program 25
ClickSoft scheduling for Transmission and Distribution Operating 26
Unit’s dispatching of work 27
Monitoring Asset Reliability System (MARS)/Computerized Asset 28
Management Systems (CAMS) for generation asset reliability 29
management 30
31
The work management solutions and systems manage the initiation, 1
planning, scheduling, and execution of work conducted to maintain the electric grid infrastructure. The 2
asset management solutions and systems track and maintain information related to the location, age, 3
design characteristics, inspection, maintenance and operating statistics, installation, removal, 4
replacement and salvage of physical assets. 5
The environmental, health and safety solutions and the environmental 6
services solutions help SCE remain compliant with environmental health and safety regulations such as 7
gasoline storage and dispensing tracking, injury-incident reporting, and environmental health and safety 8
auditing. Applications included are Environmental Information Management and Environmental Health 9
& Safety Compliance Management. 10
(2) Supply and Operations Solutions Group 11
The Supply and Operations Solutions group in TDM consists of Supply 12
Chain Management, Transportation Services, and Corporate Resources applications that support all of 13
SCE. Supply Chain Management provides procurement, material management, and document/records 14
management capabilities. For suppliers, the Supplier Relationship Management function of the Supply 15
and Operations solutions provides the capability for enhanced purchasing activities including requests 16
for quotes, requests for proposals and requests for information from vendor. It has also allowed for 17
automation of routine procurements through the use of catalogs and shopping carts. The application has 18
been designed to work in concert with SAP's material management module, which is the system of 19
record where purchase orders, agreements and master data are stored. In addition, the suppliers have a 20
self-service portal function that provides the ability for receiving purchase orders, entering time worked, 21
and entering invoices. 22
Transportation Services and Corporate Resources functions of the Supply 23
and Operations Solutions group allow SCE to transport the resources and equipment and build the 24
facilities needed to generate, transmit, and distribute electrical power to support the needs of its 25
customers. 26
(3) Human Capital Management and Compliance 27
The Human Capital Management and Compliance Solutions group 28
provides human resources (HR) functionality and compliance functionality across SCE’s Operating 29
Units. This group provides support for systems that perform HR functions including employee call 30
center capabilities, recruiting, onboarding and administration of employee events, employee training and 31
32
development, performance development planning, compensation management, succession planning, 1
employee benefits, time entry and payroll processing. These applications support and enable the Human 2
Resources and Payroll Divisions of the Financial and Operational Services Operating Units to deliver 3
the business processes described above, in compliance with operating and reporting regulations 4
mandated by federal, state, and local agencies. 5
This team also supports systems that perform compliance functions for all 6
Operating Units, such as segregation of duties; risk management; compliance with legislations such as 7
Sarbanes-Oxley and NERC CIP; safety and risk mitigation; protecting employees, assets, information 8
and customer interests; and ensuring a safe and secure work environment. 9
The support for all human resources and compliance application systems 10
includes assessing proposed changes, making recommendations, initiating procurement of solutions, 11
performing configuration, and support. 12
(4) Energy – Nuclear Solutions Group 13
The resources within the TDM Energy Solutions group assess, 14
recommend, develop, procure, install, and support application systems for the Nuclear and Power 15
Supply Operating Units. This includes providing integration services between custom solutions, 16
procured applications and the SAP Enterprise Resource Planning (ERP) system. The applications that 17
directly support the San Onofre Nuclear Generating Station (SONGS) are included within this portfolio 18
of applications. 19
These applications support and enable SONGS staff to safely operate the 20
nuclear facility, as well as to assist in complying with specific operating and reporting measurement and 21
documentation regulations mandated by the Nuclear Regulatory Commission, the State of California, 22
and local agencies. Application examples include safety tagging systems, radiation health physics 23
systems, access controls systems, and qualification management systems. These applications support 24
the safe, compliant, and efficient operation of SONGS. Several existing applications were migrated to 25
the ERP system, but the need for specialized services and business automation to support the safe and 26
efficient operation of SONGS has continued. 27
(5) Energy – Non Nuclear Solutions Group 28
The Power Supply Operating Unit and the Risk Control Division of the 29
Finance & Operations Support Operating Unit use systems supported by TDM for making power 30
procurement decisions and for managing the SCE-owned energy resources that service customer load. 31
33
These systems facilitate the energy procurement planning, purchasing, scheduling, dispatching, 1
metering, and settlement functions needed to meet customer load requirements. Should these systems 2
become unavailable, it would significantly impair Power Supply’s ability to service customer load and 3
comply with regulations such as the CPUC’s “least cost dispatch”39 mandate. According to the 2010 4
LTPP proceeding R.02-12-074, 8.A.4. Prudent Administration of Contracts: 5
Rule: The utilities shall prudently administer all contracts and generation resources 6
and dispatch the energy in a least-cost manner. (CPUC SOC 4) 7
Discussion of Rule: Prudent contract administration includes administration of all 8
contracts within the terms and conditions of those contracts, including dispatching 9
dispatchable contracts when it is economical to do so. In administering contracts, the 10
utilities have the responsibility to dispose of economic long power and to purchase 11
economic short power in a manner that minimizes ratepayer costs.40,41 12
SCE implemented the Market Redesign and Technology Upgrade 13
(MRTU) program in 2009. This program is designed to create a power grid that is more reliable, more 14
efficient, and more transparent—objectives that required significant technological adjustments on SCE’s 15
part. These changes included the replacement of several key Power Supply applications. One of the 16
major initiatives was the implementation of the Power Costs Inc. (PCI) suite of applications: 17
GenTrader, GenManage, GenPortal and its associated database, GenBase. This system serves as the 18
backbone for multiple business functions within Power Supply, including day-ahead and real-time 19
power trading, bid optimization, gas procurement, pre-scheduling, and outage management. 20
Additionally, significant efforts were employed to integrate the 21
information produced by the multiple, simultaneous, complex transactions performed by the above 22
39 Least cost-dispatch refers to a situation in which the most cost-effective mix of total resources is used, thereby
minimizing the cost of delivering electric services. Once a contract has been deemed compliant with the utilities’ procurement plan, the contract is not subject to a reasonableness review. However, the administration of the contract by the utility remains subject to reasonableness review and disallowance through ERRA proceedings.
40 Additional References:D.02-10-062, at 52, as modified by D.02-12-074, D.03-06-067, D.03-06-076; D.05-01-054 (regarding scope of review and standard of review for contract administration in ERRA proceedings); D.02-12-074, at OP 24.b.
41 See workpaper entitled “Reference to Least Cost Dispatch - D.02-12-074 Order” and “Reference to Least Cost Dispatch - D.02-10-062 Conclusion of Law.”
34
mentioned systems with ERP. This successful initiative has allowed for the integration of energy 1
financial settlements with the ERP financial system. 2
(6) Finance and Legal Solutions Group 3
The Finance and Legal Solutions group provides application support for 4
all Operating Units including Financial & Operational Services, Legal, Audit Services, and Regulatory 5
Affairs. This group provides support for systems to perform corporate accounting, tax filing, treasury 6
cash management, and legal matters. 7
SCE’s financial software has been configured to meet the financial and 8
regulatory needs of SCE and accommodate cost flow requirements, regulatory and managerial 9
accounting, accounts payable, and asset accounting. Functionality included are financial accounting and 10
consolidations, managerial accounting, FERC accounting, fixed asset accounting including continuous 11
property records, accounts payable/accounts receivable, non-energy billing, budgeting, treasury cash 12
management, treasury and long term planning. 13
TDM also assists the Legal and Regulatory Affairs Operating Units by 14
maintaining the Regulatory Case Management System, the Law Document Management/Records 15
Management System, the Tariff Management System, and the Claims Management System. These 16
application systems help the Legal Operating Unit and Regulatory Affairs manage litigation activities, 17
regulatory proceedings, compliance activities, and other legal matters including the handling of 18
customer claims and workers compensation claims. The functionality they provide supports the ongoing 19
legal and regulatory work performed by the Legal and Regulatory Affairs Operating Units. 20
(7) Transmission and Distribution Solutions Group 21
The Transmission and Distribution Solutions group maintains the 22
application systems used by the Transmission and Distribution Operating Unit (T&D) to safely and 23
effectively construct, operate, and maintain the infrastructure that delivers electricity to SCE’s 24
customers. Examples of these application systems include the Energy Management System (EMS), 25
Distribution Management System (DMS), the Outage Management System (OMS), Transmission and 26
Distribution Asset Mapping System (T&D Asset Mapping), and Design Manager (DM). 27
The Energy Management System (EMS) monitors alarms to inform grid 28
operators when a power line becomes overloaded or when a circuit breaker opens due to an abnormal 29
condition. EMS allows the grid operator to remotely perform critical functions such as opening and 30
closing circuit breakers to energize or de-energize a line, monitor load, and gather timely information 31
35
related to system conditions and reliability. EMS also collects transmission and generation related data 1
and transmits this data to the California Independent System Operator (CAISO) every four seconds. 2
Access to this real-time status information allows the ISO and SCE to engage in the effective 3
coordinated grid operations required to operate transmission and distribution infrastructure within safe 4
physical limits. 5
The Distribution Management System (DMS) enables grid operators to 6
monitor and remotely control specific equipment not included within the scope of EMS such as pole 7
switches and capacitors located on the distribution system. Automating this equipment and providing 8
operators with remote control capability greatly facilitates T&D’s ability to reduce outage time for its 9
customers. 10
The Outage Management System is used by the Grid Operations Division 11
within T&D to monitor, respond to, and plan outages within SCE’s distribution network. The system 12
provides three key functions: 13
Outage/incident management - key information in determining the 14
“most probable outage location” by grouping outage calls. 15
Circuit map viewing used to maintain near real-time electrical circuit 16
connectivity. 17
Switching plan creation and generation, used to prepare step-by-step 18
procedures for performing planned maintenance of SCE’s electrical 19
distribution system. 20
The Transmission and Distribution Asset Mapping system is an essential 21
geo-spatial analysis tool used within T&D for understanding problems in the field. It allows 22
Troublemen and line crews to quickly isolate and solve an issue within a transmission and distribution 23
network. In the event an outage requires resources and equipment above and beyond those available as 24
part of the initial response, this information allows those first responders to quickly restore service to as 25
many customers as possible. 26
(8) Customer Service Solutions 27
The Customer Service Operating Unit (CS) uses the systems and other 28
technologies implemented and supported by the Customer Service Solutions group in TDM to deliver 29
programs and services to SCE’s 4.9 million customers. These programs and services include: 30
Meter installations, testing, and repairs 31
36
Turn on and turn off of electrical service 1
Meter reading and data transfer to billing systems 2
Bill calculation and preparation 3
Managing credit and payment options 4
Energy theft investigations 5
Managing relationships with large manufacturers, government 6
facilities, and agricultural and commercial enterprises 7
Developing and implementing energy efficiency programs and 8
services 9
There are a number of applications used by CS to deliver the above 10
products and services. One of the most important is the Customer Services System (CSS). CSS 11
provides over 100 functions supporting the Customer Care and Billing business processes. The system 12
is essential in providing accurate and timely customer bills, tracking receivables, and creating and 13
tracking field service orders (e.g., turning a customer’s electric service “on” or “off”). CSS generates 14
approximately 250,000 customer bills each business day. As such, even a one-day outage can have a 15
significant impact on SCE’s operations. CSS is also used to manage customer relationships, initiate new 16
service requests, schedule and track service calls, and bill for products and services. 17
Another essential system used by Customer Service is the Account 18
Management Information System (AMIS). This system is used by CS for the delivery of basic customer 19
care to SCE’s business customers. AMIS allows CS to manage contact information (e.g., for rotating 20
outages and mass mailings), track customer projects (e.g., energy efficiency, new construction), view 21
and report customer data (e.g., billing history), and provide current and archival information (e.g., 22
energy efficiency and demand response program information). 23
The Real Time Energy Metering (RTEM) system supports the metering 24
devices installed to support AB1x-29. AB1x-29 was passed in response to California’s energy crisis and 25
requires all service accounts whose demands exceed 200kW to have a Real Time Energy Meter 26
installed. The RTEM system is the repository of real-time usage data acquired from these meters and 27
acts as the “clearing house” for the business groups and application systems that use this data. This 28
includes the customer billing system, the Energy Supply and Management department, and the 29
Regulatory Operations department. 30
37
SCE.com is the primary website for SCE’s customers to conduct business 1
with SCE over the Internet. The website provides SCE customers with secure Internet access to 2
information about their electric usage (including Edison SmartConnect® interval data), paperless-bills 3
and electronic payment, planned outages, energy management solutions, and much more. This self-4
service functionality allows SCE’s customer service representatives to focus on more complex, 5
consultative interactions with our customers, and allows SCE to meet the anticipated increase in 6
customer support needs associated with the introduction of new dynamic rates and load management 7
programs, as well as new technologies (Home Energy Management/Home Area Networks, Plug-in 8
Electric/Hybrid Vehicles) to help customers better manage their energy use. 9
(9) Technology Solutions and Support Group 10
The Technology Solutions and Support group in TDM provides 11
production support and build/maintain lifecycle activities for enterprise applications, tools, and 12
technologies. For example, this organization ensures systems and software reliability for the SAP 13
solutions supporting critical business functions. The group also provides successful implementation of 14
IT internal projects such as software and hardware upgrades, enterprise-wide large and complex 15
technology efforts such as Microsoft Windows upgrade, IT cybersecurity, configuration management, 16
and Data Center migration. This is accomplished by working with IT internal customers to deliver 17
business solutions for the IT Operating Unit. 18
The support of all the SAP applications and the associated COTS 19
applications are critical to the business operations of SCE. Currently the key core enterprise business 20
functions provided by SAP are Financial Management, Supply Chain Management, Human Capital 21
Management, Customer Relationship Management, Work Management, and Enterprise Asset 22
Management. These core functions and the integrated SAP platform enable SCE to be prepared for 23
needed growth and support for the replacement of the large electrical infrastructure to continue to 24
provide a reliable electrical service to our customers. The Technology Solutions and Support group is 25
comprised of the following organizations: 26
(a) SAP Operations Group 27
The SAP Operations group is accountable for day to day 28
operability of the SAP solutions to ensure the reliability, integrity, security and performance of systems 29
and software. This includes business critical SAP solutions such as Enterprise Core Components, 30
Human Capital Management, Finance, Enterprise Asset Management, Enterprise Portal and Supplier 31
38
Portals, Process Integration (PI), as well as other technologies and tools that directly support core 1
business functions and information needs for SCE. 2
Major responsibilities include: 3
Provide planning, strategy, design and general consultation 4
services related to upgrade/maintenance activities to the 5
hardware, operating systems, database environments and 6
appliances for the SAP application environment, 7
Provide daily operational activities for monitoring, patch 8
management, level 2/3 incident support, performance tuning, 9
output management, job scheduling, and backup/recovery for 10
all SAP solutions, and 11
Support technical integration for SAP solutions that perform 12
business analytics and enterprise-wide cross application 13
integration via SAP PI or other third-party appliances. 14
(b) System Operations and User Administration Group 15
The System Operations and User Administration group manages 16
accessibility and provides a secure environment for SCE internal users as well as external users and 17
company data for day to day operability of the SAP solutions and maintaining the technical aspects of 18
all SAP Governance Risk and Compliance application solutions. 19
Major responsibilities include: 20
Perform security requirement analysis, design, and 21
configuration activities in compliance with enterprise corporate 22
security policies for the SAP applications and other integrated 23
systems; 24
Build and maintain application roles and position-based 25
security models and authorizations across the entire SAP 26
landscape; 27
Maintain automated interfaces for user access and 28
provisioning, and integration with Identity Management 29
technical components; 30
39
Maintain all technical aspects of all SAP Governance Risk and 1
Compliance applications; and 2
Support ongoing security based development and maintenance 3
activities related to SAP and third-party appliances. 4
(c) Application Development Management Group 5
The Application Development Management group provides 6
maintenance and development for enterprise applications, tools and technologies. The largest of these 7
applications is SAP and the group is responsible for ensuring that the associated systems are reliable, 8
stable, effective, and efficient. 9
2. Analysis of Operations & Maintenance Expense by FERC Accounts 10
a) FERC Account 920/921 – TDM 11
Figure II-7 Summary of Operations –Technology Delivery & Maintenance
Accounts 920/921 by Labor/Non-Labor/Other Recorded 2008-2012 / Forecast 2013-2015
(Constant 2012 $000)
(1) Analysis of Recorded Costs 12
(a) Labor Expenses 13
From 2008 to 2009, TDM FERC Account 920 labor increased 14
$13.307 million, or 79 percent. The primary driver of the 2009 increase was the implementation of 15
Release 1 of the ERP system in 2008, which required staffing the Center for Continuous Improvement 16
40
(CCI) for SAP support beginning in 2009, which was required by SCE’s license agreement with SAP. 1
In addition, Release 1 ended the temporary system freeze for many systems, releasing a 2-year backlog 2
of work which required a higher level of support. A smaller secondary cause was the beginning of 3
Market Redesign Technology Update (MRTU) charges. 4
From 2009 to 2010, FERC Account 920 labor expenses increased 5
$9.130 million, or 30 percent, due mainly to the implementation of Releases 2 and 3 of the ERP system, 6
which required additional staffing for the CCI for SAP support as required by SCE’s license agreement 7
with SAP. Additionally Release 3 ended the temporary system freeze for all systems, releasing a 2-year 8
backlog of work, which required a higher level of support. A smaller secondary cause was the first full 9
year of MRTU charges. 10
From 2010 to 2011, FERC Account 920 labor expenses increased 11
$4.791 million, or 12 percent, due mainly to the completion of staffing for the CCI organization to 12
support the ERP system. 13
From 2011 to 2012, labor expenses experienced no significant 14
change. 15
(b) Non-Labor Expenses 16
From 2008 to 2009, FERC Account 920 non-labor expenses 17
increased $5.762 million, or 27 percent. The two primary drivers of the increase in 2009 were the 18
beginning of Market Redesign Technology Update (MRTU) charges ($3.1 million) and the 19
implementation of Release 1 of the ERP system, which required funding for the CCI (Center for 20
Continuous Improvement) for SAP support, which was required by SCE’s license agreement with SAP. 21
In addition, Release 1 ended the temporary system freeze for many systems, releasing a 2-year backlog 22
of work which required a higher level of support. 23
From 2009 to 2011, FERC Account 920 non-labor expenses 24
experienced no significant change. 25
From 2011 to 2012, FERC Account 920 non-labor expenses 26
decreased $11.304 million, or 37 percent The two primary drivers were (1) a completion of much of the 27
backlogged work during the year, which freed up the resources required to support the backlog effort, 28
and (2) SCE delaying some spending on operations and maintenance due to the late 2012 GRC decision. 29
41
3. Estimating Methodology and Test Year Forecast 1
In compliance with one of the CPUC Final Decision Directives for the 2015 GRC IT 2
Testimony on Capitalized Software,42 we reviewed our existing methodology for estimating GRC 3
capitalized projects. One of the directives was to ensure SCE employs best industry practices in making 4
its capitalized software project cost estimates, particularly as to in-house labor, project management and 5
contingency. Additionally, since project managers at the time of the 2012 Final Decision were in the 6
process of estimating 2015 GRC project estimates, we needed to develop a common estimation 7
methodology for their immediate use. 8
A cross-functional IT team collaborated and agreed on the common areas that made up 9
the components of the estimation model, and ultimately a single methodology and workpaper was used 10
as the benchmark. Some of these components included: 11
Classification of projects into various COTS and Development project types, 12
Labor rates used, 13
Contingency levels, 14
Various cost components such as capitalization of ongoing licensing fees, 15
Labor expenses, and 16
Vendor allocations. 17
This estimation model and methodology helped provide further consistency in 18
establishing high level capital project estimates across all areas in IT.43 19
Table II-7 Technology Delivery & Maintenance
Comparison Table for FERC Account 920/921 Recorded/Adjusted 2012 to 2015
O&M Expenses
2012 Recorded/ Adjusted
2015 Test Year Variance Drivers
Labor $ 41,100 31,274$ (9,826)$ OpX SavingsNon-Labor $ 18,960 17,669$ (1,291)$ OpX Savings
Total $ 60,060 48,943$ (11,117)$
42 D.12-11-051, pp. 435-436, also Ordering Paragraph 27.
43 See workpaper entitled “2015 GRC IT Capital Estimates TEMPLATE v1.1.doc,” and “GRC Estimation Worksheet TEMPLATE v1.1.xls.”
42
a) Labor Expenses 1
For 2015, we forecast labor expenses of $31.274 million, a $9.826 million 2
reduction from 2012. Even though recorded data indicates an averaging methodology would be an 3
acceptable basis for a forecast of labor expenses, we have chosen the last recorded year as it best 4
represents the most accurate 2012 labor expenses and the most transparent basis for the in 2015 request. 5
This reduction from our 2012 recorded as a result of OpX savings partially offset by an additional 6
request for $1.7 million in severance as described in Chapter 1, section B of this testimony. 7
b) Non-Labor Expenses 8
For 2015, we forecast non-labor expenses of $18.141 million, a $0.918 million 9
reduction from 2012. As with the labor expenses for this account, although recorded data indicates an 10
averaging methodology would an acceptable forecast methodology of non-labor expenses, we have 11
chosen the last recorded year. The differences in using either methodology are relatively minor and are 12
mitigated by the fact that we are requesting a decrease in funding for this account from 2012 recorded 13
spending levels. For test year 2015, we reduced our expenses from our 2012 base to reflect SCE’s OpX 14
savings efforts. 15
43
c) FERC Account 517 – TDM 1
Figure II-8 Summary of Operations –TDM Support for Nuclear
Account 517 by Labor/Non-labor/Other Recorded 2008-2012 /Forecast 2013-2015
(Constant 2012 $000)
2008 2009 2010 2011 2012 2013 2014 2015Labor 3,009 4,022 4,344 3,992 3,844 3,844 3,350 2,067
Non-labor 500 1,535 1,524 1,915 1,281 1,281 1,281 1,281Participant Credits (Non-Labor) (720) (1,198) (1,269) (1,268) (1,117) (1,117) (1,009) (730)Total 2,789 4,359 4,599 4,639 4,008 4,008 3,622 2,618
Adjusted/Recorded Forecasted
Recorded 2008- 2012 /Forecast 2013 - 2015(Constant 2012 $)
$000Net Summary of Operations - Technology Delivery and Management
Account 517 by Labor/Non-Labor/Participant Credits
(500)
500
1,500
2,500
3,500
4,500
5,500
6,500
2008 2009 2010 2011 2012 2013 2014 2015
Labor Non‐labor Participant Credits (Non‐Labor)
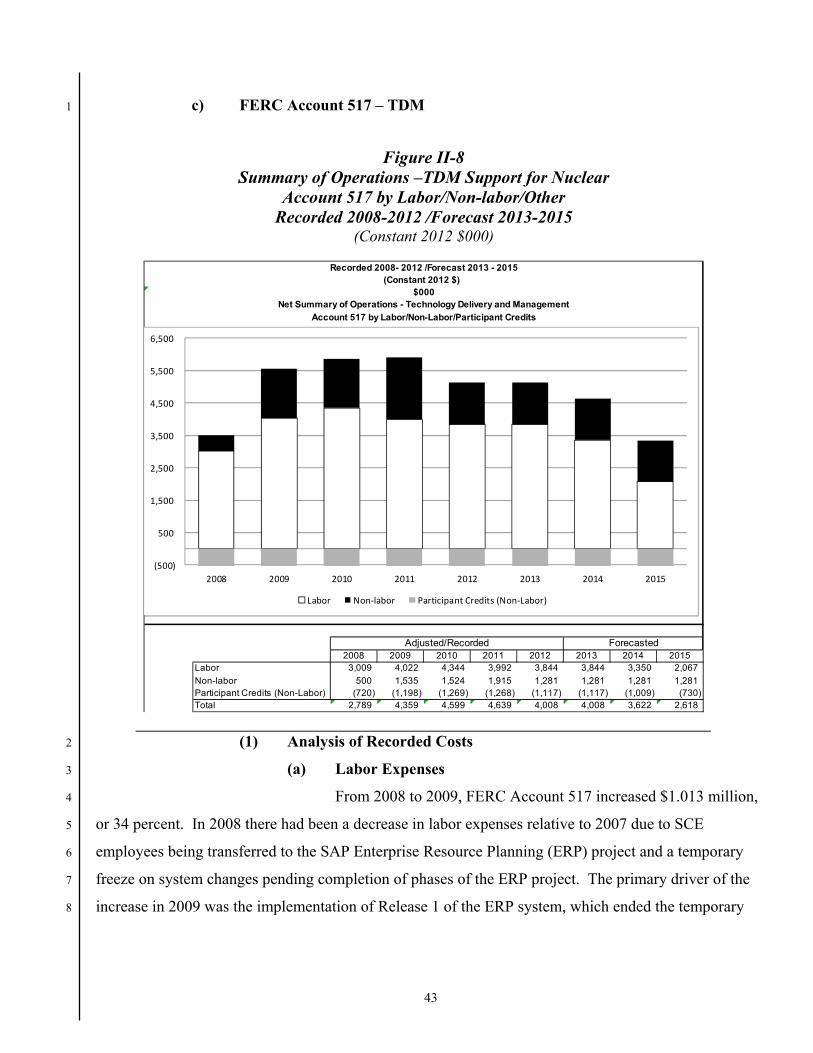
(1) Analysis of Recorded Costs 2
(a) Labor Expenses 3
From 2008 to 2009, FERC Account 517 increased $1.013 million, 4
or 34 percent. In 2008 there had been a decrease in labor expenses relative to 2007 due to SCE 5
employees being transferred to the SAP Enterprise Resource Planning (ERP) project and a temporary 6
freeze on system changes pending completion of phases of the ERP project. The primary driver of the 7
increase in 2009 was the implementation of Release 1 of the ERP system, which ended the temporary 8
44
system freeze for most applications in the San Onofre (FERC 517) portfolio of applications and brought 1
a return to a normal level of support employees. 2
From 2009 to 2011, FERC Account 517 labor expenses remained 3
relatively flat due to a lack of significant change to the San Onofre portfolio of applications. While the 4
ERP project freeze was no longer an issue, the San Onofre Steam Generator Replacement project 5
established a similar freeze process. This allowed windows of a few months duration when software 6
maintenance could be implemented, but there was little demand or capacity for significant system 7
changes because the San Onofre organization was appropriately focused on executing the Steam 8
Generator Replacement outages successfully. In addition, a significant portion of the portfolio – asset 9
management, work management, and supply chain functions – had moved to the enterprise solution 10
(SAP). So maintenance and operation activities of existing systems continued at a steady pace, but the 11
portfolio did not grow significantly during this period. 12
From 2011 to 2012, FERC Account 517 labor expenses remained 13
relatively flat due to a lack of significant change to the San Onofre portfolio of applications. There was 14
little demand or capacity for significant system changes because the San Onofre organization was 15
appropriately focused on addressing the steam generator issues. Therefore, maintenance and operation 16
activities of existing software systems continued at a steady pace, but the portfolio did not grow 17
significantly during this period. 18
(b) Non-Labor Expenses 19
All non-labor expenses for SONGS include participant credits. 20
SONGS participant credits are expense offsets received from the minority owners of SONGS that 21
represent their proportionate share of O&M expense billed by SCE.44 The numbers below represent the 22
net of non-labor expenses and participant credits. 23
From 2008 to 2009, FERC Account 517 included an increase in 24
non-labor expenses of $0.557 million. In 2008 there was a decrease in non-labor expenses due to a 25
temporary freeze on system changes for the ERP project. The primary driver of the increase in 2009 26
44 SCE is the operating agent and majority owner of the San Onofre Nuclear Generating Station (SONGS). SCE owns
78.21 percent of SONGS with San Diego Gas & Electric (SDG&E) and the City of Riverside sharing in the remaining 21.79 percent. Since SCE is the majority owner and operating agent for SONGS, SCE bills the minority participants for their share of costs to operate these facilities. The amounts billed to the participants are recorded as credits (i.e., contra expenses).
45
was the implementation of Release 1 of the ERP system, which ended the temporary system freeze, 1
releasing a 2-year backlog of work which required a higher level of support. 2
From 2009 to 2010, FERC Account 517 non-labor expenses 3
decreased by 25 percent (or $82,000) due to larger participant credits associated with the labor for 4
continued efforts on the backlog of maintenance activity. 5
From 2010 to 2011, FERC Account 517 non-labor expenses 6
included an increase of $392,000, due to continued efforts on the backlog of maintenance activity 7
following ERP Release 2. 8
From 2011 to 2012, FERC Account 517 non-labor expenses 9
decreased $483,000 or 75 percent. This was primarily due to a reduction in software maintenance 10
during the system freeze associated with the extended SONGS plant outages, as well as a conservative 11
approach to spending on operations and maintenance due to the late GRC decision. 12
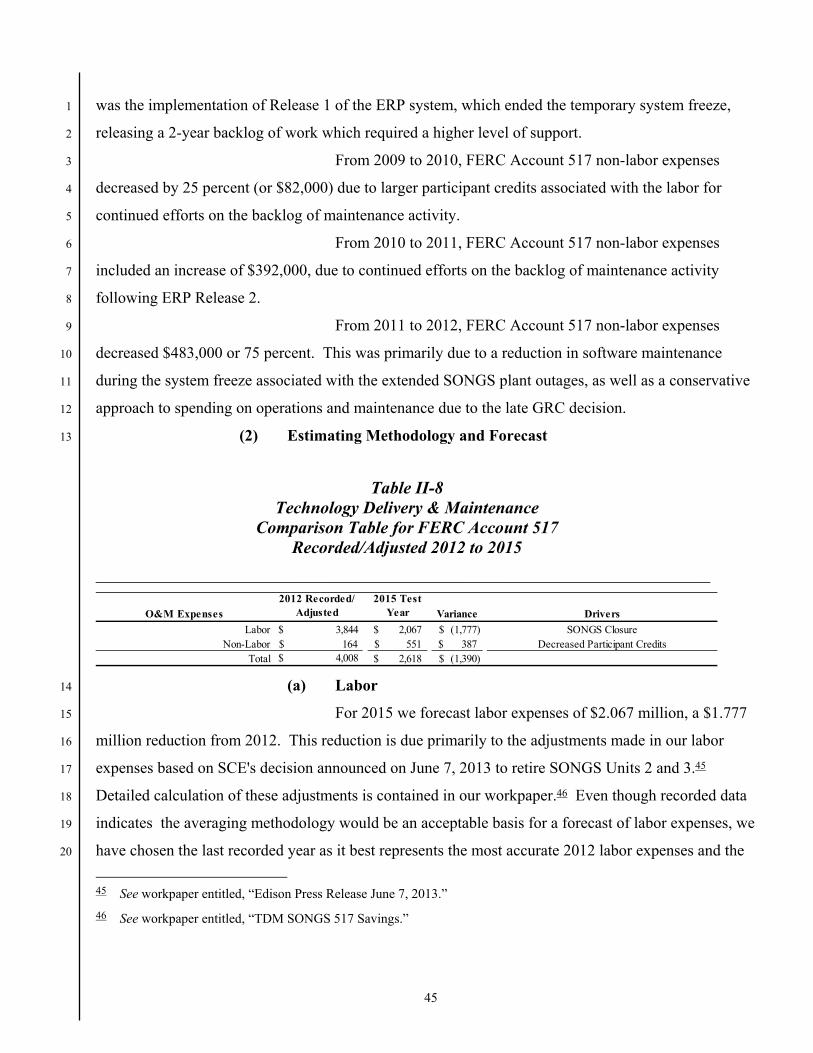
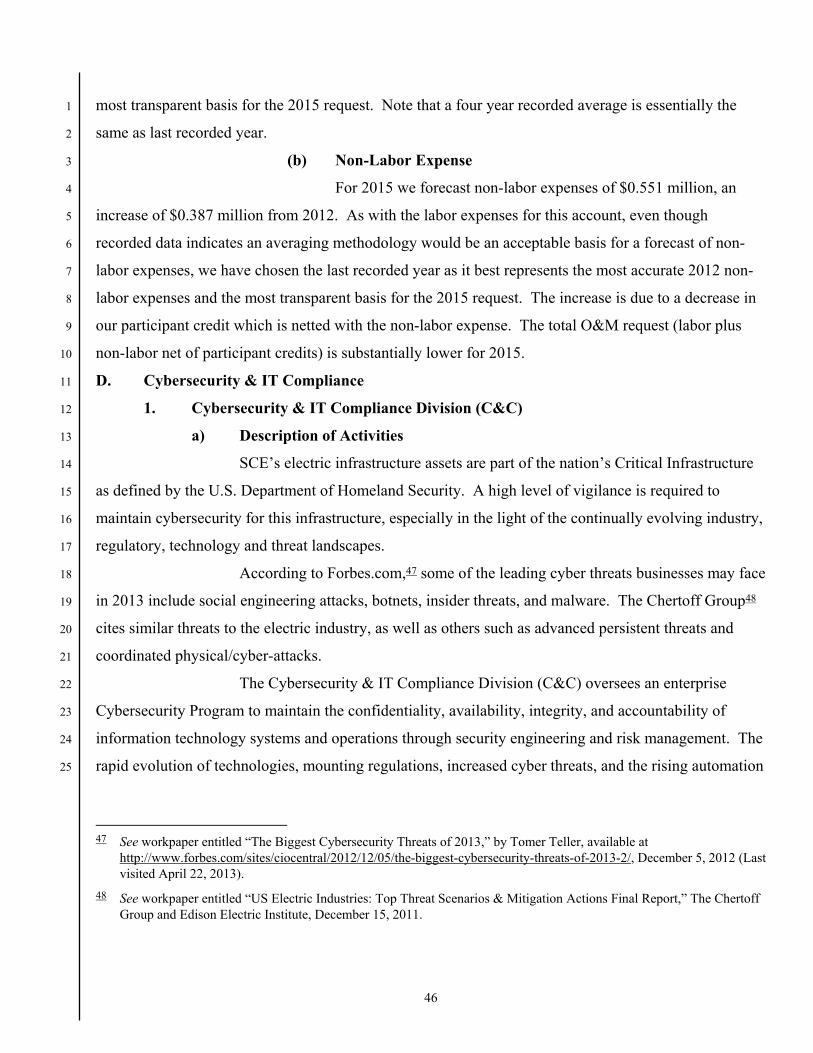
(2) Estimating Methodology and Forecast 13
Table II-8 Technology Delivery & Maintenance
Comparison Table for FERC Account 517 Recorded/Adjusted 2012 to 2015
_____________________________________________________________________________
O&M Expenses
2012 Recorded/ Adjusted
2015 Test Year Variance Drivers
Labor $ 3,844 2,067$ (1,777)$ SONGS ClosureNon-Labor $ 164 551$ 387$ Decreased Participant Credits
Total $ 4,008 2,618$ (1,390)$
(a) Labor 14
For 2015 we forecast labor expenses of $2.067 million, a $1.777 15
million reduction from 2012. This reduction is due primarily to the adjustments made in our labor 16
expenses based on SCE's decision announced on June 7, 2013 to retire SONGS Units 2 and 3.45 17
Detailed calculation of these adjustments is contained in our workpaper.46 Even though recorded data 18
indicates the averaging methodology would be an acceptable basis for a forecast of labor expenses, we 19
have chosen the last recorded year as it best represents the most accurate 2012 labor expenses and the 20
45 See workpaper entitled, “Edison Press Release June 7, 2013.”
46 See workpaper entitled, “TDM SONGS 517 Savings.”
46
most transparent basis for the 2015 request. Note that a four year recorded average is essentially the 1
same as last recorded year. 2
(b) Non-Labor Expense 3
For 2015 we forecast non-labor expenses of $0.551 million, an 4
increase of $0.387 million from 2012. As with the labor expenses for this account, even though 5
recorded data indicates an averaging methodology would be an acceptable basis for a forecast of non-6
labor expenses, we have chosen the last recorded year as it best represents the most accurate 2012 non-7
labor expenses and the most transparent basis for the 2015 request. The increase is due to a decrease in 8
our participant credit which is netted with the non-labor expense. The total O&M request (labor plus 9
non-labor net of participant credits) is substantially lower for 2015. 10
D. Cybersecurity & IT Compliance 11
1. Cybersecurity & IT Compliance Division (C&C) 12
a) Description of Activities 13
SCE’s electric infrastructure assets are part of the nation’s Critical Infrastructure 14
as defined by the U.S. Department of Homeland Security. A high level of vigilance is required to 15
maintain cybersecurity for this infrastructure, especially in the light of the continually evolving industry, 16
regulatory, technology and threat landscapes. 17
According to Forbes.com,47 some of the leading cyber threats businesses may face 18
in 2013 include social engineering attacks, botnets, insider threats, and malware. The Chertoff Group48 19
cites similar threats to the electric industry, as well as others such as advanced persistent threats and 20
coordinated physical/cyber-attacks. 21
The Cybersecurity & IT Compliance Division (C&C) oversees an enterprise 22
Cybersecurity Program to maintain the confidentiality, availability, integrity, and accountability of 23
information technology systems and operations through security engineering and risk management. The 24
rapid evolution of technologies, mounting regulations, increased cyber threats, and the rising automation 25
47 See workpaper entitled “The Biggest Cybersecurity Threats of 2013,” by Tomer Teller, available at
http://www.forbes.com/sites/ciocentral/2012/12/05/the-biggest-cybersecurity-threats-of-2013-2/, December 5, 2012 (Last visited April 22, 2013).
48 See workpaper entitled “US Electric Industries: Top Threat Scenarios & Mitigation Actions Final Report,” The Chertoff Group and Edison Electric Institute, December 15, 2011.
47
of the electric grid require the strengthening of key C&C functions. To accomplish this mission, C&C is 1
organized into two major functional areas: the Cybersecurity function, and the IT Compliance function. 2
(1) Cybersecurity Function 3
Addressing cybersecurity is critical to enhancing the security and 4
reliability of the nation’s electric grid. Ensuring a resilient electric grid is particularly important since it 5
is the most complex and critical infrastructure that other sectors (e.g., transportation, communications) 6
depend upon to deliver essential services. A report by the Edison Electric Institute on Principles for 7
Cybersecurity and Critical Infrastructure Protection states: 8
Protecting the nation’s electric grid and ensuring a reliable supply of power 9
are the electric power industry’s top priorities. Cybersecurity incidents may 10
disrupt the flow of power or reduce the reliability of the electric system. 11
Key to the success of this effort is the ability to provide measures capable of 12
protecting the evolving intelligent network against interruption, exploitation, 13
compromise or outright attack of cyber assets, whether the attack vector is 14
physical, cyber, or both.49 15
C&C’s Cybersecurity engineers are highly technical specialists that are 16
trained to provide protection from cyber threats, such as malicious intrusion by hackers or insiders and 17
the proliferation of various forms of infections such as viruses, worms, spy-ware, and ad-ware, which 18
can affect the ability to provide reliable generation and delivery of electric power. Cybersecurity 19
engineers conduct cyber threat analysis, monitor and mitigate threats to SCE’s information assets, keep 20
abreast of changes in security technologies, perform forensic and e-discovery services, and provide 21
expert advice to projects on security matters. Additionally, the Cybersecurity Engineering group 22
provides data loss prevention solutions to detect and prevent unauthorized attempts to copy or send 23
sensitive data outside SCE, intentionally or unintentionally. 24
The SCE facilities that operate high-risk systems require dedicated 25
monitoring.50 Therefore, on-site deployment of resources at these facilities is needed for situational 26
awareness and to deal with threats in real-time. Organizations with systems in this high-risk category 27
include the Nuclear Operating Unit, Power Supply’s Power Production and Power Procurement 28
49 See workpaper entitled “Edison Electric Institute on Principles for Cybersecurity and Critical Infrastructure Protection,”
Edison Electric Institute, September 9, 2010.
50 See workpaper entitled “Putting SCADA Protection on the Radar,” by Marc Solomon, available at http://www.securityweek.com/putting-scada-protection-radar, May 17, 2012 (Last visited April 22, 2013).
48
Divisions, IT’s Power Systems Controls Division, Transmission & Distribution’s Grid Operations 1
Division, and Customer Service. An article from Security Week states: 2
Recent high profile compromises point to an urgent need to secure process 3
control networks. Stuxnet, a purpose–built worm for attacking industrial 4
control systems led the way in showing just what can be done by a 5
professional team. More recently, Duqu entered the threat landscape 6
enabling attackers to steal data from manufacturers of industrial control 7
systems and use that data to exploit entities using these systems…SCADA 8
networks are the most unprotected networks of all and now cyber-criminals 9
have them in their sights. If they get access, the consequences for many 10
organizations, their customers and perhaps the population at large, could be 11
extremely damaging.51 12
Additionally, in February 2013, an east coast utility suffered a denial of 13
service attack which affected the utility’s website, company email and automated phone system.52 14
To address these risks, the Cybersecurity Engineering group will deploy 15
(“out-post”) specialized teams to these high risk areas to conduct cyber-threat analysis, monitoring, and 16
mitigation of threats to SCE’s information/SCADA assets. Integrating Cybersecurity engineers closely 17
with their assigned business groups will allow the cyber specialists to build relationships and better 18
understand business issues and activities in order to understand potential threats in their particular 19
business environment. It will also allow them to provide immediate awareness and rapid response in the 20
event of cyber incidents. In addition, they will assist in conducting forensics and e-discovery services, 21
and provide expert advice to projects on security matters. 22
An effective Cybersecurity Program requires the balanced implementation 23
of security policies, standards, processes, and a comprehensive awareness program. The IT Risk 24
Management & Policies group within C&C develops policies and standards to ensure the confidentiality, 25
integrity and availability of SCE’s information assets. This group supports projects to implement the 26
cybersecurity requirements of applicable laws and regulations such as Sarbanes-Oxley (SOX), Health 27
Insurance Portability Accountability Act (HIPAA), and Payment Card Industry (PCI) Data Security 28
Standards. This group also provides governance to ensure compliance with SCE’s cybersecurity 29
51 Id.
52 See workpaper entitled “JEA victim of cyber attack,” available at http://www.news4jax.com/news/JEA-victim-of-cyber-attack/-/475880/18982700/-/o2d12t/-/index.html, February 19, 2013 (Last visited April 22, 2013).
49
standards and provides technical leadership to projects through a focus on security, availability and 1
reliability. 2
Informed employees are the first line of defense against the growing 3
cyber-attack vectors. As such, IT Risk Management & Policies group maintains a very comprehensive 4
role-based cybersecurity awareness and training program which is disseminated via instructor-led 5
sessions, web-based training, written and visual media, and informational brown bag sessions. In 6
addition, a robust cybersecurity portal is available to all SCE employees and contractors with 7
information on the latest cybersecurity threats and appropriate preventive measures. 8
Another group within C&C is Industry Engagement and Outreach, which 9
administers the program between SCE and Federal Agencies through a Cooperative Research and 10
Development Agreement (CRADA). This agreement allows SCE and the Department of Homeland 11
Security (DHS) to engage in data flow and analytical collaboration activities associated with 12
cybersecurity, including detection, prevention and mitigation. This agreement requires SCE to maintain 13
appropriate facility security capabilities and personnel eligible for the appropriate level of clearance. 14
The Industry Engagement and Outreach group also coordinates, monitors, and centrally tracks 15
involvement and happenings in various cyber-focused private and public partnerships for the purpose of 16
real-time information sharing, building trusted relationships, and sharing best practices.53 17
In addition to the collaboration between private/public partnerships, the 18
focus on cybersecurity for critical infrastructure is on the rise from the White House, Congress, state 19
governments, and regulatory bodies. In September 2012, Sen. Jay Rockefeller sent letters to the CEOs 20
of Fortune’s Top 500 companies, including SCE, asking them to outline the measures their companies 21
have taken to protect their computer systems from cyber-attack.54 In January 2013, Reps. Henry 22
Waxman and Edward Markey issued letters to various organizations within the electric industry 23
requesting information regarding each entity’s efforts to ensure its electric grid assets are protected from 24
53 Private and public entities include Department of Homeland Security (DHS), National Cybersecurity and
Communications Integration Center (NCCIC), NERC Electricity Sector/Information Sharing and Analysis Center (ES-ISAC), Utility Information Technology Benchmark (UNITE), Edison Electric Institute (EEI), Nuclear Energy Institute (NEI), Electric Power Research Institute (EPRI), Utilities Telecom Council (UTC) and many others.
54 See workpaper entitled “Rockefeller asks Fortune 500 CEOs to weigh in on cybersecurity debate,” by Jennifer Martinez, available at http://thehill.com/blogs/hillicon-valley/technology/250335-rockefeller-asks-ceos-of-500-top-us-companies-for-views-on-cybersecurity, September 19, 2012 (Last visited April 22, 2013).
50
a cyber or physical attack or geomagnetic storm.55 In February 2013, the President issued an Executive 1
Order to address three areas that are necessary to improve security for the nation’s Cyber Critical 2
Infrastructure: (1) information sharing; (2) a flexible risk-based framework of core practices based on 3
existing standards; and (3) privacy protections.56 4
C&C’s External Requirements and Analysis (ERA) group is responsible 5
for responding to these requests for information. This group also performs a Legislative and Regulatory 6
watch function by which they monitor and track congressional and legislative activities for emerging 7
legislation relating to cybersecurity, critical infrastructure protection (CIP) and data privacy at the 8
federal and state levels. The ERA group communicates changes and impacts due to these new requests, 9
regulations and laws to management and stakeholders. 10
ERA facilitates development and documentation of compliance program 11
processes and security controls within IT to support new and emerging legislation or regulations relating 12
to cybersecurity, data privacy, and critical infrastructure protection, and then ensures 13
regulatory/legislative requirements are built into projects during the planning and design phases. This 14
group also guides cybersecurity strategies and risk assessments to meet legislative/regulatory 15
requirements. ERA’s active monitoring of new and emerging regulations and legislation allows timely 16
adjustment and preparation of compliance-related business operations and processes which reduces 17
exposure to security and compliance risks. 18
(2) IT Compliance Function 19
C&C’s IT Compliance group oversees and manages regulatory 20
compliance activities across IT and develops programs to help ensure compliance with federal and state 21
legislative and regulatory mandates regarding cybersecurity. The IT Compliance group is comprised of 22
three teams: (1) NERC Compliance (2) Compliance Monitoring, and (3) Regulatory & Corporate 23
Compliance. 24
The NERC Compliance group facilitates audits conducted by the Western 25
Electricity Coordinating Council (WECC) to assess compliance with NERC reliability standards within 26
the IT operating unit. The NERC Compliance group also assesses regulatory notices and emerging 27
55 See workpaper entitled “Letter to SCE from Representatives Markey and Waxman,” January 17, 2013.
56 See workpaper entitled “Improving the Security of the Nation’s Critical Infrastructure,” by Michael Daniel, available at http://www.whitehouse.gov/blog/2013/02/13/improving-security-nation-s-critical-infrastructure?utm_source=related, February 13, 2013 (Last visited April 22, 2013).
51
standards for controls implications and impacts. In 2012 SCE completed the first NERC CIP regulatory 1
audit of the Energy Management System and related controls. The year-long effort required over 10,000 2
hours by IT to plan, prepare, and respond to the regulatory audit. A team of auditors from the WECC 3
reviewed existing controls, processes, and procedures, and assessed SCE’s compliance with the NERC 4
CIP regulations. 5
The Compliance Monitoring group performs reviews and assessments of 6
functional areas and controls for compliance to regulatory mandates, standards, and requirements and 7
reviews selected programs and projects for risks and regulatory compliance. 8
The Regulatory & Corporate Compliance group oversees regulatory 9
compliance activities across IT and SCE regulatory compliance teams. In addition, this group tracks and 10
reports the status of audit and vulnerability assessment observations across IT. This group also 11
coordinates internal and external audits for IT, tracks data requests, and facilitates remediation plans for 12
audit observations and vulnerability assessments. 13
SCE’s Cybersecurity Program is undergoing an unprecedented 14
transformation to address smart energy initiatives, the increasing convergence of consumer and 15
enterprise technologies, and the rise of a complex array of cyber threats. Examples of the complex 16
technical landscape include the erosion of the network perimeter through the mass adoption of remote 17
access and wireless technologies, and implementation of smart meters. 18
52
2. Analysis of Operations & Maintenance Expense by FERC Accounts 1
a) FERC Account 920/921 – C&C 2
Figure II-9 Summary of Operations –Cybersecurity & IT Compliance
Accounts 920/921 by Labor/Non-Labor/Other Recorded 2008-2012 / Forecast 2013-2015
(Constant 2012 $000)
(1) FERC Account 920/921 (C&C) 3
(a) Analysis of Recorded Costs 4
(i) Labor Expenses 5
From 2008 to 2009, C&C labor expenses decreased by 12 6
percent (or $0.627 million) due primarily to a reorganization C&C’s IT Compliance group that resulted 7
in a change in the group composition to fewer employees and more contingent workers. 8
From 2009 to 2010, C&C labor expenses increased 16 9
percent (or $0.712 million) due to increased support for NERC CIP and SOX audits, and an increase in 10
staff of 1 manager and 2 engineering staff for the Cybersecurity Program. The years 2011 and 2012 11
remained relatively flat. 12
(ii) Non-Labor Expenses 13
From 2008 to 2009, C&C non-labor expense increased 77 14
percent (or $1.8 million) due to the deployment and ongoing support of published NERC CIP Cyber 15
53
Security Standards, the continued strengthening of cybersecurity, internal controls and data protection 1
capabilities, adherence to regulatory requirements, and engineering and technology governance.57 2
From 2009 to 2010, C&C non-labor increased 14 percent 3
(or $0.605 million) due to increased consulting and contract labor for NERC CIP support, vulnerability 4
assessments, and cybersecurity strategy projects, as well as increased software licensing and 5
maintenance costs. 6
From 2010 to 2011, C&C non-labor decreased 46 percent 7
(or $2.2 million) due to the decrease of consulting and contract labor for NERC CIP support and 8
vulnerability assessments, decreases in contract labor support of expense projects, as well as transfers of 9
several contract resources out of C&C into the Enterprise Information Management & Architecture 10
group. 11
From 2011 to 2012, C&C non-labor decreased 52 percent 12
(or $1.3 million) due to reductions of contract labor, and reduced spend on NERC CIP support, 13
vulnerability assessments, security audits, staff training and participation in industry forums. 14
(b) Estimating Methodology And Test Year Forecast 15
The following trends and drivers will have a significant impact on 16
the future demands of the Cybersecurity program: 17
Advanced Persistent Threat 18
Social engineering targeting end-users 19
Mobile phone attacks 20
Insider threats 21
Identity theft 22
Increasingly sophisticated website attacks 23
Smart Grid expansion 24
Mobile and wireless enablement 25
Social media use 26
Cloud computing use 27
Compliance with evolving regulations 28
57 See Chapter II, Section D.1 of this testimony, describing the Cybersecurity Function, engineering and technology
governance ensures compliance with SCE’s cybersecurity standards.
54
Customer demands for privacy 1
Incremental expenses in both labor and non-labor for C&C are 2
warranted due to: 3
Ever-increasing cybersecurity threats faced by SCE 4
Increasing level of regulatory-compliance requirements 5
The growing need to strengthen internal controls to allow 6
collaboration with business partners and external entities 7
Higher than expected salaries and consultation fees in the 8
market for scarce resources in cybersecurity and SCADA 9
security fields 10
Increasing cybersecurity software acquisition and maintenance 11
costs in the market-place 12
Table II-9 Cybersecurity & Compliance
Comparison Table for FERC Account 920/921 Recorded / Adjusted 2012 to 2015
O&M Expenses
2012 Recorded/ Adjusted
2015 Test Year Variance Drivers
Labor $ 5,254 7,529$ 2,275$
Cyber Engineering workforce additions; Expansion of risk management programs; Administrative
support for CRADA; Communications and training for cyber related projects
Non-Labor $ 1,224 11,494$ 10,270$
Cyber Engineering workforce additions; Contracts for penetration testing and vulnerability
assessments;Contracts for tools for real time controls and monitoring; Increased cost of software
licensing and maintenanceTotal $ 6,478 19,023$ 12,545$
(i) Labor Expenses 13
For Test Year 2015, we estimate labor expenses of $7.529 14
million, a $2.275 million increase over 2012. Our forecast was developed using the 2012 amount as the 15
base with future year adjustments as defined below. Although historical recorded data indicates an 16
averaging method would be an acceptable basis for a forecast, we have chosen the last recorded year as 17
the base as we believe that it represents the most accurate basis from which to forecast 2015. To that 18
base, we have added incremental requirements as discussed below. Note that even using a five-year 19
average, the difference would not be substantial (approximately 5 percent). 20
55
Drivers for the forecast labor increases are additions to the 1
Cybersecurity Engineering workforce, resources for enterprise expansion of our risk management 2
program and updates to risk management policies, additional resources to perform communications and 3
training in support of cybersecurity projects, and administrative support for the Cooperative Research 4
and Development Agreement (CRADA) between SCE and DHS. These costs are necessitated by: 5
(1) increased sophistication and volume of external cyber threats, (2) the need to strengthen, modernize 6
and extend controls throughout the enterprise, (3) the need for unified monitoring capabilities, and 7
(4) creation of the partnership with DHS to improve detection, prevention and mitigation of cyber 8
threats.58 9
(ii) Non-Labor Expenses 10
For test year 2015, we estimate non-labor expenses of 11
$11.494 million, a $10.270 million increase over 2012. Our forecast was developed using the 2012 12
adjusted amount as the base with future year adjustments as defined below. Although historical 13
recorded data indicates an averaging method would be an acceptable basis for a forecast (and would 14
result in a substantially higher base year estimate than using the last year recorded), we have chosen the 15
last recorded year as the base as we believe that it represents the most accurate basis from which to 16
forecast 2015. To that base, we have added incremental requirements as discussed below. 17
Drivers for the forecast increases are the addition of 18
contract workers59 to the Cybersecurity Engineering workforce to allow deployment of resources to 19
high-risk areas; contracts with specialized vendors to perform penetration tests and vulnerability 20
assessments; contracts with cybersecurity tool vendors to introduce real-time controls and monitoring; 21
contractor support for the update of the risk management program; and increased costs of software 22
licensing and maintenance. These costs are necessitated by the increased sophistication and volume of 23
external cyber threats; the need to strengthen, modernize and extend controls throughout the enterprise; 24
and the requirement for unified monitoring capabilities.60 25
58 See workpaper entitled “C&C O&M Labor and Non-Labor Additions.”
59 The costs for contract labor are accounted for as a non-labor expense.
60 See workpaper entitled “C&C O&M Labor and Non-Labor Additions.”
56
E. Enterprise Information Management & Architecture 1
1. Enterprise Information Management & Architecture Division (EIM&A) 2
a) Description of Activities 3
Enterprise Information Management & Architecture (EIM&A) is a group within 4
SCE’s IT Operating Unit responsible for maximizing the value of technology investments through the 5
development and utilization of information and data management services, strategic architectures, and 6
application and technology roadmaps. EIM&A’s major responsibilities include: 7
Developing, maintaining, and governing SCE’s Enterprise Architecture, 8
which is used as the blueprint for aligning our short and long term technology 9
investments to the needs of the business; 10
Managing SCE’s data assets to provide accurate and reliable information, 11
enabling informed and timely business decisions; and 12
Providing enterprise technology services that support the delivery of cost-13
effective IT solutions through well-defined and properly governed technology 14
standards. 15
EIM&A’s major functions are: 16
Enterprise Architecture: Designing, implementing, and optimizing actionable 17
architectures and enterprise technology services; 18
Enterprise Information Management: Managing the enterprise’s data assets to 19
provide accurate and reliable information, enabling informed and timely 20
business decisions; 21
Technology Innovation: Assessing and introducing emerging and new-to-22
organization technologies; and 23
Technology Standards Management: Improving technology utilization 24
through well-defined and properly governed technology standards. 25
(1) Enterprise Architecture 26
The Enterprise Architecture (EA) function is responsible for the planning 27
for IT investments across the enterprise based on strategic business priorities and critical business 28
capabilities. This function works with the Operating Units in planning a multi-year roadmap of 29
technology investments with a targeted enterprise architecture that delivers on strategic business 30
objectives, reduces future technology investments by reusing common solutions, increases the speed of 31
57
enabling business capabilities, and lowers ongoing costs by simplifying the complexity of the portfolio 1
by decommissioning redundant solutions. 2
Various inputs are needed for these planning functions, which include 3
business drivers and capabilities identified by Operating Units, technology refresh requirements, risk 4
and compliance requirements, legal requirements, and regulatory mandates. EA will align proposed 5
initiatives, applications, and technologies to these business drivers and capabilities allowing for 6
identification of redundant solutions and potential cost reductions. In addition, by increasing visibility 7
to planned investments across the enterprise, IT will enhance its accuracy of forecast spend. These 8
planning efforts greatly benefit groups engaged in key investment governance processes such as the 9
Capital Prioritization and Portfolio Management Teams, and other enterprise technology services. With 10
proper planning of the IT pipeline of investments, focus can be given to reducing IT capital spend levels 11
and ensuring allocation of IT capital across the enterprise based on strategic priorities. 12
The benefits associated with Enterprise Architecture include: 13
Improving demand management by eliminating requests that are not 14
aligned to strategic objectives and priorities and concentrating on high 15
value projects; 16
Optimizing application and technology portfolios by identifying assets 17
to decommission over time; 18
Reducing development costs and lowering application operating costs 19
by leveraging existing solutions that can be used across Operating 20
Units with common business capabilities, and by utilizing reference 21
architectures to avoid creation of redundant solutions that provide 22
similar functionality; 23
Identifying and implementing Commercial Off The Shelf (COTS) 24
solutions rather than costlier custom development; 25
Increasing the speed of delivery of business solutions by increasing 26
alignment between IT and other SCE Operating Units, and 27
standardizing IT environments and tools; and 28
Enhancing cost forecasting of the IT pipeline of investments. 29
58
(2) Enterprise Information Management 1
The Enterprise Information Management (EIM) function is responsible for 2
designing, implementing, and maintaining data services to ensure SCE customers and employees can get 3
the information they need in a timely and cost-effective manner. EIM services help to ensure data 4
quality and integrity, appropriate accessibility, and compliance with regulatory and legislative 5
requirements. EIM develops and supports the systems and tools for: 6
a) Utilizing information, such as business intelligence (includes analytics 7
and reporting), content management (includes internal and external portal/web capabilities), and 8
enterprise mobility (includes tablets and smart phones); and 9
b) Managing enterprise data, such as business application database 10
administration (transactional and analytic), development of data and information architectures, 11
application & process integration, and data movement. 12
The benefits associated with Enterprise Information Management services 13
include: 14
Simplifying processes by eliminating redundancy, delivering 15
standardization, promoting reusability, resolving semantic issues, and 16
providing accurate information that enables performance 17
improvement; 18
Reducing development and maintenance cost by developing and 19
implementing common enterprise information services rather than 20
redundant application specific interfaces; 21
Extending the life and usability of legacy applications by utilizing 22
them as a source for information services; 23
Minimizing infoglut by organizing unstructured contents (such as e-24
mail systems, document management applications, records 25
management system, etc.); 26
Managing governance, risk and compliance by providing transparency 27
to key information that meets compliance requirements; 28
Improving workforce effectiveness by providing information to 29
manage and optimize sourcing strategy; 30
59
Increasing enterprise agility, by providing consistent data structures, 1
definitions, and standards; 2
Optimizing revenue, by providing timely, accurate, and consistent 3
information to support procurement processes; and 4
Improving customer satisfaction and employee decision making 5
process based on improvements in information quality (e.g. outage 6
status information) and provision of real time information and single, 7
consistent views of information across all points of interaction. 8
(3) Technology Innovation 9
The Technology Innovation function is responsible for the assessment and 10
introduction of emerging and new-to-organization technologies. Technology continues to evolve at a 11
fast pace, and this function evaluates how the latest products can improve business operations and 12
provide value to SCE. 13
An example of technology innovation is the Smart Grid System 14
Engineering (SGSE) initiative, which is responsible for research, development, and demonstration of 15
advanced technologies necessary to integrate new energy, communications, security, and automated 16
technologies required to meet state and federal sustainable energy policy objectives such as renewable 17
generation, zero net energy homes, distributed energy resource, and plug-in electric vehicle goals. The 18
SGSE group is primarily focused on engineering solutions using a combination of information 19
technologies and operational technologies to enable new capabilities and control schemes that improve 20
grid reliability and integrate variable renewable resources and new energy technologies into the power 21
system. Shifting today’s electric grid to a smarter electric grid – one that increasingly relies on 22
technology to maintain stability and achieve a higher level of resilience – requires a deep understanding 23
of systems and control theory, computer science, power systems, and utility operations. SGSE applies 24
these diverse and specialized disciplines in a coordinated approach that yields cost efficient, 25
manageable, and reliable solutions through the development of clear Smart Grid strategies and 26
architecture approaches. The goal of the SGSE group is to ensure that the introduction of automation, 27
connectivity, and advanced control systems creates a system that is manageable, secure, affordable, and 28
resilient. 29
SGSE supports the Advanced Technologies team in the Transmission and 30
Distribution Operating Unit (T&D) by providing Smart Grid Systems Engineering services in the form 31
60
of architecture development, network-centric and “system of systems” designs, Smart Grid cyber-1
security engineering, general and embedded systems design in the bulk transmission system, substation, 2
distribution network and beyond the meter applications, and standards development. The SGSE group 3
supports EIM&A’s mission by assembling cross-disciplinary teams from divisions across IT to research, 4
develop, and implement Smart Grid projects that introduce new technologies into SCE’s grid operations 5
environments. The SGSE group, in conjunction with Advanced Technologies, operates a Smart Grid 6
Systems Lab to test and assess the maturity and readiness for deployment of technologies in SCE’s grid 7
modernization efforts. 8
(4) Technology Standards Management 9
The Technology Standards Management function is responsible for the 10
establishment, enforcement, and communication of IT technology standards. The purpose of IT 11
technology standards is to support the EIM and EA functions by improving the integration needs across 12
the enterprise, reducing system and technology redundancies, increasing the speed of delivery of 13
business solutions, and optimizing IT support costs. 14
The benefits associated with Technology Standards Management include: 15
Improving the integration needs across the enterprise; 16
Reducing system and technology redundancies, which in turn reduces 17
total cost of ownership; 18
Increasing the speed of delivery of business solutions by promoting 19
consistent use of standard tools; 20
Minimizing business risks of nonstandard solutions, which in turn 21
minimize licensing and support costs; and 22
Providing a framework for multiyear technology investment decisions. 23
b) Optimization of Experience 24
EIM&A’s team of experienced architects is supporting SCE to effectively reduce 25
costs of software development, implementation and maintenance by: 26
Developing and implementing enterprise-wide data services rather than 27
redundant application specific interfaces. Once developed, data services are 28
reused by new applications rather than SCE having to develop additional 29
interfaces for those applications. The use of enterprise-wide data services also 30
61
reduces maintenance costs as any changes in data only need to be made in one 1
place rather than in a multitude of interfaces. 2
Extending the life and usability of legacy applications by utilizing them as a 3
source for data services. The data service would use the logic or business 4
rules (e.g. bill calculation) embedded in the legacy application or retrieve 5
information from the legacy application database. This can forestall the 6
replacement of the legacy application while ensuring a consistent application 7
of the functionality (e.g. billing) provided by the data service. New 8
applications that utilize the data service would not directly interact or interface 9
with the legacy application. When the legacy application is eventually 10
replaced, the applications that utilize the data service are not affected and do 11
not require changes. The source for the data service has changed, but the 12
interface to it that is used by applications remains the same. 13
Identifying and implementing Commercial Off The Shelf (COTS) products 14
where appropriate, rather than other costlier custom development activities to 15
meet growing demand for technology solutions. A COTS implementation that 16
meets the required business capabilities will typically cost less than a custom 17
development. Maintenance costs are also reduced as the maintenance is 18
provided by the COTS vendor, which is usually less costly than if SCE 19
attempts to support COTS internally. 20
Leveraging existing solutions that can be used across Operating Units with 21
common business capabilities. 22
Utilizing reference architectures to speed delivery time of new applications 23
and reduce development costs. Reference architectures are documented best 24
practices for technology solutions. They reduce the time for application 25
design and ensure the use of appropriate underlying technologies as specified 26
by the Technology Standards Management function. 27
62
2. Analysis of O&M Expense for Enterprise Information Management and 1
Architecture: 2
a) FERC Account 920/921 – EIM&A 3
Figure II-10 Summary of Operations –Enterprise Information
Management & Architecture Accounts 920/921 by Labor/Non-Labor/Other
Recorded 2008-2012 / Forecast 2013-2015 (Constant 2012 $000)
(1) Analysis of Recorded Costs 4
(a) Labor Expenses 5
From 2008 to 2009, labor expenses increased by $2.5 million (or 6
27 percent), primarily due to the transition of SCE employees from the ERP development project to the 7
EIM&A organization after the implementation of Releases 1 and 2. These employees provided on-8
going support for the increase in demand for Business Intelligence work, which included Analytics and 9
Reporting, and Business Objects61 services and support. 10
From 2009 to 2010, labor expenses increased by $1.5 million (or 11
13 percent), due to: (a) the transition of SCE employees from the ERP development project to the 12
EIM&A organization after the implementation of Release 3 to support the additional demand for 13
61 Business Objects is the SAP business intelligence tool.
63
Business Intelligence services; and (b) the consolidation of IT employees performing integration 1
services and support. 2
From 2010 to 2012, labor expenses remained relatively flat. 3
(b) Non-Labor Expenses 4
From 2008 to 2010, non-labor expenses remained relatively flat. 5
From 2010 to 2011, non-labor expenses increased by $1.7 million 6
(or 24 percent). The primary driver of this increase was the addition of supplemental employees needed 7
to support the stabilization of ERP Releases 3 and 4 in the Analytics and Reporting and Enterprise Data 8
Management areas. 9
From 2011 to 2012, non-labor expenses decreased by $2.5 million 10
(or a reduction of 29 percent). The primary driver of this decrease was the release of the supplemental 11
employees needed for stabilization activities for the implementation of ERP. 12
3. Estimating Methodology and Test Year Forecast 13
Table II-10 Enterprise Information Management and Architecture
Comparison Table for FERC Account 920/921 Recorded/Adjusted 2012 to Test Year 2015
(Constant 2012 $000)
O&M Expenses
2012 Recorded/ Adjusted
2015 Test Year Variance Drivers
Labor $ 13,517 11,060$ (2,457)$ OpX SavingsNon-Labor $ 6,209 5,886$ (323)$ OpX Savings
Total $ 19,726 16,946$ (2,780)$
(a) Labor Expenses 14
For Test Year 2015, we estimate labor expenses of $11.060 15
million, a reduction of $2.457 million from 2012. Even though historical recorded data indicates the 16
averaging methodology would be an acceptable basis for a forecast of labor expenses, we have chosen 17
the last recorded year as it best represents the most accurate basis for our 2015 request. Using a four-18
year average instead of the last year recorded would yield less than a 4 percent difference. To that base, 19
an additional request of $0.18 million is added to reflect a company-wide adjustment for severance pay 20
for those affected as explained in Chapter 1, section B of this testimony. This request is partially offset 21
by the reduction in our labor expenses in support of SCE’s OpX efforts. 22
64
(b) Non-Labor Expenses 1
For Test Year 2015, we estimate non-labor expenses of $5.886 2
million, a reduction of $0.323 million from 2012. Even though historical recorded data indicates an 3
averaging methodology would an acceptable basis for a forecast of non-labor expenses, we have chosen 4
the last recorded year as it best represents the most accurate basis for our 2015 request. A five-year 5
average would yield a substantially higher base year. To that base, the reduction in our non-labor cost is 6
in support of SCE’s OpX efforts. 7
F. Client Services & Planning 8
1. Client Services & Planning Division (CS&P) 9
a) Description of Activities 10
The Client Services and Planning Division (CS&P) is an IT division that provides 11
support for planning and delivery services to SCE’s Operating Unit clients. CS&P’s functions include 12
continuous improvement of business process work, and providing controls and business support 13
functions which have impact across IT. CS&P is comprised of Client Portfolio Management Solutions, 14
IT Strategy and General Rate Case (GRC), Delivery Management Organization, Client Engagement and 15
Planning, and Business Support Services. 16
The Client Portfolio Management (CPM) Solutions group (formerly Business 17
Relations division) supports the strategic and tactical alignment of IT with the SCE internal client 18
Operating Units. Portfolio managers work closely with the leaders from the OUs to understand their 19
business drivers and support the multi-year planning of technology projects, products and services. 20
CPM activities are an important component of validating that the right complement of projects are being 21
pursued, that they are implemented in the right order of priority, and IT capability and technology plans 22
stay in alignment with other SCE Operating Units’ business needs. As a result, the CPM team is 23
responsible for the overall demand and capacity management of all work requested of IT. CPM 24
managers serve as the single gateway to all work coming into IT, giving IT and its business clients a 25
better mechanism to coordinate work, minimize duplication, and allocate scarce resources. 26
CS&P’s IT Strategy and General Rate Case (GRC) planning and facilitation 27
group handles all of IT’s GRC filing. The GRC group coordinates with SCE’s Regulatory Operations 28
and Corporate Finance Operating Units and is held accountable for the final deliverable. While the 29
GRC may not be considered an annual activity, the GRC team works closely with CPM in 30
65
understanding SCE’s Operating Units’ business drivers and multi-year planning of technology projects 1
in preparation for the next GRC cycle. 2
In support of IT’s service-oriented operating model, the Delivery Management 3
Organization (DMO) consists of five groups with the following functions: 4
1. The Project Management Office/Business Process Management (PMOBPM) 5
is a group that provides two functions: the PMO area provides IT project and 6
portfolio management governance and standardized project management 7
approach, while the BPM area provides documented and continuous business 8
process improvements; 9
2. The Capacity Delivery Management group manages project resources. This 10
includes the analysis of current and future demand for project staff and 11
actively adjusting schedules and loads as conditions change. They also assist 12
in the performance assessment of our project related vendor staff and in the 13
relationships with those companies; 14
3. The Quality Assurance (QA) and Testing groups provide quality assurance 15
and testing services to assure quality of IT products and services; 16
4. The Business Controls group manages business controls for delivery of IT 17
products and services to ensure compliance with all relevant company and 18
regulatory requirements as well as our own internal controls that ensure 19
quality, efficiency and timeliness in delivery; and 20
5. The Delivery Analytics group provides IT performance reporting to many of 21
the IT divisions that rely upon this information to analyze effectiveness of our 22
delivery of products and services. They also make recommendations for 23
improvements in both the data in these reports as well as the most effective 24
means of collection and delivery. 25
In addition, other DMO functions include: 26
Providing governance by establishing policies, processes, procedures and 27
templates for delivery of high quality products and services to IT’s clients – 28
SCE’s Operating Units. 29
66
Supporting cost reduction by reducing cycle time and/or improving quality of 1
IT business processes through integration of processes, reduction of 2
redundancies, and identifying efficiencies. 3
Providing project management support services and ensuring IT’s projects are 4
meeting delivery objectives, on or ahead of schedule, and at budget through 5
visibility and tracking of project performance. 6
Forecasting capacity and capability needs for projects to optimize resources – 7
both internal resources and resources provided by vendor partners. 8
Providing timely actual information through dashboards, reports and metrics 9
on IT work for IT senior management strategic decision making, to optimize 10
performance and contain costs. 11
Providing oversight and management of the vendors and their performance by 12
performing quality assurance services such as testing strategies to reduce 13
defects, requirements reconciliation, and consistent testing standards across 14
the IT portfolios. 15
Ensuring the company complies with business controls needed for regulatory 16
requirements such as Sarbanes Oxley (SOX), segregation of duties (SOD) and 17
others by engaging in projects from the project/product development phase 18
through testing and implementation. 19
The Client Engagement and Planning (CEP) group in IT is responsible for 20
providing a variety of services that help employees across SCE use and optimize the company’s 21
technology investments. Services provided include solution adoption, technical communication, client 22
surveys, IT benchmarking efforts, management of external research vendor relationships, and 23
management of industry practices and new technology areas to influence IT strategies in support of 24
corporate goals. 25
Finally, the Business Support Services (BSS) group provides critical back-office, 26
planning, resource, and informal business support services that enable IT managers, employees, and 27
supplemental workers to provide information technology products and services to SCE. BSS helps IT 28
achieve its goal to identify, deliver, and maintain cost effective, secure, and compliant technology 29
required to provide safe, reliable, and affordable electricity. BSS efficiently provides timely, accurate, 30
and consistent onboarding and offboarding of personnel, human capital management (HCM), and 31
67
business support services in a standardized manner across IT. These services include workforce 1
planning and administration, resource management services, and IT business support. 2
All CS&P support functions contribute to the effective operation of the IT 3
organization as a whole, which enables effective and efficient technology solutions throughout SCE, and 4
supports the delivery of electricity to our ratepayers. These efforts are progressively helping to reduce 5
the demand for new IT solutions by leveraging existing solutions throughout the enterprise. 6
b) Metrics Measuring Productivity Results from Information Technology 7
Solutions 8
Projects for information technology solutions have many different justifications. 9
Some of these include: 10
Regulatory mandates 11
Technology obsolescence 12
Cyber security enhancements 13
Grid reliability 14
Safety 15
Customer satisfaction. 16
Analysis of the proposed projects from SCE’s 2015 GRC would show that most 17
of the requested IT projects fall into one or more of the above categories. A few of the proposed 18
projects have productivity components (e.g. mobility enhancements for field workers) but also have 19
other drivers, including safety. Measuring the productivity components separately from other drivers is 20
very difficult. 21
True productivity projects (i.e., replacing a manual system with an automated 22
one) are very rare as most of these have been undertaken in the past. There are available metrics that 23
measure those projects that indicate success in preventing productivity loses, but these metrics do not 24
measure productivity gains. 25
In the case where one of the project’s business drivers is productivity gains and a 26
reduction in workforce is expected as a result, SCE’s standard business practice is to reduce the 27
Operating Unit’s budget for those savings following the final installation of the project. This would 28
ultimately lead to a lower recorded spend (the savings on salaries or contingent worker costs), which 29
would benefit the ratepayer in all subsequent GRC cycles. 30
68
The answer as to whether “reasonable metrics” actually exist to measure 1
productivity results from IT solutions is difficult to answer. Accurate, project-by-project measurement 2
would be difficult and costly. Therefore, we do not, as a common business practice, go back to re-3
measure worker productivity after a project has gone live to see if we received the benefits we expected. 4
However, by following the practice of reducing workforce previously mentioned, we attain the same 5
end. If we overestimated the benefits of the IT solution, the organizational unit will not be able to do its 6
work with the available reduced resources. If the solution provided greater benefit than we thought then 7
they would have excess capacity or would be able to absorb more work without adding staff. This 8
process occurs as a normal course of business and helps us to self-correct our productivity estimates for 9
future projects. 10
SCE has provided productivity estimates for all projects where they exist. These 11
can be found in each of the individual project write-ups in SCE-05, Volume 2. 12
69
2. Analysis of O&M Expenses by FERC Accounts 1
a) FERC Account 920/921 – CS&P Client Services and Planning 2
Figure II-11 Summary of Operations – Client Services & Planning
Accounts 920/921 by Labor/Non-Labor/Other Recorded 2008-2012 / Forecast 2013-2015
(Constant 2012 $000)
The recorded expenses for Client Services and Planning (CS&P) group consists of 3
all current groups described above as well as the former IT Finance and Human Resources personnel 4
that were consolidated into their corporate functional groups in 2012. For the purposes of the GRC and 5
to simplify the accounting of historical costs, these sub-groups were included in CS&P’s historical costs 6
as well as our 2015 request. 7
(1) Analysis of Recorded Cost 8
(a) Labor Expenses 9
Labor cost from 2009 to 2010 increased 16 percent (or $3.3 10
million) due primarily to the formation of several groups in CS&P. In 2009, Business Support Services 11
group expenses increased by $1.2 million over 2008 base. The increase can be primarily attributed to 12
the formation of a dedicated Division Support group for the Center for Continuous Improvement (CCI). 13
In addition, the Division Support group for non CCI work further increased due primarily to the increase 14
in project demands in IT’s TDM division. The Delivery Management Organization (DMO) experienced 15
70
growth of over $1.1 million from 2009-2010 due the addition of resources in CS&P’s DMO group in 1
areas of Program Management Office, delivery testing and business delivery. These additional 2
resources were necessitated by the growing demand in the Operating Units as projects were being 3
approved and additional project support was required. Enterprise Portfolio Management group 4
experienced a growth of approximately $0.700 million as a result of ERP Phase 3 going live which 5
necessitated additional end user and process support. 6
Client Portfolio Management experienced a growth of 7
$0.43million driven by the addition of dedicated Business Unit Executive support for the Customer 8
Service, Transmission and Distribution and SONGS technology portfolio. This provided the operating 9
units with dedicated and focused leadership, strategic and tactical accountability, and in-depth, portfolio 10
management which further leveraged the skills, expertise, and knowledge of IT in delivering effective 11
and efficient technology solutions. In addition, the growth of $0.575 million in Enterprise Integration 12
was driven by the formation of new functional groups, Process Management and Project Governance, to 13
further provide in-depth portfolio management support. 14
From 2011 to 2012, labor expenses decreased by 11 percent (or a 15
reduction of $2.5 million) due primarily to the company-wide support of the operational excellence 16
(OpX) effort. To support OpX, the Client Portfolio Management group (CPM reduced resources by 17
attrition, and consolidated responsibilities to avoid interruptions in CPM support to SCE’s Operating 18
Units. 19
(b) Non-Labor Expenses 20
Non-Labor expenses remained relatively flat from 2008 to 2011. 21
From 2011 to 2012, expenses decreased 56 percent (or $4.5 22
million) due primarily to the company-wide support of the OpX effort by conservatively reducing non-23
labor expenses in all areas of CS&P. Overall reductions in IT included reductions in employee 24
recognition such as bonuses and awards, year-end events, training, and office supplies. 25
71
(2) Estimating Methodology and Forecast 1
Table II-11 Client Services & Planning
Comparison Table for FERC Account 920/921 Recorded/Adjusted 2012 to Test Year 2015
(Constant 2012 $000)
O&M Expenses
2012 Recorded/ Adjusted
2015 Test Year Variance Drivers
Labor $ 19,267 15,440$ (3,827)$ OpX SavingsNon-Labor $ 3,514 2,376$ (1,138)$ OpX Savings
Total $ 22,781 17,816$ (4,965)$
For Test Year 2015, we estimate labor expenses of $15.440 2
million, a reduction of $3.827 million below 2012. Labor expenses have fluctuated from year to year; 3
the averaging methodology would have been an appropriate methodology for forecasting this area. 4
However, we have selected last year recorded as it represents the most accurate base year for our 2015 5
forecast as well as being a lower base than an averaging methodology would have yielded. In 2015, 6
labor expenses decreased in support of the OpX initiative referenced in this testimony. Our forecast also 7
includes $0.18 million for severance pay for those affected as explained in the overview section of this 8
testimony. 9
(a) Non-Labor Expenses 10
For Test Year 2015, we estimate non-labor expenses of $2.376 11
million, a $1.138 million reduction below 2012. Non-Labor expenses have fluctuated from year to year; 12
the averaging methodology would have been an appropriate methodology for forecasting this area. 13
However, we have selected last recorded year as it represents the most accurate base for our 2015 14
Forecast as well as being a lower base than an averaging methodology would have yielded. The 15
decrease in 2015 non-labor expenses can be attributed to savings from OpX initiative, referenced in this 16
testimony. We forecast spending to continue at that lower level. 17
G. Incremental O&M for New Software 18
a) Description of Activities 19
Each year, the applications supported by IT change as some systems are 20
decommissioned and others are added. When large application projects that exceed $5 million in capital 21
spend are implemented, the O&M recurring support costs are too significant to be simply included as 22
part of the application portfolio. These post-implementation support costs begin in the year following 23
72
the implementation of the project. This activity aims to identify the O&M costs related to these large 1
projects and account for them appropriately. 2
b) Analysis of O&M Expenses for New Software Application by FERC Account 3
(1) FERC Accounts 920/921 – O&M for New Software Applications 4
Figure II-12 Summary of O&M for New Software Applications
Accounts 920/921 by Labor/Non-Labor/Other Recorded 2008-2012 / Forecast 2013-2015
(Constant 2012 $000)
(a) Analysis of Recorded Costs 5
The O&M forecast is comprised of costs for the ongoing operation 6
and maintenance of new software applications. Since these costs are to support assets which did not 7
exist in the recorded period, there is no recorded history for these costs. 8
73
(b) Estimating Methodology and Test Year Forecast 1
Table II-12 Incremental O&M for New Software
Comparison Table for FERC Account 920/921 Recorded/Adjusted 2012 to Test Year 2015
(Constant 2012 $000)
O&M Expenses2012 Recorded/
Adjusted2015 Test
Year Variance DriversLabor $ - 5,222$ 5,222$ Various projects >$5 million
Non-Labor $ - 3,682$ 3,682$ Various projects >$5 millionTotal $ - 8,904$ 8,904$
The 2015 forecast of $8.904 million is an average of forecast years 2
2015-2017 that have been normalized for ratemaking purposes. Current estimates have been allocated 3
59 percent to labor and 41 percent to non-labor using 2012 actual / recorded costs breakdown. These are 4
new costs to support assets in our forecast, therefore, there is no recorded history for these costs. 5
The Table II-13 below lists the projects in this forecast along with 6
the corresponding references to the IT Capital testimony where the analysis and calculation of the costs 7
for the ongoing operations and maintenance can be found. Further detail of the project yearly cost 8
breakdown can be found in the accompanying workpapers.62 9
62 See workpaper entitled “2015 GRC SCE-05 Vol. 1 -- Capital Projects Used for O&M Analysis.”
74
Table II-13 Capital Projects Used for O&M Analysis
For Test Year Forecast O&M
Description CITCapital Forecast
2013 - 2017
Recurring O&MTest-YearForecast
Capital Project Testimony Reference
1 SCE.com/CRM Integration CIT-00-DM-DM-000032 38,700.0$ 259.8$ SCE-05, Vol. 2, Ch. 6
2 Interior Defense CIT-00-TR-RM-000004 34,760.5$ 506.7$ SCE-05, Vol. 2, Ch. 2
3 eDMRM (Enterprise Document Management/Records Management) CIT-00-SD-PM-000144 32,604.0$ 130.0$ SCE-05, Vol. 2, Ch. 6
4 NERC CIP CIT-00-TR-RM-000001 28,225.8$ 475.0$ SCE-05, Vol. 2, Ch. 3
5 Geographic Information System (GIS) CIT-00-SD-PM-000009 27,595.1$ 1,320.0$ SCE-05, Vol. 2, Ch. 6
6 Common Cyber Security Services (2015 - 2017) CIT-00-SD-PM-000175 25,371.0$ 1,120.0$ SCE-05, Vol. 2, Ch. 2
7 Perimeter Defense CIT-00-TR-RM-000002 25,328.8$ 230.5$ SCE-05, Vol. 2, Ch. 2
8 Data Protection CIT-00-TR-RM-000003 23,061.5$ 436.8$ SCE-05, Vol. 2, Ch. 2
9 MSO Integrated Work Management CIT-00-DM-DM-000025 21,666.3$ 367.2$ SCE-05, Vol. 2, Ch. 6
10 Renewable Contract Management System CIT-00-SD-PM-000112 20,520.0$ 530.0$ SCE-05, Vol. 2, Ch. 6
11 CRAS Application CIT-00-SD-PM-000102 18,872.0$ 125.8$ SCE-05, Vol. 2, Ch. 6
12 Cell Relays CIT-00-OP-NS-000383 17,300.0$ 26.3$ SCE-05, Vol. 2, Ch. 6
13 Enhanced Meter and Usage Capability CIT-00-SD-PM-000105 16,600.0$ 70.0$ SCE-05, Vol. 2, Ch. 6
14 Consolidated Mobile Solution (CMS) CIT-00-SD-PM-000041 16,032.0$ 220.0$ SCE-05, Vol. 2, Ch. 6
15 Common Cyber Security Services (2013 - 2014) CIT-00-SD-PM-000103 15,239.3$ 1,104.0$ SCE-05, Vol. 2, Ch. 2
16 Distribution Management System (DMS) CIT-00-SD-PM-000140 13,144.0$ 175.0$ SCE-05, Vol. 2, Ch. 6
17 Phasor Advanced Analytics CIT-00-SD-PM-000202 13,100.0$ 131.7$ SCE-05, Vol. 2, Ch. 6
18 Master Access Project Umbrella CIT-00-SD-PM-000136 12,356.0$ 210.0$ SCE-05, Vol. 2, Ch. 6
19 Customer Service System Enhancements CIT-00-DM-DM-000017 12,000.0$ 136.5$ SCE-05, Vol. 2, Ch. 6
20 Vegetation Management CIT-00-SD-PM-000154 10,500.0$ 105.0$ SCE-05, Vol. 2, Ch. 6
21 Electronic Work Order Package CIT-00-SD-PM-000189 10,000.0$ 166.7$ SCE-05, Vol. 2, Ch. 6
22 Grid Control Center Cyber Security CIT-00-CC-CC-000027 9,000.0$ 300.0$ SCE-05, Vol. 2, Ch. 6
23 Security Operation Center (SOC) CIT-00-SD-PM-000138 7,688.7$ 128.2$ SCE-05, Vol. 2, Ch. 6
24 SONGS Cybersecurity CIT-00-CC-CC-000028 7,500.0$ 83.3$ SCE-05, Vol. 2, Ch. 2
25 Pole-Loading Application Replacement (PoLAR) CIT-00-SD-PM-000137 7,067.8$ 118.0$ SCE-05, Vol. 2, Ch. 6
26 Enterprise Compliance Management System CIT-00-SD-PM-000064 7,000.0$ 87.5$ SCE-05, Vol. 2, Ch. 6
27 GRC Phase II Non-Dynamic Pricing Rates CIT-00-SD-PM-000170 6,500.0$ 49.0$ SCE-05, Vol. 2, Ch. 6
28 Protection System Maintenance Program (PSMP) CIT-00-SD-PM-000153 6,200.0$ 85.0$ SCE-05, Vol. 2, Ch. 6
29 Storm Analytics CIT-00-SD-PM-000195 5,900.0$ 78.7$ SCE-05, Vol. 2, Ch. 6
30 Grid Visualization - Building the GCC Digital Wall CIT-00-SD-PM-000203 5,900.0$ 20.0$ SCE-05, Vol. 2, Ch. 6
31 SmartConnect Monitor&Analysis (SCMAS) CIT-00-SD-PM-000172 5,100.0$ 39.7$ SCE-05, Vol. 2, Ch. 6
32 FASB Projects (Multiple) CIT-00-SD-PM-000141 5,040.0$ 67.4$ SCE-05, Vol. 2, Ch. 6
505,872.6$ 8,903.6$
1
75
III. 1
CAPITAL EXPENDITURES 2
A. Hardware Replacement 3
1. Overview 4
SCE’s IT Operating Unit (IT) oversees a wide array of information technology hardware. 5
Computing assets are comprised of the computing hardware used by the SCE workforce and SCE 6
customers. Communication assets include the Voice Over Internet Protocol (VOIP) phone solutions 7
used in SCE facilities and radios used in the field. Networking assets including fiber optic cable, 8
satellites, microwave towers, and routers, which allow for the transportation of customer and internal 9
SCE data traffic. Mailing Operations assets are the high volume printers and bill inserters used to print, 10
insert, and mail customer bills, letters, and checks. 11
Following industry best practices, we manage these assets by ensuring they are put into 12
service and remain functionally capable over the assets’ useful life. Over the past several years, four 13
factors required us to optimize how we manage our portfolio of hardware assets. 14
First, the increasing use of technology, information, and data throughout our business 15
requires our portfolio of hardware assets that support ongoing utility business operations to grow in size 16
and complexity. This is growth in both in terms of the number of devices and hardware systems 17
supported, as well as the volume of business transactions supported. For example, developments in 18
hardware capability, such as virtualization and the convergence of data, voice, and video in the 19
communications arena, has significantly impacted how related hardware is managed. Additionally, 20
enterprise Information Technology initiatives such as Edison SmartConnect® and Enterprise Resource 21
Planning (ERP) have added significant hardware components to our portfolio. 22
Second, growing business needs and rapid developments in information technology are 23
impacting our hardware requirements. Our hardware asset portfolio includes 23,500 personal 24
computers, 4,800 mobile radios, over 3,900 miles of fiber optic communications cable, over 1,100 25
midrange servers, three mainframe servers, and over 16.4 petabytes of storage. These assets support 26
printing 179 million pages of documents per year, responding to over 14.5 million customer calls to our 27
call centers, voice and data communications required by field operations employees and providing 28
energy to our 4.9 million customers. The vast majority of our hardware portfolio is required to be 29
operational 24 hours a day, seven days a week, 365 days a year. 30
76
Third, the way our customers and business partners are interacting with us continue to 1
change. The internet and wireless communication capabilities continue to become increasingly 2
important. These changes drive growth in capacity and security for our hardware infrastructure. Some 3
examples include our continuing effort to upgrade the capacity of our communications network, and our 4
hardware-related investments required to ensure information and data security. 5
Fourth, although regulatory requirements and mandates have always been a significant 6
factor influencing our actions, recent mandates that reflect governmental agencies’ concerns over 7
emerging market and industry developments require major new information technology investments 8
with enterprise-wide impacts. The Market Restructuring and Technology Update requirements, the 9
North American Electric Reliability Corporation’s Critical Infrastructure Protection (NERC CIP) 10
mandates related to cyber security, and the continuing impacts of the Sarbanes-Oxley legislation are just 11
a few of these regulatory mandates. These mandates affect decisions regarding SCE’s Information 12
Technology infrastructure capacity and capability along with computing, communications, network and 13
mail operations areas. Their requirements drive actions relevant to application and data segregation, 14
securing of server services and information life cycle management. 15
Due to these changing needs and developments, the hardware asset portfolio will become 16
obsolete if not actively managed and refreshed (replaced), which can cause a significant impact on 17
business operations. Operating plans and budgets are developed giving due consideration for supporting 18
the proactive refresh approach discussed in this section on Capital Expenditures. 19
In conclusion, our infrastructure hardware assets are an integral part of our business 20
operations, and are necessary to deliver service to our 4.9 million customers. Call centers, field 21
personnel, and automated distribution and control systems are all dependent upon hardware assets to 22
perform their duties and functions while maintaining a safe working environment. Our infrastructure 23
hardware assets suffer from the same phenomenon of age-related degradation as do many of our more 24
publicly visible transmission and distribution equipment assets. For the reasons described earlier, 25
hardware decisions increasingly cannot be made on a stand-alone basis, and need to be made at a 26
portfolio level, considering impacts to SCE’s overall hardware infrastructure. 27
77
2. Mainframe Servers 1
Table III-14 Work Breakdown Structure (WBS) ID and Description
WBS ID DescriptionCIT-00-OP-CS-000004 Mainframe Servers
a) Background 2
Mainframe servers are powerful computers used for critical business applications 3
and work flow systems integral to providing high reliability and security for SCE’s business operations. 4
Examples of such systems include the Customer Service System and data warehousing. The mainframe 5
servers also support operations for calculating, printing, and mailing bills to SCE’s 4.9 million 6
customers, paychecks to SCE’s approximately 20,000 employees, and payment checks to SCE’s 7
suppliers. 8
b) Business Requirements 9
The Customer Services System (CSS) provides multiple operational functions 10
supporting the Customer Care63 and billing processes running on the mainframe. CSS is essential in 11
providing accurate and timely customer bills, tracking SCE receivables, and creating and tracking field 12
service orders (e.g., turning a customer’s electric service “on” or “off”). Since CSS generates 13
approximately 224,000 customer bills and letters each business day, even a one-day outage can have a 14
significant impact. CSS is also used to manage customer relationships, initiate new service requests, 15
schedule and track service calls, and bill for products and services. All of these activities are supported 16
by the mainframe. 17
The Gartner Group, a leading expert in the industry, recommends mainframe 18
server life cycles should be five years.64 SCE follows this recommendation, and the SCE lifecycle time 19
frame for mainframe servers is five years. If the mainframe servers stay in service past their five-year 20
life cycle, these servers may be more prone to problems or failures as they age, negatively affecting 21
service to our customers. Additionally, refreshing mainframe servers increases performance and enables 22
63 Customer Care is a specific Customer Service Operational Unit (CSOU) outreach program. The CARE program
(California Alternate Rates for Energy also known as CARE) offers income-qualified customers a discount of 20% or more off their electric bill.
64 See workpaper entitled “Gartner: Extend the Life of your Server.”
78
better reliability and security needed to provide service to our customers. Also, if not refreshed within 1
five years, additional operating expenses will be needed to maintain the mainframe servers. 2
c) Recorded and Forecast Expenditures 3
SCE recorded $18.279 million for the period 2008-2012 for Mainframe Servers 4
Refresh and forecasts expenditures of $6.515 million, a 64 percent decrease, for the period 2013-2017 as 5
depicted in Figure III-13 below. 6
Figure III-13 Mainframe Server Refresh Expenditure
Recorded 2008-2012 and Forecast 2013-2017 (Nominal $000)
Forecast (2015 case)
2008 2009 2010 2011 2012 2013 2014 2015 2016 2017
Mainframe Server Refresh $10,219.3 $1,828.3 $132.6 $5,933.4 $165.7 $0.0 $0.0 $715.0 $0.0 $5,800.0
Total $10,219.3 $1,828.3 $132.6 $5,933.4 $165.7 $0.0 $0.0 $715.0 $0.0 $5,800.0
Recorded
$0.0
$1,000.0
$2,000.0
$3,000.0
$4,000.0
$5,000.0
$6,000.0
$7,000.0
$8,000.0
$9,000.0
2008 2009 2010 2011 2012 2013 2014 2015 2016 2017
Mainframe Server Refresh
(1) Recorded Expenditures 7
The expenditures in the recorded period were primarily driven by refresh 8
of mainframe servers at the end of useful life. 9
In 2008 we spent $10.219 million to refresh mainframe servers at the end 10
of useful life. 11
In 2009 we spent $1.828 million to acquire additional processor capacity 12
to support transaction processing performance needed for our CSS. 13
In 2010 we spent $133,000 for additional mainframe network capacity. 14
79
In 2011 we spent $5.933 million to refresh mainframe servers at the end of 1
useful life. 2
In 2012 we spent $166,000 for additional mainframe network capacity. 3
(2) Forecast Expenditures 4
For the period 2013-2017 our mainframe server forecast expenditures 5
consist of two major drivers: (1) refresh of mainframe servers and components at the end of useful life 6
and (2) system capacity increases for memory and processor additions to primarily handle CSS 7
transaction processing needs.65 To develop an accurate Mainframe Server Refresh forecast, we 8
identified the mainframe servers needing to be refreshed in the forecast period, and used the 2011 9
purchase price of those servers as the basis for our forecast. 10
We plan on retaining IBM as the vendor to provide mainframe servers. 11
IBM is the dominant vendor in the mainframe market providing solutions meeting our business 12
requirements. Leading up to the 2017 refresh purchase, we will benchmark pricing using third-party 13
industry analysis to validate we are receiving favorable pricing. All other forecast amounts were 14
obtained by using previous purchasing quotes from IBM for similar items. 15
In 2013 and 2014 we have no forecast expenditures because the 16
mainframe servers will have remaining useful life and will not require refresh. In addition, no system 17
capacity performance increases will be required. 18
In 2015 we estimate $715,000 to acquire additional processor capacity to 19
support transaction processing performance needed for our CSS. 20
In 2016 there are no forecast expenditures because the mainframe servers 21
will have remaining useful life and will not require refresh. In addition, no system capacity performance 22
increases will be required. 23
In 2017 we estimate $5.800 million to refresh mainframe servers. These 24
servers support CSS, which supports Customer Care and Billing business processes, which use the 25
mainframe systems. CSS is essential in providing accurate and timely customer bills, tracking SCE 26
receivables, and creating and tracking field service orders (e.g., turning a customer’s electric service 27
“on” or “off”). 28
65 See workpaper entitled “MIPS recorded and forecasted.”
80
d) Conclusion 1
The mainframe server computing environment is an essential part of SCE’s 2
Information Technology and business operations. Critical applications such as CSS run in this 3
environment. Our estimated expenditures are necessary to maintain the reliability, availability, 4
serviceability, and security of our mainframe server computing environment. Other forecast 5
expenditures are needed to acquire additional processor capacity to support transaction processing 6
performance needed to provide services to our customers. 7
3. Midrange Enterprise Servers Hardware 8
Table III-15 Work Breakdown Structure(WBS) ID and Description
WBS ID DescriptionCIT-00-OP-CS-000008 Midrange ServersCIT-00-OP-CS-000011 Non-UNIX ServersCIT-00-OP-CS-000014 Servers for TDBUCIT-00-OP-CS-000016 EA-Enterprise Application Integration-RefreshCIT-00-OP-CS-000017 IDE-Integrated Development Environment-RefreshCIT-00-OP-CS-000018 EA-Identity Management-RefreshCIT-00-OP-CS-000021 CDAS HW RefreshCIT-00-OP-CS-000022 SCE.comCIT-00-OP-CS-000042 CCO Server RefreshCIT-00-OP-CS-000044 Smart Connect Operational Data StoreCIT-00-OP-CS-000052 Cloud Computing Infra - RefreshCIT-00-OP-CS-000057 Cloud Computing Software (CIAC,VCD)CIT-00-OP-DC-000001 Data CenterCIT-00-OP-OM-00001 Integrated Test Environment (ITE)CIT-00-DM-DM-000009 EMS Refresh
a) Background 9
Midrange servers consist of the hardware and associated operating systems 10
supporting SCE’s critical business applications such as Enterprise Resource Planning (ERP), Edison 11
SmartConnect®, and Outage Management System (OMS). Midrange servers are a class of computers in 12
the middle of the computing spectrum between mainframe and personal computers. Since the 1980s, 13
when client server computing became predominant, the majority of business applications utilize the 14
midrange platform to best serve their business processing needs. 15
81
b) Business Requirements 1
Midrange servers are part of the computing infrastructure necessary to maintain 2
highly available, reliable, and secure core business operations for SCE. Industry expert Gartner Group 3
recommends server life cycles should be five years.66 SCE follows this recommendation, and the SCE 4
lifecycle time frame for midrange servers is five years. If the midrange servers stay in service past their 5
five-year life cycle, they can be more prone to extended outages due to lack of spare parts and outdated 6
firmware, and this can negatively impact our client and business operations. Additionally, the 7
replacements of midrange servers increase server performance, reliability, accessibility and 8
serviceability for our customers. Refreshing the midrange servers help us provide adequate service for 9
our customers. If not refreshed within five years, additional operating expenses will be needed to 10
maintain the midrange servers. 11
Where possible, SCE uses a virtualized server architecture67 to deliver critical 12
business functions to our customers. This technology enables us to run multiple applications on a single 13
physical server. These shared, virtual environments often even contain consolidated computing, storage, 14
and network capability. This increased virtualization reduces the cost associated with maintaining these 15
servers as well as the physical space and complexity when conducting our server refresh activities. This 16
architecture is also known as converged infrastructure vertical platforms. 17
Converged infrastructure vertical platforms allow for quicker and more affordable 18
set up for projects and other requests with a focus on pre-built, pre-packaged, and standardized 19
infrastructure capacity. With increased utilization of these platforms, IT can more effectively manage 20
capacity usage, create on-demand capabilities, provide a self-service catalog, as well as deliver desired 21
solutions quickly and at substantially lower overall costs. 22
c) Recorded and Forecast Expenditures 23
SCE recorded $144.5 million for the period 2008-2012 for the acquisition of 24
midrange server hardware and converged infrastructure vertical platforms, and forecasts expenditures of 25
$128.0 million, an 11 percent decrease, for the period 2013-2017 as depicted in Figure III-14 below. 26
66 See workpaper entitled “Gartner: Extend the Life of your Server.”
67 “Virtualization” is the term used to describe using one or many severs for multiple applications to improve utilization.
82
Figure III-14 Midrange Enterprise Server Refresh Expenditure
Recorded 2008-2012 and Forecast 2013-2017 (Nominal $000)
(1) Recorded Expenditures 1
The recorded expenditures for 2008-2012 include costs for acquiring, 2
building, configuring, and testing midrange servers and converged infrastructure vertical platforms for 3
new projects and existing servers at the end of useful life. The expenditures in the recorded period were 4
primarily driven by the implementation of multi-year projects such as Enterprise Resource Planning, 5
Edison SmartConnect®, Energy Management System, Information Security Program, Outage 6
Management System, Market Redesign Technology Upgrade, Distribution Service Request Pricing, Call 7
Center Optimization and other cybersecurity requirements. 8
In 2008 we spent $37.426 million for midrange servers to support the 9
implementation of multi-year projects as mentioned above as well as to refresh midrange servers at the 10
end of useful life. 11
In 2009 we spent $35.756 million for midrange servers to support the 12
implementation of multi-year projects as mentioned above as well as to refresh midrange servers at the 13
end of useful life. 14
WBS ID
CIT‐00‐OP‐CS‐000004
CIT‐00‐OP‐CS‐000011
CIT‐00‐OP‐OM‐00001
CIT‐00‐OP‐CS‐000014
CIT‐00‐OP‐CS‐000042
CIT‐00‐OP‐CS‐000016
CIT‐00‐OP‐CS‐000017
CIT‐00‐OP‐CS‐000018
CIT‐00‐OP‐CS‐000021
CIT‐00‐OP‐CS‐000044
CIT‐00‐OP‐CS‐000022
CIT‐00‐OP‐CS‐900000
Forecast
2008 2009 2010 2011 2012 2013 2014 2015 2016 2017
Midrange Enterprise Server 37,425.7 35,755.7 22,505.8 25,759.6 23,020.5 20,790.3 25,749.8 39,503.6 18,558 23,414
Total 37,425.7 35,755.7 22,505.8 25,759.6 23,020.5 20,790.3 25,749.8 39,503.6 18,558 23,414
Recorded
1,000.0 6,000.0
11,000.0 16,000.0 21,000.0 26,000.0 31,000.0 36,000.0 41,000.0
2008 2009 2010 2011 2012 2013 2014 2015 2016 2017
Midrange Enterprise Server Hardware($000)
Midrange Enterprise Server
83
In 2010 we spent $22.506 million for midrange servers to support the 1
implementation of multi-year projects as mentioned above as well as to refresh midrange servers at the 2
end of useful life. 3
In 2011 we spent $25.760 million for midrange servers and converged 4
infrastructure vertical platforms to support the implementation of multi-year projects as mentioned 5
above as well as to refresh midrange servers at the end of useful life. 6
In 2012 we spent $23.020 million for midrange servers and converged 7
infrastructure vertical platforms to support the implementation of multi-year projects as mentioned 8
above as well as to refresh midrange servers at the end of useful life. 9
(2) Forecast Expenditures 10
The forecast expenditures of $128.035 million for the period 2013-2017 11
include costs for acquiring, building, configuring, and testing midrange servers and converged 12
infrastructure vertical platforms for new projects, and refreshing existing servers at the end of useful life. 13
Our increased utilization of converged vertical platform yields reductions in cost required to refresh 14
midrange servers through reduced maintenance, increased infrastructure efficiency, increased IT service 15
availability, and reduced manual provisioning tasks, as reflected by the 11 percent reduction in forecast 16
spend for 2013-2017 compared to the 2008-2012 recorded spend.68,69 The expenditures in the forecast 17
period are primarily driven by the refresh of midrange servers for multi-year projects such as Enterprise 18
Resource Planning, Edison SmartConnect®, Energy Management System, Information Security 19
Program, Outage Management System, Distribution Service Request Pricing, Call Center Optimization, 20
and various cybersecurity requirements. 21
In 2013 SCE estimates $20.790 million for midrange servers and 22
converged infrastructure vertical platforms to support the implementation of multi-year projects as 23
mentioned above as well as to refresh midrange servers at the end of useful life. 24
In 2014 SCE estimates $25.750 million for midrange servers and 25
converged infrastructure vertical platforms to support the implementation of multi-year projects as 26
mentioned above as well as to refresh midrange servers at the end of useful life. 27
68 See workpaper entitled “Potential Savings from Converged Infrastructure – Vertical Model.pptx.”
69 See workpaper entitled “Project Cost Estimate Summary 2015 Cloud Computing.”
84
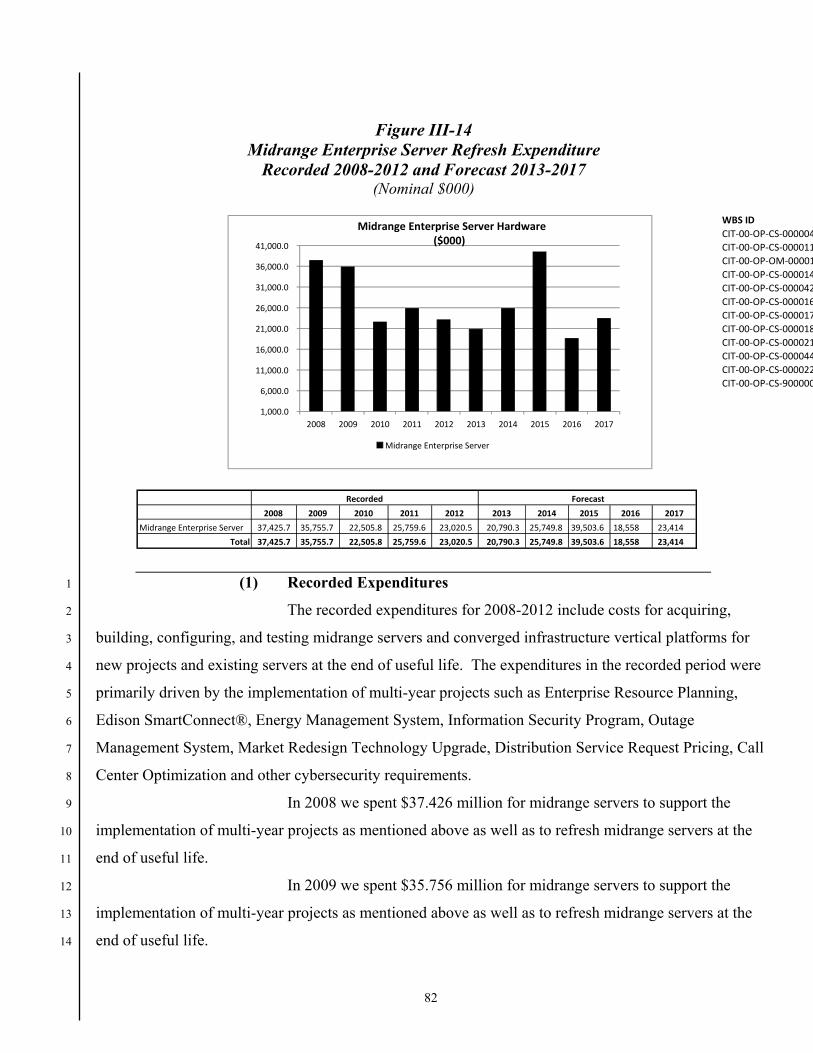
In 2015 SCE estimates $39.504 million for midrange servers and 1
converged infrastructure vertical platforms to support the implementation of multi-year projects as 2
mentioned above as well as to refresh midrange servers at the end of useful life. 3
In 2016 SCE estimates $18.558 million for midrange servers and 4
converged infrastructure vertical platforms to support the implementation of multi-year projects as 5
mentioned above as well as to refresh midrange servers at the end of useful life. 6
In 2017 SCE estimates $23.414 million for midrange servers and 7
converged infrastructure vertical platforms to support the implementation of multi-year projects as 8
mentioned above as well as to refresh midrange servers at the end of useful life. 9
d) Conclusion 10
The midrange server computing environment is an essential part of SCE’s 11
computer operations. Critical applications such as Enterprise Resource Planning, Edison 12
SmartConnect®, Energy Management System, Information Security Program, Outage Management 13
System, Market Redesign Technology Upgrade, Distribution Service Request Pricing, and Call Center 14
Optimization run in this environment. Our requested forecast expenditures are intended to maintain the 15
reliability, availability, serviceability, and security of our midrange server computing environment. All 16
of these activities are critical, and the refresh of the midrange server environment will allow us to 17
provide adequate services to our customers. 18
4. Disk and Tape Storage Refresh 19
Table III-16 Disk and Tape Storage Refresh
Work Breakdown Structure(WBS) ID and Description
WBS ID DescriptionCIT-00-OP-CS-000005 Mainframe Disk StorageCIT-00-OP-CS-000006 Mainframe Tape Storage-CWIPCIT-00-OP-CS-000009 Midrange StorageCIT-00-OP-CS-000010 Client/Project Storage GrowthCIT-00-OP-CS-000012 Non-UNIX Disk StorageCIT-00-OP-CS-000013 Non-UNIX Tape StorageCIT-00-OP-CS-000020 Client Driven HardwareCIT-00-OP-CS-000043 Database Storage Growth due to enhancements in backup utilitiesCIT-00-OP-CS-000050 Smart Connect Operational Data Store for storageCIT-00-OP-CS-000037 IT Capacity Expansion
85
a) Background 1
Disk and tape storage is the computer storage medium designed for enterprises 2
with requirements for high scalability, reliability, and fault tolerance.70 SCE utilizes the following three 3
primary categories of disk and tape storage: (1) Online disk storage - large disk array solutions, which 4
minimize access time to data, and maximize reliability; (2) Tape Backup Storage - off-line storage to 5
protect data using tape libraries; (3) Archiving - technically similar to tape backup storage, but its 6
purpose is long-term retention, management, and discovery of fixed content data to comply with 7
regulatory requirements. 8
SCE continues to use a virtualized approach, which enables storage to support the 9
requirements of multiple servers and platforms. Virtualization allows SCE to add, replace or remove 10
physical storage units without shutting down a server, and provides additional layers of security for 11
storage. In the absence of virtualization we would need to interrupt the availability of applications to 12
add, replace or remove storage. 13
Along with tape and disk storage, other components are required to store and back 14
up company data. If any one of the these components falls out of service or malfunctions, then the 15
reliability, accessibility, serviceability and recoverability of SCE’s data would be in jeopardy. Some of 16
the other key components include: 17
Peer To Peer Remote Copy (PPRC) software is used to transfer data between 18
mainframe storage at alternate data centers. 19
Cisco Directors transfer data from the client application servers to disk and 20
tape storage. 21
SAN volume controllers dynamically manage and change storage without 22
application interruptions. 23
Virtual Storage Managers (VSMs) and Virtual Tape Library (VTL) devices 24
are disk storage acting as a tape library. These devices speed up the process 25
of backing up and restoring for the mainframe (VSM) and midrange 26
environments (VTL). 27
70 Fault tolerance allows the system to stay available even when a part of the system fails.
86
Tape silos are shared backup devices housing tape drives and tape media to 1
backup and restore client data. 2
Tape drives are data storage devices which read and write data stored on tape 3
media. 4
b) Business Requirements 5
SCE uses disk and tape storage to store and recover all required business data, 6
such as customer information, company financial data, and employee-related data, as required by project 7
or regulatory demands. SCE replaces its disk and tape storage on the industry standard five-year life 8
cycle used for server hardware. If not refreshed within five years, additional operating expenses will be 9
needed to maintain disk and tape storage. The refresh of the storage hardware helps to ensure reliability, 10
availability, security, and recoverability of key utility functions and data to support projects and to help 11
ensure compliance with regulatory and security requirements. 12
In addition to replacement to avoid obsolescence and hardware failure, the current 13
applications continue to drive the need for expanded storage requirements. This growth is caused by 14
several factors including the need to ensure compliance with regulatory and security requirements. As 15
an example, it is a corporate requirement to store the company’s financial data for a minimum of seven 16
years. This requires additional tape storage each year as this data is archived. In order to meet existing 17
and emerging complex regulatory and legal requirements, we expect this trend to continue. 18
As applications continue to use different types of non-text based data, such as 19
high resolution image files, the need for additional storage space increases. These files are extremely 20
data intensive (i.e., they require more storage space) and if archived, need yet additional tape storage. 21
As applications improve and progress, the trend towards using and storing more complex data will 22
accelerate. 23
c) Recorded and Forecast Expenditures 24
SCE forecasts recorded $79.459 million for the period 2008-2012 for disk and 25
tape storage refresh and is requesting expenditures of $81.757 million, a 3 percent increase, for the 26
period 2013-2017 as depicted in Figure III-15 below. 27
87
Figure III-15 Disk and Tape Storage Refresh Expenditure Recorded 2008-2012 and Forecast 2013-2017
(Nominal $000)
Forecast (2015 case)
2008 2009 2010 2011 2012 2013 2014 2015 2016 2017
Disk and Tape Storage Refresh 9,631.7$ 34,282.0$ 16,835.4$ 296.3$ 18,413.6$ 12,578.0$ 12,396.6$ 18,425.0$ 16,710.0$ 21,647.2$
Total 9,631.7$ 34,282.0$ 16,835.4$ 296.3$ 18,413.6$ 12,578.0$ 12,396.6$ 18,425.0$ 16,710.0$ 21,647.2$
Recorded
$‐
$5,000.0
$10,000.0
$15,000.0
$20,000.0
$25,000.0
$30,000.0
$35,000.0
2008 2009 2010 2011 2012 2013 2014 2015 2016 2017
Disk and Tape Storage Refresh
(1) Recorded Expenditures 1
The 2008 to 2012 recorded expenditures fluctuated year to year depending 2
on the type and quantity of storage units acquired each year.71 3
In 2008 we spent $9.632 million for disk and tape storage and components 4
at the end of useful life and growth from projects including Cisco Directors, SAN virtualization 5
controllers, tape silos, virtual storage managers and virtual tape libraries. 6
In 2009 we spent $34.282 million. $26.861 million was spent to refresh 7
disk and tape storage and components at the end of their useful life and growth from projects including 8
Cisco Directors, a tape silo, and virtual tape libraries. $7.241 million was spent for a teradata online 9
disk storage device used to support Edison SmartConnect® data warehouse requirements. 10
In 2010 we spent $16.835 million for the refresh of disk and tape storage 11
and components at the end of useful life including SAN virtualization controllers, tape silos, virtual 12
71 This footnote intentionally left blank.
88
storage managers, virtual tape libraries, and additional tape drives, as well as to accommodate for 1
forecast disk and tape storage enterprise growth. 2
In 2011 we spent $296,000 for disk and components at the end of useful 3
life and growth from projects including Virtual storage managers. 4
In 2012 we spent $18.414 million for disk and tape storage and 5
components at the end of useful life and growth from projects including SAN virtualization controllers, 6
tape silos, virtual storage managers, virtual tape libraries, and additional tape drives, as well as to 7
accommodate for forecast disk and tape storage enterprise growth. 8
(2) Forecast Expenditures 9
For the period 2013-2017, we estimate $81.757 million to refresh the disk 10
and tape storage and components at the end of useful life and to provide increased storage capacity 11
required to meet the forecast enterprise growth in data and demand for storage, which is a 2.9 percent 12
increase from the 2008-2012 recorded spend.72 13
To develop an accurate disk and tape storage forecast, we identified the 14
disk and tape storage at the end of useful life and used vendor quotes as the basis of our forecast. Edge 15
Solutions was selected as a strategic business partner after responding to and winning a competitive 16
Request For Proposal for providing storage solutions.73 Edge Solutions will meet our storage business 17
requirements and is a Diverse Business Enterprise (DBE) supplier, helping to fulfill SCE’s supplier 18
diversity requirements as established in CPUC’s General Order 156. 19
In 2013 we estimate $12.578 million for the refresh of disk and tape 20
storage and components at the end of useful life including SAN virtualization controllers, tape silos, 21
virtual storage managers, virtual tape libraries, and additional tape drives, as well as to accommodate for 22
forecast growth in demand for disk and tape storage. 23
In 2014 we estimate $12.397 million for the refresh of disk and tape 24
storage and components at the end of useful life including SAN virtualization controllers, tape silos, 25
virtual storage managers, virtual tape libraries, and additional tape drives, as well as to accommodate for 26
forecast growth in demand for disk and tape storage. 27
72 See workpaper entitled “Forecast Expenditures for Disk and Tape Storage Refresh.”
73 See workpaper entitled “DSS Pricing Matrix.” Edge Solutions is the authorized reseller for Direct Systems Support.
89
In 2015 we estimate $18.425 million for the refresh of disk and tape 1
storage and components at the end of useful life including SAN virtualization controllers, tape silos, 2
virtual storage managers, virtual tape libraries, and additional tape drives, as well as to accommodate for 3
forecast growth in demand for disk and tape storage. 4
In 2016 we estimate $16.710 million for the refresh of disk and tape 5
storage and components at the end of useful life including SAN virtualization controllers, tape silos, 6
virtual storage managers, virtual tape libraries, and additional tape drives, as well as to accommodate for 7
growth in demand forecasted for disk and tape storage. 8
In 2017 we estimate $21.647 million for the refresh of disk and tape 9
storage and components at the end of useful life including SAN virtualization controllers, tape silos, 10
virtual storage managers, virtual tape libraries, and additional tape drives, as well as to accommodate for 11
forecasted for disk and tape storage. 12
d) Conclusion 13
Building and maintaining disk and tape storage is an essential part of SCE’s 14
computer operations. Critical applications such as Enterprise Resource Planning, Customer Service 15
System, Edison SmartConnect®, Energy Management System, Information Security Program, Outage 16
Management System, Market Redesign Technology Upgrade, Distribution Service Request Pricing, and 17
Call Center Optimization operate in this environment. Our requested forecast expenditures are intended 18
to maintain reliability, availability, security, and recoverability of our disk and tape storage and its data. 19
All of these activities are critical, and the refresh of our disk and tape storage will allow us to provide 20
adequate services to our customers and effectively run our business. 21
5. High Volume Printers and Bill Inserters Refresh 22
Table III-17 High Volume Printers and Bill Inserts Refresh
Work Breakdown Structure(WBS) ID and Description
WBS ID DescriptionCIT-00-OP-CS-000007 High Volume Printers and Bill InsertersCIT-00-OP-SM-000020 High Volume Printers and Bill Inserters
90
a) Background 1
SCE uses large high speed and high volume production printers and inserters 2
located at SCE facilities in Rosemead and Irvine, California. These devices are used to print, insert and 3
mail customer bills, letters, payroll and accounts payable checks, Tuesday through Saturday. 4
b) Business Requirements 5
The high volume printers and inserters are pivotal tools used in SCE’s billing 6
process. SCE has a customer base of 4.9 million, of which 82 percent74 receive their printed SCE 7
electric bills via the United States Postal Service. SCE prints, inserts, and mails 224,000 customer bills 8
and letters per day as of year-end 2012, in addition to checks to vendors, for a grand total of 179 million 9
pages per year. To process this high volume of customer bills, letters, and checks, we will need to 10
refresh printers and inserters which have reached their end of life. These older devices are highly 11
mechanical and contain many moving parts which are subject to wear and tear. Printing, inserting, and 12
mailing our customer bills, notices, payments, payroll, and other correspondence in a timely manner is 13
essential to our business, and properly functioning equipment is key to our ability to perform this 14
function consistently. 15
c) Recorded and Forecast Expenditures 16
SCE recorded $13.964 million for the period 2008-2012 to refresh high volume 17
printers and bill inserters, and forecasts expenditures of $4.238 million, a 70 percent decrease, for the 18
period 2013-2017, as depicted in Figure III-16 below. 19
74 As of January 31, 2013.
91
Figure III-16 High Volume Printers and Bill Inserters
2008 to 2012 Recorded and Forecast 2013-2017 (Nominal $000)
Forecast (2015 case)
2008 2009 2010 2011 2012 2013 2014 2015 2016 2017
High Volume Printers 1,115.6$ 4,037.9$ $0.0 5,024.4$ 3,786.2$ $0.0 $0.0 $0.0 $0.0 $0.0
High Volume Bi l l Inserters $0.0 $0.0 $0.0 $0.0 $0.0 $0.0 4,237.5$ $0.0 $0.0 $0.0
Total 1,115.6$ 4,037.9$ $0.0 5,024.4$ 3,786.2$ $0.0 4,237.5$ $0.0 $0.0 $0.0
Recorded Costs (2015 case)
$‐
$1,000.0
$2,000.0
$3,000.0
$4,000.0
$5,000.0
$6,000.0
2008 2009 2010 2011 2012 2013 2014 2015 2016 2017
High Volume Printers High Volume Bill Inserters
(1) Recorded Expenditures 1
In 2008 we spent $1.116 million because the high volume printers and 2
high volume bill inserters were at the end of their useful life. 3
In 2009 we spent $4.040 million for two bill inserters to replace aging 4
inserters in Rosemead and at the Irvine Data Center. Aging and obsolete mail inserters were replaced at 5
the end of useful life. 6
In 2010 there were no expenditures because the high volume printers and 7
high volume bill inserters had remaining useful life. 8
In 2011 we spent $5.024 million to refresh high volume printers at the end 9
of their useful life. 10
In 2012 we spent $3.786 million – 2.214 million was to refresh high 11
volume printers at the end of their useful life, and $1.571 million was to refresh bill inserters at the end 12
of useful life. 13
92
(2) Forecast Expenditures 1
To develop reasonable high volume printer and bill inserter refresh 2
forecasts, we identified the printers and bill inserters to be refreshed in the forecast period. We used the 3
May 2012 quotes obtained from our strategic business partners, InfoPrint (high volume printers) and 4
Pitney Bowes (high volume inserters) for pricing. InfoPrint and Pitney Bowes were selected as strategic 5
business partners after responding to and winning competitive Request For Proposals (RFP) for 6
providing printing and bill inserting solutions. These companies provide solutions meeting our business 7
requirements. 8
In 2013 there are no planned expenditures because the high volume 9
printers and high volume bill inserters will have remaining useful life. 10
In 2014 we estimate $4.238 million to refresh high volume printers and 11
billing inserters.75 In 2015, 2016, and 2017, there will be no expenditures because the high volume 12
printers and high volume bill inserters will have remaining useful life which will extend beyond this 13
GRC forecast cycle.76 14
d) Conclusion 15
For 2014 we estimate $4.238 million to refresh aging high volume printer and bill 16
inserter hardware at the end of useful life. This will allow SCE to continue the critical operational 17
activities of printing, inserting, and mailing our customer bills, notices, payments, payroll and other 18
correspondence in a timely manner. 19
75 See Confidential workpaper entitled “Forecast Expenditures for High Volume Printers and Bill Inserters Refresh.”
76 See workpaper entitled “Forecast Expenditures for High Volume Printers and Bill Inserters Refresh.”
93
6. Personal Computers (PCs) – Desktop/Notebook and Ruggedized Laptops Refresh 1
Table III-18 PC and Related Hardware Expenditures
WBS ID DescriptionCIT-00-OP-SM-000001 PC's - CDECIT-00-OP-SM-000003 Ruggedized Laptops for CSBUCIT-00-OP-SM-000005 TDBU Refresh for Ruggedized LaptopsCIT-00-OP-SM-000006 Specialty Printers for TDBUCIT-00-OP-SM-000004 TDBU New Ruggedized LaptopsCIT-00-OP-SM-000009 Ruggedized Panasonics for field data collection
a) Background 2
SCE's Information Technology Operating Unit (IT) is responsible for procuring, 3
deploying, and maintaining personal computers (PCs) for all employees at SCE who require one, both in 4
an office environment and in a field environment. 5
Office workers are provided with PCs to carry out routine tasks including email, 6
timesheets, word processing, budgeting activities, and the use of business related applications. 7
Employees whose job requires them to support multiple locations or work remotely after hours are 8
provided a standard laptop and all other employees receive a desktop PC and monitor.77 The harsh field 9
environment for troublemen responsible for responding to distribution and transmission line issues 10
requires the use of a ruggedized laptop, which was introduced in 2001. Advances in technology and 11
improvements in business processes have enabled current electronic information to replace potentially 12
outdated paper versions for work in the field. During the years 2002 – 2003, the ruggedized laptop 13
deployment was expanded to include Transmission Patrolmen, Substation Technicians, Field Service 14
Representatives, and Meter Technicians. Devices have been maintained and refreshed to these positions 15
since then.78 16
77 See workpaper entitled “IT Policy on laptop vs desktop justification.”
78 See workpaper entitled “Growth of laptop use over desktop use.”
94
b) Business Requirements 1
(1) Office Environment 2
With advances in technology, PCs have become more powerful and more 3
reliable, giving us the ability to extend their useful life. Their greater power has enabled increased 4
business capability with applications such as mapping, outage management, and engineering design and 5
modeling. Refresh of PCs is primarily driven by age and technology obsolescence. PCs durability and 6
capabilities have increased year over year allowing us to expand their useful life one additional year 7
going forward.79 With the improved reliability and longer use life, desktop PCs will now be refreshed 8
every five years, laptop PCs every four years,80 and monitors every seven years, affording us the ability 9
to extend the useful life of these devices provided we can obtain spare parts. 10
Mobile and remote workforce requirements have increased over the years, 11
driving our current PC environment to 60 percent laptop and 40 percent desktop. 12
(2) Field Environment 13
Business in the field requires current electronic versions of circuit maps, 14
safety manuals, and work management information to replace outdated paper versions. Electronic files 15
allow SCE to provide field employees with the most current versions of documentation needed by them, 16
while also providing a more efficient means to house and retrieve the types of vast documentation that 17
employees may need to reference in the field at any given time (for up to date safety procedures, 18
troubleshooting, etc.) Additionally, through the advancement of technologies and the introduction of 19
electronic forms for submissions, new work processes have been established that take advantage of these 20
mobile capabilities. Ruggedized laptops are securely mounted in field trucks, and accompanying mobile 21
specialty printers enable printing of customer receipts and circuit maps. The harsh field environment 22
includes travel over rough terrain and in inclement weather. Ruggedized laptops are built to operate 23
under these extreme conditions. The devices have magnesium alloy cases, are sealed against water, and 24
have shock-mounted hard drives. Cellular modems provide wireless connectivity for work dispatch, and 25
global positioning system receivers enable street mapping software so that crews can locate work sites. 26
79 See workpaper entitled “Refresh plan of 4 year cycle at 25% per year” for recorded and forecast costs.
80 See workpaper entitled “PC Purchase Lifecycle” for older industry standard PC refresh cycles.
95
Just as with the office environment PCs, one of the top drivers for the 1
refresh of Ruggedized laptops is end-of-life, which is addressed on a three-year plan to match the 2
industry standard of model releases.81 3
c) Recorded and Forecast Expenditures 4
SCE recorded $78.204 million for the period 2008-2012 to refresh PCs and 5
estimates a total of $45.326 million, a 42 percent decrease, for the period 2013-2017 as depicted in 6
Figure III-17 below. 7
Figure III-17 PC's and Related Hardware Expenditures
Recorded 2008-2012 and Forecast 2013-2017 (Nominal $000)
Forecast (2015 case)
2008 2009 2010 2011 2012 2013 2014 2015 2016 2017
PC's and Related HW $12,787.2 $21,323.4 $17,344.3 $15,671.7 $11,077.1 $11,350.0 $8,724.6 $9,128.0 $7,559.0 $8,564.0
Total $12,787.2 $21,323.4 $17,344.3 $15,671.7 $11,077.1 $11,350.0 $8,724.6 $9,128.0 $7,559.0 $8,564.0
Recorded
$0.0
$2,000.0
$4,000.0
$6,000.0
$8,000.0
$10,000.0
$12,000.0
$14,000.0
$16,000.0
2008 2009 2010 2011 2012 2013 2014 2015 2016 2017
PC's and Related HW
Figure III-18 below shows the data for standard office PCs in use broken out by 8
desktop and laptop for the recorded period (2008-2012) and forecast period (2013-2017). The forecast 9
device counts align with the overall projected employee base for the forecast period. 10
81 See workpaper entitled “3 year refresh on Ruggedized laptops” for the product lifecyle suggested by Panasonic, the
manufacturer of SCE's standard approved ruggedized laptops.
96
Figure III-18 Desktop and Laptops in use
Recorded 2008-2012 and Forecast 2013-2017 (Nominal $000)
2008 2009 2010 2011 2012 2013 2014 2015 2016 2017
D e sk to p s 8 ,663 8,341 8,030 7,610 7,200 7,835 7,000 7,000 7,000 7,000
Lap to p s 9 ,283 10,070 10,800 11,600 12,400 10,800 10,400 10,400 10,400 10,400
To ta l 17 ,946 18,411 18,830 19,210 19,600 18,635 17,400 17,400 17,400 17,400
F o re ca s tR e co rd e d
0
2,000
4,000
6,000
8,000
10,000
12,000
14,000
16,000
18,000
20,000
2008 2009 2010 2011 2012 2013 2014 2015 2016 2017
Desktops Laptops Total
Figure III-19 below shows the refresh units needed for desktops, laptops, and 1
monitors for the recorded period (2008-2012) and forecast period (2013-2017). 2
97
Figure III-19 PCs Refresh Units
2008-2012 Recorded and Forecast 2013-2017
Figure III - 19
2008 2009 2010 2011 2012 2013 2014 2015 2016 2017
Refreshed Desktops 2,432 586 1,353 1,205 901 2,200 1,750 1,500 1,500 1,500
Refreshed Laptops 640 2,091 2,557 1,615 2,145 3,100 2,800 2,800 2,800 2,800
Refreshed Monitors 0 2,050 1,409 3,653 1,089 2,000 3,500 3,500 3,500 3,500
Recorded Forecast
Recorded 2012 Refresh activity was lower then forecast due to
application readiness delays for the Windows 7 migration. This
resulted in a roll over to the 2013 numbers
Life cycle changes are reflected in the Years 2013-2017. Laptop will now have a 4 year, desktops a 5 year and monitors a 7 year life cycle
0
500
1,000
1,500
2,000
2,500
3,000
3,500
4,000
2008 2009 2010 2011 2012 2013 2014 2015 2016 2017
Recorded ForecastRefreshed Desktops Refreshed Laptops Refreshed Monitors
(1) Recorded Expenditures 1
In 2010-2012 mobile and remote workforce requirements increased 2
slightly, resulting in more conversions of desktop users to laptops. Growth in hiring and a growing need 3
for additional mobility within our workforce resulted in a consistent shift year over year of laptop versus 4
desktop need as well, driving our current PC environment to 60 percent laptop and 40 percent desktop. 5
In 2012, the trend towards conversions to laptops has leveled off and our 6
current PC environment is 60 percent laptop and 40 percent desktop. In 2012 we acquired 7
approximately $503,000 in hardware to refresh the Energy Management System (EMS) group. This 8
included 126 workstations, 348 monitors and 36 printers for this group. 9
(2) Forecast Expenditures 10
Forecasts for 2013-2017 reflect a refresh of approximately 20 to 25 11
percent of our PC inventory each year. Also included is the refresh of monitors, which have an average 12
life of seven years. 13
98
During the period 2013-2017, the price of PCs is expected to hold steady 1
at the newly negotiated rates from our PC provider. A new lower rate was negotiated and implemented 2
in 2012. To develop reasonable PC forecasts, we determined the amount of PCs that need to be 3
refreshed by year within the forecast period and estimated cost from quotes from our PC provider.82 To 4
ensure costs remain competitive, SCE conducted a competitive PC Product & Services Request For 5
Proposal (RFP) where we chose Dell,83 renegotiated pricing with them, and set up quarterly reviews of 6
their pricing with their competitors. Costs remain steady as we take advantage of new capabilities and 7
advancements in technology in new products as they replace older models to increase efficiency and 8
productivity for our employees. 9
(3) Ruggedized Laptops 10
Figure III-20 below shows the recorded and forecast expenditures for 11
ruggedized laptops. 12
82 See workpaper entitled “Cost chart of current devices.”
83 See workpaper entitled “Dell White Papers - Our PC Model Standards” for more information on SCE's selected PC models.
99
Figure III-20 Ruggedized Laptops Budget Requirement
2008-2012 Recorded and Forecast 2013-2017 (Nominal $000)
2008 2009 2010 2011 2012 2013 2014 2015 2016 2017
Amount ($000) $2,389 $2,240 $5,825 $1,400 $4,703 $4,200 $1,168 $2,968 $3,000 $3,000
Recorded Forecast
$0
$1,000
$2,000
$3,000
$4,000
$5,000
$6,000
$7,000
2008 2009 2010 2011 2012 2013 2014 2015 2016 2017
(a) Recorded Cost Analysis 2008-2012 1
The number of ruggedized laptops in service expanded from 1630 2
in 2005 to 2076 by end of 2012 as we added field force positions within the Transmission Distribution 3
Operating Unit (T&D) that utilize technology in the field (e.g., e-crew foreman, overhead and 4
underground inspectors, senior patrolmen, apparatus technicians, substation maintenance 5
electricians/technicians, etc.). Mobile applications provide the field information required by these field 6
force positions to help restore electrical service and improve customer service. 7
100
Figure III-21 Total Number of Ruggedized Laptops In Use 2008-2009 Recorded and Forecast 2013-2017
2008 2009 2010 2011 2012 2013 2014 2015 2016 2017
Total 1,905 2,076 2,046 2,223 2,060 2,060 2,060 2,060 2,060 2,060
Recorded Forecast
1,700
1,800
1,900
2,000
2,100
2,200
2,300
2008 2009 2010 2011 2012 2013 2014 2015 2016 2017
Total
(b) Forecast Costs Analysis 2013-2017 1
To develop reasonable forecasts for the ruggedized laptop refresh 2
we determined the projected business needs of the organization and analyzed our current inventory. To 3
ensure costs remain competitive, SCE conducted a competitive PC Product & Services Request For 4
Proposal (RFP), negotiated pricing with the vendor, and set up quarterly reviews of their pricing with 5
their competitors. Costs remain steady as we take advantage of new capabilities and technology 6
advancement in new products as they replace older models to increase efficiency and productivity for 7
our employees. Our selected PC provider is a Diverse Business Enterprise (DBE) supplier, which serves 8
to fulfill SCE’s supplier diversity requirements as established in the CPUC General Order 156.84 9
Ruggedized devices deployed during the 2012-2014 period for 10
T&D and the Customer Service Operating Unit will pass their third year of service during the forecast 11
period 2015-2017, and during that time additional field staff will begin utilizing mobile technology in 12
the field. We expect that the current ruggedized laptops will need to be refreshed. 13
Standardization of desktops and laptops for the office environment 14
and ruggedized laptops for the field brings improved information sharing, computing stability and 15
84 DBE is defined as a business that is at least 51% woman, minority, or severice-disabled veteran owned; or in the case of
any publicly owned business, at least 51% of the stock of which is owned by one or more woman, minority, or service-disabled veteran groups, and whose management and daily business operations are controlled by one or more such groups. The woman, minority, or service-disabled veteran groups owning such an enterprise must be either U.S. citizens or legal aliens with permanent residence status in the United States.
101
employee productivity. It also establishes a predictable PC environment that is easier to support and 1
allows for a routine refresh process. Without standardization and a continued refresh of the PC 2
environment, SCE would experience higher maintenance costs for PCs and related hardware, difficulty 3
maintaining service levels to our customers, and the inability of the PCs to support advances in 4
technology. 5
PC manufacturers generally operate on a production cycle of 12-18 6
months due to changing technology. Ruggedized laptops are generally on a longer time frame of 18-24 7
months due to specialized engineering and design requirements. 8
We currently purchase all of our PCs with a three-year parts and 9
labor service contract. If they break after the three years we pay time-and-material prices to have them 10
repaired. These repairs are costly and become more frequent as the PCs age. In order to optimize our 11
spend and use of PCs, we manage a five-year refresh program for desktop PCs and a three-year refresh 12
program for our laptops. Based on our experience and industry best practices, we believe this to be an 13
adequate and effective refresh cycle.85 14
d) Conclusion 15
The use of PCs in both the office environment and in the field continues to 16
expand. Applications continue to demand faster processors and larger storage. Downtime due to PC 17
failure is costly to productivity and ultimately inhibits our ability to adequately serve SCE’s customers. 18
Therefore, a reasonable refresh program that replaces most PCs before they break is preferable to one 19
that waits until failure. We believe that we have such a program and that it is a necessary part of 20
providing safe and reliable service. 21
7. Data and Voice Network Replacements 22
Table III-19 Data and Voice Network Replacements
Work Breakdown Structure(WBS) ID and Description
WBS ID DescriptionCIT-00-OP-NS-000007 Data and Voice Network ReplacementCIT-00-OP-NS-000185 CRE Pomona Innovation Way
85 See workpaper entitled “PC Purchase Lifecyles” for older industry standard refresh cycles.
102
a) Background 1
Data and voice network replacement provides for ongoing replacements and 2
upgrades of telephone systems and data network equipment as required due to technology and 3
operational obsolescence. 4
b) Business Requirements 5
Because of continually increasing security requirements,86 it is necessary to 6
continue to refresh the data and voice infrastructure in order to stay up with technology and avoid 7
operational obsolescence.87 By deploying newer technologies with additional functionality we are able 8
to meet the requirements of critical Operating Unit projects and long term business objectives. It 9
becomes increasingly difficult to maintain and manage maintenance and support as equipment used by 10
our data and voice network ages. 11
c) Recorded and Forecast Expenditures 12
SCE recorded $59.398 million for the period 2008-2012 for data and voice 13
network replacement, and forecasts $73.500 million, a 24 percent increase, for the period 2013-2017 as 14
depicted in Figure III-22 below. 15
86 See “The Continuing Challenge of Cybersecurity,” Chapter I, Section C, of this Volume for further discussion.
87 Operational obsolescence is the term used to describe equipment that cannot meet the requirements of the current operating environment.
103
Figure III-22 Data and Voice Network Replacement Expenditures
2008-2012 Recorded and Forecast 2013-2017 (Nominal $000)
Forecast (case)
2008 2009 2010 2011 2012 2013 2014 2015 2016 2017
Data and Voice Network Replacement $7,663.5 $7,626.0 $8,165.6 $16,644.5 $19,298.2 $14,000.0 $13,000.0 $15,500.0 $15,500.0 $15,500.0
Total $7,663.5 $7,626.0 $8,165.6 $16,644.5 $19,298.2 $14,000.0 $13,000.0 $15,500.0 $15,500.0 $15,500.0
Recorded
$0.0
$4,000.0
$8,000.0
$12,000.0
$16,000.0
$20,000.0
2008 2009 2010 2011 2012 2013 2014 2015 2016 2017
Data and Voice Network Replacement
(1) Recorded Expenditures 1
Our spending for data and voice network replacements varied during the 2
2008-2012 period. Our average spending targets during that period would have been approximately 3
$11.9 million in an average year, replacing about 400 data networking devices and 2,000 telephone 4
lines, as well as providing data network upgrades at data centers that support the operation of our entire 5
data network. The 2011 recorded costs reflect about $5 million more than in an average year due to 6
refreshing and upgrading critical infrastructure in the two data centers. In 2012 we initiated several 7
refresh projects to replace outdated equipment to support security projects and replace equipment that is 8
unsupported by the vendor, which accounted for about $8 million of additional capital expenditure. 9
(2) Forecast Expenditures 10
To develop reasonable forecasts for data and voice network replacement 11
we used estimates developed from recorded costs for the same or similar work.88 Our strategic partners 12
for data and voice network replacements are selected based on their ability to provide a unique product 13
88 See workpaper entitled “Forecast Expenditures for Voice and Data Network Replacements.”
104
or service that is either technically or operationally required to support the technologies we deploy. 1
Where multiple vendors can provide the same product or service, we select vendors through a 2
competitive bidding process. These vendors are regularly re-evaluated prior to contract renewal to 3
determine if they still provide the most cost effective solution. 4
In 2013 we forecast $14.000 million and in 2014 $13.000 million on data 5
network and telephone equipment replacements. These amounts include $4 million each year for 6
management tools, wireless devices, and security devices for our common data hubs that support the 7
entire network. This spend will address equipment that has reached the end of its five year lifecycle. 8
This lifecycle is based on industry standards from Gartner.89 We also estimate $1 million in this 9
category in 2013 to support the upgrade to VOIP licenses from the obsolete PBX system, and the related 10
infrastructure refresh. 11
In 2015-2017, we estimate $5.500 million for telephone replacements and 12
$10.0 million each year for data network replacements including tools for security and network 13
management, NERC/CIP security requirements, and increased network traffic. For example, we have 14
seen an increase of over 100 additional networking devices introduced each year into our network due to 15
new electrical facilities or building remodels. We have also seen about a 30 percent increase in data 16
network traffic over the last eighteen months. The budget for data and voice network replacement also 17
covers the lifecycle replacement of equipment (such as routers, switches, and transmission gear) 18
installed in connection with other projects such as Pomona Innovation and General Office 5 19
development, as well as several other new buildings completed in 2010-2011. The initial installation 20
costs for this equipment were covered under the budgets for those projects; however the lifecycle 21
replacement would be a requirement for the data and voice network replacements budget. The 22
additional lifecycle replacement for these other projects account for $2.5 million of our requested 23
increase. 24
d) Conclusion 25
The data and voice networks are integral to our ongoing business. SCE uses the 26
telephone system for communications within and between various SCE facilities. The data network 27
supports essential functions at substations, service centers, generating stations, and business offices, as 28
well as communication via the Internet with customers and outside organizations. In order to maintain a 29
89 See workpaper entitled “Network Equipment Lifecyle, Mark Sabbi, Gartner.”
105
reliable communication network, data and voice network replacement provides for ongoing 1
replacements and upgrades to the data network equipment and telephone systems as required due to 2
technical and operational obsolescence. With the exception of large projects required by the Operating 3
Units, we estimate on average about $15.5 million per year from 2015-2017 to provide upgrades to the 4
data network and telephone systems for the entire network, including network management and network 5
security devices. This is a 24 percent increase from previous years 2008 through 2012. Data and voice 6
network replacement will replace obsolete equipment, address the growth and new security requirements 7
in data network equipment, and accommodate data network traffic growth required to support the 8
continually increasing network demands throughout the company. 9
8. Transmission Network & Facilities 10
Table III-20 Transmission Network Facilities
Work Breakdown Structure(WBS) ID and Description
WBS ID DescriptionCIT-00- OP-NS-000008 Transmission Network and Facilities CIT-00- OP-NS-000010 Netwcomm Radios for CSBU Metering
a) Background 11
The Transmission Network and Facilities budget item provides for the life-cycle 12
replacement of obsolete, failed, and damaged telecommunications network equipment. The 13
telecommunications transmission network is the backbone on which the data and voice network runs. 14
This network consists of the infrastructure layer (fiber optic cable, microwave, etc.) and the transport 15
layer (fiber optic equipment and terminals). This is distinct from the data and voice network systems 16
described in Chapter III, Section A. 7 of this volume, which consists of routers, switches, telephone 17
systems, among other components. The expenditures support three types of work: telecommunications 18
facilities upgrades, network equipment replacement, and storm mitigation. 19
SCE operates and maintains a communications network that includes over 4,400 20
miles of fiber optic cable, 300 satellite terminals, and 47,000 NetComm radios. This network is used for 21
communications among our employees to dispatch personnel for restoration of electric service and new 22
service activation. The network is also used to support operations and maintenance of the electric grid, 23
as well as to interact with customers and vendors. The Transmission Network and Facilities budget item 24
106
is for replacing aging portions of SCE’s telecommunications network equipment and systems, 1
accommodating growth, and providing for replacement of damaged or failed equipment such as those 2
damaged by storms. 3
b) Business Requirements 4
The network element of this budget item is dedicated to the addition or 5
replacement of communications network transmission equipment (e.g., fiber optic equipment, satellite 6
terminals, and NetComm radios). Network additions are necessary when the communications traffic 7
along a given segment of the network grows to the point that the existing equipment is unable to handle 8
it effectively, much like a congested freeway. The inability to accommodate communications traffic is 9
recognized by assessing reports of delays in computer transactions and identifying communications links 10
that are being fully utilized and cannot accommodate any further traffic growth. On an ongoing basis 11
we evaluate how much of the network capacity is being used on various communications links. The 12
available capacity is then compared to additional planned capacity requirements from new projects or 13
business unit requests, and these additional requirements are factored into the life-cycle replacement of 14
equipment.90 Network replacements are also necessary when equipment has failed or aged to the point 15
that it has become obsolete and we can no longer acquire parts or support for the systems from the 16
manufacturer or vendor.91 Network maintenance, telecommunications facilities upgrades, and storm 17
mitigation are the three primary areas of expense for the network element of this budget item. 18
The purpose of the telecommunications facilities element is to maintain the 19
overall reliability of SCE’s telecommunications network by making appropriate additions and 20
replacements to communications facilities. Our communication sites are equipped with battery back-up 21
and standby generators to enable constant communications availability in the event of an electrical 22
power outage at the site. However, as direct current power systems age, the batteries can no longer hold 23
sufficient electrical charge to serve as a reliable back-up and must be replaced. We inspect these 24
systems annually and determine which systems need to be replaced based on their condition at the time 25
they are inspected. 26
Another aspect of the telecommunication facilities element of this budget item is 27
funding for replacement of roofing systems and air conditioning equipment at our communications 28
90 See A.10-11-015, SCE’s 2012 GRC, SCE-05, Vol. 2, Transmission Network & Facilities.
91 See workpaper entitled “Network Equipment Lifecyle, Mark Sabbi, Gartner.”
107
facilities. Communications equipment operates best in an environment of low humidity and moderate 1
temperature. Because communications equipment generates heat during normal operations, when 2
telecommunications equipment is added at a location, additional air conditioning capacity is typically 3
needed to keep the temperature within an acceptable range so that the equipment can operate. Over 4
time, leaks can develop in the roofs of the facilities that house this equipment, and air conditioning 5
systems break down with increasing frequency. As the maintenance costs to repair roofs and air 6
conditioning systems rise, and the risk of exposing sensitive equipment to the elements increases, the 7
roofs and air conditioning units eventually must be replaced. The decision to replace rather than repair 8
is made when repairs are not possible because the damage is too extensive or when parts are not 9
available for repairs. 10
The storm mitigation element of this budget item is for the repair or replacement 11
of damaged equipment and restoration of communications critical to SCE operations caused by storms 12
and the elements. Incidents of snow, ice, lightening, high winds, and power surges, as well as the 13
cumulative impact of these forces over time, can damage, degrade, or destroy telecommunications 14
facilities and equipment. Equipment such as communications antennas and fiber optic cables that are 15
located outdoors are particularly susceptible to damage from the elements. Once the equipment has 16
been damaged, it must be replaced in order to maintain the communications network. 17
c) Recorded and Forecast Expenditures 18
SCE recorded $ $55.798 million in expenditures during 2008-2012 for the 19
Transmission Network and Facilities, and estimates $ $82,562 million, a 48 percent increase, for 2013-20
2017, as depicted in Figure III-23 below. 21
108
Figure III-23 Transmission Network and Facilities Expenditures
2008-2012 Recorded and Forecast 2013-2017 (Nominal $000)
Forecast (2015 case)
2008 2009 2010 2011 2012 2013 2014 2015 2016 2017
Transmission Network and Facil ities $10,639.0 $12,607.3 $12,111.4 $10,934.4 $9,506.1 $12,100.0 $14,500.0 $17,300.0 $17,300.0 $17,300.0
Netcomm Radios for CSBU Metering $754.0 $800.0 $807.0 $836.0 $865.0
Transmission Network and Facilities $10,639.0 $12,607.3 $12,111.4 $10,934.4 $9,506.1 $12,854.0 $15,300.0 $18,107.0 $18,136.0 $18,165.0
Recorded
$0.0
$2,000.0
$4,000.0
$6,000.0
$8,000.0
$10,000.0
$12,000.0
$14,000.0
2008 2009 2010 2011 2012 2013 2014 2015 2016 2017
Transmission Network and Facilities
(1) Recorded Expenditures 1
Our spending for Transmission Network and Facilities budget item 2
matters varied during the 2008-2012 period. Our spending target during that period would have been 3
approximately $6.2 million per year. The 2008 and 2009 expenditures were not average spending years 4
due to replacement of critical obsolete microwave equipment as well as the completion of the mobile 5
radio system upgrade.92 The 2010-2012 expenditures were more than typical years with increases to 6
support increased network capacity to our data network hubs that support all the users of SCE’s data 7
network. 8
(2) Forecast Expenditures 9
During 2013-2017 we forecast a total of $82.562 million for Transmission 10
Network & Facilities budget item costs. We used information developed from our recorded costs for the 11
same or similar work to formulate our forecast estimates.93 Our vendors for Transmission Network and 12
Facilities are selected based on their ability to provide a unique product or service that is either 13
92 See Chapter III, Section A.12 of this volume for the full discussion on Mobile Radio System Upgrade.
109
technically or operationally required to support the technologies we deploy. Where multiple vendors 1
can provide the same product or service, we select vendors through a competitive bidding process. 2
These vendors are regularly re-evaluated prior to contract renewal to ensure they still provide the most 3
cost effective solution. 4
During 2013-2017 we estimate a total of $82.562 million, which is a 48 5
percent increase over the period 2008-2012. In 2013 and 2014, we estimate $12.854 million and 6
$15.300 million, respectively. Included in 2013 are $1.900 million for storm mitigation, backup power 7
systems, and facility repairs, and $ $10.954 million for telecommunications network equipment 8
replacement. The telecommunication network equipment replacement includes expenditures for fiber 9
optic equipment, satellite terminals, network synchronization equipment, and NetComm radios used to 10
support selected electric meters for our Customer Service Operating Unit. 11
In the three year period 2015-2017, we estimate $18.107 million, $18.136 12
million, and $18.165 million, respectively. The continued level of annual spending addresses the 13
continued increase in network equipment and traffic growth. For example, we have seen the data traffic 14
through our network increase about 275 percent over the last three years. Accordingly, in the 2015-2017 15
period we estimate $3.100 million for storm mitigation, backup power systems, and facility repairs, and 16
$15.100 million for telecommunications network equipment replacement. The actual expenditures in 17
the above categories and equipment types will vary from year to year because this budget item covers 18
failed and damaged telecommunications network equipment. For any given year, the type of equipment 19
that fails will vary depending on the circumstances. Also, because storms and emergency facility repairs 20
are considered unforeseen events and difficult to forecast, SCE reserves approximately two percent of 21
this budget item to ensure availability of funds should such events occur. 22
Also during 2013-2017, we estimate capital funding to replace the aging 23
NetComm radios used for the Customer Service Operational Unit’s remote metering. The average cost 24
per year is approximately $812,000 for a total five year forecast of $4.062 million. 25
d) Conclusion 26
SCE’s extensive telecommunications network is used for communications among 27
our employees, for the dispatch of personnel for restoration of electric service and new service 28
Continued from the previous page 93 See workpaper entitled “Forecast Expenditures for Transmission and Facilities.”
110
activation, to support operations and maintenance of the electric grid, and to support interaction with 1
customers and vendors. The Transmission Network and Facilities budget item funds are used to replace 2
aging portions of SCE’s telecommunications network equipment and systems, accommodate growth, 3
and provide for replacement of damaged or failed equipment such as that damaged by storms. This 4
budget item will support three major initiatives: telecommunications facilities upgrades, network 5
equipment replacement, and storm mitigation. The telecommunications facilities element maintains the 6
overall reliability of SCE’s telecommunications network by making appropriate additions and 7
replacements to communications facilities and back-up power systems. The facilities portion of this 8
budget item funds the replacement of roofing and air conditioning equipment at our communications 9
facilities, among other activities, to ensure that the facilities operate properly. Finally, the network 10
element of this budget item is dedicated to the addition or replacement of communications network 11
transmission equipment to maintain reliable network operations and reduce communications traffic 12
congestion. 13
9. Copper Wire Replacement 14
Table III-21 Copper Wire Replacement
Work Breakdown Structure(WBS) ID and Description
WBS ID DescriptionCIT-00-OP-NS-000011 Copper Wire Replacement
a) Background 15
The Copper Wire Replacement budget item funds the replacement of aging 16
copper communication cable with fiber optic cable necessary to preserve the reliability of grid protection 17
and grid operations circuits, provide increased bandwidth, and reduce maintenance costs. 18
SCE uses a variety of communications technologies in its telecommunications 19
network, including fiber optic cable, copper cable, and microwave. The microwave and fiber optic 20
systems cover our larger business offices as well as about 100 of our larger Transmission and 21
Distribution substations. When we started the Copper Wire Replacement project in 1997, we had 2,000 22
miles of copper communications cable supporting protective relaying, power management, and other 23
grid operations and control circuits for the operation of approximately 500 Transmission and 24
Distribution substations throughout SCE’s 50,000 square mile service territory. These grid protection 25
circuits require real-time, highly reliable communications channels for proper operation. This project 26
111
will extend fiber optic communications to these 500 substations and replace all 2,000 miles of copper 1
cable by 2020, which represents a 24-year effort from the project’s initial start in 1997. 2
Through 2012, we had completed installation of 1,098 miles of fiber optic cable 3
and fiber optic terminal installation at 375 substations. Over the next five years, we will continue to 4
install fiber optic cable to support the remaining substations. This long-term effort to install new fiber 5
optic cable to replace this aging copper cable infrastructure will be completed by the end of 2020. If we 6
slow the pace of replacement, we run the risk that problems with the aging copper cable will arise faster 7
than we can respond to them because of the amount of time needed to replace cable. This would 8
adversely impact key communications required for the operations and support of the electric grid. The 9
copper cable removal effort lags behind the fiber cable installation because all circuits and equipment on 10
a copper cable network ring must be cutover to the fiber cable prior to removing the copper cable. Thus, 11
we will continue the effort to remove the copper cable through 2020.94 12
b) Business Requirements 13
The average service life of this type of copper cable ranges from 25 to 35 years, 14
depending on the environment where the cable is installed. Most of SCE’s copper cable is more than 25 15
years-old, with over 50 percent (more than 1,000 miles of cable) more than 35 years-old.95 As copper 16
cable reaches the end of its useful life, performance degrades as a result of ground faults, susceptibility 17
to noise, and the effects of hi-voltage testing and cable outages. All of these factors reduce reliability. 18
Moreover, regardless of age, copper cable is susceptible to Ground Potential Rise (GPR) problems 19
inherent in copper communications cable operating near energized power lines.96 The fiber-optic cable 20
that SCE is using to replace the aging copper cable is not susceptible to the same degree of degradation 21
and reliability problems. 22
In addition, copper cable does not support necessary bandwidth capacity needs. 23
Additional bandwidth is required to support T&D automation projects, such as Substation Automation 24
and Substation Data Collection. Copper cable cannot effectively handle the added bandwidth 25
94 See workpaper entitled “Copper Cable Replacement Cumulative Recorded and Forecast Expenditures.”
95 See workpaper entitled “Aging Copper Wire and Protective Relaying Replacement Strategy.”
96 Ground Potential Rise is an electrical-magnetic interference that occurs when copper cables are in close proximity to high-voltage electrical lines, and the electrical lines experience a voltage spike. Because copper cables are used to communicate with T&D substations, they terminate at these substations and are strung along the same rights of way that
(Continued)
112
requirements such as those are attributable to automation systems that require faster transmission of data 1
between substations and allow T&D to operate and gather information from unattended substations. 2
Given the advantages of fiber optic cable over copper cable, in 1996, SCE 3
undertook this program to replace our existing copper cables with fiber optic cables. Before deciding on 4
this alternative, however, we evaluated four options to address the problem of aging copper 5
communications cable. The four options considered were: 6
Retain the status quo. 7
Replace copper cable with copper. 8
Lease circuits from telecommunications companies. 9
Install fiber optic cable. 10
The results of that analysis showed that the fourth option of replacing copper 11
cable with fiber option was the optimal choice.97 This outcome was re-analyzed and confirmed in 2001, 12
and still holds true today. We have not performed an updated analysis since the technologies involved 13
have not changed since 2001. Replacing all our copper-based circuits with fiber optic cable mitigates 14
the effects of deteriorating copper cable, preserves the reliability of our grid operations circuits, and 15
provides increased bandwidth for future growth for T&D projects. In addition, because fiber optic 16
cables are made of glass and transmit signals with light rather than electrical current, the Ground 17
Potential Rise interference problem discussed above will be eliminated. 18
c) Recorded and Forecast Expenditures 19
SCE recorded $23.674 million for the period 2008-2012 for Copper Wire 20
Replacement, and estimates $27.500 million, a 16.2 percent increase, for the period 2013-2017 as 21
depicted in Figure III-24 below. 22
Continued from the previous page are used for power lines. When communications were first extended to substations decades ago, copper cable routed via our rights of way was the only viable means.
97 See workpaper entitled “Aging Copper Wire and Protective Relaying Replacement Strategy.”
113
Figure III-24 Copper Wire Replacement Expenditures
2008-2012 Recorded and Forecast 2013-2017 (Nominal $000)
Forecast (2015 case)
2008 2009 2010 2011 2012 2013 2014 2015 2016 2017
Copper Wire Replacement $6,894.6 $2,754.3 $4,917.9 $6,079.1 $3,028.4 $5,000.0 $5,000.0 $6,000.0 $6,000.0 $5,500.0
Total $6,894.6 $2,754.3 $4,917.9 $6,079.1 $3,028.4 $5,000.0 $5,000.0 $6,000.0 $6,000.0 $5,500.0
Recorded (2015 case)
$0.0
$2,000.0
$4,000.0
$6,000.0
$8,000.0
$10,000.0
2008 2009 2010 2011 2012 2013 2014 2015 2016 2017
Copper Wire Replacement
(1) Recorded Expenditures 1
We initiated preliminary engineering for the fiber optic cable alternative to 2
copper wire in 1996, and we started substantial cable replacement activity in 1997. The replacement 3
program has targeted our least reliable and most problematic copper cable systems first. From 1997 to 4
2001, we installed 236 miles of fiber optic cable and associated lightwave equipment for 53 substations. 5
As we noted in the 2009 GRC testimony, we reassessed the replacement strategy in 2001. We found 6
that the then-current pace of replacement would not support business data and reliability needs, and we 7
began a more accelerated program to replace the remaining aging copper cable infrastructure. The 8
replacement program would have taken 40 years to complete at the prior pace. 9
In 2002 we began the transition to the accelerated replacement program 10
with $2.1 million in spending. From 2003 to 2006, we continued our gradual increase in spending 11
ranging from $6.4 million to $10.3 million. The 2008 expenditures decreased by $4 million to 12
accelerate the upgrade of our mobile radio system from the years in which this was funded – 2009 and 13
2010. In 2009 expenditures were $2.754 million due to an increase in the time required to obtain 14
permits for cable construction, which slowed down our rate of installation. From inception through the 15
114
end of 2012, we installed 1098 miles of fiber optic cable and associated lightwave equipment for 375 1
substations at a cost of $77.5 million – an average of about $70,583 per mile, including fiber optic 2
terminal equipment. This cost includes the installation of fiber cable and fiber optic equipment only, as 3
various systems continue to operate off existing copper wire systems. 4
(2) Forecast Expenditures 5
To develop a reasonable forecast for Copper Wire Replacement project 6
cost we used estimates developed from recorded costs for the same similar work. Our vendors for the 7
Copper Wire Replacement project are selected based on their ability to provide a unique product or 8
service that is either technically or operationally required to support the technologies we deploy. Where 9
multiple vendors can provide the same product or service, we select vendors through a competitive 10
bidding process. These vendors are regularly re-evaluated prior to contract renewal to ensure they still 11
provide the most cost effective solution. 12
Our plan for copper wire replacement in 2014 reflects our current outlook 13
for planned maintenance activities and T&D’s forecast of grid protection circuit requirements. We plan 14
to install approximately 30 miles of fiber optic cable and associated equipment at 18 substations by the 15
end of 2014. In a typical year, we expect to install about 30 miles of fiber optic cable and associated 16
equipment at 20 substations. This rate will allow for completing replacements by 2020. 17
We estimate on average $5.5 million annually through 2017. Although 18
costs vary significantly based on the areas where the fiber optic cable is being installed, proposed 19
spending levels for 2015 and beyond are based on installing approximately 25 miles of fiber optic cable 20
per year at a cost of $75,000 per mile, and installing equipment at over 24 substations each year at a cost 21
of $100,000 per terminal.98 22
d) Conclusion 23
The Copper Wire Replacement budget item funds SCE’s program to replace 24
aging copper communication cable with fiber optic cable to preserve the reliability of grid protection 25
and grid operations circuits and provide increased bandwidth for communications. Through its 26
completion in 2020, this project will extend fiber optic communications to these 500 substations and 27
replace all 2,000 miles of copper cable that existed in 1997. 28
98 See workpaper entitled “Project Cost Estimate Summary- Copper Cable Replacement.”
115
10. Fiber Cable Replacements 1
Table III-22 Fiber Cable Replacements
Work Breakdown Structure(WBS) ID and Description
a) Background 2
The Fiber Optic Cable Replacements budget item is a new item for this rate case. 3
This budget item (created in 2010) provides for the replacement of aging or failing fiber optic cables. 4
The budget item’s scope includes the replacement of these long distance fiber optic cables, which are 5
used primarily for long distance data transmission. The budget item’s scope does not include the 6
replacement of the associated network electronic equipment to which the cables connect. That 7
equipment is addressed, depending upon use, in the Data and Voice Network Replacement program or 8
in the Transmission Network & Facilities program described elsewhere in this volume. 9
SCE operates and maintains a communications network that includes over 4,400 10
miles of fiber optic cable. This network is used for communications among our employees for the 11
dispatch of personnel, for restoration of electric service, for new service activation, to support operations 12
and maintenance of the electric grid, and for interaction with customers and vendors. 13
b) Business Requirements 14
This budget item is dedicated to the replacement of aging, problematic fiber optic 15
cables. Cable replacements are necessary when cables begin to fail, are aged to the point that they 16
become problematic, or cannot effectively handle new fiber optic systems. For example, some of our 17
cables – about 527 miles – cannot reliably handle the newer, higher speed fiber optic terminals that we 18
are installing to meet increasing network capacity requirements or support new facilities (i.e., 19
substations, business offices, etc.)99 SCE began large-scale installation of fiber optic cable in the mid-20
1990’s. By 2015, these cables will be over 20 years old. Because our fiber network provides some of 21
our most critical communications connections to substations, customer call centers, data centers, and 22
99 See workpaper entitled “Sumitomo Fiber Cable” for locations of SCE's fiber cable.
116
large office facilities, maintaining a reliable fiber network is critical to maintaining reliable operations of 1
the electric grid and business operations. 2
Since many of our cables were installed in the mid-1990s, the cables are less than 3
20 years old and we have not had to do much in terms of fiber optic cable replacements. However, as 4
these cables age they will fail due to wear, weather, and other factors. As noted above, we have already 5
determined that about 527 miles of our existing cable cannot support the new fiber optic systems we are 6
installing. Also, we have over 4,400 miles of fiber optic cable, so any large scale replacement program 7
will take many years to complete. Because of these factors, this program will focus on replacing about 8
188 miles of our oldest cables by 2017. This would address about 4.3 percent of our fiber optic cables. 9
c) Recorded and Forecast Expenditures 10
SCE recorded $936,000 for the period 2008-2012 for Fiber Optic Cable 11
Replacement, and forecasts expenditures of $14.136 million for the period 2013-2017 as depicted in 12
Figure III-25 below. 13
117
Figure III-25 Fiber Optic Cable Replacement Expenditures 2008-2012 Recorded and Forecast 2013-2017
(Nominal $000)
Forecast (2015 case)
2008 2009 2010 2011 2012 2013 2014 2015 2016 2017
Fiber Optic Cable Replacement $0.0 $0.0 $0.0 $0.0 $936.1 $2,000.0 $1,232.2 $4,400.0 $4,380.0 $2,124.4
Total $0.0 $0.0 $0.0 $0.0 $936.1 $2,000.0 $1,232.2 $4,400.0 $4,380.0 $2,124.4
Recorded
$0.0
$2,000.0
$4,000.0
$6,000.0
$8,000.0
$10,000.0
2008 2009 2010 2011 2012 2013 2014 2015 2016 2017
Fiber Optic Cable Replacement
(1) Recorded Expenditures 1
In 2012 we spent $936,100 to replace obsolete fiber cables. In 2012, 2
expenditures were $5.000 million below forecast due to increased time to obtain permits for cable 3
construction. 4
(2) Forecast Expenditures 5
In 2013 and 2014 we will increase our spending to $2.000 million and 6
$1.232 million, respectively, to continue ramping up on the replacement of our aging fiber optic cable 7
In the 2015-2017 period, we request additional spending in order to more expeditiously replace obsolete 8
fiber optic infrastructure. We forecast spending $4.400 million, $4.380 million, and $2.124 million 9
respectively. In 2013 and 2014 we plan to replace 27 and 16 miles of fiber, respectively. From 2015-10
2017 we plan to replace 59, 58, and 28 miles, respectively.100 11
100 See workpaper entitled “Project Cost Estimating Summary- Fiber Optic Cable Replacements.”
118
d) Conclusion 1
SCE’s extensive telecommunications network is used for communications among 2
our employees for the dispatch of personnel, for restoration of electric service, for new service 3
activation, to support operations and maintenance of the electric grid, and for interaction with customers 4
and vendors. The Fiber Optic Cable Replacements project replaces obsolete portions of SCE’s fiber 5
optic cables to maintain reliable network operations and reduce communications traffic congestion. 6
11. Microwave Replacements 7
Table III-23 Microwave Replacements
Work Breakdown Structure(WBS) ID and Description
WBS ID DescriptionCIT-00-OP-NS-000224 Microwave Replacements Bt
a) Background 8
The Microwave Replacements budget item is a new budget item created in 2010 9
that provides for the life-cycle replacement of obsolete, failed, and damaged microwave equipment. 10
SCE operates and maintains a communications network that includes over 3,027 11
miles of microwave communications paths. This network is used for communications among our 12
employees for the dispatch of personnel, for restoration of electric service, for new service activation, to 13
support operations and maintenance of the electric grid, and interaction with customers and vendors. 14
The new Microwave Replacements project replaces aging portions of SCE’s microwave systems. 15
b) Business Requirements 16
This budget item for the replacement of failed or obsolete microwave terminals. 17
System replacements are necessary when equipment has failed or aged to the point where replacement 18
parts are no longer available from the vendor (which we designate in this section as obsolete). The risk 19
with leaving obsolete equipment in the field is that upon failure, the restore times are lengthy since it 20
requires not just a part replacement but an entire system swap-out. This type of outage could impact our 21
ability to provide safe and reliable service to our customers. 22
Since many of our systems were installed in the mid-1990s, we did not have to do 23
many microwave system replacements prior to 2009. However, as these systems have started to become 24
obsolete, we have determined a concentrated effort is needed to replace obsolete microwave equipment. 25
We will target replacement of our older, most critical systems in the first years. 26
119
c) Recorded and Forecast Expenditures 1
SCE recorded $9.836 million for the period 2008-2012 for Microwave 2
Replacements, and forecasts expenditures of $32.500 million for the period 2013-2017 as depicted in 3
Figure III-26 below. 4
Figure III-26 Microwave Replacements Expenditures
2008-2012 Recorded and Forecast 2013-2017 (Nominal $000)
Forecast (2015 case)
2008 2009 2010 2011 2012 2013 2014 2015 2016 2017
Microwave Replacements $0.0 $0.0 $5,147.9 $2,438.4 $2,250.1 $6,500.0 $6,500.0 $6,500.0 $6,500.0 $6,500.0
Total $0.0 $0.0 $5,147.9 $2,438.4 $2,250.1 $6,500.0 $6,500.0 $6,500.0 $6,500.0 $6,500.0
Recorded
$0.0
$1,000.0
$2,000.0
$3,000.0
$4,000.0
$5,000.0
$6,000.0
$7,000.0
$8,000.0
$9,000.0
$10,000.0
2008 2009 2010 2011 2012 2013 2014 2015 2016 2017
Microwave Replacements
(1) Recorded Expenditures 5
In 2010 we began the accelerated replacement program with $5.148 6
million in spending focusing on the critical obsolete microwave equipment. The 2011 and 2012 7
expenditures were $2.438 million and $2.250 million, respectively, for the replacement of our aging 8
microwave infrastructure. 9
(2) Forecast Expenditures 10
In the 2015-2017 period, we estimate additional spending in order to 11
adequately replace obsolete microwave equipment. In that timeframe, we aim to replace 20 to 25 12
microwave paths per year, averaging $6.500 million per year.101 13
101 See workpaper entitled “Project Cost Estimating Summary- Microwave Replacements.”
120
d) Conclusion 1
SCE’s extensive telecommunications network is used for communications among 2
our employees for the dispatch of personnel, restoration of electric service, new service activation, to 3
support operations and maintenance of the electric grid, and for interaction with customers and vendors. 4
The new Microwave Replacements project replaces aging portions of SCE’s microwave network 5
equipment and systems to maintain reliable network operations and reduce communications traffic 6
congestion. 7
12. Mobile Radio System Replacement 8
Table III-24 Mobile Radio System Replacement
Work Breakdown Structure(WBS) ID and Description
WBS ID DescriptionCIT-00-ET-AE-000005 Mobile Radio System Replacement
a) Background 9
SCE’s Mobile Radio System provides voice communications to support field 10
personnel engaged in daily operations, new construction, and emergency response. The current analog 11
based network was implemented in 1994-1995 and replaced a series independent radio systems operated 12
for different Operating Units within SCE. These systems were not interoperable and often the radios 13
were limited geographically, even within the same Operating Unit. The current Mobile Radio System is 14
a unified service used by SCE Operating Units for a variety of tasks including the dispatch of personnel 15
to restore electric service, the operation of the distribution grid in response to adverse conditions, the 16
communication to address dangerous electrical situations, especially during storms and emergencies, 17
and the activation of new service to our customers. This system is critical to business operations as it 18
provides reliable communication outside of other available channels, including cellular services. 19
b) Business Requirements 20
SCE’s current analog Mobile Radio System requires replacement prior to the end 21
of vendor support in 2015. Since SCE operations are dependent on this system as it is often the only 22
means of reliable communication while in remote field locations, the replacement effort must be 23
transparent to SCE field forces. To continue uninterrupted, reliable communication, the replacement 24
must begin by 2013 for the new system to be operational by 2015. If not approved during this GRC, the 25
Mobile Radio System performance will fall out of vendor support. Without the availability of spare 26
121
parts or vendor maintenance services, the radio system will increasingly be subject to failure, which 1
could affect work efficiency and safety. SCE’s ability to promptly restore service to customers after 2
emergencies and disasters would also be critically impaired. 3
c) Recorded and Forecast Expenditures 4
Figure III-27 Mobile Radio System Replacement
2008-2012 Recorded and Forecast 2013-2017 (Nominal $000)
(1) Recorded Expenditures 5
As this is a new project using new technology, it has no recorded costs in 6
prior years. 7
(2) Forecast Expenditures 8
The forecast costs are based upon replacing the existing analog mobile 9
radio system with a digital solution. We will retain existing equipment that is dual band (i.e., both 10
analog and digital), and replace equipment that is only analog as depicted in Figure III-27 above. 11
During the period 2013-2017 we forecast the total capital expenditure to be $57.000 million.102 In 2013, 12
$7.400 million is estimated to replace the system master controller and roughly 460 subscriber units. 13
102 See workpaper entitled “Forecast Expenditures for Mobile Radio System Replacement.”
122
The master controller manages all communication on the digital-based mobile radio network. The 1
controller keeps track of the different talks groups, personnel connected in each group, which 2
frequencies are available, and many other functions relating to the operation of the Mobile Radio 3
System. The $4.700 million controller replacement comprises the majority of the 2013 costs. The 4
remaining costs are mostly comprised of $1.500 million for subscriber unit replacements. Subscriber 5
units are the personal and vehicle-based mobile radios that will operate in both analog and digital bands. 6
This dual-band functionality will ensure reliable communications while the digital system is being 7
phased into production. 8
In 2014, $12.400 million is estimated to begin the component 9
replacements of 42 hilltop repeater sites and continue the replacement of an additional 900 subscriber 10
units. SCE has 125 repeater sites used to extend the mobile radio coverage to our service territory 11
including areas where difficult terrain prevents adequate radio reception. Each site requires the analog 12
equipment to be replaced with digital components. Also, $8.400 million is estimated for the repeater 13
site replacements and $3.000 million for the subscriber unit replacement. 14
In 2015, $14.000 million is estimated to continue the hilltop repeater 15
component replacement of an additional 42 sites and roughly 1200 subscriber units. The costs are 16
estimated at $8.400 million and $4.000 million respectively. 17
The repeater component and subscriber unit replacements continue in 18
2016 with $13.300 million estimated in total. Also, $3.600 million is estimated to replace an additional 19
1,100 subscriber units and $8.000 million is estimated to continue the component replacement at 40 20
hilltop repeater locations. 21
In 2017, $10.800 million is estimated to complete replacement of the final 22
900 subscriber units and 2 hilltop repeater component replacements. These costs are approximately 23
$3.000 million and $0.460 million respectively. These costs include the frequency, testing, engineering, 24
leasing, and installation of new repeater locations. 25
d) Conclusion 26
The existing mobile radio system is approaching end of life and will no longer be 27
under vendor support after 2015, which we define as “obsolete”. To maintain reliable field 28
communication and avoid the end of support, the replacement effort must begin in 2013. The solution 29
selected leverages our existing infrastructure and phases the implementation of a digital replacement 30
system. The advantages of this phased approach are that it limits costs by utilizing existing 31
123
infrastructure and continues to provide essential field communication during the 5-year replacement. If 1
funds are not approved in this rate case, the current radio system will fall into obsolescence without 2
spare parts or vendor support. This is unacceptable as is puts SCE field forces at risk without reliable 3
field communication and limits the response to both daily grid operations and emergency outage 4
situations. Approval for this replacement is essential to our SCE field operations and safety. 5
B. Risk Management 6
Table III-25 Risk Management
Work Breakdown Structure (WBS) ID and Description
WBS ID DescriptionCIT-00-OP-CS-000001 Disaster Recovery for Mainframe EnvironmentCIT-00-OP-CS-000002 Disaster Recovery for UNIX EnvironmentCIT-00-OP-CS-000003 Disaster Recovery for Non UNIX EnvironmentCIT-00-CC-CC-000016 Flash Copy for Large Database
1. Disaster Recovery 7
a) Background 8
Disaster Recovery includes the computing infrastructure necessary to minimize 9
interruption and to recover computing systems in the event of a disaster. Disaster recovery consists of 10
deploying strategies to recover critical systems following a disaster. Critical systems are those that are 11
required by critical business processes, such as power procurement, transmission, and customer service. 12
For such systems, disaster recovery plans are written so that the strategy can be effectively activated in 13
case of a disaster. To ensure that plans are accurate and well understood, they are periodically tested 14
and updated. Computing components of the disaster recovery infrastructure include: 15
Disk and tape storage hardware located in an alternate data center apart from 16
production from which to recover data in the event of a disaster; 17
Hardware, software, and network communications equipment to enable 18
automatic replication of disk data between data centers; and 19
Systems and software that enable high availability of business applications 20
through rapid failover to an alternate data center in the event of a disaster. 21
124
b) Business Requirements 1
SCE’s operations depend on information technology computing systems and 2
applications. During a disaster, SCE’s IT Operating Unit performs restoration of information 3
technology components, applications and devices to enable SCE to continue to operate the business. 4
These activities span computing systems and facilities at three primary California data centers located in 5
Alhambra, Irvine, and Rosemead. Disaster recovery capability is achieved through maintaining 6
redundant online capabilities at these locations. When critical applications or systems fail at one 7
location, the impact is mitigated by the resumption of computing system operations at an alternate data 8
center location. Failure of these systems in our business can affect the safety of SCE’s employees and 9
impair SCE’s ability to provide reliable power to our customers. Disaster Recovery planning and related 10
investments are intended to minimize such occurrences. 11
c) Recorded and Forecast Expenditures 12
SCE recorded $12.222 million for the period 2008-2012 for Disaster Recovery 13
and forecasts expenditures of $17.677 million, a 45 percent decrease, for the period 2013-2017 as 14
depicted in Figure III-28 below. 15
125
Figure III-28 Disaster Recovery
2008-2012 Recorded and Forecast 2013-2017 (Nominal $000)
Forecast (2015 case)
2008 2009 2010 2011 2012 2013 2014 2015 2016 2017
Disaster Recovery $1,829.3 $3,884.0 $2,235.7 $2,215.4 $2,057.6 $1,500.0 $4,327.1 $4,100.0 $4,100.0 $3,650.0
Total $1,829.3 $3,884.0 $2,235.7 $2,215.4 $2,057.6 $1,500.0 $4,327.1 $4,100.0 $4,100.0 $3,650.0
Recorded (2015 case)
$0.0
$2,000.0
$4,000.0
$6,000.0
$8,000.0
$10,000.0
$12,000.0
$14,000.0
2008 2009 2010 2011 2012 2013 2014 2015 2016 2017Disaster Recovery
(1) Recorded Expenditures 1
The expenditures in the recorded period were primarily driven by refresh 2
of disaster recovery hardware at the end of useful life for the period 2008 to 2012. In addition, disaster 3
recovery hardware was acquired to enhance disaster recovery capabilities for a number of key business 4
systems. 5
During 2008, $1.829 million was spent to acquire midrange servers to 6
complete the disaster recovery capability for the Outage Management System (OMS). In 2009, we 7
spent $3.884 million to expand the geographical failover capacity and create a Disaster Recovery test 8
environment to validate and certify the automatic failover technologies. An example was $1.665 million 9
to acquire Geographical Dispersed Parallel Sysplex (GDPS) software and hardware to automate and 10
increase the speed of mainframe failover for Customer Service System (CSS) applications and 11
databases. 12
In 2010 we spent $2.236 million on mainframe, midrange server, and 13
storage capacity expansion for our disaster recovery systems. 14
126
In 2011 we spent $2.215 million on mainframe, midrange server, and 1
storage capacity expansion for our disaster recovery systems. 2
In 2012 we spent $2.058 million on mainframe, midrange server, and 3
storage capacity expansion for our disaster recovery systems. 4
(2) Forecast Expenditures 5
For the forecast period 2013-2017, the estimated expenditures are driven 6
by refreshing equipment that has reached the end of useful life103 and for enhancing disaster recovery 7
capabilities for key business systems. The activities undertaken will give us the ability to recover 8
critical applications within reasonable timeframes as determined by IT and business leadership. The 9
exact expenditure by year is determined by two factors. The first factor is replacement of equipment 10
reaching end of useful life, which is primarily determined by equipment age. The second factor is 11
capacity growth, which is estimated by calculating any additional expenditure on servers and converged 12
infrastructure vertical platforms that will be used for critical business systems that are new to the data 13
centers. If it is determined that these new systems require a disaster recovery capability, then the 14
additional disaster recovery systems are included in our request for that year. 15
For our rate case period, SCE estimates the following amounts for refresh 16
and additional capacity: 17
2013: $1.500 million 18
2014: $4.327 million 19
2015: $4.100 million 20
2016: $4.100 million 21
2017: $3.650 million104 22
d) Conclusion 23
The Disaster Recovery services are essential to continuous operation of critical 24
business systems in the event of a disaster. Over the forecast period, we expect to refresh our existing 25
Disaster Recovery environment and enhance existing capabilities26
103 End-of-useful-life for this equipment is the condition where the reliability is degrading because of age and/or use, or the
equipment is no longer supported by the vendor because of age.
104 See workpaper entitled “Forecast Expenditure for Disaster Recovery.”
A-1
SOUTHERN CALIFORNIA EDISON COMPANY
QUALIFICATIONS AND PREPARED TESTIMONY
OF JAY A. CASTLEBERRY Q. Please state your name and business address for the record. 1
A. My name is Jay A. Castleberry, and my business address is 4910 Rivergrade Road, Irwindale, 2
California 91706. 3
Q. Briefly describe your present responsibilities at the Southern California Edison Company. 4
A. I am the Director of Technology Delivery and Maintenance. In this capacity, I am responsible 5
for the diverse organization providing software solutions for Customer Service, Energy 6
generation and procurement, Transmission and Distribution, Human Capital Management, 7
Enterprise Asset Management, Finance, Compliance, Security, Legal, and Solution Delivery 8
management to our business partners within Southern California Edison. 9
Q. Briefly describe your educational and professional background. 10
A. I received my B.S., Business Administration and Hotel/Restaurant Management from California 11
State Polytechnic University-Pomona in 1990. I have worked for Southern California Edison for 12
1 year. Before joining Southern California Edison, my more recent positions included 13
Information Technology Executive at Ciber from 2008 to 2012, Director of Business 14
Intelligence, Data Warehousing and CRM at Lennar from 2007 to 2008, Director of 15
Infrastructure, Technical and Network Services at Fleetwood Enterprises from 2002 to 2007. 16
Effective August 1, 2012, I assumed the position of Director for Technology Delivery & 17
Maintenance. 18
Q. What is the purpose of your testimony in this proceeding? 19
A. The purpose of my testimony in this proceeding is to sponsor portions of SCE-05, Volume 1, 20
entitled Information Technology - Overview, O&M and Capital as identified in the Table of 21
Contents thereto. 22
Q. Was this material prepared by you or under your supervision? 23
A. Yes, it was. 24
Q. Insofar as this material is factual in nature, do you believe it to be correct? 25
A. Yes, I do. 26
Q. Insofar as this material is in the nature of opinion or judgment, does it represent your best 27
judgment? 28
A-2
A. Yes, it does. 1
Q. Does this conclude your qualifications and prepared testimony? 2
A. Yes, it does. 3
A-3
SOUTHERN CALIFORNIA EDISON COMPANY
QUALIFICATIONS AND PREPARED TESTIMONY
OF TODD INLANDER Q. Please state your name and business address for the record. 1
A. My name is Todd Inlander. My business address is 2244 Walnut Grove Avenue, Rosemead, CA, 2
91770. 3
Q. Briefly describe your present responsibilities at the Southern California Edison Company. 4
A. As vice president of Information Technology and Chief Information Officer for Southern 5
California Edison, I lead the organization responsible for the delivery of technology services to 6
the various organizational units within SCE. In this role, I’m responsible for setting the 7
technology standards for the enterprise, and planning the future technology needs to enable the 8
company to meet its business objectives on behalf of our customers. 9
Q. Briefly describe your educational and professional background. 10
A. I hold a Bachelor of Science degree in Mechanical Engineering from Rutgers University College 11
of Engineering. I joined SCE in September 2011 as the Vice President of Client Services, 12
Planning and Controls and was promoted to Vice President and CIO in May 2012. I have also 13
held the title of Vice President and CIO for Edison Mission Group (EMG). Before joining EMG 14
in 2008, I served as CIO of the homebuilding subsidiary of Lennar Homes, responsible for 15
delivering technology solutions to support the needs of homebuilding and land operations. I was 16
also senior vice president and CIO for Fleetwood Enterprises, where I implemented enterprise 17
resource planning and customer-relationship management initiatives to standardize common 18
applications. 19
Q. What is the purpose of your testimony in this proceeding? 20
A. The purpose of my testimony in this proceeding is to sponsor portions of SCE-05, Volume 1, 21
entitled Information Technology - Overview, O&M and Capital as identified in the Table of 22
Contents thereto. 23
Q. Was this material prepared by you or under your supervision? 24
A. Yes, it was. 25
Q. Insofar as this material is factual in nature, do you believe it to be correct? 26
A. Yes, I do. 27
A-4
Q. Insofar as this material is in the nature of opinion or judgment, does it represent your best 1
judgment? 2
A. Yes, it does. 3
Q. Does this conclude your qualifications and prepared testimony? 4
A. Yes, it does. 5
A-5
SOUTHERN CALIFORNIA EDISON COMPANY
QUALIFICATIONS AND PREPARED TESTIMONY
OF B. “KURT” SWEETSER Q. Please state your name and business address for the record. 1
A. My name is Bradley Kurt Sweetser, and my business address is 4777 Irwindale Ave, Irwindale, 2
CA, 91706. 3
Q. Briefly describe your present responsibilities at the Southern California Edison Company. 4
A. I am the Director of IT Client Services & Planning for SCE, which includes planning and 5
delivery of service to IT business unit clients, business process work, and for the controls, 6
architecture, engineering and support functions that have impact across IT. I am responsible for 7
overseeing the planning, demand management, and optimization of IT services to SCE's 8
organizational units. 9
Q. Briefly describe your educational and professional background. 10
A. I hold a Bachelor of Science degree in Electrical and Computer Engineering from California 11
State Polytechnic University - Pomona, and almost 20 years of IT experience. My experience at 12
SCE has included serving as general manager of IT Network and Telecommunications, Director 13
of the deployment team and Program Management Office for SCE’s Enterprise Resource 14
Planning implementation and in 2009, I assumed the position of Director for Business Relations. 15
I am currently the Director of Client Services & Planning, responsible for planning and portfolio 16
management for business unit clients. 17
Q. What is the purpose of your testimony in this proceeding? 18
A. The purpose of my testimony in this proceeding is to sponsor portions of Exhibit SCE-05, 19
Volume 1, entitled Information Technology - Overview, O&M and Capital, as identified in the 20
Table of Contents thereto. 21
Q. Was this material prepared by you or under your supervision? 22
A. Yes, it was. 23
Q. Insofar as this material is factual in nature, do you believe it to be correct? 24
A. Yes, I do. 25
Q. Insofar as this material is in the nature of opinion or judgment, does it represent your best 26
judgment? 27
A. Yes, it does. 28