INITIAL TOWNSHIP TESTING OF NITRATE IN PRIVATE WELLS STEARNS COUNTY 2014 SUMMARY January 2016 Minnesota Department of Agriculture Pesticide and Fertilizer Management Division In accordance with the Americans with Disabilities Act, this information is available in alternative forms of communication upon request by calling 651-201-6000. TTY users can call the Minnesota Relay Service at 711. The MDA is an equal opportunity employer and provider.
Transcript
INITIAL TOWNSHIP TESTING OF NITRATE IN PRIVATE WELLS
STEARNS COUNTY 2014 SUMMARY
January 2016
Minnesota Department of Agriculture
Pesticide and Fertilizer Management Division
In accordance with the Americans with Disabilities Act, this information is available in alternative forms of
communication upon request by calling 651-201-6000. TTY users can call the Minnesota Relay Service at 711. The MDA is an equal opportunity employer and provider.
ACKNOWLEDGEMENTS
MDA PRIMARY AUTHORS
Kimberly Kaiser and Nikol Ross
MDA CONTRIBUTORS AND REVIEWERS
Annie Felix-Gerth, Heather Johnson, Larry Gunderson, Bill VanRyswyk, and Bruce Montgomery
FUNDING
Project dollars provided by the Clean Water Fund (from the Clean Water, Land and Legacy Amendment).
Appendix A ...............................................................................................................................27
Appendix B ...............................................................................................................................28
LIST OF FIGURES
Figure 1. Stearns County Geomorphology from the Sediment Association (DNR, MGS, UMD 1997). ........................................................................................................................................ 8
Figure 2. Water Table Aquifer Vulnerability Rating for Stearns County. ..................................... 9
Figure 3. Stearns County Geologic Atlas Part B: Sensitivity of Ground-Water Systems to Pollution (MDNR, 1998). ...........................................................................................................11
Figure 4. Results from the Central Sands Private Well Network 2011 Sampling Event. ............14
Figure 5. Townships with Vulnerable Groundwater and Row Crop Production. .........................16
Figure 6. Stearns County 2014 Initial Township Testing Results. ..............................................19
2014 Summary Stearns County Township Sampling | 3
LIST OF TABLES
Table 1. Vulnerability Ratings Based on the Geomorphology of Minnesota, Sediment Association Layer. ...................................................................................................................... 8
Table 2. Aquifer Type Distribution of Wells in Stearns County from the County Well Index. ......12
Table 3. Central Sands Private Well Network 2011 Results Summary. .....................................15
Table 4. Township Population, Households, Sample Kit Distribution and Return Rate. .............17
Table 5. Stearns County Initial Township Testing Summary Statistics, does not Include Known Hand Dug Wells. .......................................................................................................................20
Table 6. Initial Township Nitrate Results Summary Related to Vulnerable Groundwater and Row Crop Production. .......................................................................................................................21
Table 7. Nitrate Concentrations within Sampled Aquifers. .........................................................23
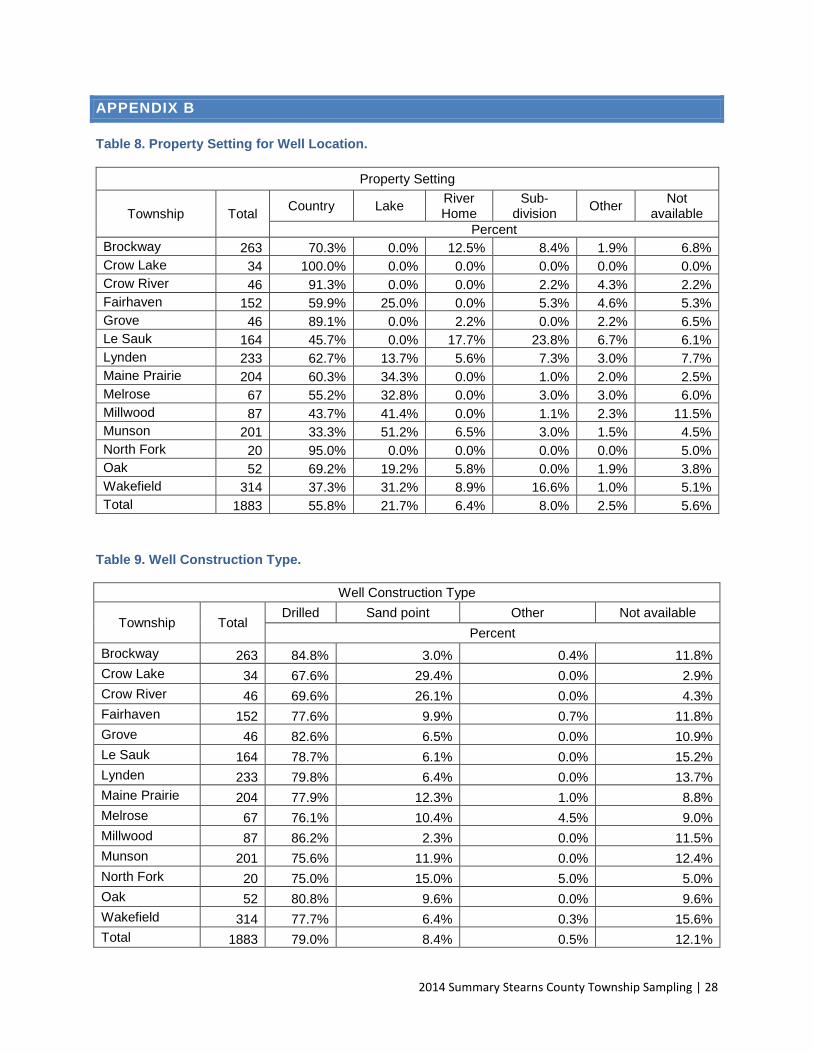
Table 8. Property Setting for Well Location. ..............................................................................28
Table 9. Well Construction Type. ..............................................................................................28
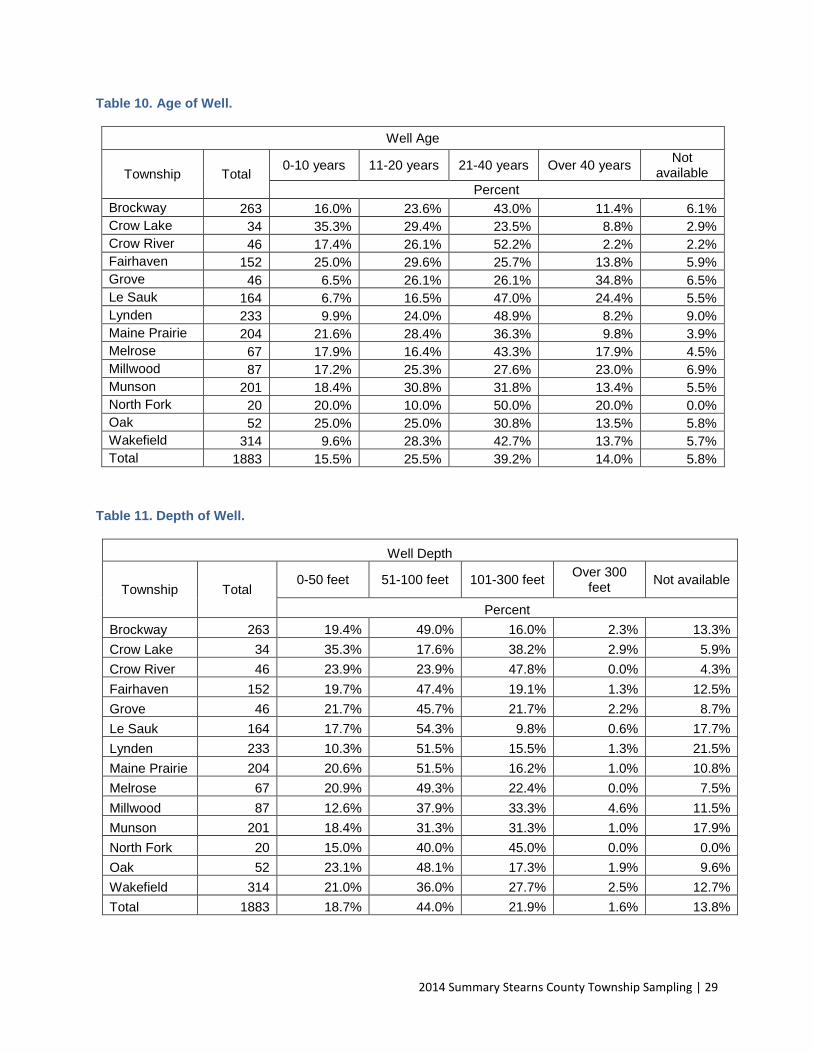
Table 10. Age of Well. ...............................................................................................................29
Table 11. Depth of Well. ............................................................................................................29
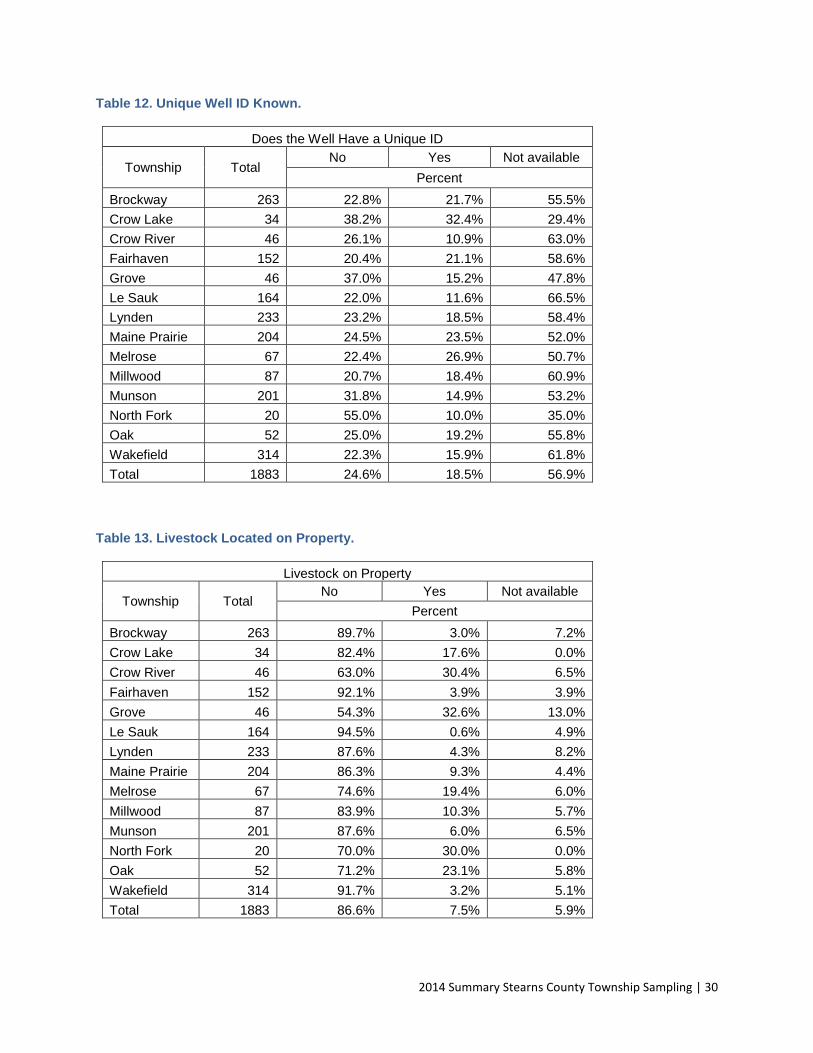
Table 12. Unique Well ID Known...............................................................................................30
Table 13. Livestock Located on Property. .................................................................................30
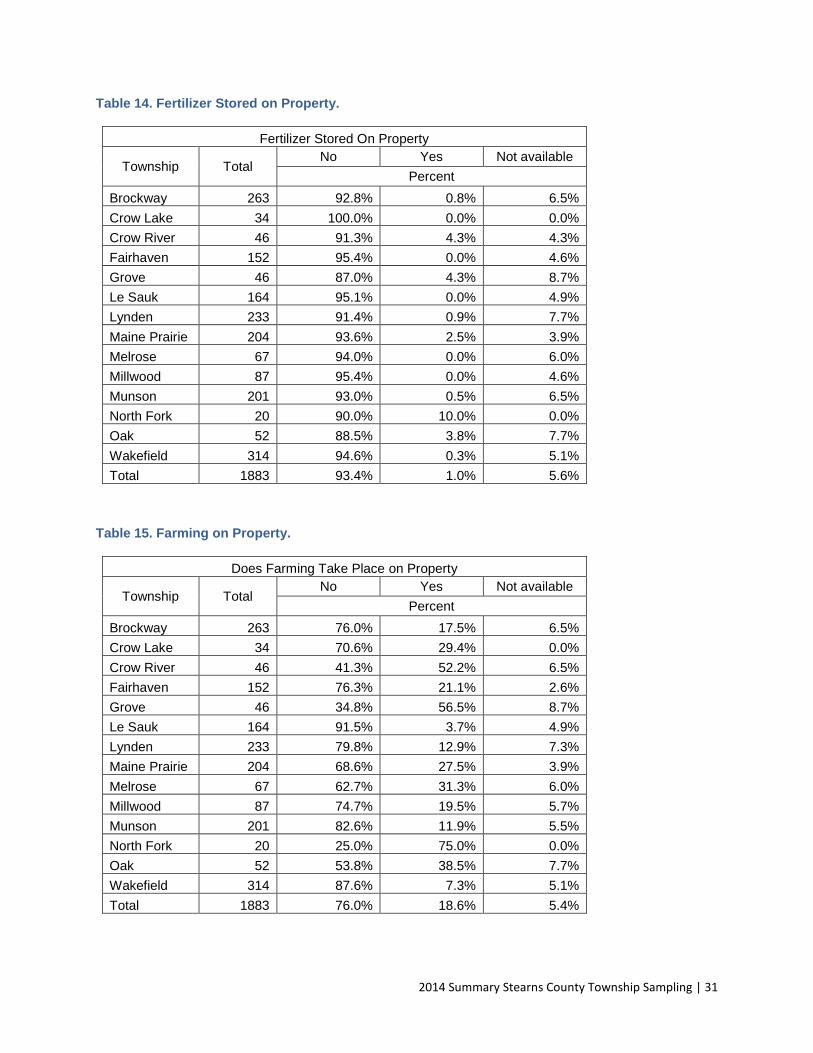
Table 14. Fertilizer Stored on Property. .....................................................................................31
Table 15. Farming on Property. .................................................................................................31
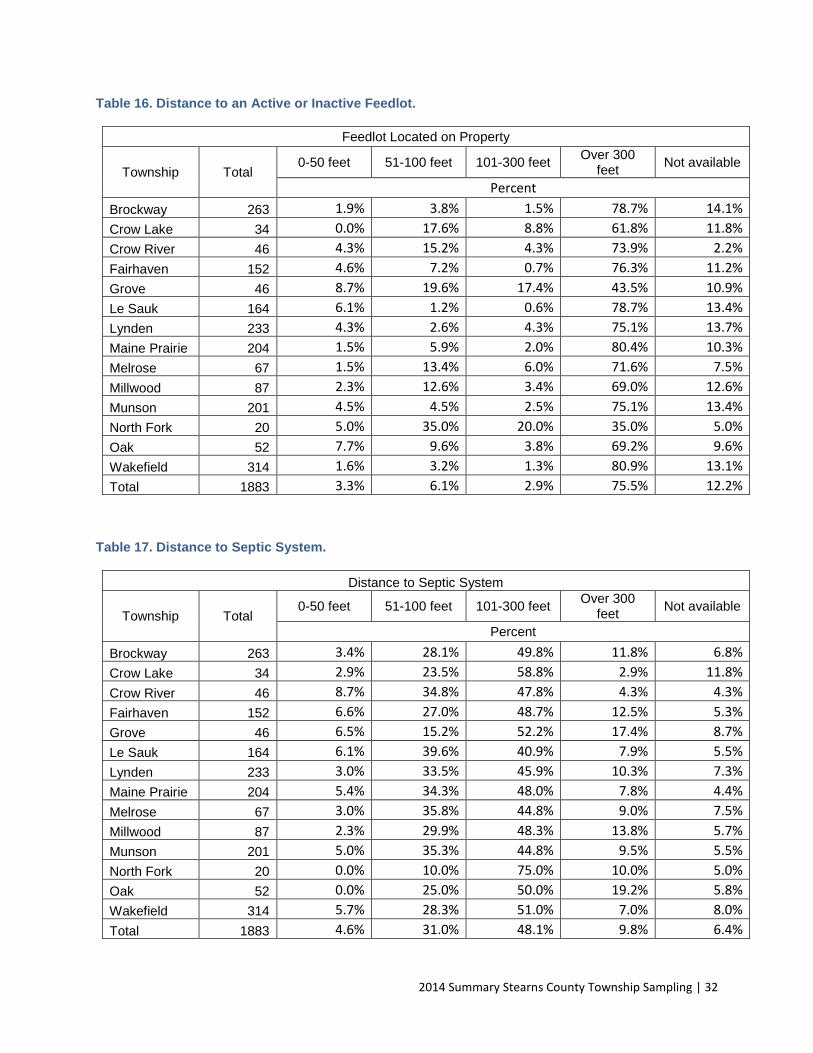
Table 16. Distance to an Active or Inactive Feedlot. ..................................................................32
Table 17. Distance to Septic System. ........................................................................................32
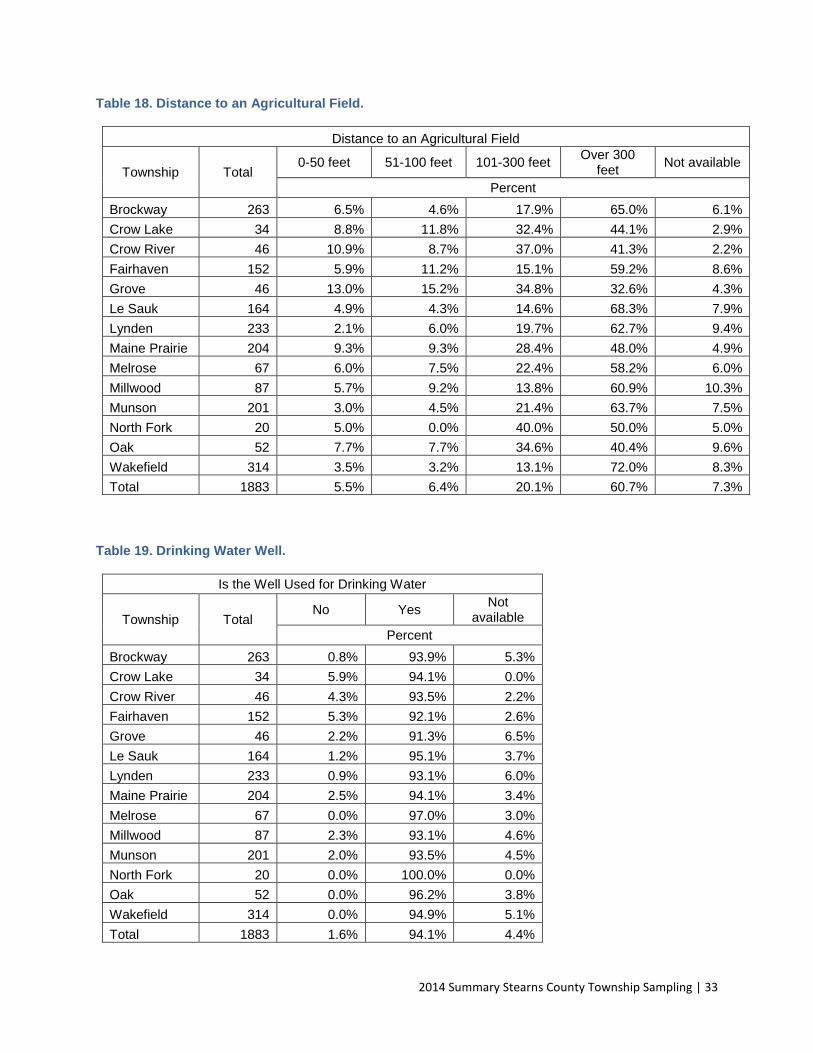
Table 18. Distance to an Agricultural Field. ...............................................................................33
Table 19. Drinking Water Well. ..................................................................................................33
Table 20. Treatment System Present. .......................................................................................34
Table 21. Last Tested for Nitrate. ..............................................................................................34
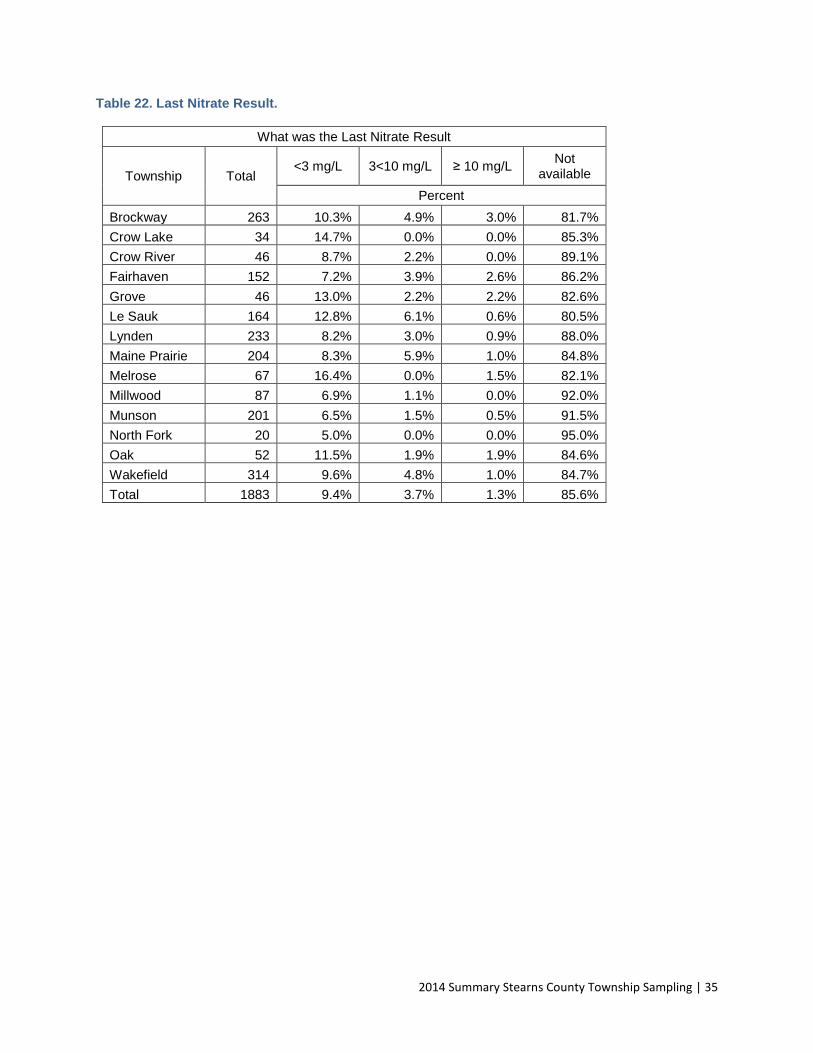
Table 22. Last Nitrate Result. ....................................................................................................35
2014 Summary Stearns County Township Sampling | 4
EXECUTIVE SUMMARY
In 2014, fourteen townships were selected to participate in a large scale nitrate assessment of private wells. The townships were chosen based on several criteria such as expertise from the local Soil and Water Conservation District (SWCD), past high nitrate results, vulnerable groundwater, and row crop production. Samples were collected from private wells using homeowner collection and mail-in methods.
According to the County Well Index (CWI) the Quaternary buried aquifers are more readily used than the water table aquifers in the selected townships. Samples were collected from 1,894 wells representing a 29 percent response rate from homeowners.
Results showed that across the fourteen townships, seven percent of private wells sampled were above the health standard of 10 mg/L for nitrate as nitrogen (nitrate-N). In Brockway, Grove and Wakefield Township, greater than 10 percent of wells were above 10 mg/L nitrate-N.
This initial homeowner collected sampling was followed by a second sampling offered to homeowners with wells that had a detectable nitrate result. The second sampling collected by the Minnesota Department of Agriculture will be discussed further in a follow-up report in 2016.
INTRODUCTION
The Minnesota Department of Agriculture (MDA) has recently updated the 1990 Nitrogen Fertilizer Management Plan (NFMP), which is the state’s blueprint for prevention or minimization of the impacts of nitrogen fertilizer on groundwater. To effectively manage nitrate contamination of water resources, it is appropriate to focus on areas of greatest risk. Testing for nitrate in private wells is one method for identifying areas and wells at greatest risk. For this, the MDA has developed the “Township Testing Program”. In the Township Testing Program (TTP), the MDA works with local partners (counties and SWCDs) to collect and analyze water samples from private drinking water wells within townships that either had high nitrate results previously or exist in an area with high aquifer vulnerability and a high percentage of row crop production.
This testing conducted in Stearns County is part of a statewide assessment as the MDA plans to offer nitrate tests to approximately 70,000 private well owners (within 250-350 townships) between 2014 and 2019. As of spring 2015, 60 townships in eight counties have been completed.
For further information on this program, please visit the project webpage at: http://www.mda.state.mn.us/protecting/cleanwaterfund/gwdwprotection/townshiptesting.aspx
In many rural areas of the state, nitrate is one of the most common contaminants in Minnesota's groundwater. In some areas of the state a significant number of wells have high nitrate levels.
Nitrate is a naturally occurring, water soluble molecule that is made up of nitrogen and oxygen. Although nitrate occurs naturally, it can also originate from man-made sources such as fertilizer, animal manure, and human waste. Nitrate is a concern because it can have a negative effect on human health at elevated levels. The U.S. Environmental Protection Agency (USEPA) has established a drinking water Maximum Contaminant Level (MCL) of 10 mg/L for nitrate as nitrogen (nitrate-N) (U.S. EPA, 2009) in municipal water systems. The Minnesota Department of Health (MDH) has also established a Health Risk Limit (HRL) of 10 mg/L nitrate-N for private drinking water wells in Minnesota.
Nitrogen present in groundwater can be found in the forms of nitrite and nitrate. Nitrite concentration is commonly less than the reporting level of 0.01 mg/L, resulting in negligible contribution to the nitrate plus nitrite concentration (Nolan and Stoner, 2000). In the environment, nitrite generally converts to nitrate quickly, which means nitrite occurs very rarely in groundwater. Analytical methods generally combine nitrate plus nitrate together. Measurements of nitrate plus nitrite as nitrogen and measurements of nitrate as nitrogen will hereafter be referred to as “nitrate”.
NITRATE FATE AND TRANSPORT
Nitrate is considered a conservative anion and is highly mobile in many shallow coarse- textured groundwater systems. Once in groundwater, nitrate is often very stable and can move large distances from its source. However, in some settings nitrate in groundwater may be converted to nitrogen gas in the absence of oxygen and the presence of organic carbon, through a natural process called denitrification. Denitrification occurs when oxygen levels are depleted and nitrate becomes the primary oxygen source for microorganisms. Shallow groundwater in coarse-textured soils (glacial outwash) generally has low concentrations of organic carbon and is well oxygenated, so denitrification is often limited in these conditions. As a result areas like Stearns County with extensive glacial outwash aquifers and intensive row crop agriculture are particularly vulnerable to elevated nitrate concentrations. However, geochemical conditions can be highly variable within an aquifer or region and can also change over-time (MPCA, 1998).
2014 Summary Stearns County Township Sampling | 6
GEOLOGY AND HYDROGEOLOGY
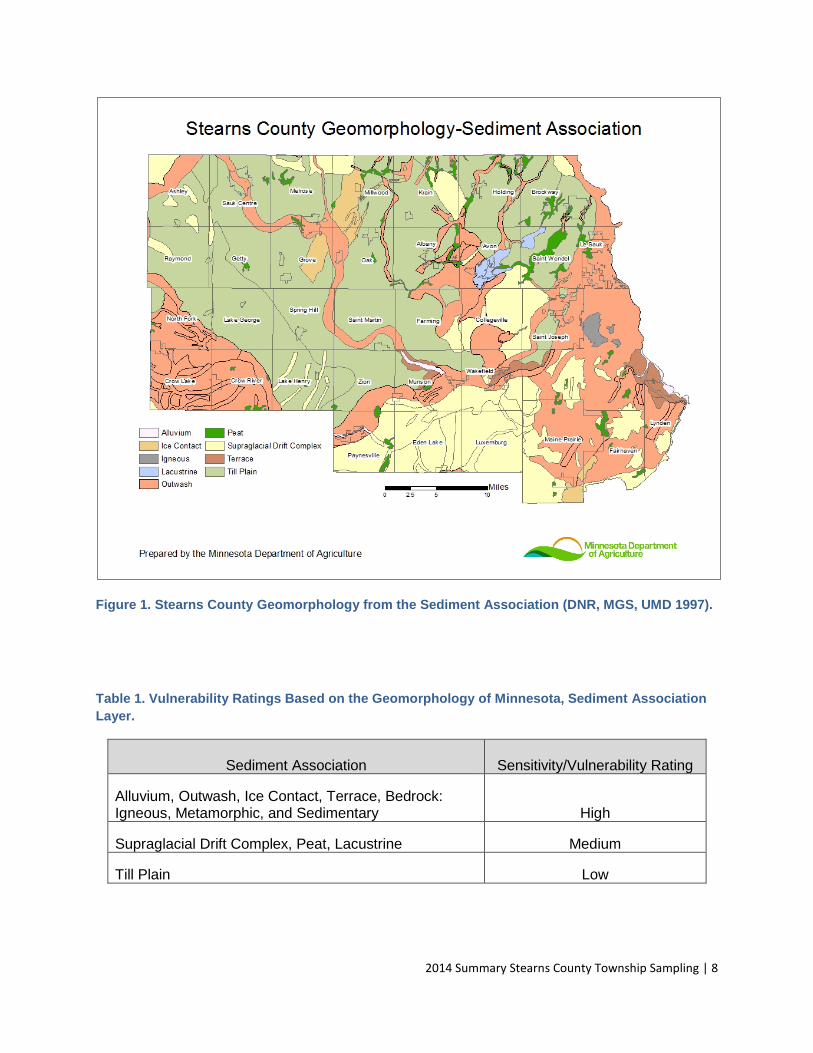
The geology in Stearns County is heavily influenced by glacial till and outwash plains. Glacial outwash is relatively coarse-textured compared to other glacial deposits such as till and drift deposits. Outwash consists primarily of sand and gravel deposited by running water that flowed from melting ice during the last glacial period. This region’s deposits are associated with the Des Moines Lobe and the Superior Lobe glacial ice advances. The outwash sand and gravel is typically deposited in a stratified (layered) fashion as the glacial melt conditions change. The coarse-textured deposits associated with glacial outwash often allow contaminants from the surface to travel rapidly to the water table aquifers. Statewide geomorphological mapping conducted by the Minnesota Department of Natural Resources (MDNR), the Minnesota Geological Survey (MGS) and the University of Minnesota at Duluth (MDNR, MGS and UMD, 1997) indicates the extent of glacial deposits in Stearns County as presented in Figure 1.
Only one third of Stearns County is underlain by water table aquifers. These aquifers can be found in the Brooten-Belgrade area (southwest corner) or meandering along the Sauk and Mississippi Rivers. The majority the county is underlain by Quaternary confined aquifers that are generally more than ten feet thick (MNDNR, 1998).
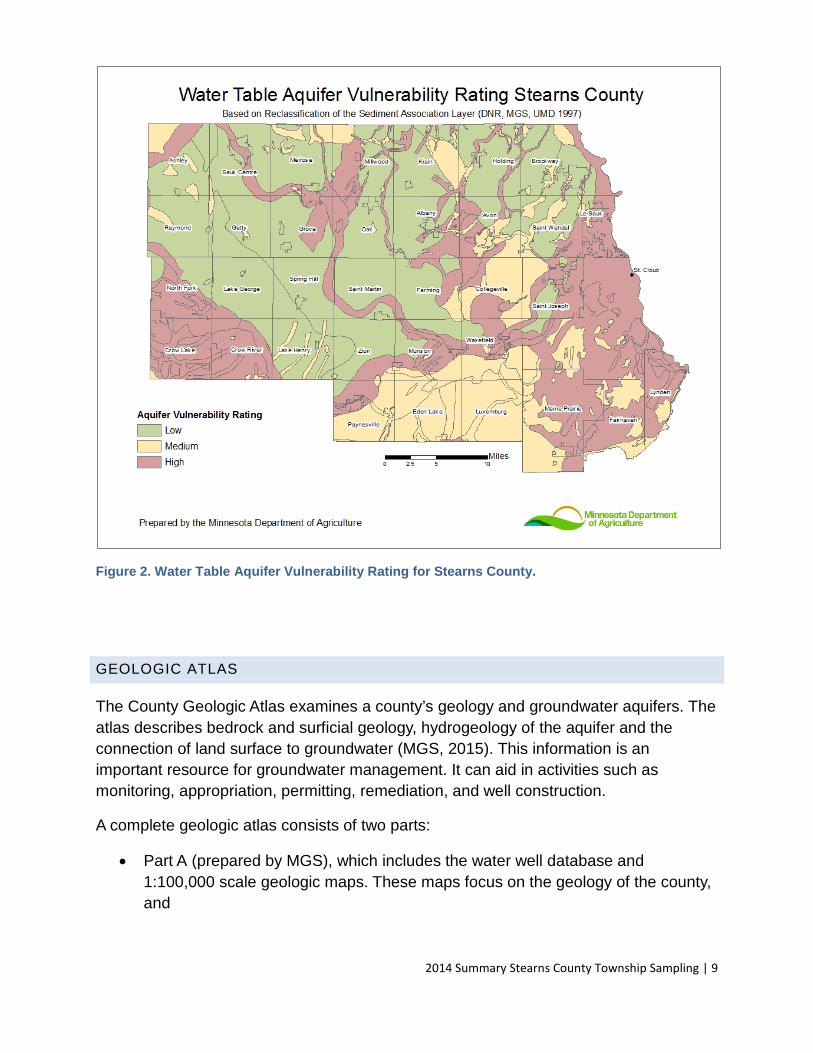
The same geologic mapping project presented in Figure 1 was used to classify the state into aquifer sensitivity ratings. Sensitivity ratings are described in Table 1. There are three ratings for aquifer sensitivity: low, medium and high (Figure 2). The ratings are based upon guidance from the Geologic Sensitivity Project Workgroup’s report “Criteria and Guidelines for Assessing Geologic Sensitivity in Ground Water Resources in Minnesota” (MDNR, 1991).
2014 Summary Stearns County Township Sampling | 7
Figure 1. Stearns County Geomorphology from the Sediment Association (DNR, MGS, UMD 1997).
Table 1. Vulnerability Ratings Based on the Geomorphology of Minnesota, Sediment Association Layer.
Sediment Association Sensitivity/Vulnerability Rating
Alluvium, Outwash, Ice Contact, Terrace, Bedrock: Igneous, Metamorphic, and Sedimentary High
Supraglacial Drift Complex, Peat, Lacustrine Medium
Till Plain Low
2014 Summary Stearns County Township Sampling | 8
Figure 2. Water Table Aquifer Vulnerability Rating for Stearns County.
GEOLOGIC ATLAS
The County Geologic Atlas examines a county’s geology and groundwater aquifers. The atlas describes bedrock and surficial geology, hydrogeology of the aquifer and the connection of land surface to groundwater (MGS, 2015). This information is an important resource for groundwater management. It can aid in activities such as monitoring, appropriation, permitting, remediation, and well construction.
A complete geologic atlas consists of two parts:
• Part A (prepared by MGS), which includes the water well database and 1:100,000 scale geologic maps. These maps focus on the geology of the county, and
2014 Summary Stearns County Township Sampling | 9
• Part B (developed by the Minnesota Department of Natural ResourcesDivision of Waters) which includes maps of water levels in aquifers, direction of groundwater flow, water chemistry, and sensitivity to pollution.
According to the Stearns County Geologic Atlas more than half of the wells are completed in confined aquifers and the remaining wells are completed in surficial sand and gravel aquifers. Groundwater in surficial aquifers is very susceptible to nitrate contamination (Meyer, 1995).
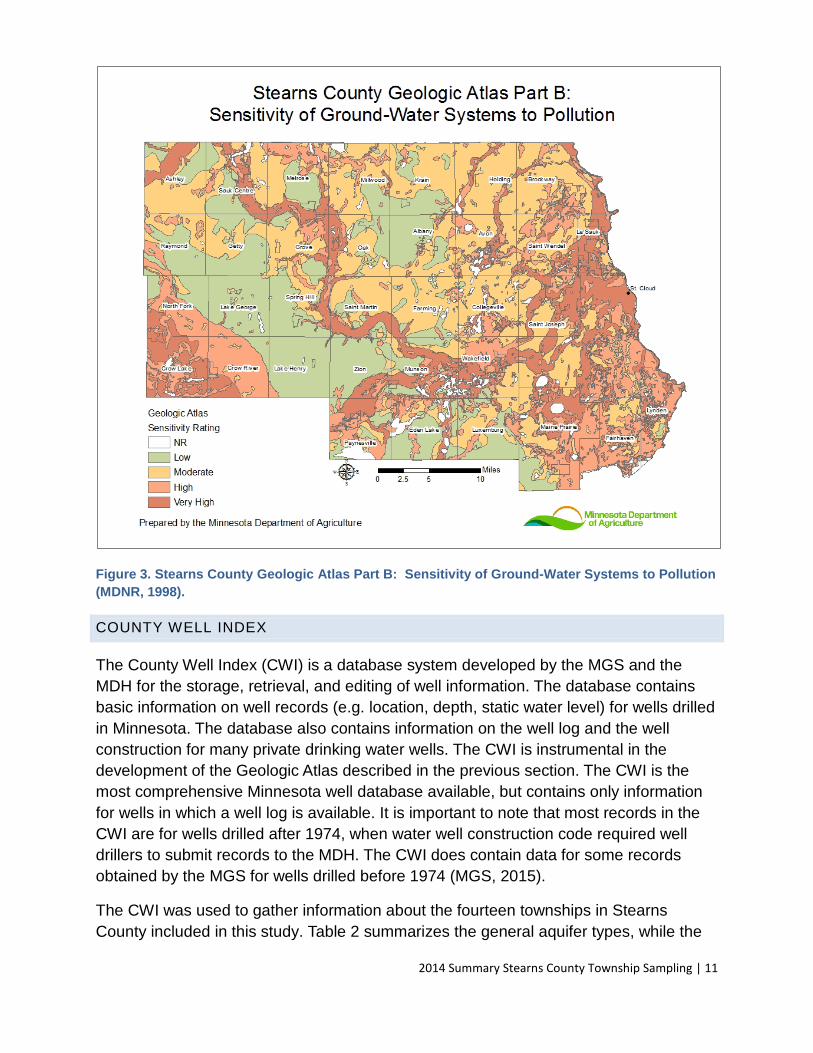
An important analysis provided by Part B of the Atlas is called the “Sensitivity of Ground-Water Systems to Pollution” (MDNR, 1998). This rating is based on the time for water to travel from the land surface to a depth of ten feet (Figure 3). The water table aquifer vulnerability map (Figure 2) is somewhat similar to the Part B map when comparing at a one-dimensional level, however, the Part B map has a higher level of detail.
2014 Summary Stearns County Township Sampling | 10
Figure 3. Stearns County Geologic Atlas Part B: Sensitivity of Ground-Water Systems to Pollution (MDNR, 1998).
COUNTY WELL INDEX
The County Well Index (CWI) is a database system developed by the MGS and the MDH for the storage, retrieval, and editing of well information. The database contains basic information on well records (e.g. location, depth, static water level) for wells drilled in Minnesota. The database also contains information on the well log and the well construction for many private drinking water wells. The CWI is instrumental in the development of the Geologic Atlas described in the previous section. The CWI is the most comprehensive Minnesota well database available, but contains only information for wells in which a well log is available. It is important to note that most records in the CWI are for wells drilled after 1974, when water well construction code required well drillers to submit records to the MDH. The CWI does contain data for some records obtained by the MGS for wells drilled before 1974 (MGS, 2015).
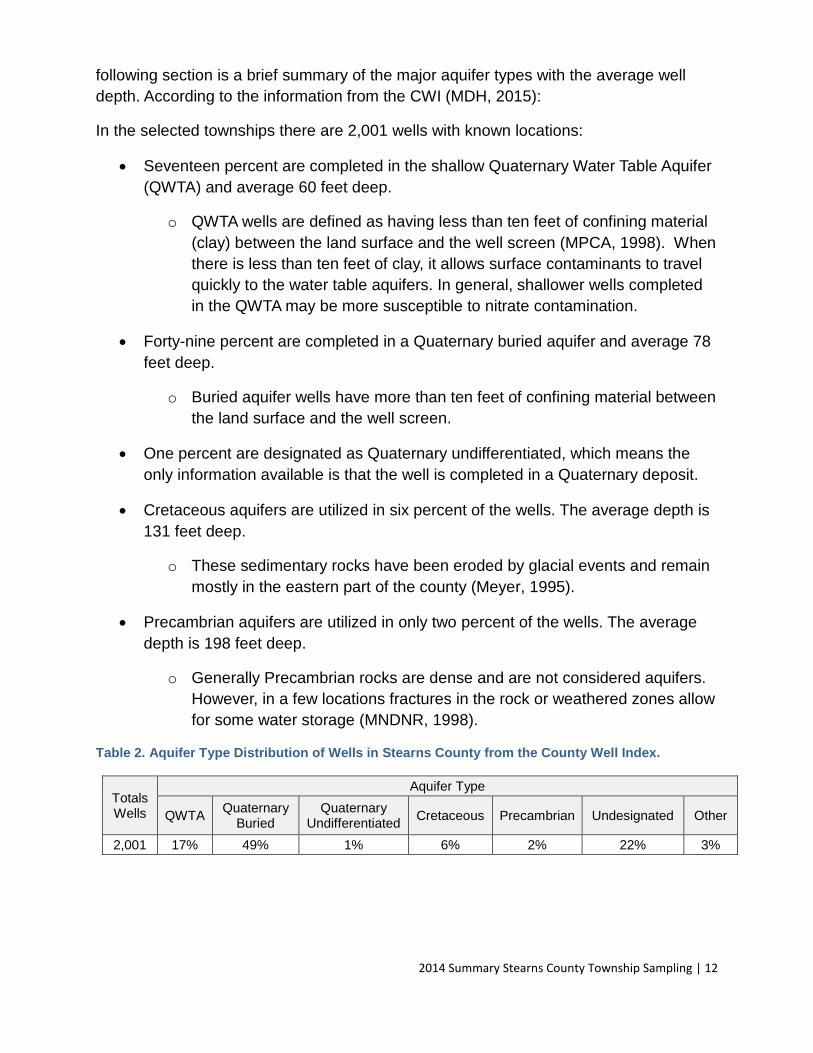
The CWI was used to gather information about the fourteen townships in Stearns County included in this study. Table 2 summarizes the general aquifer types, while the
2014 Summary Stearns County Township Sampling | 11
following section is a brief summary of the major aquifer types with the average well depth. According to the information from the CWI (MDH, 2015):
In the selected townships there are 2,001 wells with known locations:
• Seventeen percent are completed in the shallow Quaternary Water Table Aquifer (QWTA) and average 60 feet deep.
o QWTA wells are defined as having less than ten feet of confining material (clay) between the land surface and the well screen (MPCA, 1998). When there is less than ten feet of clay, it allows surface contaminants to travel quickly to the water table aquifers. In general, shallower wells completed in the QWTA may be more susceptible to nitrate contamination.
• Forty-nine percent are completed in a Quaternary buried aquifer and average 78 feet deep.
o Buried aquifer wells have more than ten feet of confining material between the land surface and the well screen.
• One percent are designated as Quaternary undifferentiated, which means the only information available is that the well is completed in a Quaternary deposit.
• Cretaceous aquifers are utilized in six percent of the wells. The average depth is 131 feet deep.
o These sedimentary rocks have been eroded by glacial events and remain mostly in the eastern part of the county (Meyer, 1995).
• Precambrian aquifers are utilized in only two percent of the wells. The average depth is 198 feet deep.
o Generally Precambrian rocks are dense and are not considered aquifers. However, in a few locations fractures in the rock or weathered zones allow for some water storage (MNDNR, 1998).
Table 2. Aquifer Type Distribution of Wells in Stearns County from the County Well Index.
Totals Wells
Aquifer Type
QWTA Quaternary Buried
Quaternary Undifferentiated Cretaceous Precambrian Undesignated Other
2,001 17% 49% 1% 6% 2% 22% 3%
2014 Summary Stearns County Township Sampling | 12
NITRATE PROBABILITY MAPPING
In many areas nitrate probability maps have been developed by the MDH to assist in local water quality planning efforts. These maps identify areas of a county with relatively high, moderate, and low probability of having elevated nitrate concentrations in ground water. The goal of nitrate probability mapping is to help protect public and private drinking water supplies, help prevent further contamination by raising awareness and assist in local planning and prevention. The nitrate probability map is similar in appearance compared to the updated aquifer vulnerability map; however it shows less area categorized in the high rating. Stearns County’s report was published in 2002 and can be accessed here: http://www.health.state.mn.us/divs/eh/water/swp/nitrate/reports/2002method/stearns.pdf
MDA PRIVATE WELL MONITORING
The MDA has two primary approaches to monitoring for nitrate in private drinking water wells. The first approach is to use a statistically designed private well regional network that incorporates more than one county into a region. The Central Sands Private Well Network is considered a regional network; it includes a fourteen county area in the central area of Minnesota. Results are considered to reflect levels of nitrate contamination across the region. The second approach is monitoring on a township level; the Township Testing Program. The two approaches are discussed separately below.
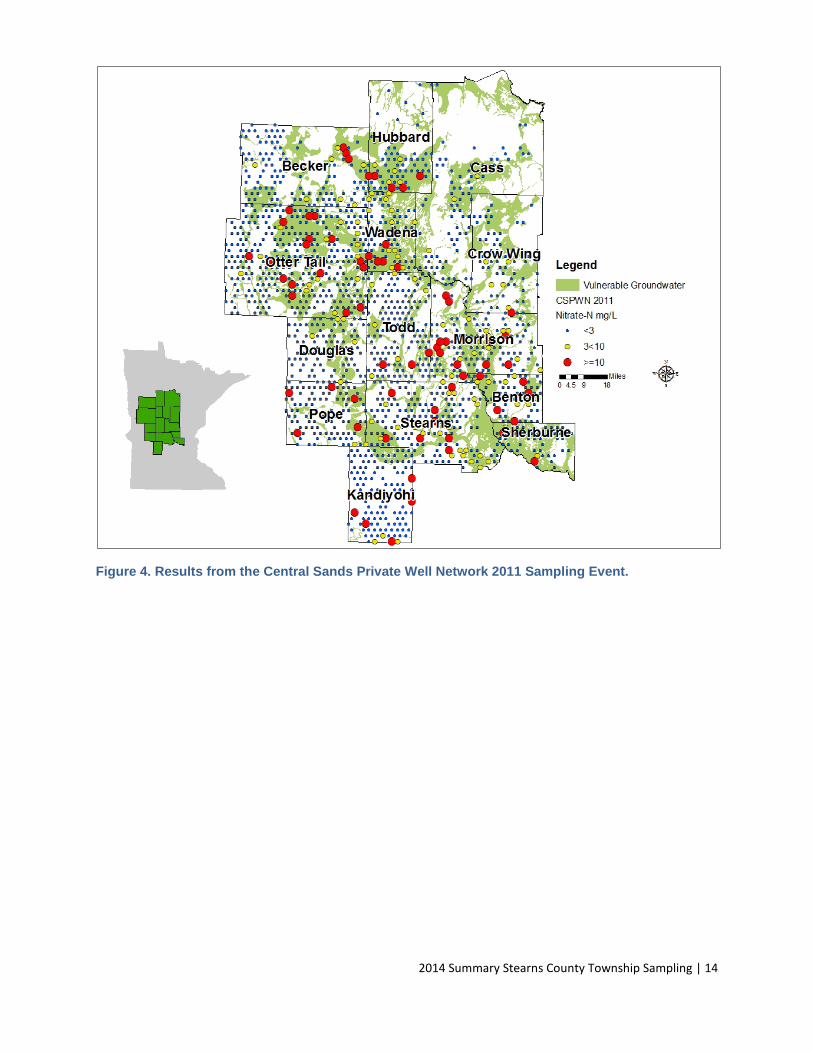
CENTRAL SANDS PRIVATE WELL NETWORK RESULTS
In the spring of 2011, a total of 1,555 private drinking water wells were sampled for nitrate concentrations (Figure 4 and Table 3). Homeowners from 14 counties were systematically selected to participate in this project and had their private well water tested for free. Overall, results from the fourteen counties combined showed that 88 percent of the 1,555 wells had nitrate-N concentrations less than 3 mg/L, seven percent ranged from 3-9.9 mg/L and five percent of wells had concentrations greater than 10 mg/L (MDA, 2012).
For more information about the Central Sands Private Well Network, please visit: http://www.mda.state.mn.us/protecting/cleanwaterfund/gwdwprotection/characterizingnitrates.aspx.
2014 Summary Stearns County Township Sampling | 13
Figure 4. Results from the Central Sands Private Well Network 2011 Sampling Event.
2014 Summary Stearns County Township Sampling | 14
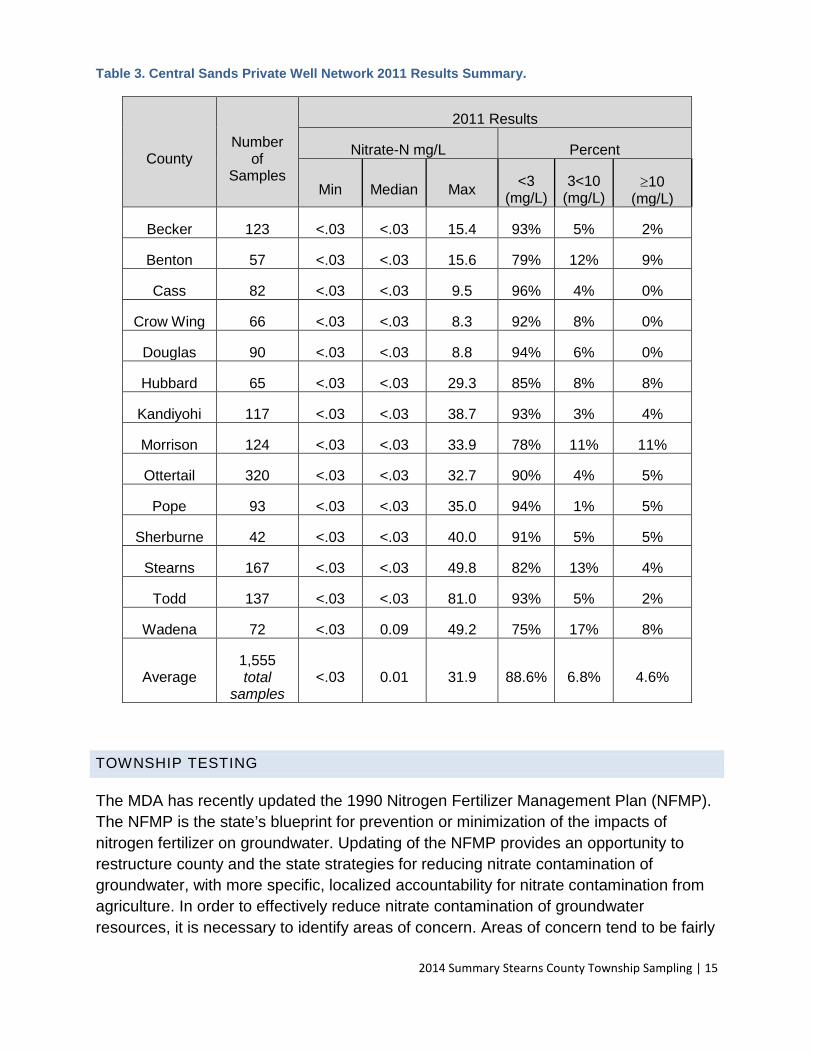
Table 3. Central Sands Private Well Network 2011 Results Summary.
County Number
of Samples
2011 Results
Nitrate-N mg/L Percent
Min Median Max <3 (mg/L)
3<10 (mg/L)
≥10 (mg/L)
Becker 123 <.03 <.03 15.4 93% 5% 2%
Benton 57 <.03 <.03 15.6 79% 12% 9%
Cass 82 <.03 <.03 9.5 96% 4% 0%
Crow Wing 66 <.03 <.03 8.3 92% 8% 0%
Douglas 90 <.03 <.03 8.8 94% 6% 0%
Hubbard 65 <.03 <.03 29.3 85% 8% 8%
Kandiyohi 117 <.03 <.03 38.7 93% 3% 4%
Morrison 124 <.03 <.03 33.9 78% 11% 11%
Ottertail 320 <.03 <.03 32.7 90% 4% 5%
Pope 93 <.03 <.03 35.0 94% 1% 5%
Sherburne 42 <.03 <.03 40.0 91% 5% 5%
Stearns 167 <.03 <.03 49.8 82% 13% 4%
Todd 137 <.03 <.03 81.0 93% 5% 2%
Wadena 72 <.03 0.09 49.2 75% 17% 8%
Average 1,555 total
samples <.03 0.01 31.9 88.6% 6.8% 4.6%
TOWNSHIP TESTING
The MDA has recently updated the 1990 Nitrogen Fertilizer Management Plan (NFMP). The NFMP is the state’s blueprint for prevention or minimization of the impacts of nitrogen fertilizer on groundwater. Updating of the NFMP provides an opportunity to restructure county and the state strategies for reducing nitrate contamination of groundwater, with more specific, localized accountability for nitrate contamination from agriculture. In order to effectively reduce nitrate contamination of groundwater resources, it is necessary to identify areas of concern. Areas of concern tend to be fairly
2014 Summary Stearns County Township Sampling | 15
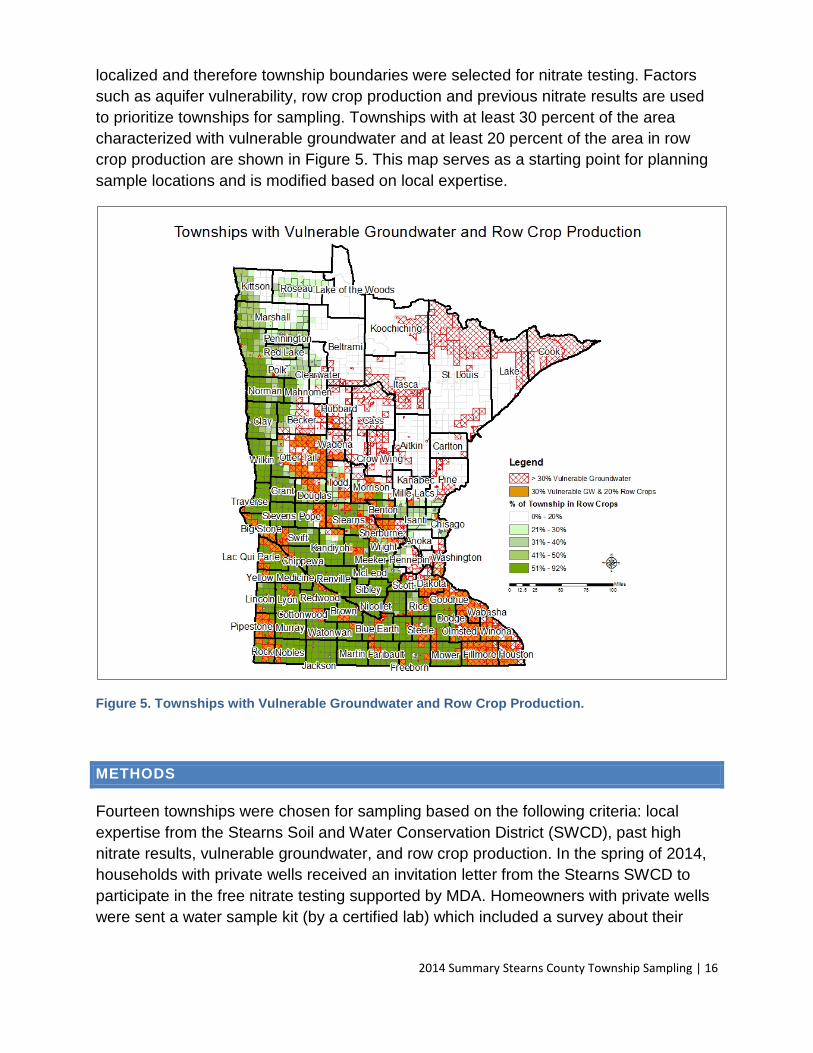
localized and therefore township boundaries were selected for nitrate testing. Factors such as aquifer vulnerability, row crop production and previous nitrate results are used to prioritize townships for sampling. Townships with at least 30 percent of the area characterized with vulnerable groundwater and at least 20 percent of the area in row crop production are shown in Figure 5. This map serves as a starting point for planning sample locations and is modified based on local expertise.
Figure 5. Townships with Vulnerable Groundwater and Row Crop Production.
METHODS
Fourteen townships were chosen for sampling based on the following criteria: local expertise from the Stearns Soil and Water Conservation District (SWCD), past high nitrate results, vulnerable groundwater, and row crop production. In the spring of 2014, households with private wells received an invitation letter from the Stearns SWCD to participate in the free nitrate testing supported by MDA. Homeowners with private wells were sent a water sample kit (by a certified lab) which included a survey about their
2014 Summary Stearns County Township Sampling | 16
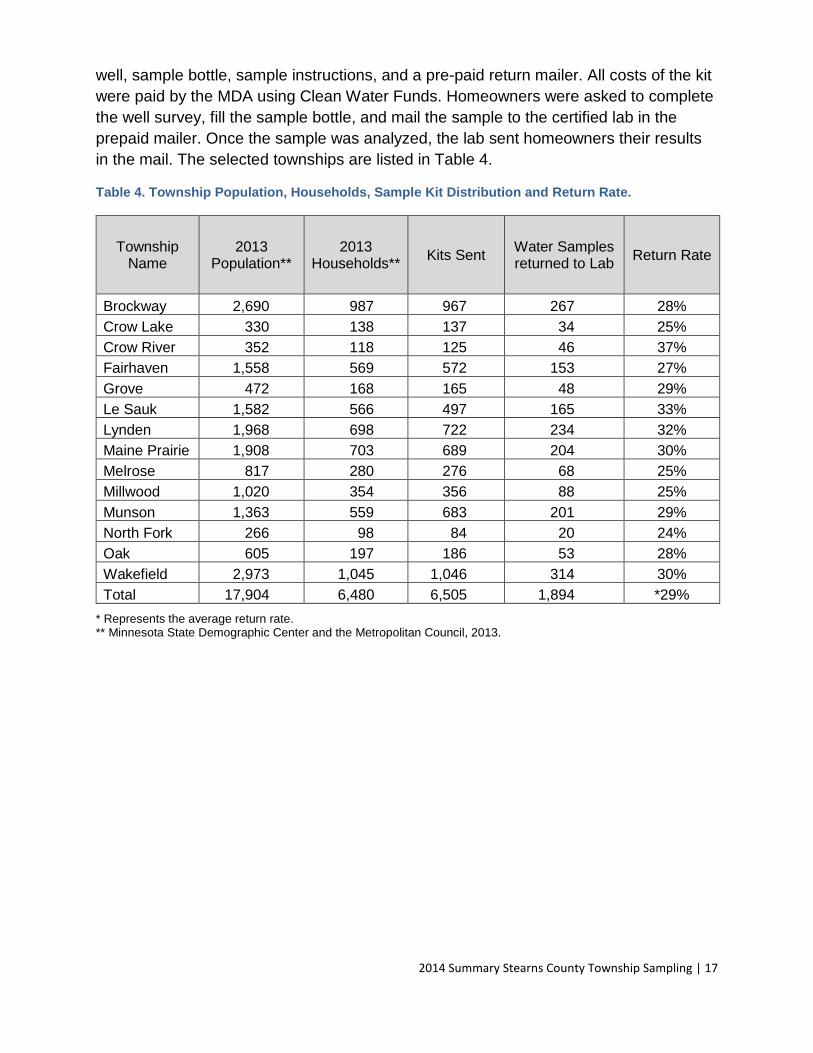
well, sample bottle, sample instructions, and a pre-paid return mailer. All costs of the kit were paid by the MDA using Clean Water Funds. Homeowners were asked to complete the well survey, fill the sample bottle, and mail the sample to the certified lab in the prepaid mailer. Once the sample was analyzed, the lab sent homeowners their results in the mail. The selected townships are listed in Table 4.
Table 4. Township Population, Households, Sample Kit Distribution and Return Rate.
* Represents the average return rate. ** Minnesota State Demographic Center and the Metropolitan Council, 2013.
2014 Summary Stearns County Township Sampling | 17
RESULTS
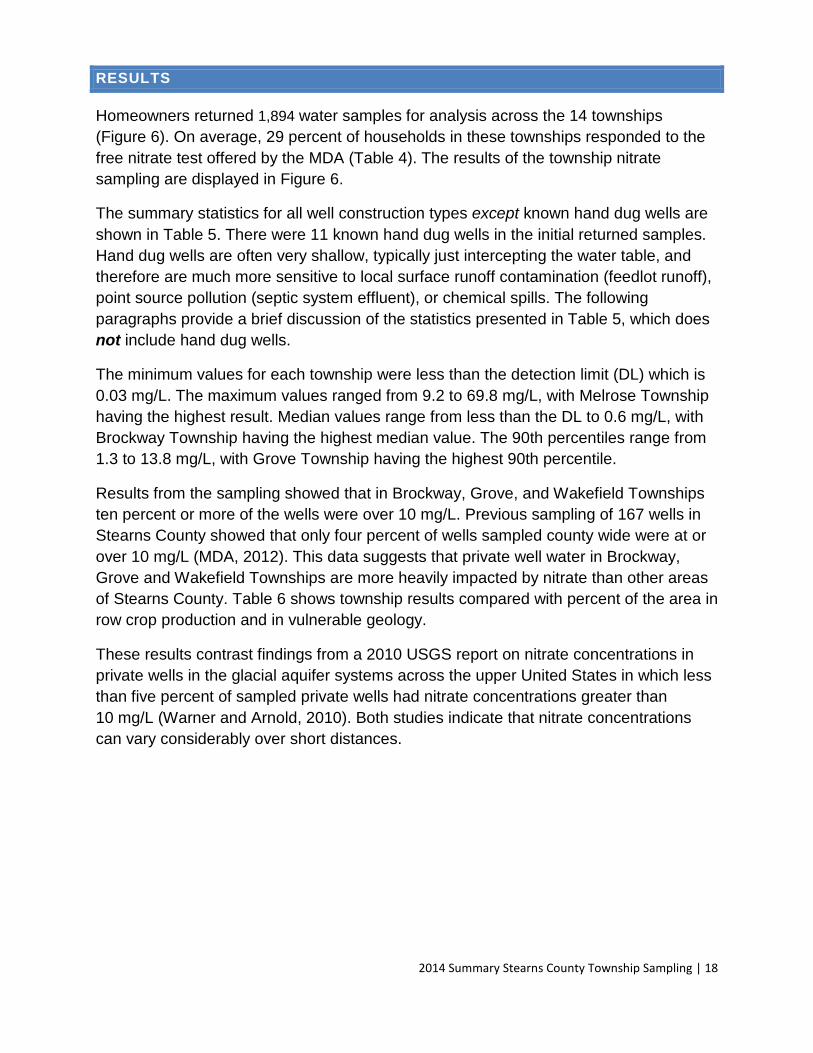
Homeowners returned 1,894 water samples for analysis across the 14 townships (Figure 6). On average, 29 percent of households in these townships responded to the free nitrate test offered by the MDA (Table 4). The results of the township nitrate sampling are displayed in Figure 6.
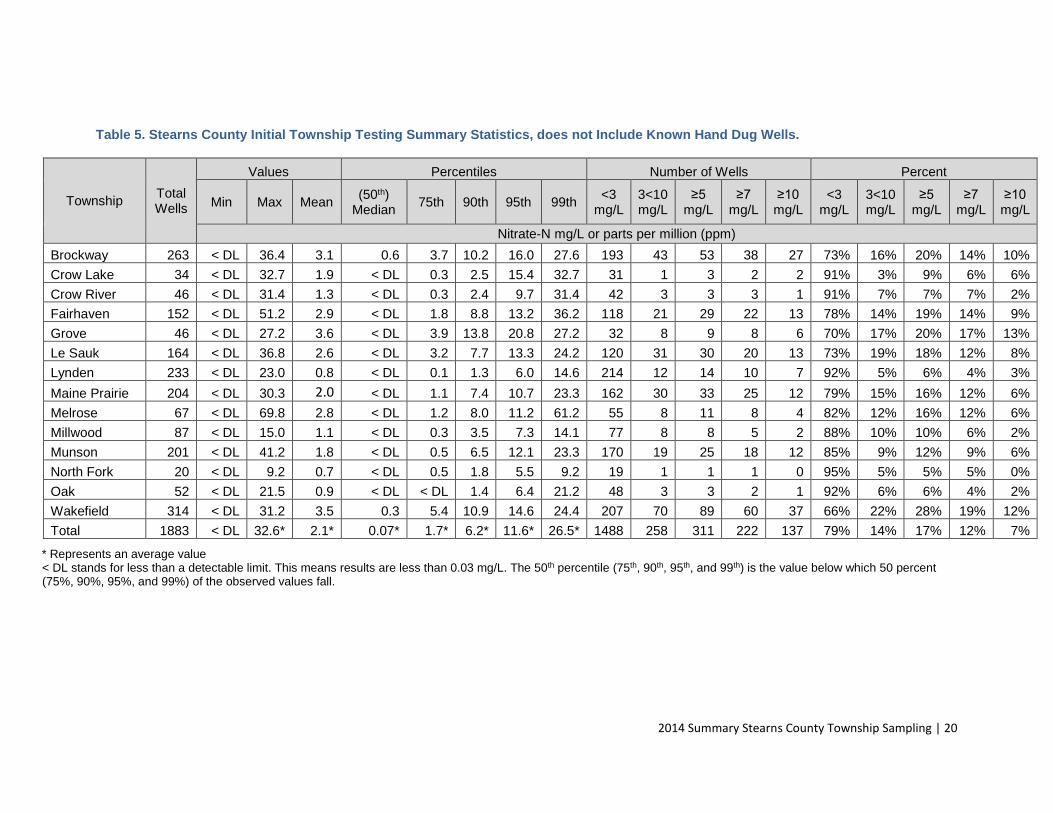
The summary statistics for all well construction types except known hand dug wells are shown in Table 5. There were 11 known hand dug wells in the initial returned samples. Hand dug wells are often very shallow, typically just intercepting the water table, and therefore are much more sensitive to local surface runoff contamination (feedlot runoff), point source pollution (septic system effluent), or chemical spills. The following paragraphs provide a brief discussion of the statistics presented in Table 5, which does not include hand dug wells.
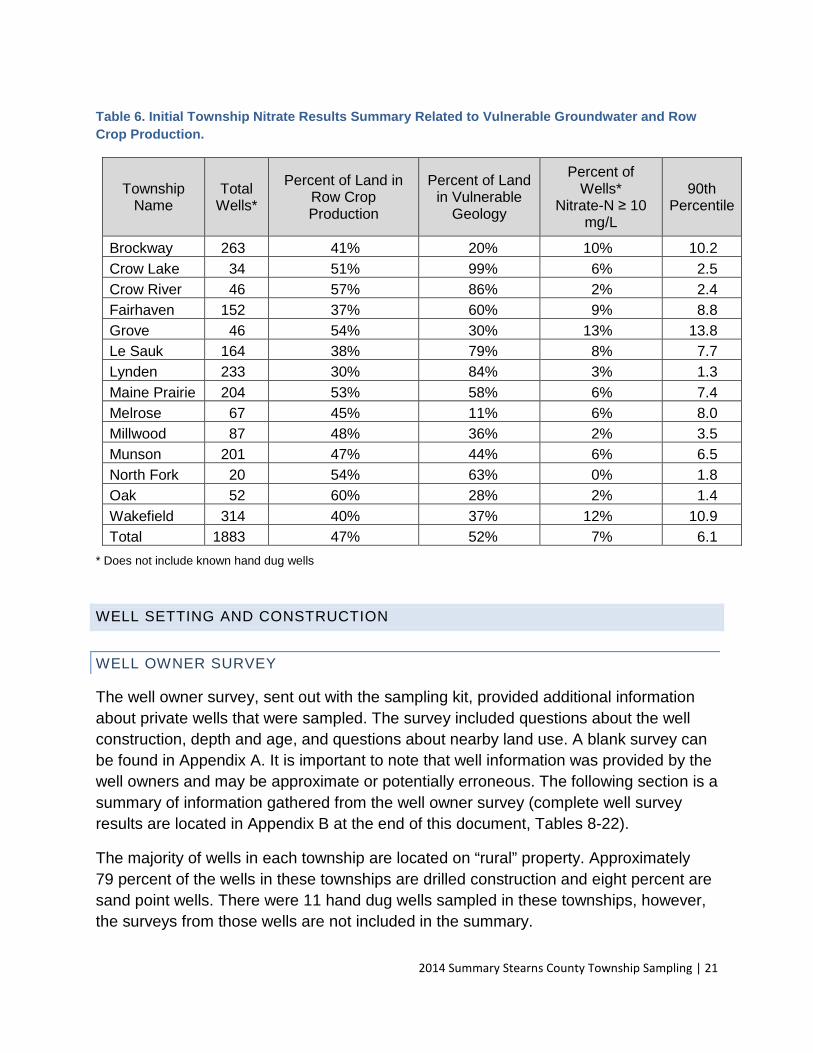
The minimum values for each township were less than the detection limit (DL) which is 0.03 mg/L. The maximum values ranged from 9.2 to 69.8 mg/L, with Melrose Township having the highest result. Median values range from less than the DL to 0.6 mg/L, with Brockway Township having the highest median value. The 90th percentiles range from 1.3 to 13.8 mg/L, with Grove Township having the highest 90th percentile.
Results from the sampling showed that in Brockway, Grove, and Wakefield Townships ten percent or more of the wells were over 10 mg/L. Previous sampling of 167 wells in Stearns County showed that only four percent of wells sampled county wide were at or over 10 mg/L (MDA, 2012). This data suggests that private well water in Brockway, Grove and Wakefield Townships are more heavily impacted by nitrate than other areas of Stearns County. Table 6 shows township results compared with percent of the area in row crop production and in vulnerable geology.
These results contrast findings from a 2010 USGS report on nitrate concentrations in private wells in the glacial aquifer systems across the upper United States in which less than five percent of sampled private wells had nitrate concentrations greater than 10 mg/L (Warner and Arnold, 2010). Both studies indicate that nitrate concentrations can vary considerably over short distances.
2014 Summary Stearns County Township Sampling | 18
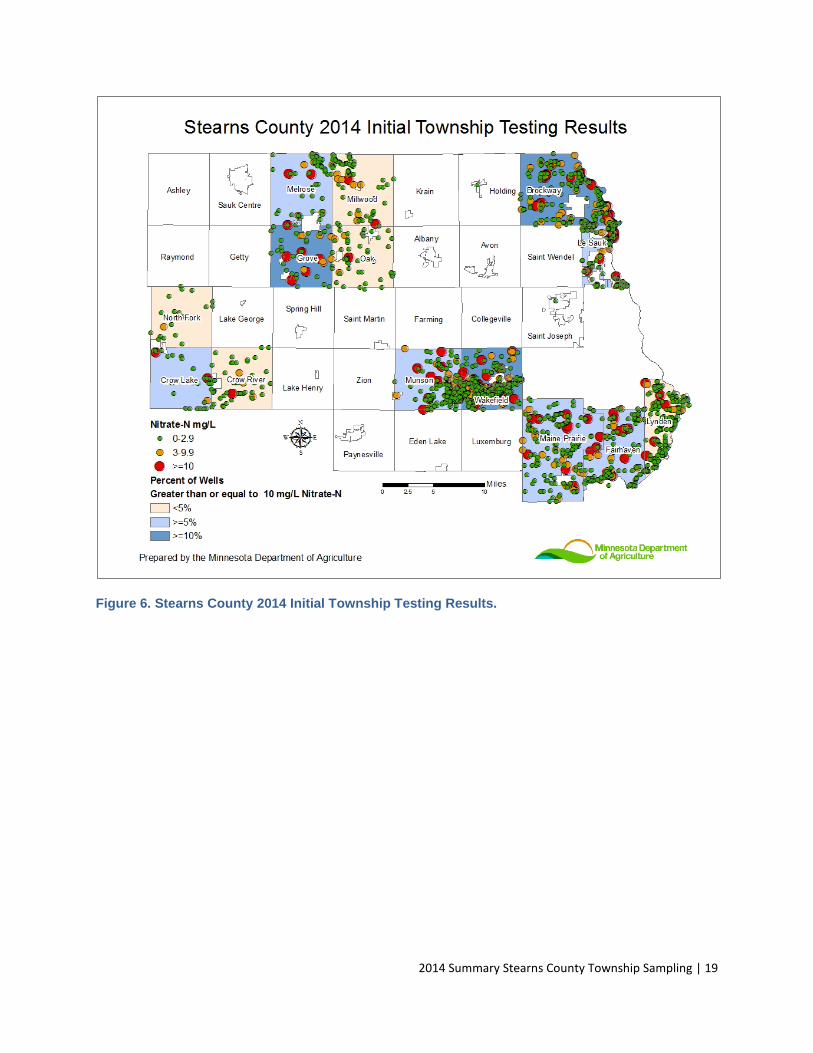
Figure 6. Stearns County 2014 Initial Township Testing Results.
2014 Summary Stearns County Township Sampling | 19
Table 5. Stearns County Initial Township Testing Summary Statistics, does not Include Known Hand Dug Wells.
* Represents an average value < DL stands for less than a detectable limit. This means results are less than 0.03 mg/L. The 50th percentile (75th, 90th, 95th, and 99th) is the value below which 50 percent (75%, 90%, 95%, and 99%) of the observed values fall.
2014 Summary Stearns County Township Sampling | 20
Table 6. Initial Township Nitrate Results Summary Related to Vulnerable Groundwater and Row Crop Production.
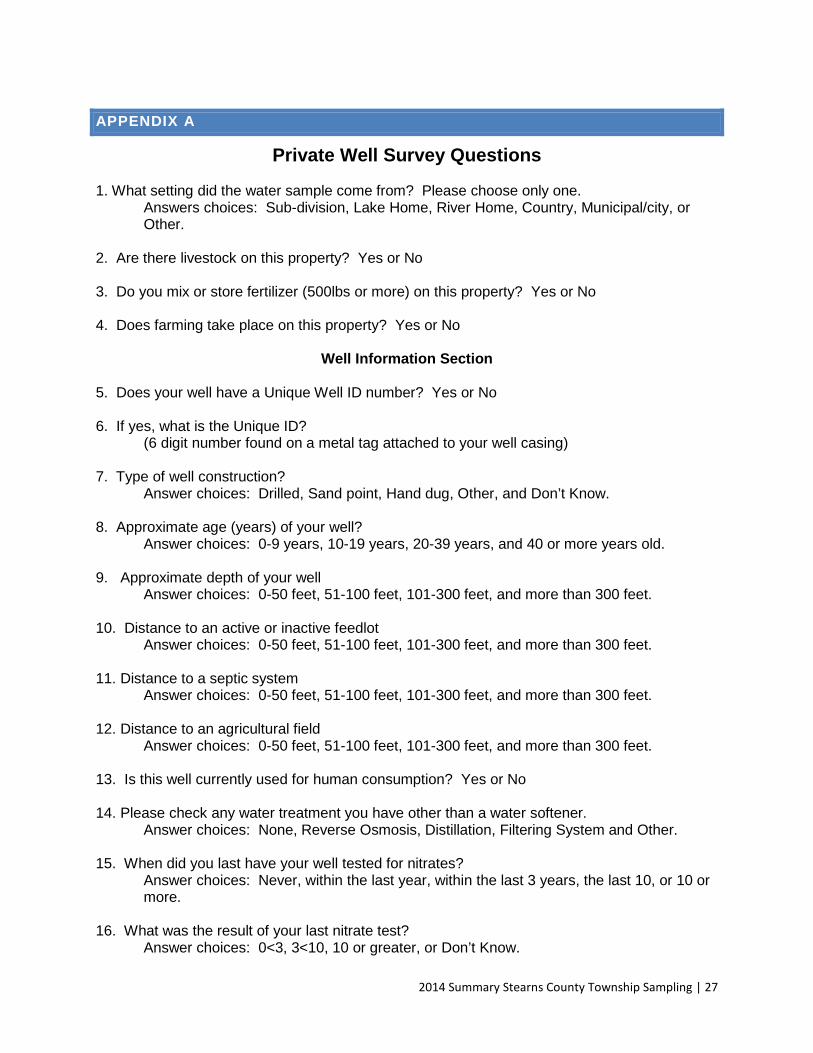
The well owner survey, sent out with the sampling kit, provided additional information about private wells that were sampled. The survey included questions about the well construction, depth and age, and questions about nearby land use. A blank survey can be found in Appendix A. It is important to note that well information was provided by the well owners and may be approximate or potentially erroneous. The following section is a summary of information gathered from the well owner survey (complete well survey results are located in Appendix B at the end of this document, Tables 8-22).
The majority of wells in each township are located on “rural” property. Approximately 79 percent of the wells in these townships are drilled construction and eight percent are sand point wells. There were 11 hand dug wells sampled in these townships, however, the surveys from those wells are not included in the summary.
2014 Summary Stearns County Township Sampling | 21
Sand point (drive-point) wells are typically completed at shallower depths than drilled wells. Whether a steel or plastic casing is installed, the well code requires that it be watertight and extend at least 15 feet below the ground surface. Sand point wells are also usually installed in areas where sand is the dominant geologic material and where there are no thick confining units such as clay. A confining layer can create a physical barrier to vertical nitrate movement from the water table to deeper portions of the aquifer. These factors make sand point wells more vulnerable to contamination from the surface.
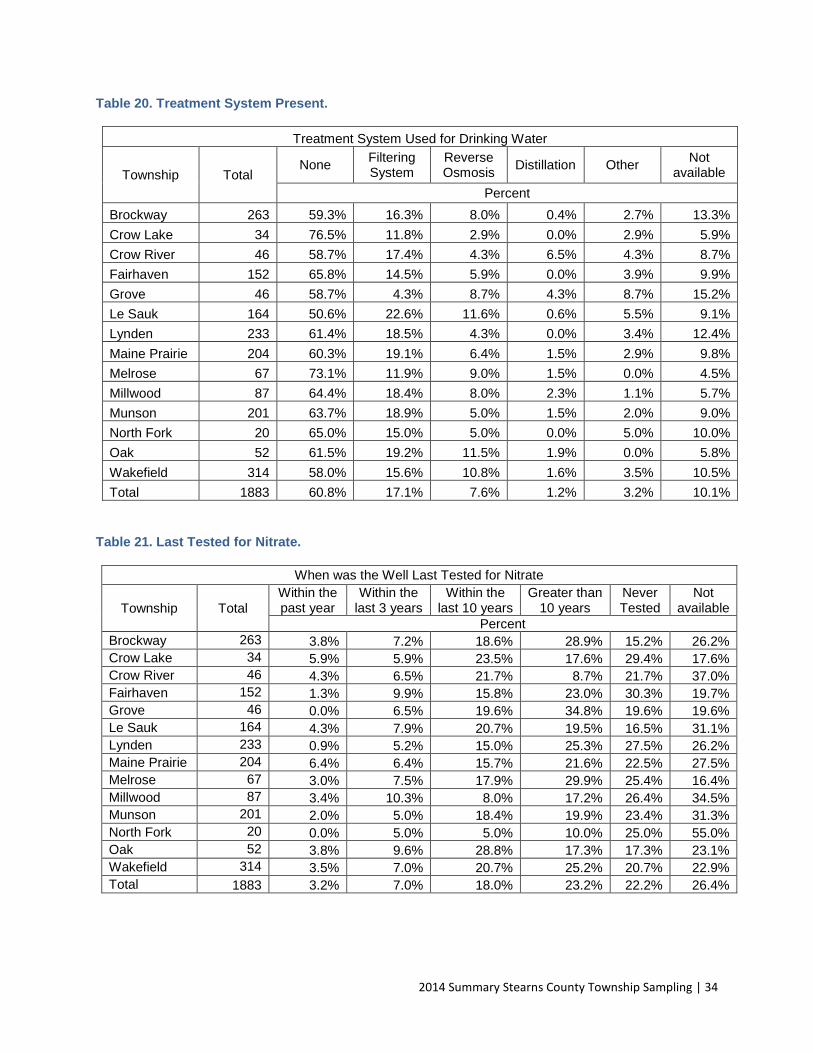
Most wells in these townships are less than 100 feet deep, with the majority of wells between 51 and 100 feet below ground surface. Most of the wells had not been tested for nitrate within the last ten years or homeowners were unsure if they had been tested. Therefore, the results most homeowners receive from this study will provide new information.
POTENTIAL NITRATE SOURCE DISTANCES
The following response summary relates to isolation distances of potential point sources of nitrate that may contaminate wells. This information was obtained from the well surveys completed by the homeowner (complete well survey results are located in Appendix B at the end of this document, Tables 8-22).
• Overall only eight percent of the well owners responded that they have livestock (greater than ten head of cattle or other equivalent) on their property.
• Few well owners (one percent) across all townships store more than 500 pounds of fertilizer on their property.
• Most wells (76 percent) are greater than 300 feet from an active or inactive feedlot.
• The majority of wells are more than 50 feet away from septic systems (89 percent).
• Farming takes place on 19 percent of the properties.
• Agricultural fields are greater than 300 feet from wells at 61 percent of the properties.
2014 Summary Stearns County Township Sampling | 22
WELL LOGS
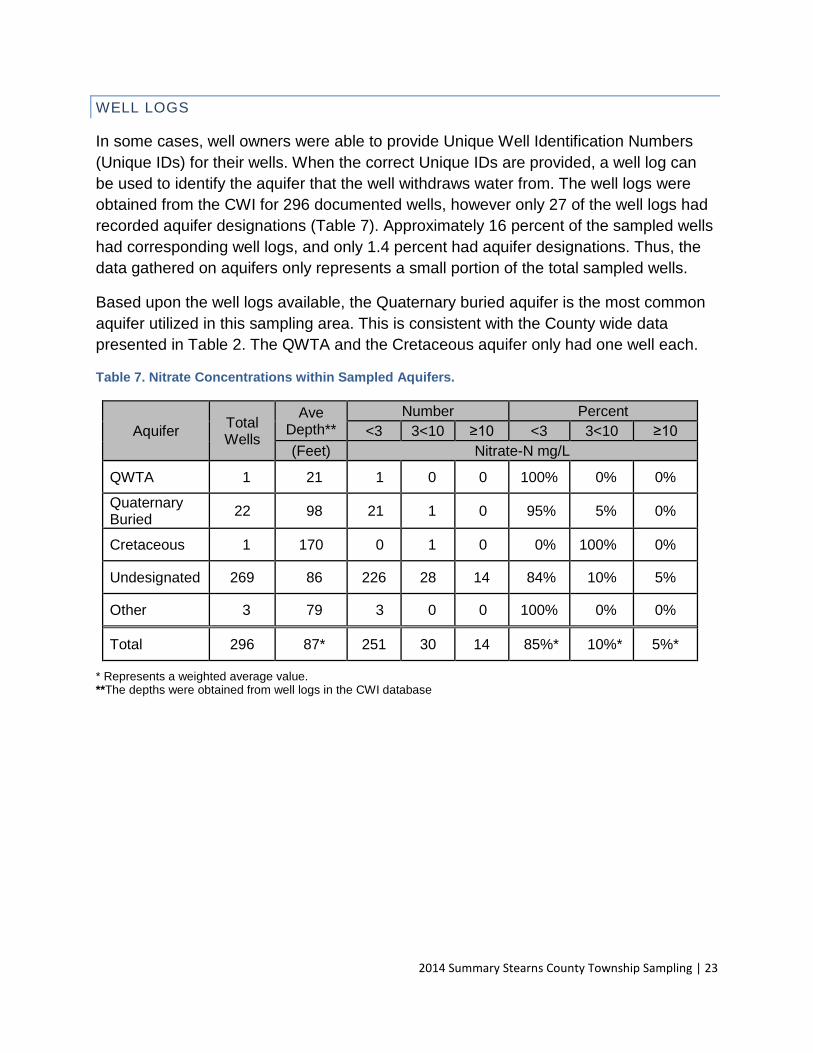
In some cases, well owners were able to provide Unique Well Identification Numbers (Unique IDs) for their wells. When the correct Unique IDs are provided, a well log can be used to identify the aquifer that the well withdraws water from. The well logs were obtained from the CWI for 296 documented wells, however only 27 of the well logs had recorded aquifer designations (Table 7). Approximately 16 percent of the sampled wells had corresponding well logs, and only 1.4 percent had aquifer designations. Thus, the data gathered on aquifers only represents a small portion of the total sampled wells.
Based upon the well logs available, the Quaternary buried aquifer is the most common aquifer utilized in this sampling area. This is consistent with the County wide data presented in Table 2. The QWTA and the Cretaceous aquifer only had one well each.
Table 7. Nitrate Concentrations within Sampled Aquifers.
Aquifer Total Wells
Ave Depth**
Number Percent <3 3<10 ≥10 <3 3<10 ≥10
(Feet) Nitrate-N mg/L
QWTA 1 21 1 0 0 100% 0% 0%
Quaternary Buried 22 98 21 1 0 95% 5% 0%
Cretaceous 1 170 0 1 0 0% 100% 0%
Undesignated 269 86 226 28 14 84% 10% 5%
Other 3 79 3 0 0 100% 0% 0%
Total 296 87* 251 30 14 85%* 10%* 5%*
* Represents a weighted average value. **The depths were obtained from well logs in the CWI database
2014 Summary Stearns County Township Sampling | 23
SUMMARY
Fourteen townships were chosen for sampling based on the following criteria: local Soil and Water Conservation District (SWCD) expertise, past high nitrate results, vulnerable groundwater, and row crop production. According to the County Well Index (CWI) the Quaternary buried aquifers are more readily used than the water table aquifers in the selected Townships. Samples were collected from 1,894 private wells using homeowner collection and mail-in methods. This represents a 29 percent response rate from homeowners.
Results showed that across the 14 townships, seven percent of private wells sampled were above the health standard of 10 mg/L for nitrate as nitrogen (nitrate-N). In Brockway, Grove and Wakefield Township, greater than 10 percent of wells were above 10 mg/L nitrate-N.
FUTURE WORK
Well owners with detectable nitrate results from this township testing were offered a free pesticide sample and a follow-up nitrate sample taken by MDA staff. At the time of this resampling a well site visit was performed (when possible) in order to rule out well construction issues and likely point sources of nitrate. The follow-up nitrate sampling in Stearns County occurred during the summer of 2015 and results from this effort will be available in 2016.
The testing conducted in Stearns County is part of a statewide assessment of vulnerable areas as the MDA plans to offer nitrate tests to approximately 70,000 private well owners (within 250-350 townships) between 2014 and 2019. As of spring 2015, 60 townships in eight counties had been completed.
2014 Summary Stearns County Township Sampling | 24
REFERENCES
Meyer, G.N. (1995). C-10 Geologic Atlas of Stearns County, Minnesota [Parts A and C]. Minnesota Geological Survey.
Minnesota Department of Agriculture. (2012). Central Sands Private Well Network 2011, Current Nitrate Conditions Summary. Minnesota Department of Agriculture, St. Paul, MN.
Minnesota Department of Agriculture. (2015). The Minnesota Nitrogen Fertilizer Management Plan. Retrieved December 2, 2015, from
Minnesota Department of Health. (2002). Stearns County Nitrate-Nitrogen Probability, Retrieved March 11, 2015, from http://www.health.state.mn.us/divs/eh/water/swp/nitrate/reports/2002method/Stearns.pdf
Minnesota Department of Health. (n.d.). County Well Index website. Retrieved March 2, 2015, from http://www.health.state.mn.us/divs/eh/cwi/
Minnesota Department of Natural Resources. (1991). Geologic Sensitivity Project Workgroup. Criteria and guidelines for assessing geologic sensitivity of ground water resources in Minnesota, Minnesota Department of Natural Resources, Division of Waters, St. Paul, Minn., 122 p.
Minnesota Department of Natural Resources. (1998). Geologic Atlas of Stearns County, Minnesota, County Atlas Series C-10, Part B.
Minnesota Pollution Control Agency. (1998). Baseline Water Quality of Minnesota’s Principal Aquifers, Region 2, North Central Minnesota.
Minnesota Department of Natural Resources, Minnesota Geologic Survey and University of Minnesota – Duluth. (1997). Geomorphology of Minnesota, geomorphology data describing a wide variety of conditions related to surficial geology within a hierarchical classification scheme that was devised for use within Minnesota, Scale 1:100,000.
Minnesota Geologic Survey. (n.d.). County Atlas Website. Retrieved on March 2, 2015, from: http://www.mngs.umn.edu/county_atlas/countyatlas.htm
Minnesota State Demographic Center and the Metropolitan Council. (2013). Retrieved December, 1, 2015, from http://mn.gov/admin/demography/data-by-topic/population-data/our-estimates/index.jsp
2014 Summary Stearns County Township Sampling | 25
Nolan, BT., and Stoner, J.D. (2000). Nutrients in Groundwaters of the Conterminous United States, 1992-95: Environmental Science and Technology, 34(7), 1156-1165.
U.S. Environmental Protection Agency. (2009). National Primary Drinking Water Regulations list, On-line PDF Retrieved December 13, 2015, from http://water.epa.gov/drink/contaminants/upload/mcl-2.pdf
Warner, K.L., and Arnold, T.L. (2010). Relations that Affect the Probability and Prediction of Nitrate Concentration in Private Wells in the Glacial Aquifer System in the United States, A USGS National Water-Quality Assessment Program Scientific Investigations Report 2010.
2014 Summary Stearns County Township Sampling | 26
1. What setting did the water sample come from? Please choose only one. Answers choices: Sub-division, Lake Home, River Home, Country, Municipal/city, or Other.
2. Are there livestock on this property? Yes or No 3. Do you mix or store fertilizer (500lbs or more) on this property? Yes or No 4. Does farming take place on this property? Yes or No
Well Information Section
5. Does your well have a Unique Well ID number? Yes or No 6. If yes, what is the Unique ID?
(6 digit number found on a metal tag attached to your well casing) 7. Type of well construction? Answer choices: Drilled, Sand point, Hand dug, Other, and Don’t Know. 8. Approximate age (years) of your well? Answer choices: 0-9 years, 10-19 years, 20-39 years, and 40 or more years old. 9. Approximate depth of your well Answer choices: 0-50 feet, 51-100 feet, 101-300 feet, and more than 300 feet. 10. Distance to an active or inactive feedlot Answer choices: 0-50 feet, 51-100 feet, 101-300 feet, and more than 300 feet. 11. Distance to a septic system Answer choices: 0-50 feet, 51-100 feet, 101-300 feet, and more than 300 feet. 12. Distance to an agricultural field Answer choices: 0-50 feet, 51-100 feet, 101-300 feet, and more than 300 feet. 13. Is this well currently used for human consumption? Yes or No 14. Please check any water treatment you have other than a water softener. Answer choices: None, Reverse Osmosis, Distillation, Filtering System and Other. 15. When did you last have your well tested for nitrates?
Answer choices: Never, within the last year, within the last 3 years, the last 10, or 10 or more.
16. What was the result of your last nitrate test? Answer choices: 0<3, 3<10, 10 or greater, or Don’t Know.
2014 Summary Stearns County Township Sampling | 27