55
IT INNOVATORS 1228, WARDEN AVENUE, TORONTO, CANADA Vijayananda Mohire December 11, 2011 Foundational solution series Home and small enterprises: Convenience store
| Date post: | 16-Jul-2015 |
| Category: |
Small Business & Entrepreneurship |
| Upload: | vijay-mohire |
| View: | 71 times |
| Download: | 6 times |
IT INNOVATORS
1228, WARDEN AVENUE, TORONTO, CANADA Vijayananda Mohire
December 11, 2011
Foundational solution series
Home and small enterprises: Convenience store
1
Fo
un
da
tio
na
l so
luti
on
se
rie
s
Contents
EXECUTIVE SUMMARY........................................................................................................2
INTRODUCTION.................................................................................................................2
INTRODUCTION TO CONVENIENCE STORE ...............................................................................2
HISTORY OF CONVENIENCE STORE .........................................................................................2
CHALLENGES FACED BY THE MODERN AGE CONVENIENCE STORE..................................................3
TYPICAL SHOP LAYOUT ........................................................................................................3
OTHER FACTORS THAT CAN AFFECT YOUR BUSINESS ...................................................................4
HOW INNOVATIONS CAN IMPROVE YOUR BUSINESS ....................................................................4
VALUE PROPOSITIONS OF PROPOSED SOLUTION ........................................................................5
SOLUTION DETAILS ............................................................................................................8
MANAGEMENT FOUNDATION ............................................................................................9
BUSINESS PLAN...................................................................................................................9
STRATEGY ...................................................................................................................... 10
EXAMPLE ........................................................................................................................ 26
THE BUSINESS ANALYSIS BODY OF KNOWLEDGE...................................................................... 33
GOVERNANCE OF IT SYSTEMS ............................................................................................. 41
DOMAIN FOUNDATION .................................................................................................... 42
BUSINESS FRAMEWORKS ..................................................................................................... 42
BUSINESS PATTERNS .......................................................................................................... 42
DELIVERABLES AND BUSINESS PROCESS .................................................................................. 43
NON FUNCTIONAL FEATURES .............................................................................................. 44
INTERIOR DECORUM FOUNDATIONS ............................................................................... 44
INTEGRATION FEATURES .................................................................................................... 44
LANDSCAPE FEATURES ....................................................................................................... 44
NEW SHOP LAYOUT .......................................................................................................... 45
TECHNOLOGY FOUNDATIONS ......................................................................................... 45
NETWORK ...................................................................................................................... 46
HARDWARE .................................................................................................................... 50
SOFTWARE ..................................................................................................................... 50
SECURITY ....................................................................................................................... 51
IMPLEMENTATION GUIDELINES ............................................................................................ 51
QUALITY ........................................................................................................................ 51
COSTING ELEMENTS .......................................................................................................... 51
FUTURE STEPS .................................................................................................................. 52
APPENDIX ........................................................................................................................ 52
STAFF RESUMES................................................................................................................ 52
SOLUTION PACKING OPTIONS AND PRICING ............................................................................ 52
DISCLAIMER .................................................................................................................... 54
BIBLIOGRAPHY ........................................................................................................................ 54

2
Fo
un
da
tio
na
l so
luti
on
se
rie
s
Foundational solution series
Home and small enterprises: Convenience store
E XE CUTIVE SUM MARY This foundational solution is mainly meant for small and home based business that need betterment in the short run and uncertain about the long term goals. These are quick turnaround solutions that will make you brighter and work smarter. Instead of you reinventing wheels of fortune we try to bring in our experience and expertise in delivering you our optimum and accurate solutions that can span any type of aid needed in making you succeed. The principles remain the same for the large scale industries but care is to be exercised as we have not developed this solution for the large sectors where already there are plentiful of long term solutions being implemented and competing vendors have great stake in such fortune companies. We don’t want to rework and trouble large fortune clients with our versions of solutions. Details of the solutions are provided in the following sections.
INTR ODUCT ION
In trodu cti on t o Convenien ce st ore
What makes the name Convenience unique for this type of store? Why it is not a General name? Well as per Dictionary Convenience means ―Ease‖, ―Handiness‖. So a store that is useful for the domestic purpose and comes handy at times when there is a need for it is called a Convenience store. Hence this store should be a home to all types of items needed by the local community. Each community has different types of people living in it. So the Convenience store can house the general items in addition to the community specific demands. Like the North York suburb constitute the Chinese, East-Indian, Italian and French societies. Hence the store should be able to come handy for people from these origins. The store is NOT a departmental store but is a small store that is housed in a small unit typically within 1000 square feet area. This document will concentrate on the common challenges faced by small business owner either run in-house or in a remote location where shop prices are less but not so convenient to shoppers. However we will try to see that these challenges can be removed. Shop owners can retain their shops bit far away from the rich residential areas but can deliver the goods at the doorstep of the buyer. To accommodate for such challenging situations we will make use of Technology to manage the operations economically and also get the returns that can be used for further investments.
History of Conveni ence store
Why was it needed: Store system began centuries ago as a concept in the Chinese villages and these were meant mainly for trade of excess home grown grains. Prior to this, go-downs were mainly used for storage; kings had their own granaries that were of huge size and capacities meant for the princely family. Along with this trade came the stores concept and is also the mother of the modern malls and large departmental stores. Shops for the knights do exist today but that is out of scope of this document. This document will concentrate on the needs of the small enterprises which do not belong to the rich class and has serious constraints on the capital and or political support. Its main purpose: The purpose of Convenience store is mainly meant to provide the handy items needed for a client for his domestic livelihood. This is not a ration shop or a wholesaler or a mall in a plaza. It is an independent unit that is isolated from other shops mainly in its purpose. It should be able to serve the needy with items like a snack bar, a cigar, a chocolate, a drink, a newspaper or a public phone facility, recharge centre, postal sales, paper and pencil. It can also
3
Fo
un
da
tio
na
l so
luti
on
se
rie
s
extend its purpose based on the neighbouring shops. Items can include vegetables, eggs, dry food items, cereal grains, baby food, imported items, dry fruits, electronic gadgets, perfumes etc. All depends on the needs of the local community.
Chall eng es f aced by th e Mod ern ag e Con venien ce st ore
We need to think and understand the key challenges faced by the owner when he/she starts such a shop. Few of these can be:
1) Non availability of capital investment for purchase in bulk or on credit 2) Limited clients or no new clients 3) Isolated place where there is not much rich people to afford to buy hi priced items 4) Not well connected to the city rich areas 5) Sales agents or wholesalers do not want to come to deliver goods at your premises 6) Not sure of the sales volume and difficulty in understanding the needs 7) Stagnant business with no hopes of betterment in sales or monetary gains 8) Other constraints that creep in with the limited money like limited shop floor area, unable to hire workers,
limited items to buy and sell. 9) Hi risks of non cash flows if the existing inventory does not sell. 10) No brand name and not popular 11) Unable to raise capital from the public 12) Typically liabilities are for self and family
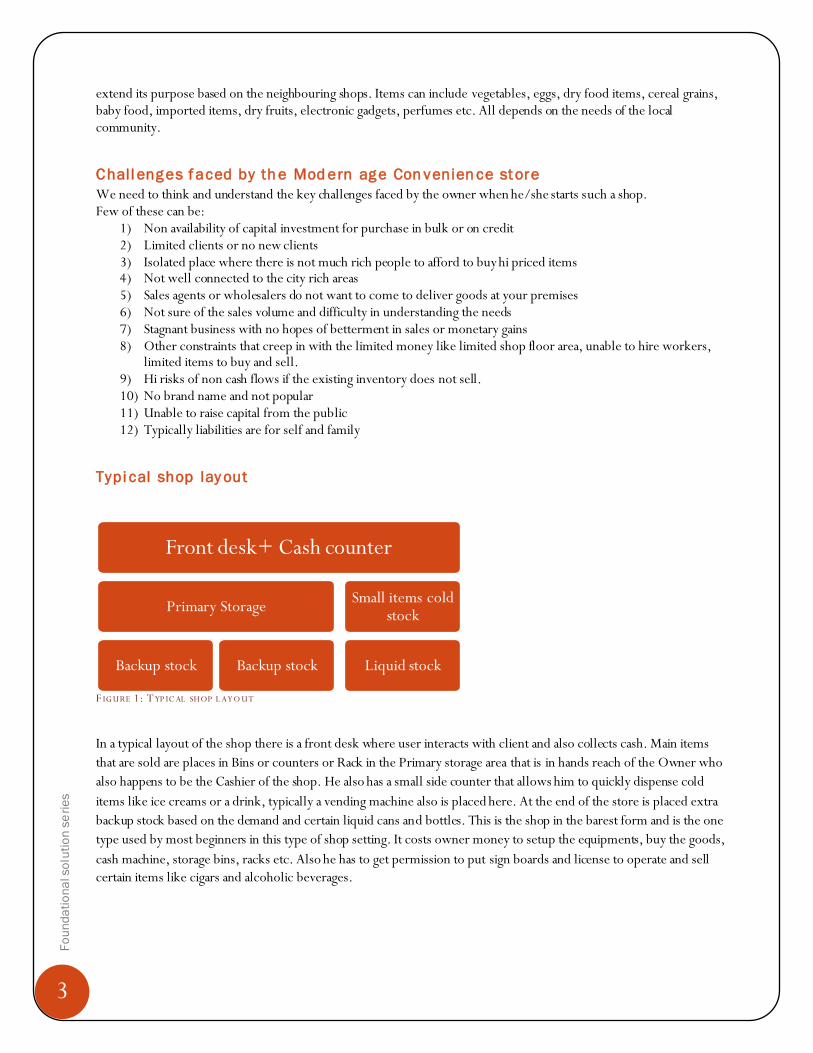
Typi cal shop lay out
F IG URE 1: T YP IC AL SHOP L AYO UT
In a typical layout of the shop there is a front desk where user interacts with client and also collects cash. Main items
that are sold are places in Bins or counters or Rack in the Primary storage area that is in hands reach of the Owner who
also happens to be the Cashier of the shop. He also has a small side counter that allows him to quickly dispense cold
items like ice creams or a drink, typically a vending machine also is placed here. At the end of the store is placed extra
backup stock based on the demand and certain liquid cans and bottles. This is the shop in the barest form and is the one
type used by most beginners in this type of shop setting. It costs owner money to setup the equipments, buy the goods,
cash machine, storage bins, racks etc. Also he has to get permission to put sign boards and license to operate and sell
certain items like cigars and alcoholic beverages.
Front desk+ Cash counter
Primary Storage
Backup stock Backup stock
Small items cold stock
Liquid stock

4
Fo
un
da
tio
na
l so
luti
on
se
rie
s
Drawbacks
Few of the drawbacks of such shop layout can be:
1) No consumer has access to the stock and the items- poor visibility even though there might be a display board.
2) No attraction for shoppers like visual display of products in a user friendly manner
3) Transaction is mainly meant for item list of buyers and no new ideas are developed during shopping
4) Not having professional look and feel of the store in general
5) Probability of buying new items or more is low even though there is personal attention by owner
6) Stealing can happen even if the products are inside the boxes as owner might have to go to back storage for
retrieval of extra quantity or items
7) Online display of Inventory and rates is not available for owner
8) For large boxes with different items there might be no clue where to find the right item
9) No market data or integrated with Govt policies and business deals
10) Not able to maintain proper accounts including credits and supplier transactions
Other f act ors th at can aff ect you r bu sin ess
Factors like political, being a visible minor and not from a strong economical background. You have the business skills
but these are just dreams. Overcoming dreams is also a big hurdle and not acting also is a factor for not getting the
business right.
Personal and family issues can also be one challenge. Factors like religious belief and personal habits and preferences
that can make overlook items that people might not buy. But few items can be more in demand; like a particular type of
a Non-veg snack or ready to eat item that gives better returns might not be in your list BUT can sell more.
How innovati ons can imp rove you r bu sin ess
Innovation means becoming more self aware and avoiding common errors or business patterns both from shop owner and by customers. Technology is not the ultimate aim in brining profits. It is the strategy, directions, steering boat in right way so that you are present in right place for service for a right price quote. Why all those you attend Management courses might not be successful. What you have is a bird in hand; please see how to make best use of it. For e.g. a small tea shop might sell more cups that is next to popular brand tea shop which might not be affordable to many especially in the bad economic conditions. Someone’s advantages might not be yours. They might have political power to attract large funds from public and spend lavishly with lower returns to the investors. Well we don’t have that leisure. So let’s concentrate on the way we do business and pay attention to our expenses. So what we will learn from this solution is not just technology or managerial jargons that are used by many Fortune companies but the base foundation in these so that we join and participate in the main stream. Also not to get trapped by the great dreams offered by big MNCs who make their own fortune at your cost. Making use of wisdom and truth and avoiding any sort of bad relations / bias at any cost will help in steering the boat in a right direction. We might have liquid cash in our balance sheet, but if we are going to introduce behavioural anomalies at any point of conducting the business it is going to affect. This entity we call as karma might not affect you in your future life but its returns are shown in this life itself, in terms of reduced support of customers.
5
Fo
un
da
tio
na
l so
luti
on
se
rie
s
So always believe in self achievement and not live on the free food offered by others. Today they might be your well wisher but there is no guarantee they will be a good samaritan tomorrow. Money can make all things possible. Well we might not be so fortunate ones so we cannot use money as our strength in conducting a business. Alternates to money can be used as Good will, Individual care and personal attention. Attributes that might not always need money should be harnessed. This policy might not always work for the rich and owners in power of money. Money is just a medium and an instrument to do a good transaction. But if this instrument can be used for bad purposes it will have no meaning. We will leverage the best practices and try to understand issues at hand and ways to mitigate them. These are all our instruments that we will compensate without the money power. Believe in your own strengths and use that to steer your boat to success. So for our success as a Convenience store we will use the eight Commandments of success:
1) Stress on using non monetary attributes like discipline, quality for less margins, building trust and non bias etc 2) Understand our issues within us and make our weakness our strengths either by rectifying them or make
alternate routes 3) Leverage the rich and free resources of Internet – these are fruits of hardwork of our great scientists 4) Inherit the best practices and policies that are applicable to small business and not those of Mega marts 5) Reduce wastage of all kinds includes money spent on favouring our own kind, the opportunity cost that would
have worked better with someone unknown who can only deliver a job and not be your relative 6) Once internal factors have been studied and rectified, we will use the external factors like Market demand and
trends to level with the competition 7) We will use our new business religion of work and not our home religion for office purposes. 8) We will work on the basis of ethics, and deliver our best and consider customer as our king.
We will follow the best practise in the Business segment and also leverage IT as the technology foundation to streamline the business and think better and offer better service.
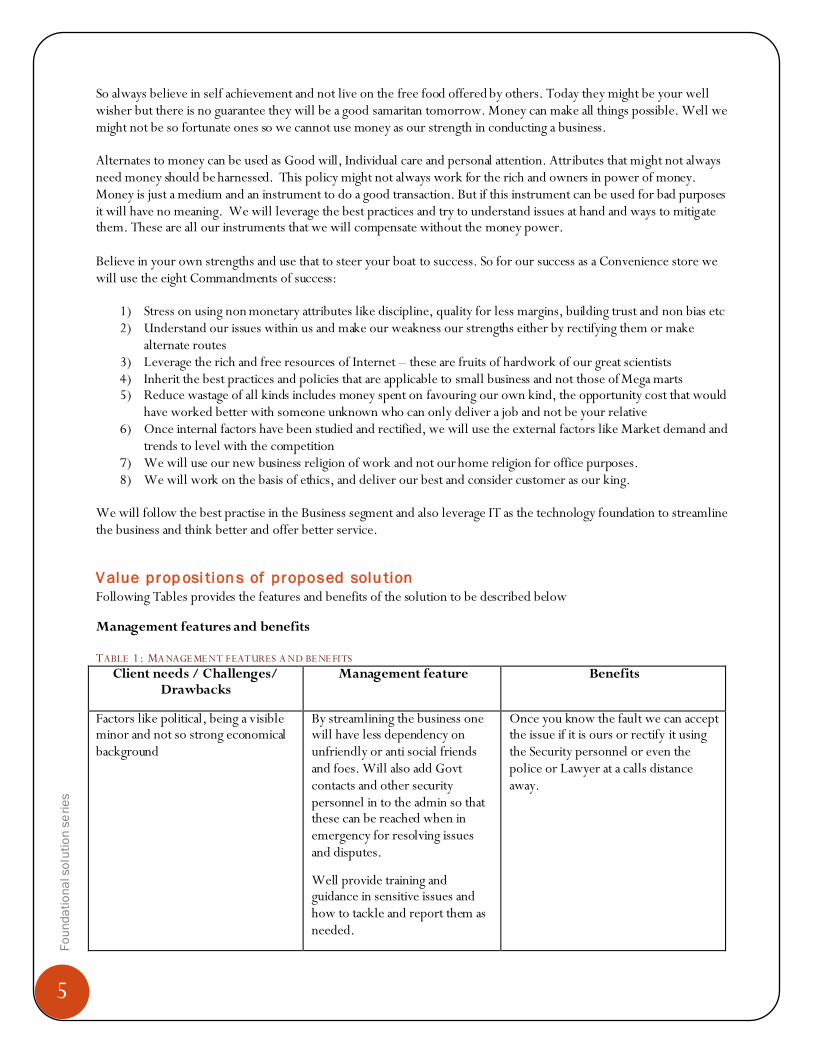
V alue prop osi tion s of proposed solu tion
Following Tables provides the features and benefits of the solution to be described below
Management features and benefits
TABLE 1: MA NAGE ME NT FEATURES A ND BE NE FITS
Client needs / Challenges/ Drawbacks
Management feature Benefits
Factors like political, being a visible minor and not so strong economical background
By streamlining the business one will have less dependency on unfriendly or anti social friends and foes. Will also add Govt contacts and other security personnel in to the admin so that these can be reached when in emergency for resolving issues and disputes.
Well provide training and guidance in sensitive issues and how to tackle and report them as needed.
Once you know the fault we can accept the issue if it is ours or rectify it using the Security personnel or even the police or Lawyer at a calls distance away.

6
Fo
un
da
tio
na
l so
luti
on
se
rie
s
Isolated place where there is not much rich people to afford to buy hi priced items
Not well connected to the city rich areas
We have fair experience in delivering the much needed management strategy, focus and use Technology to overcome such challenges. We will improve your marketing areas based on market segment, home delivery to client place, and a virtual communication using Personal Mobile Network like Location – aware services that a user can use even if is far away from your shop.
Well a service Add –on to the local Mobile service provider will make your services available on the Mobile MENU of the users in the target area and these can make the users buying experience easier and better.
Technology features and benefits
T ABL E 2:T EC HNO LO G Y FE ATURES AND B E NE FITS
Client needs / Challenges/ Drawbacks
Technology feature Benefits
No consumer has access to the stock and the items- poor visibility even though there might be a display board.
Client can have access to Digital boards with user friendly kiosk to key in and see the item or request owner to fetch the details
Better customer satisfaction as he is presented the virtual world. This simple kiosk can later be updated to include the actual product features and looks to see the different varieties. Drawbacks 1 to 3 are removed.
Stealing can happen even if the products are inside the boxes as owner might have to go to back storage for retrieval of extra quantity or items
For large boxes with different items there might be no clue where to find the right item
Will have economical radio tags on the packages and loose items will have scatter based item inspection using suitable scan and visual reporting of the items on mini TV screens.
The items that are NOT Sold but pass the shop boundary will raise an alarm and also give precise items that might have been picked.
A laser scan handle can be put near the Boxes and this will make the display update with the items in the box.
Online display of Inventory and rates is not available for owner
Well we will incorporate an accounting package solution that is economical and also will be easily upgradable to Enterprise editions
Well the system will maintain the actual goods sold and also these will be deducted from the Inventory list that will make the accounting easier.
No market data or integrated with Govt policies and business deals
We will select the websites that can be subscribed using RSS and ATOM aggregators and suitable GUI will display the trends, demands and other useful market data.
The market data will make the owner more confident of where to buy what and how the market is behaving. In fact he can also tie up with the stock market and do online trade and earn money.
Not able to maintain proper accounts including credits and supplier transactions
We will have a Smart card / Micro card technology for users and suppliers and can have a record update and also have
These features are bold but are possible and also can be economical in long run.
Also speedier order processing is

7
Fo
un
da
tio
na
l so
luti
on
se
rie
s
security in it so that the credits and transactions are recorded on this mini card that can hold a small memory of last few transactions and that can sync with our servers.
possible for better client satisfaction.
My innovative recipe: features and benefits
T ABL E 3: MY INNO VATIVE RE C IP E: FE ATURES AND B E NE FITS
Client needs / Challenges/ Drawbacks
My recommendations feature
Benefits
Not having professional look and feel of the store in general
Will suggest Interior landscape artists recommendations and will give best advice on the same
Will have a new look of the existing decorum with new arrangements and interior beautifications
Overcoming dreams is also a big hurdle Personal and family issues can also be one challenge.
We will provide the necessary training and make you feel more confident so that your dreams are made into reality. Well money is not all but is a means to achieve your goals.
This will help you in overcoming the ways you do business and know the facts and non facts.
Sales agents or wholesalers do not want to come to deliver goods at your premises
We will recommend a combination of management changes and also use technology to understand the sales agent service timing and we can request them to deliver a larger Qty that can be affordable to them.
Alternate solutions can be introduced like better margins for them. Also making them sales partners and profit sharing schemes.
You get a streamlined business and better sales agents and distributors.
No brand name and not popular
With all the above features and attractions you will be one of the top brands and you can market yourself in a different way.
Your brand is build based on this foundation.
Other take away: Features and benefits
T ABL E 4:O THE R TAK E AWAY : FE ATURE S AND BE NE FITS
Client needs / Challenges/ Non ideal situation
Takeaways feature Benefits
Not familiar with the technology or managerial jargons
You will have ample Do yourself kit material that will feel more
You become a Technocrat without actual attending the Business school or
8
Fo
un
da
tio
na
l so
luti
on
se
rie
s
closer to the real waters
Also we have exhaustive packages to make you feel better in learning the jargons at your own pace.
the Computer Academy.
You are exposed to these technologies for the amount you need to run your business.
By leveraging this solution what can the owner expect from his/her business
Expected results:
1) Improved insights of the business
2) Better understanding of the business operations
3) Clarity into the areas not commonly known to the owner
4) Exposure to known/ unknown risks and getting prepared to challenge the same
5) Better equipped to handle and manage odd situations
6) Better sales and more cash flows
7) Better managed business and better loyalty to clients
8) Removal of wastage and in time ordering of right items
9) Better ways to approach the inventory stock and streamline the Supply chain
10) Improved sales and individual attention to clients made possible
SOLUT ION DETAILS
In continuation to the above domain background of Convenience store we will now proceed to the intended solution
being proposed to make managing and selling your sales items a happy situation and with great insights into the
consequences of not doing it correctly and in right proportions.
The following sections are taken from various sources and the contents need not be put into practice word by word. It is
a recommendation that can be used and forearmed to understand your business well and steer it towards your goals.
This solution comprises of basic foundations that can be used to apply to your existing business or a new venture. It will
provide the basic needs that a Convenience store needs in order to operate efficiently and adhere to Govt regulations
and prevailing market conditions.
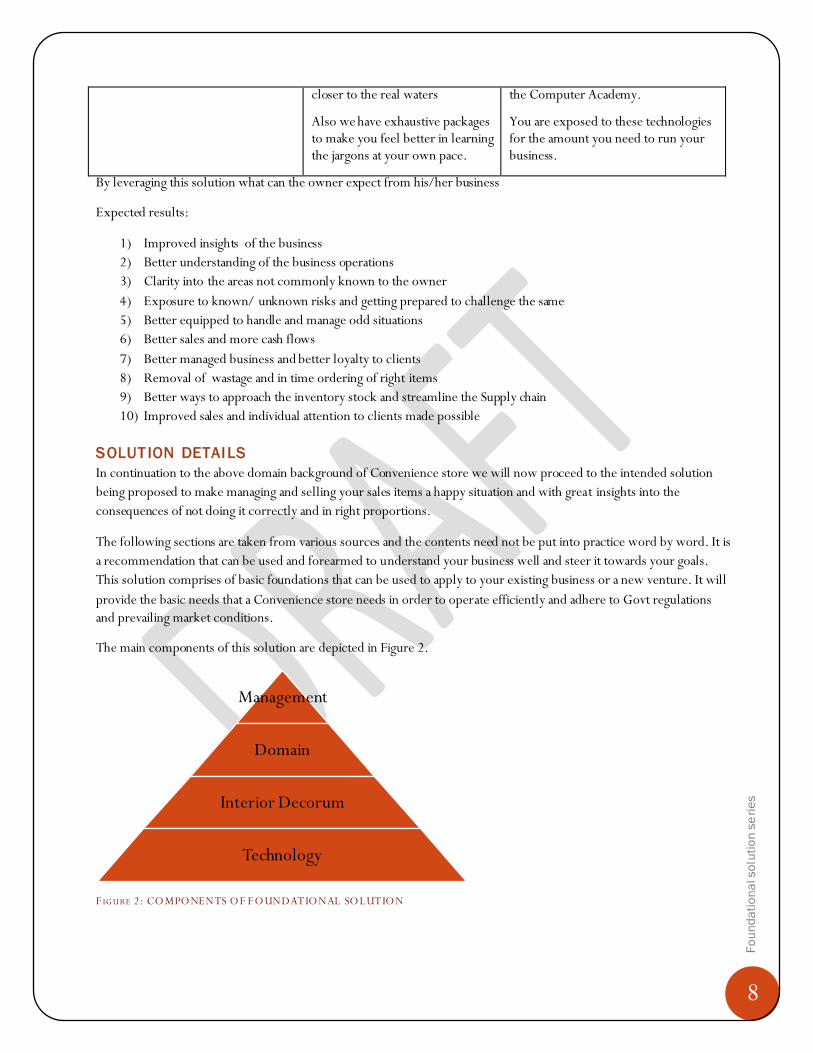
The main components of this solution are depicted in Figure 2.
F IG URE 2: COMPONENTS OF F OUNDATIONAL SOLUTION
Management
Domain
Interior Decorum
Technology

9
Fo
un
da
tio
na
l so
luti
on
se
rie
s
These foundations are detailed in the following sections. Also the Implementation procedure is also discussed in order
to realise the above key foundational layers that is in compliant to industry standards like ITIL, COBIT, etc
MANA GEMENT FOUNDATION
Bu sin ess pl an
If you donot have a business plan we will develop a New Business Plan for you at your convenience or request you for
an advice from the expert. We can rework on your existing plan to suite the market needs.
Table 5 details the highly summarised view of a typical business plan that should be in place while you had envisaged this
dream business. We will provide finer details on each of these in our one to one sessions.
T ABL E 5: BUSINESS PLAN COMPONENTS
Business plan- section name Further details /subsections
Executive Summary Business product or Service, The Market, Competition
Risk/ Opportunity, Management Team/ Ownership
Operations/ Location , Capital snapshot/ Start Up Summary
Goals and Objective
Mission
Keys to success / Critical Success factors
Service/ product details Descriptions, Feature Benefit analysis
Customers Target consumers, Demographic profile, market segmentation
Sales material
Strategy Marketing strategy , Positioning ,Pricing strategy, Promotion strategy, Sales strategy
Marketing plan
Market segment, Trends, Growth, Needs – Demand ,Competitor analysis, SWOT, My Niche market segment
Operational plan
Production techniques, Manufacturing locations, Legal needs, Staff, Inventory, Suppliers, Credit policies, Account management, Projected cash flows and sales charts
Business registrations and related process and documentation

10
Fo
un
da
tio
na
l so
luti
on
se
rie
s
Strat egy
F IG URE 3: STRATE G IC P L ANNING AN D C O RP O RATE IT ARC HITE CTURE P ROC ES S
The ultimate aim of a Strategy is to generate the right solution and architecture that suits the target market client.
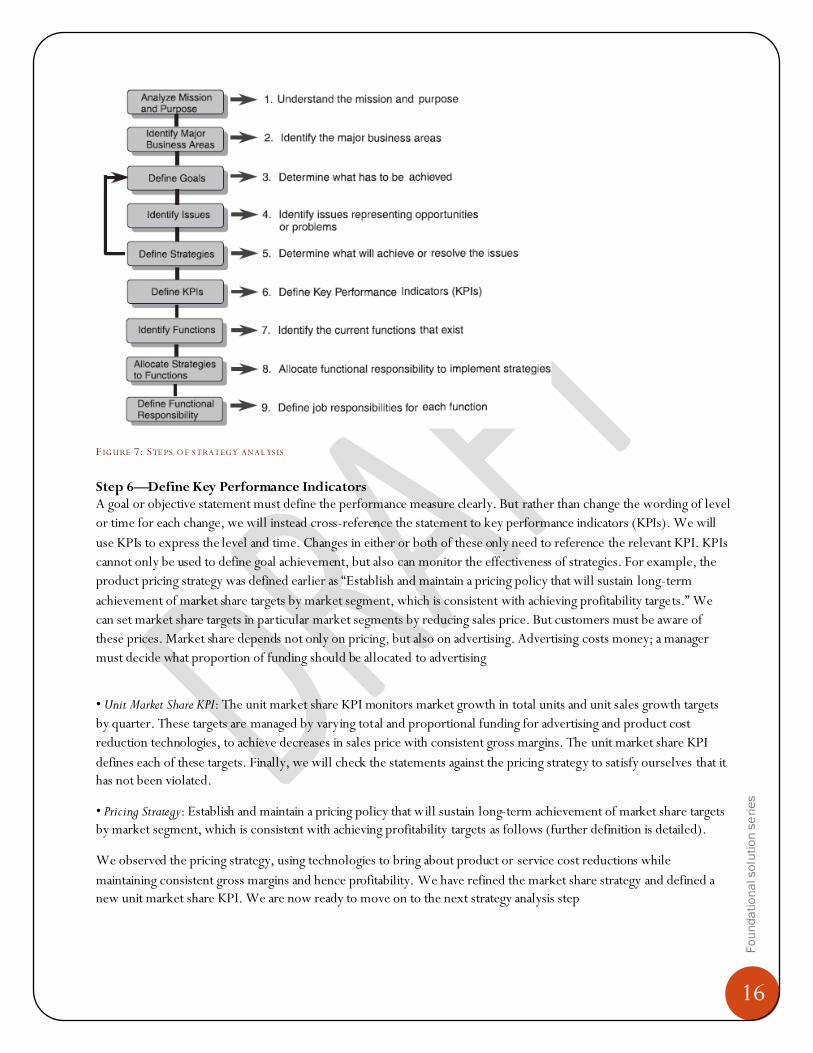
The Steps of Strategy Analysis Strategy analysis has nine steps, as discussed in the following subsections:
Step 1—Understand the mission and purpose.
Step 2—Identify the major business areas.
Step 3—Determine what has to be achieved.
Step 4—Identify issues representing opportunities or problems.
Step 5—Determine what will achieve or resolve the issues.
Step 6—Define Key Performance Indicators (KPIs).
Step 7—Identify the current functions that exist.
Step 8—Allocate functional responsibility to implement strategies.
Step 9—Define job responsibilities for each function.

11
Fo
un
da
tio
na
l so
luti
on
se
rie
s
F IG URE 4: PL ANNING S TATE ME NTS
Step 1: Understand the mission and purpose.
The objective of this step has been to understand the mission and purpose. An ideal mission should be timeless—it should identify directions now and into the future. It should clearly express:
• What the business is doing now; • What is happening in the environment; • What the business should be doing in the future; • It should broadly indicate markets, customers, products, and services.
F IG URE 5: M IS S IO N STATE ME N T
Step 2—Identify the Major Business Areas
From the understanding of the mission gained from Step 1, we will now analyze its focus further to identify major business areas that should be involved.
We will start by examining the mission and purpose statement, looking for explicit and implicit nouns in the statement. There will typically be 6 to 10 major nouns. These nouns should enable us to determine what parts of the business are involved. For example:

12
Fo
un
da
tio
na
l so
luti
on
se
rie
s
Develop, deliver, and support products and services which satisfy the needs of customers in markets where we can achieve a return on investment of at least 20% within two years of market entry. The nouns in italics in the mission statement above suggest the major business areas in which XYZ Corporation is involved (see Table 6). Managers from each of the business areas listed in Table 6 are invited to participate in the remaining strategy analysis steps
T ABL E 6: XYZ CO RP O RATIO N’S MAJ O R BUS INE SS ARE AS
Step 3—Determine What Has to Be Achieved
Step 3 focuses on identifying and refining goals. This depends on the policies set by management, which define ―the
rules of the game. “Policies are qualitative guidelines that define boundaries of responsibility in the organization”; they must be known if valid goals are to be defined based on those policies. They enlarge on the mission statement. They are the internal rules (as company policies) or external rules (as legislation, laws, and so forth) that the business follows to achieve its goals. Goals are typically layered hierarchically and are made up of principal goals and contributing key performance indicators (KPIs) or CSFs. In most organizations there are three to, typically, six major goals whose achievement is critical to realize the mission. The number of goals that are identified decides the duration of strategy analysis. Six goals typically take 3 to 5 days for managers to discuss all relevant factors, as they complete the steps of strategy analysis. More goals than this will require greater time for discussion in planning sessions. Goals and objectives are measurable targets. To be measured, they must of course be quantitative. They have three characteristics—measure, level, and time:
• The measure defines what performance indicator will be used for measurement. • The level indicates what result value must be achieved. • The time specifies when that result should be achieved.
If only two of the three characteristics are defined, goals and objectives are meaningless; all three must be known for quantitative targets. Notice that measure, level, and time focus on what and when, not yet on how. Only when we know what result is to be achieved and the time frame, can we determine the most appropriate strategies or tactics—which indicate how.
We will instead evaluate the wording of each goal defined by the managers and business experts, to assess whether their goals are clearly defined. The statements they developed for the asset growth, profitability, market share, and market analysis CSFs are documented next.
• Asset growth: ―Monitor performance of all aspects of our business so that each activity has a favorable effect, directly or indirectly, on our mission ROI.‖ • Profitability: ―Monitor financial performance of all activities to ensure that profit and cash flow projections are achieved according to, or ahead of, plan.‖ • Market share: ―Achieve the targeted annual market share (expressed as …) for the chosen market segments of XYZ.‖ • Market analysis: ―Analyze existing and emerging markets on a regular basis, to assess market growth, potential market size, and potential market competition.‖
13
Fo
un
da
tio
na
l so
luti
on
se
rie
s
We could ask the managers and business experts to change the other three statements of strategy so that they are quantitative goals. They may define better statements next time. But we will defer this refinement until we have completed more of the steps of strategy analysis. We will find that these later steps give us a better appreciation of what is to be achieved, so that we can later come back to refine the preceding statements. We can still make good use of them in their present form for the next strategy analysis step.
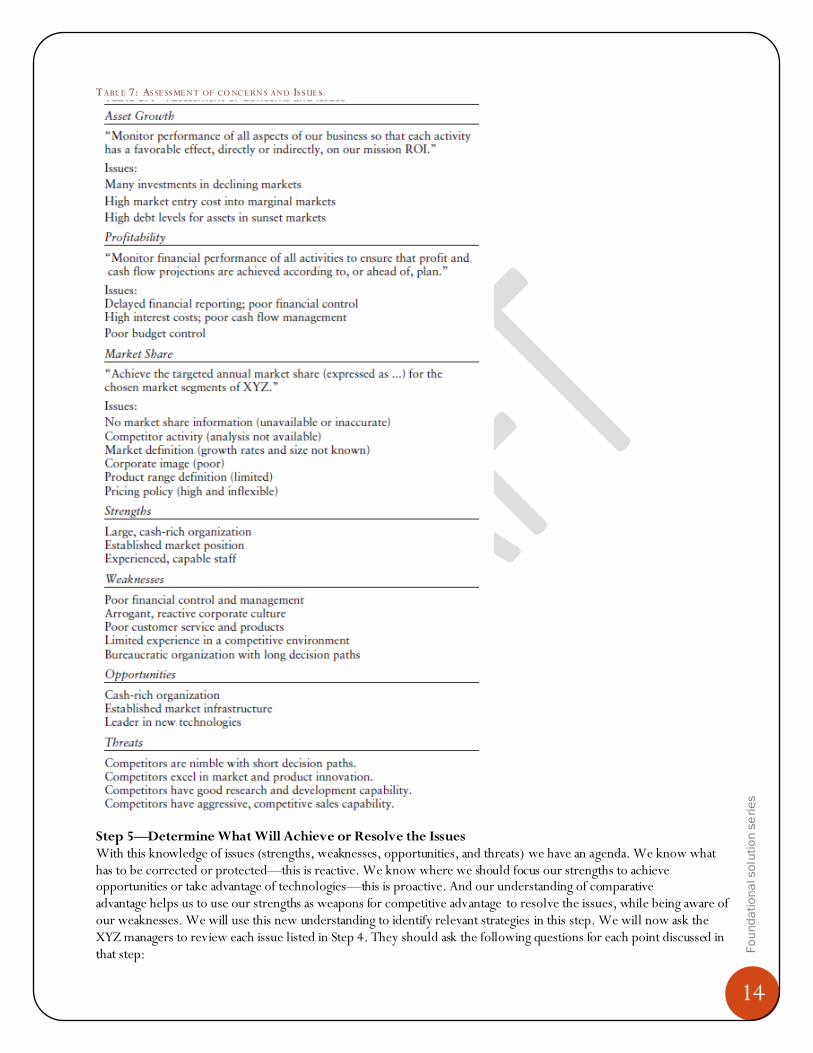
Step 4—Identify Issues Representing Opportunities or Problems When we know problems or threats that are barriers to, or that impede, the achievement of goals—or when we are aware of the opportunities or technologies that enhance or facilitate their achievement—we can then determine the most relevant strategies to follow for those goals. As well as defining issues in this step, we can also list the organization’s strengths and weaknesses. With our understanding of opportunities and threats, we can analyze strengths, weaknesses, opportunities, and threats in a SWOT analysis. One example of a chief financial officer (CFO) describes the factors they identified as seen in Table 7
14
Fo
un
da
tio
na
l so
luti
on
se
rie
s
T ABL E 7: AS SE SS ME NT OF CO NC E RN S AND IS S UE S
Step 5—Determine What Will Achieve or Resolve the Issues With this knowledge of issues (strengths, weaknesses, opportunities, and threats) we have an agenda. We know what has to be corrected or protected—this is reactive. We know where we should focus our strengths to achieve opportunities or take advantage of technologies—this is proactive. And our understanding of comparative advantage helps us to use our strengths as weapons for competitive advantage to resolve the issues, while being aware of our weaknesses. We will use this new understanding to identify relevant strategies in this step. We will now ask the XYZ managers to review each issue listed in Step 4. They should ask the following questions for each point discussed in that step:

15
Fo
un
da
tio
na
l so
luti
on
se
rie
s
• What should we do to take advantage of the opportunities? • What technologies are available to assist us? • What strengths can we use to help us? • What has to be done to resolve the problems? • What should we do to protect ourselves from the threats? • What should we do to correct our weaknesses?
F IG URE 6: STRATE G IC P L AN
Based on these comments, the XYZ managers defined the following strategies
:
Financial recording and analysis strategy
Sales recording and analysis strategy
Customer Demand strategy
Information from market surveys will permit analysis of existing and potential markets. Decisions can be made of
products to satisfy those needs, product ranges, and pricing for each market. After discussion, the managers suggested
the following strategies:
• Market Survey Strategy: Ensure regular surveys are undertaken to determine market size and our market share, and to
understand the needs and the expectation characteristics of our chosen and potential market segments.
• Product Range Strategy: Establish and maintain a product range definition that recognizes the strength of our products
and technology, and the capabilities for bundling products into innovative packages.
• Product Pricing Strategy: Establish and maintain a pricing policy that will sustain long-term achievement of market share
targets by market segment, which is consistent with achieving profitability targets.
16
Fo
un
da
tio
na
l so
luti
on
se
rie
s
F IG URE 7: STE PS O F S TRATEG Y ANAL YS IS Step 6—Define Key Performance Indicators A goal or objective statement must define the performance measure clearly. But rather than change the wording of level
or time for each change, we will instead cross-reference the statement to key performance indicators (KPIs). We will
use KPIs to express the level and time. Changes in either or both of these only need to reference the relevant KPI. KPIs
cannot only be used to define goal achievement, but also can monitor the effectiveness of strategies. For example, the
product pricing strategy was defined earlier as ―Establish and maintain a pricing policy that will sustain long-term
achievement of market share targets by market segment, which is consistent with achieving profitability targets.‖ We
can set market share targets in particular market segments by reducing sales price. But customers must be aware of
these prices. Market share depends not only on pricing, but also on advertising. Advertising costs money; a manager
must decide what proportion of funding should be allocated to advertising
• Unit Market Share KPI: The unit market share KPI monitors market growth in total units and unit sales growth targets
by quarter. These targets are managed by varying total and proportional funding for advertising and product cost
reduction technologies, to achieve decreases in sales price with consistent gross margins. The unit market share KPI
defines each of these targets. Finally, we will check the statements against the pricing strategy to satisfy ourselves that it
has not been violated.
• Pricing Strategy: Establish and maintain a pricing policy that will sustain long-term achievement of market share targets
by market segment, which is consistent with achieving profitability targets as follows (further definition is detailed).
We observed the pricing strategy, using technologies to bring about product or service cost reductions while
maintaining consistent gross margins and hence profitability. We have refined the market share strategy and defined a
new unit market share KPI. We are now ready to move on to the next strategy analysis step
17
Fo
un
da
tio
na
l so
luti
on
se
rie
s
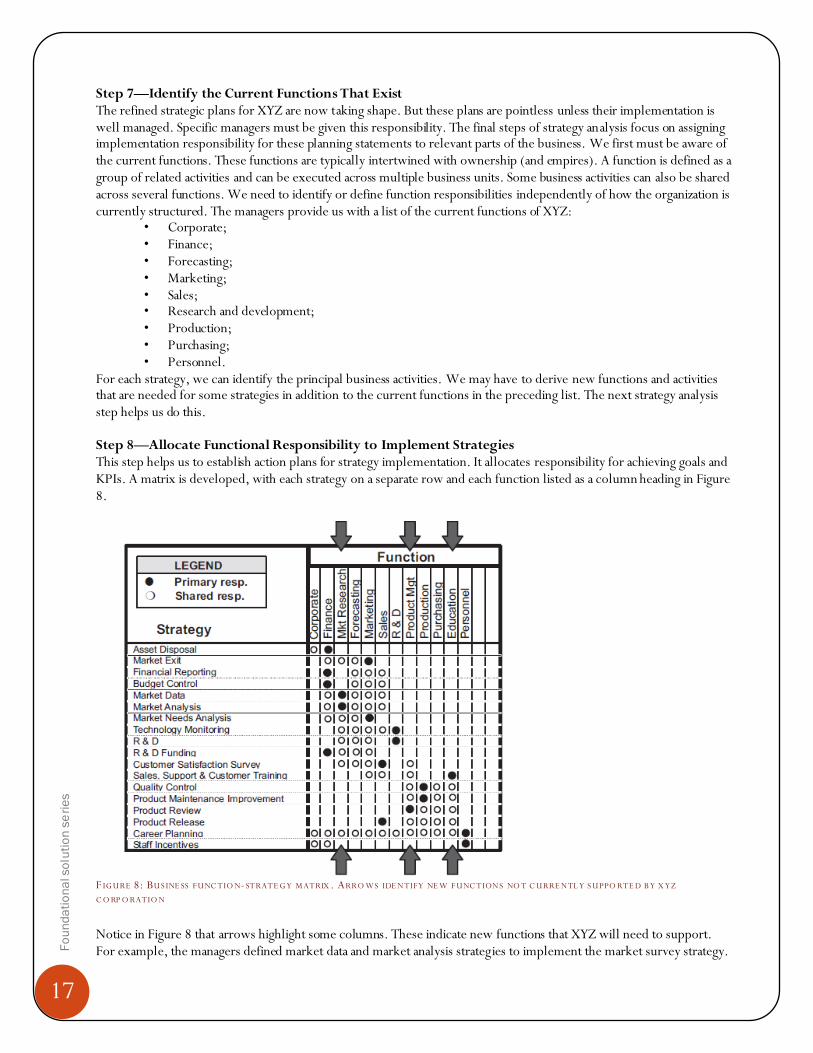
Step 7—Identify the Current Functions That Exist The refined strategic plans for XYZ are now taking shape. But these plans are pointless unless their implementation is well managed. Specific managers must be given this responsibility. The final steps of strategy analysis focus on assigning implementation responsibility for these planning statements to relevant parts of the business. We first must be aware of the current functions. These functions are typically intertwined with ownership (and empires). A function is defined as a group of related activities and can be executed across multiple business units. Some business activities can also be shared across several functions. We need to identify or define function responsibilities independently of how the organization is currently structured. The managers provide us with a list of the current functions of XYZ:
• Corporate; • Finance; • Forecasting; • Marketing; • Sales; • Research and development; • Production; • Purchasing; • Personnel.
For each strategy, we can identify the principal business activities. We may have to derive new functions and activities that are needed for some strategies in addition to the current functions in the preceding list. The next strategy analysis step helps us do this.
Step 8—Allocate Functional Responsibility to Implement Strategies This step helps us to establish action plans for strategy implementation. It allocates responsibility for achieving goals and KPIs. A matrix is developed, with each strategy on a separate row and each function listed as a column heading in Figure 8.
F IG URE 8: BUS INE SS FUNC TIO N- STRATE G Y M ATRIX . ARRO WS IDE NTIFY NE W F UNC TIONS NO T C URRE NTL Y S UPPO RTE D B Y X YZ
C O RP O RATIO N Notice in Figure 8 that arrows highlight some columns. These indicate new functions that XYZ will need to support. For example, the managers defined market data and market analysis strategies to implement the market survey strategy.
18
Fo
un
da
tio
na
l so
luti
on
se
rie
s
The business function–strategy matrix in Figure 8 enables primary and secondary implementation responsibility to be allocated for each strategy. It leads to proactive management of strategy implementation. Each strategy is allocated to at least one function, with new functions identified and added as required.
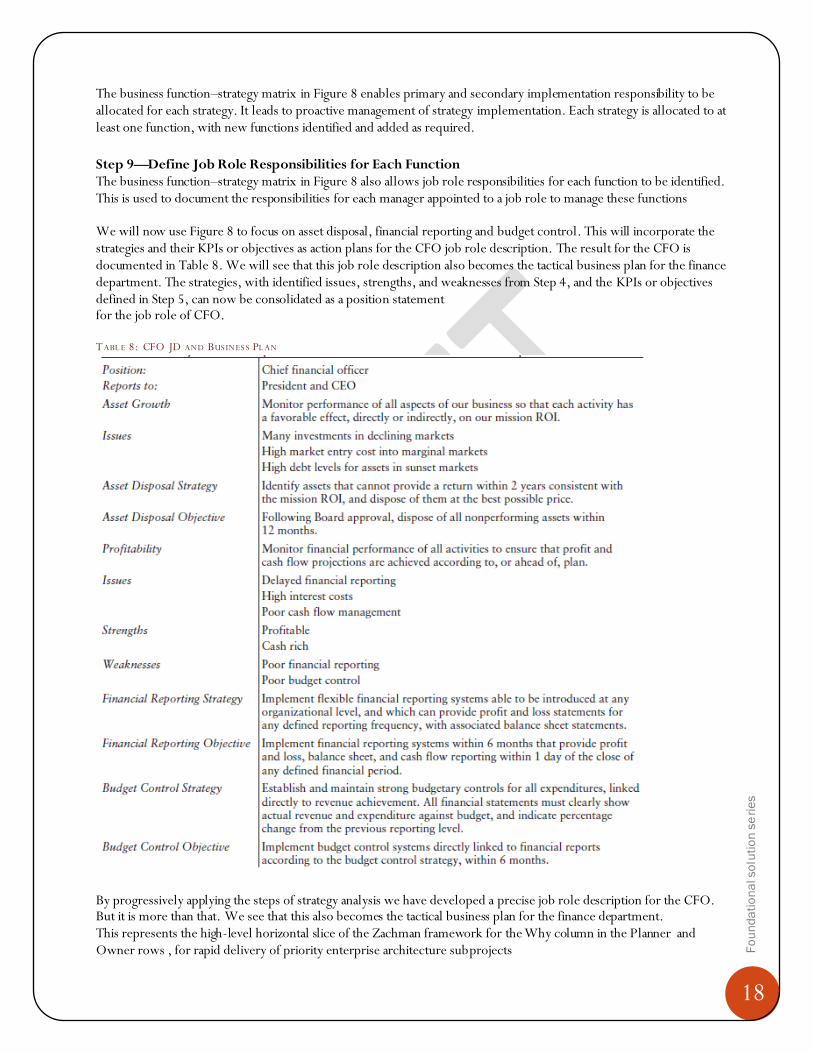
Step 9—Define Job Role Responsibilities for Each Function The business function–strategy matrix in Figure 8 also allows job role responsibilities for each function to be identified. This is used to document the responsibilities for each manager appointed to a job role to manage these functions We will now use Figure 8 to focus on asset disposal, financial reporting and budget control. This will incorporate the strategies and their KPIs or objectives as action plans for the CFO job role description. The result for the CFO is documented in Table 8. We will see that this job role description also becomes the tactical business plan for the finance department. The strategies, with identified issues, strengths, and weaknesses from Step 4, and the KPIs or objectives defined in Step 5, can now be consolidated as a position statement for the job role of CFO.
T ABL E 8: CFO JD AND BUS INES S PL AN
By progressively applying the steps of strategy analysis we have developed a precise job role description for the CFO. But it is more than that. We see that this also becomes the tactical business plan for the finance department. This represents the high-level horizontal slice of the Zachman framework for the Why column in the Planner and Owner rows , for rapid delivery of priority enterprise architecture subprojects
19
Fo
un
da
tio
na
l so
luti
on
se
rie
s
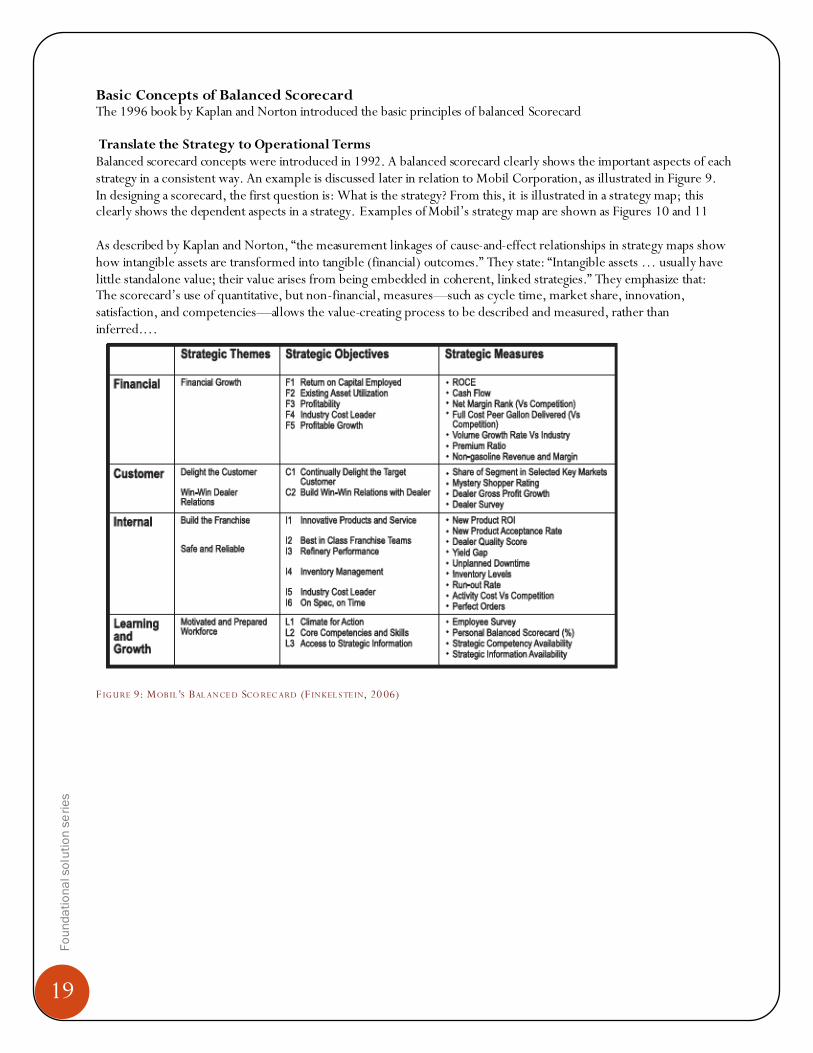
Basic Concepts of Balanced Scorecard The 1996 book by Kaplan and Norton introduced the basic principles of balanced Scorecard
Translate the Strategy to Operational Terms Balanced scorecard concepts were introduced in 1992. A balanced scorecard clearly shows the important aspects of each strategy in a consistent way. An example is discussed later in relation to Mobil Corporation, as illustrated in Figure 9. In designing a scorecard, the first question is: What is the strategy? From this, it is illustrated in a strategy map; this clearly shows the dependent aspects in a strategy. Examples of Mobil’s strategy map are shown as Figures 10 and 11 As described by Kaplan and Norton, ―the measurement linkages of cause-and-effect relationships in strategy maps show how intangible assets are transformed into tangible (financial) outcomes.‖ They state: ―Intangible assets … usually have little standalone value; their value arises from being embedded in coherent, linked strategies.‖ They emphasize that: The scorecard’s use of quantitative, but non-financial, measures—such as cycle time, market share, innovation, satisfaction, and competencies—allows the value-creating process to be described and measured, rather than inferred.…
F IG URE 9: MOB IL 'S BAL ANCE D SCO REC ARD (F INKEL S TE IN, 20 06)
20
Fo
un
da
tio
na
l so
luti
on
se
rie
s
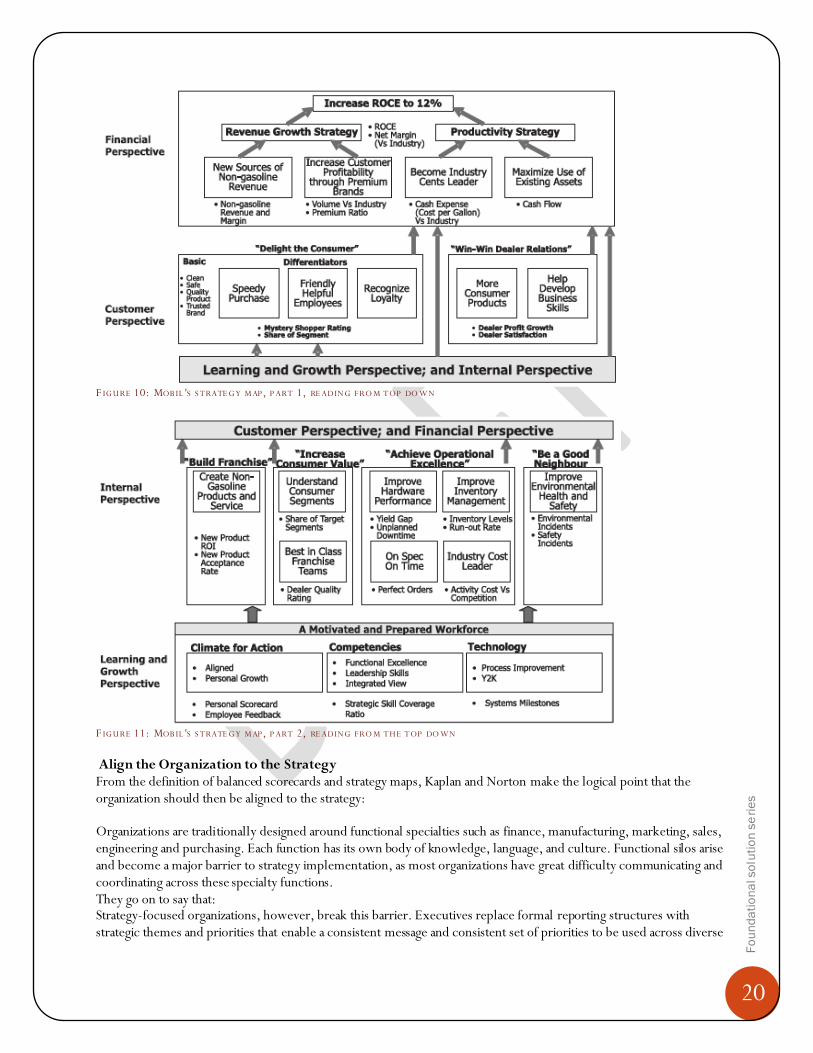
F IG URE 10: MOB IL 'S S TRATE G Y M AP, P ART 1, RE ADING FRO M TOP DO W N
F IG URE 11: MOB IL 'S S TRATE G Y M AP, P ART 2, RE ADING FRO M THE TOP DO WN
Align the Organization to the Strategy
From the definition of balanced scorecards and strategy maps, Kaplan and Norton make the logical point that the organization should then be aligned to the strategy: Organizations are traditionally designed around functional specialties such as finance, manufacturing, marketing, sales, engineering and purchasing. Each function has its own body of knowledge, language, and culture. Functional silos arise and become a major barrier to strategy implementation, as most organizations have great difficulty communicating and coordinating across these specialty functions. They go on to say that: Strategy-focused organizations, however, break this barrier. Executives replace formal reporting structures with strategic themes and priorities that enable a consistent message and consistent set of priorities to be used across diverse
21
Fo
un
da
tio
na
l so
luti
on
se
rie
s
and dispersed organizational units.… Business units and shared service units become linked to the strategy through the common themes and objectives that permeate their scorecards. Make Strategy Everyone’s Everyday Job
The implementation of new strategies requires the cooperative efforts of all managers and their staffs in an organization. Kaplan and Norton ask the important question: ―How do you move strategy from the boardroom to the backroom and thus to the front lines of daily operations and customer service?‖ Balanced scorecards and strategy maps clearly communicate the new strategy to the organization
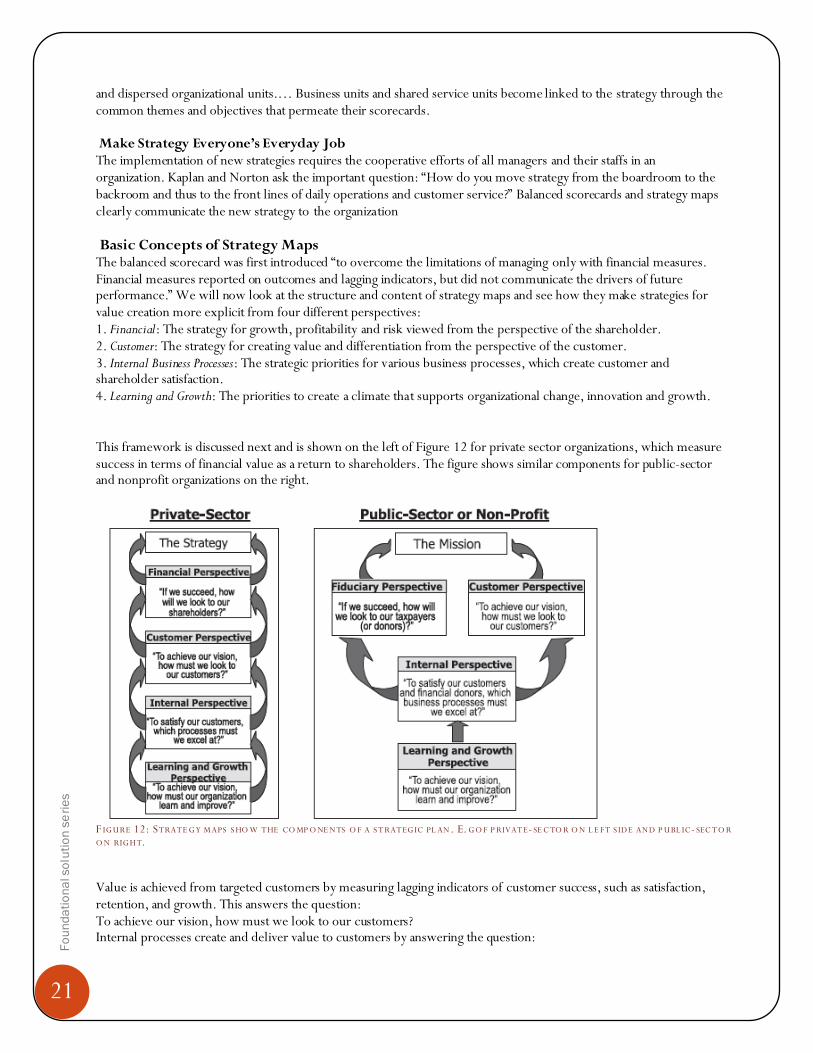
Basic Concepts of Strategy Maps The balanced scorecard was first introduced ―to overcome the limitations of managing only with financial measures. Financial measures reported on outcomes and lagging indicators, but did not communicate the drivers of future performance.‖ We will now look at the structure and content of strategy maps and see how they make strategies for value creation more explicit from four different perspectives: 1. Financial: The strategy for growth, profitability and risk viewed from the perspective of the shareholder. 2. Customer: The strategy for creating value and differentiation from the perspective of the customer. 3. Internal Business Processes: The strategic priorities for various business processes, which create customer and shareholder satisfaction. 4. Learning and Growth: The priorities to create a climate that supports organizational change, innovation and growth. This framework is discussed next and is shown on the left of Figure 12 for private sector organizations, which measure success in terms of financial value as a return to shareholders. The figure shows similar components for public-sector and nonprofit organizations on the right.
F IG URE 12: STRATE G Y M APS S HO W THE CO MP O NE NTS O F A S T RATEG IC PL AN . E. G O F P RIVATE- SE C TO R O N L E FT S IDE AND P UBL IC- SEC TO R
O N RIG HT.
Value is achieved from targeted customers by measuring lagging indicators of customer success, such as satisfaction, retention, and growth. This answers the question: To achieve our vision, how must we look to our customers? Internal processes create and deliver value to customers by answering the question:

22
Fo
un
da
tio
na
l so
luti
on
se
rie
s
To satisfy our customers, which processes must we excel at? The performance of these processes is a leading indicator of subsequent improvements in customer and financial outcomes. Learning and growth objectives describe how people, technology, and the organization all combine to support the strategy. They answer the question: To achieve our vision, how must our organization learn and improve?
F IG URE 13: STRATE G IC M AP S S HO W VALUE C RE ATIO N
Strategy models
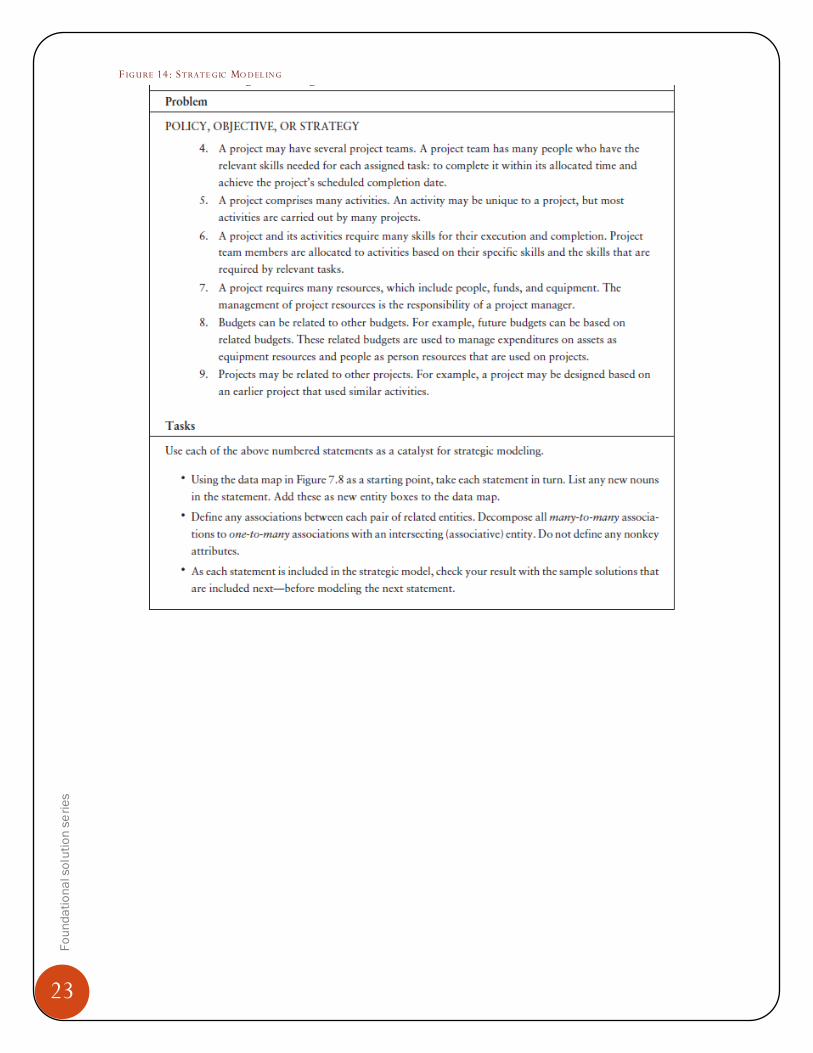
This chapter applies these data modeling concepts to the development of strategic models. It shows how to plan and conduct a business-driven facilitated modeling session. It draws on the knowledge of senior managers and business experts to develop a strategic model that—in their eyes—is a ―picture of the business.‖ It identifies business activities and processes from the strategic model, for prioritization by management. A strategic model applies to the What column for the Planner and Owner rows , where in this latter cell it is referred to as a semantic model or enterprise model
23
Fo
un
da
tio
na
l so
luti
on
se
rie
s
F IG URE 14: STRATE G IC MO DEL ING
24
Fo
un
da
tio
na
l so
luti
on
se
rie
s
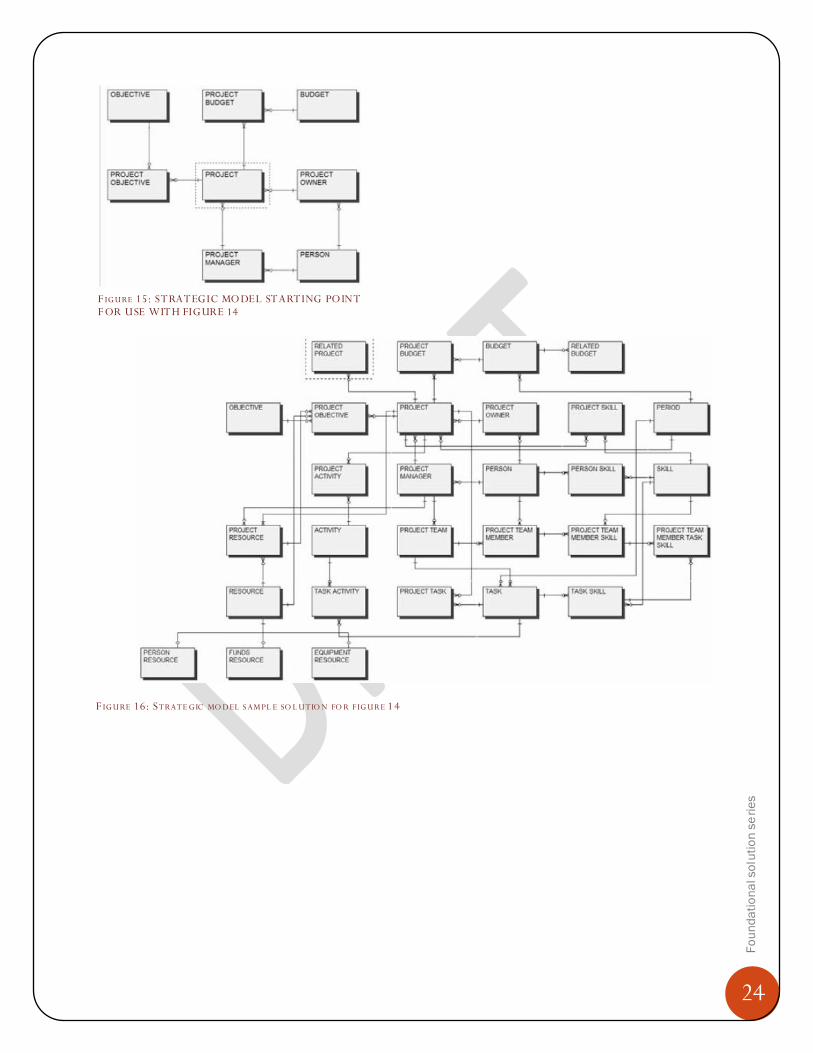
F IG URE 16: STRATE G IC MO DEL S AM PL E SO L UTIO N FO R FIG URE 1 4
F IG URE 15: STRATEGIC MODEL STARTING POINT
F OR USE WITH FIGURE 14

25
Fo
un
da
tio
na
l so
luti
on
se
rie
s
F IG URE 17: IDE NTIFYING B US INE SS AC TIVITIES FROM A S T RATEG IC M O DE L
F IG URE 18: P ROJ EC T P L ANS DE RIVE D FROM S TRATE G IC M O DE L
Notice the project map in the bottom section of Figure 18. This shows each subproject cluster as a highlighted box. Each box represents all entities and their subproject phases that are contained in the relevant cluster in the top part of the figure. The project map displays the stage in a larger project when the relevant subproject will be implemented. We can see that Project Budget Management is a Stage 1 subproject; Project Objective Management is a Stage 2 subproject. We now know the order in which each subproject should be implemented.
26
Fo
un
da
tio
na
l so
luti
on
se
rie
s
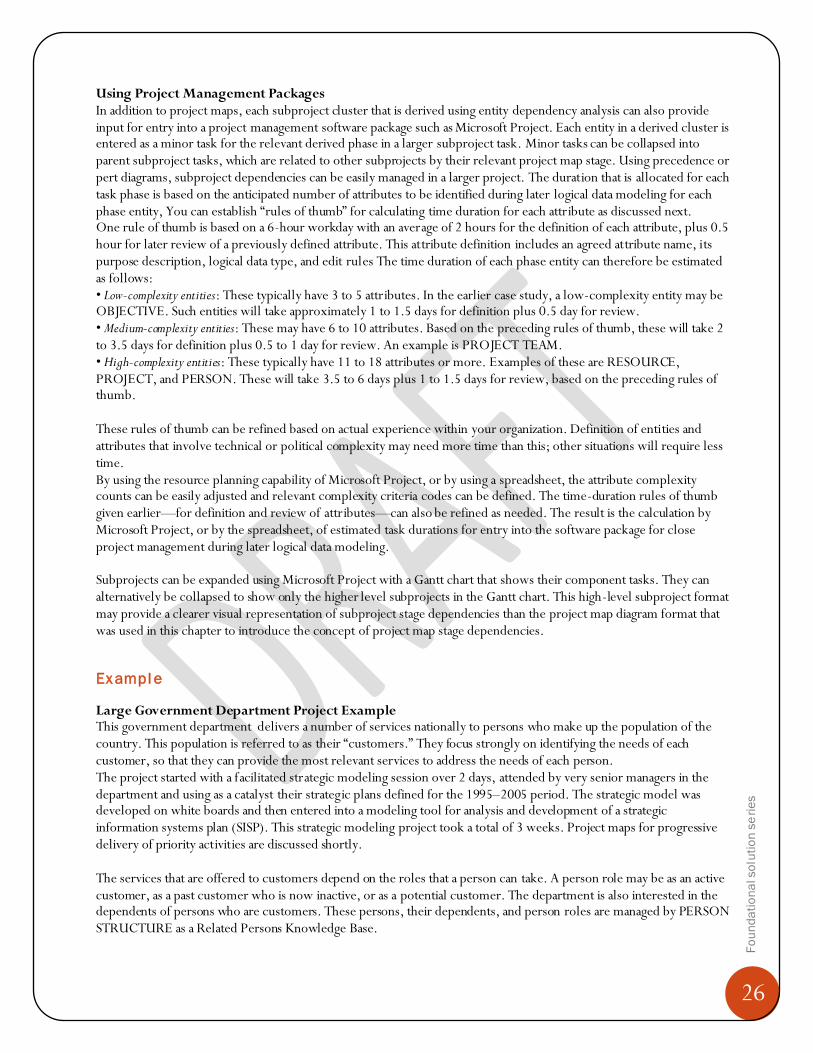
Using Project Management Packages In addition to project maps, each subproject cluster that is derived using entity dependency analysis can also provide input for entry into a project management software package such as Microsoft Project. Each entity in a derived cluster is entered as a minor task for the relevant derived phase in a larger subproject task. Minor tasks can be collapsed into parent subproject tasks, which are related to other subprojects by their relevant project map stage. Using precedence or pert diagrams, subproject dependencies can be easily managed in a larger project. The duration that is allocated for each task phase is based on the anticipated number of attributes to be identified during later logical data modeling for each phase entity, You can establish ―rules of thumb‖ for calculating time duration for each attribute as discussed next. One rule of thumb is based on a 6-hour workday with an average of 2 hours for the definition of each attribute, plus 0.5 hour for later review of a previously defined attribute. This attribute definition includes an agreed attribute name, its purpose description, logical data type, and edit rules The time duration of each phase entity can therefore be estimated as follows: • Low-complexity entities: These typically have 3 to 5 attributes. In the earlier case study, a low-complexity entity may be OBJECTIVE. Such entities will take approximately 1 to 1.5 days for definition plus 0.5 day for review. • Medium-complexity entities: These may have 6 to 10 attributes. Based on the preceding rules of thumb, these will take 2 to 3.5 days for definition plus 0.5 to 1 day for review. An example is PROJECT TEAM. • High-complexity entities: These typically have 11 to 18 attributes or more. Examples of these are RESOURCE, PROJECT, and PERSON. These will take 3.5 to 6 days plus 1 to 1.5 days for review, based on the preceding rules of thumb. These rules of thumb can be refined based on actual experience within your organization. Definition of entities and attributes that involve technical or political complexity may need more time than this; other situations will require less time. By using the resource planning capability of Microsoft Project, or by using a spreadsheet, the attribute complexity counts can be easily adjusted and relevant complexity criteria codes can be defined. The time-duration rules of thumb given earlier—for definition and review of attributes—can also be refined as needed. The result is the calculation by Microsoft Project, or by the spreadsheet, of estimated task durations for entry into the software package for close project management during later logical data modeling. Subprojects can be expanded using Microsoft Project with a Gantt chart that shows their component tasks. They can alternatively be collapsed to show only the higher level subprojects in the Gantt chart. This high-level subproject format may provide a clearer visual representation of subproject stage dependencies than the project map diagram format that was used in this chapter to introduce the concept of project map stage dependencies.
Ex ampl e
Large Government Department Project Example This government department delivers a number of services nationally to persons who make up the population of the country. This population is referred to as their ―customers.‖ They focus strongly on identifying the needs of each customer, so that they can provide the most relevant services to address the needs of each person. The project started with a facilitated strategic modeling session over 2 days, attended by very senior managers in the department and using as a catalyst their strategic plans defined for the 1995–2005 period. The strategic model was developed on white boards and then entered into a modeling tool for analysis and development of a strategic information systems plan (SISP). This strategic modeling project took a total of 3 weeks. Project maps for progressive delivery of priority activities are discussed shortly. The services that are offered to customers depend on the roles that a person can take. A person role may be as an active customer, as a past customer who is now inactive, or as a potential customer. The department is also interested in the dependents of persons who are customers. These persons, their dependents, and person roles are managed by PERSON STRUCTURE as a Related Persons Knowledge Base.
27
Fo
un
da
tio
na
l so
luti
on
se
rie
s
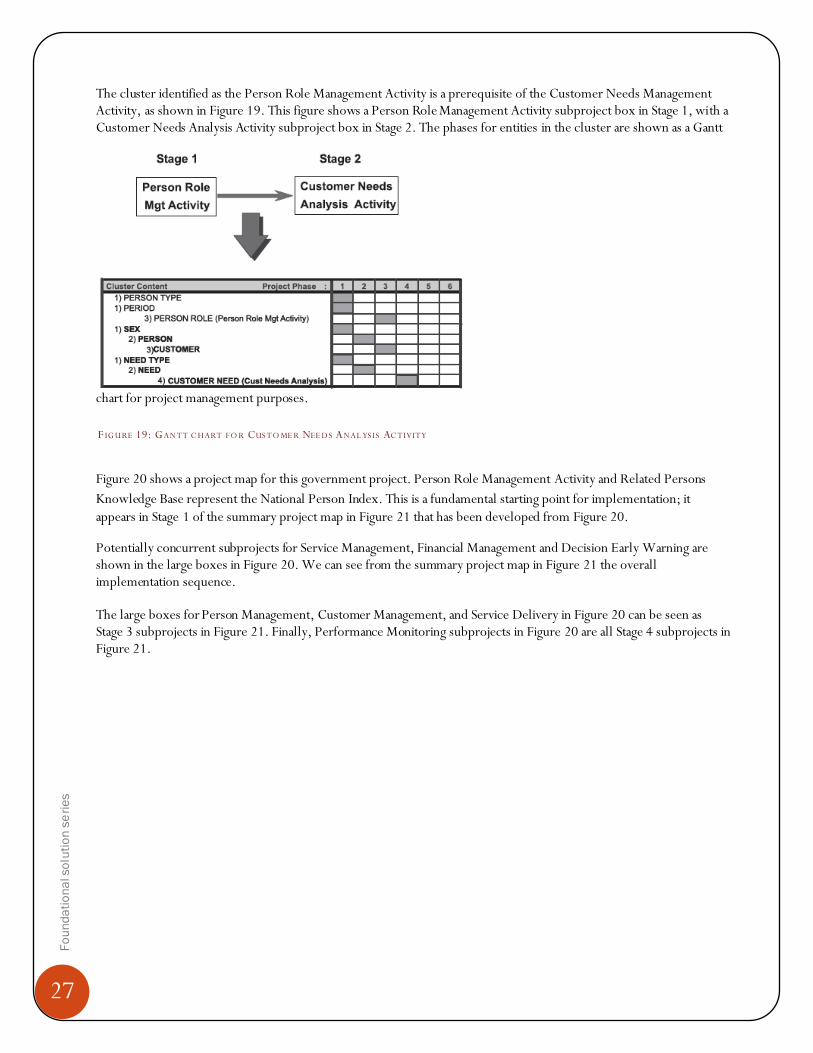
The cluster identified as the Person Role Management Activity is a prerequisite of the Customer Needs Management Activity, as shown in Figure 19. This figure shows a Person Role Management Activity subproject box in Stage 1, with a Customer Needs Analysis Activity subproject box in Stage 2. The phases for entities in the cluster are shown as a Gantt
chart for project management purposes.
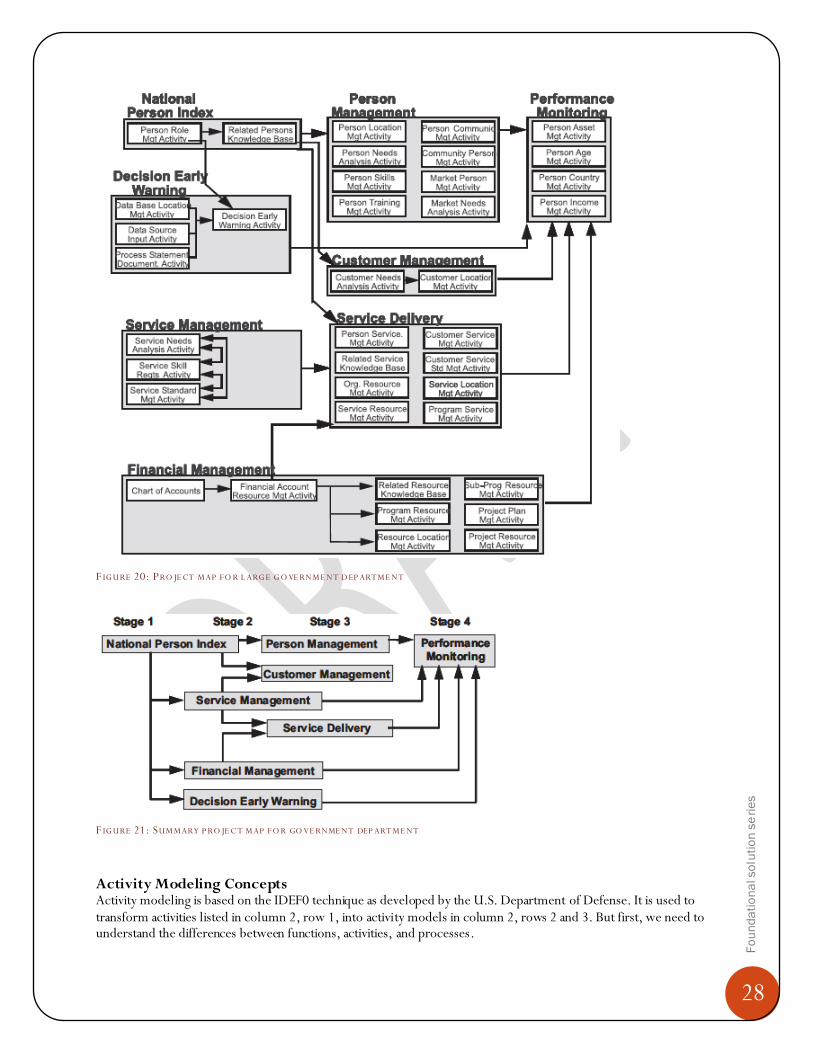
Figure 20 shows a project map for this government project. Person Role Management Activity and Related Persons
Knowledge Base represent the National Person Index. This is a fundamental starting point for implementation; it
appears in Stage 1 of the summary project map in Figure 21 that has been developed from Figure 20.
Potentially concurrent subprojects for Service Management, Financial Management and Decision Early Warning are shown in the large boxes in Figure 20. We can see from the summary project map in Figure 21 the overall implementation sequence. The large boxes for Person Management, Customer Management, and Service Delivery in Figure 20 can be seen as Stage 3 subprojects in Figure 21. Finally, Performance Monitoring subprojects in Figure 20 are all Stage 4 subprojects in Figure 21.
F IG URE 19: GANTT C HART FO R CUS TO ME R NEE DS ANAL YS IS AC TIVITY
28
Fo
un
da
tio
na
l so
luti
on
se
rie
s
F IG URE 20: PRO JE CT M AP FO R L ARG E G O VE RNM E NT D EP ARTM E NT
F IG URE 21: SUM M ARY P RO JE C T M AP F O R GO VE RNME NT DEP ART M E NT
Activity Modeling Concepts Activity modeling is based on the IDEF0 technique as developed by the U.S. Department of Defense. It is used to transform activities listed in column 2, row 1, into activity models in column 2, rows 2 and 3. But first, we need to understand the differences between functions, activities, and processes.

29
Fo
un
da
tio
na
l so
luti
on
se
rie
s
Differences between Functions, Activities, and Processes A functional area is part of the organizational structure in the Who column and Planner row —it groups related functions for management purposes. In turn, functions group related activities in column 2 as illustrated in Figure 22. Figure 22 is an important figure for understanding the essential differences between activities, tasks, and processes. It shows that Business Function A is responsible for activities A1, A2, and B1. Business Function B is responsible for activities B1, B2, and B3. Both Business Function A and B share activity B1, which is a common, reusable activity. Each activity has component tasks that are separately executable. For example, Figure 22 shows that activity A1 has tasks A11 and A12; A2 has tasks A21 and A22; and activity B1 has tasks B11 and B12. Similarly, activity B2 has tasks B21 and B22; and B3 has tasks B31 and B32. However, tasks within activities are not executed until they are explicitly invoked by processes.
F IG URE 22: F UNC TIO NS G RO UP REL AT E D AC TIVITIES . ACTIVITIE S S HO W WHAT IS TO BE DO NE . PROC ES S S HO W HO W TASKS ARE
E XE C UTE D Activities are the building blocks for business process improvement. For this reason, it is important to analyze and understand business activities before any business process improvements can be determined. By using ABC, activities and their relationships can be defined, as well as the costs associated with those activities. Activity-based costing (ABC) is used to decide between process improvements for existing activities—called As-Is activities—and proposed alternative future activities—called To-Be activities. This is illustrated in Figure 23. Each activity can be attached to multiple cost centers, with the associated costs for each activity specified for each cost center. Using ABC, costs can be calculated automatically or costs can be overridden if desired. The As-Is model represents the current state of the organization that is modeled, without any specific process improvement included. It establishes a baseline for later business process improvement actions or programs.
F IG URE 23: AC TIVITY MO DE LS AND ABC ARE US E D FO R P ROC ES S IMP RO VE M ENT
30
Fo
un
da
tio
na
l so
luti
on
se
rie
s
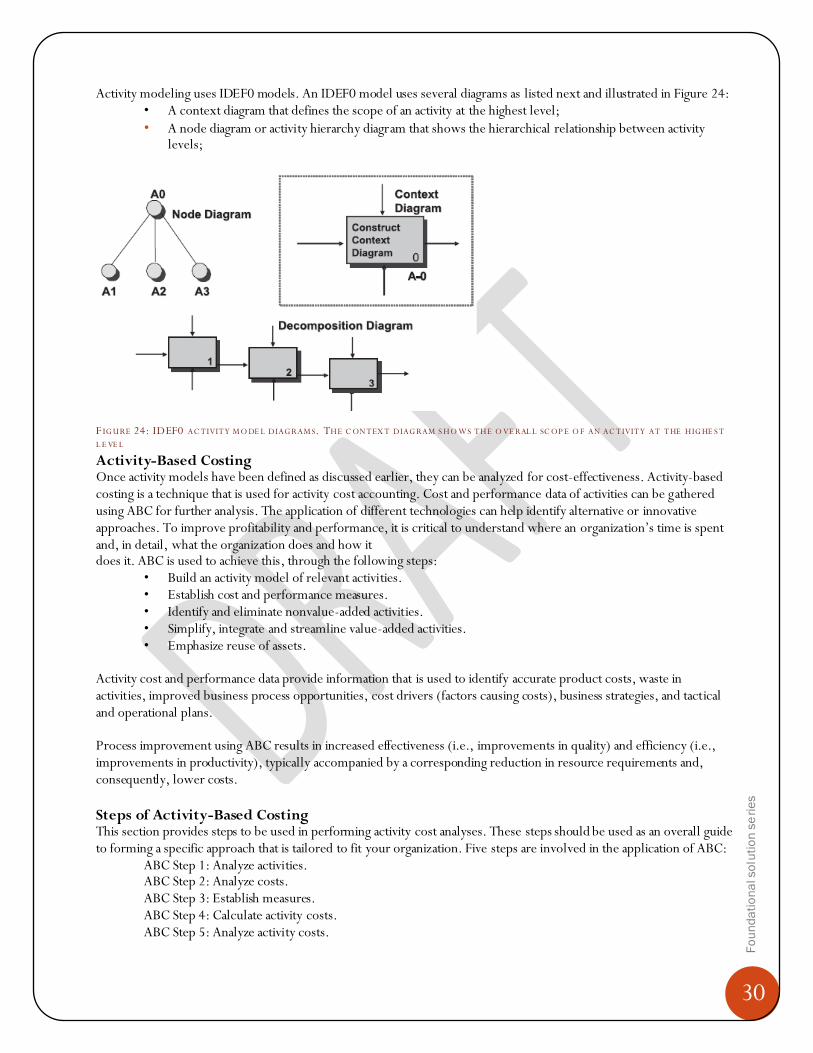
Activity modeling uses IDEF0 models. An IDEF0 model uses several diagrams as listed next and illustrated in Figure 24: • A context diagram that defines the scope of an activity at the highest level;
• A node diagram or activity hierarchy diagram that shows the hierarchical relationship between activity levels;
F IG URE 24: IDEF0 AC TIVITY M O DE L DIAG RAM S. THE C ONTEX T DIAG RAM S HO WS THE O VE RAL L SC OP E O F AN AC TIVITY AT THE HIG HE S T
L E VE L
Activity-Based Costing Once activity models have been defined as discussed earlier, they can be analyzed for cost-effectiveness. Activity-based costing is a technique that is used for activity cost accounting. Cost and performance data of activities can be gathered using ABC for further analysis. The application of different technologies can help identify alternative or innovative approaches. To improve profitability and performance, it is critical to understand where an organization’s time is spent and, in detail, what the organization does and how it does it. ABC is used to achieve this, through the following steps:
• Build an activity model of relevant activities. • Establish cost and performance measures. • Identify and eliminate nonvalue-added activities. • Simplify, integrate and streamline value-added activities. • Emphasize reuse of assets.
Activity cost and performance data provide information that is used to identify accurate product costs, waste in activities, improved business process opportunities, cost drivers (factors causing costs), business strategies, and tactical and operational plans. Process improvement using ABC results in increased effectiveness (i.e., improvements in quality) and efficiency (i.e., improvements in productivity), typically accompanied by a corresponding reduction in resource requirements and, consequently, lower costs.
Steps of Activity-Based Costing This section provides steps to be used in performing activity cost analyses. These steps should be used as an overall guide to forming a specific approach that is tailored to fit your organization. Five steps are involved in the application of ABC:
ABC Step 1: Analyze activities. ABC Step 2: Analyze costs. ABC Step 3: Establish measures. ABC Step 4: Calculate activity costs. ABC Step 5: Analyze activity costs.
31
Fo
un
da
tio
na
l so
luti
on
se
rie
s
ABC Step 1: Analyze Activities This step determines the scope of the activity analysis. It identifies and defines the activities, and then builds and classifies activity models. As defined by James Brimson and John Antos: Activities are a combination of people, technology, supplies, methods, and environment that produce a given service. Activities describe what the enterprise does; that is, the way time is spent and the outputs of the process. This step focuses on developing and documenting the activity models, either the As-Is models, the To-Be models, or both. The activity modeling concepts discussed earlier form the basis for ABC Step 1.
ABC Step 2: Analyze Costs This step identifies the cost elements of each activity and subactivity. The cost basis that is to be used is determined, recasting costs from a departmental or expense-type base to an activity base; it traces all significant costs to activities and determines total resource consumption by activity or subactivity. If an exact tracing of costs to activities is not feasible, costs that cannot be directly linked to an activity are allocated in the best way possible. Once the costs are known, the measures can be established.
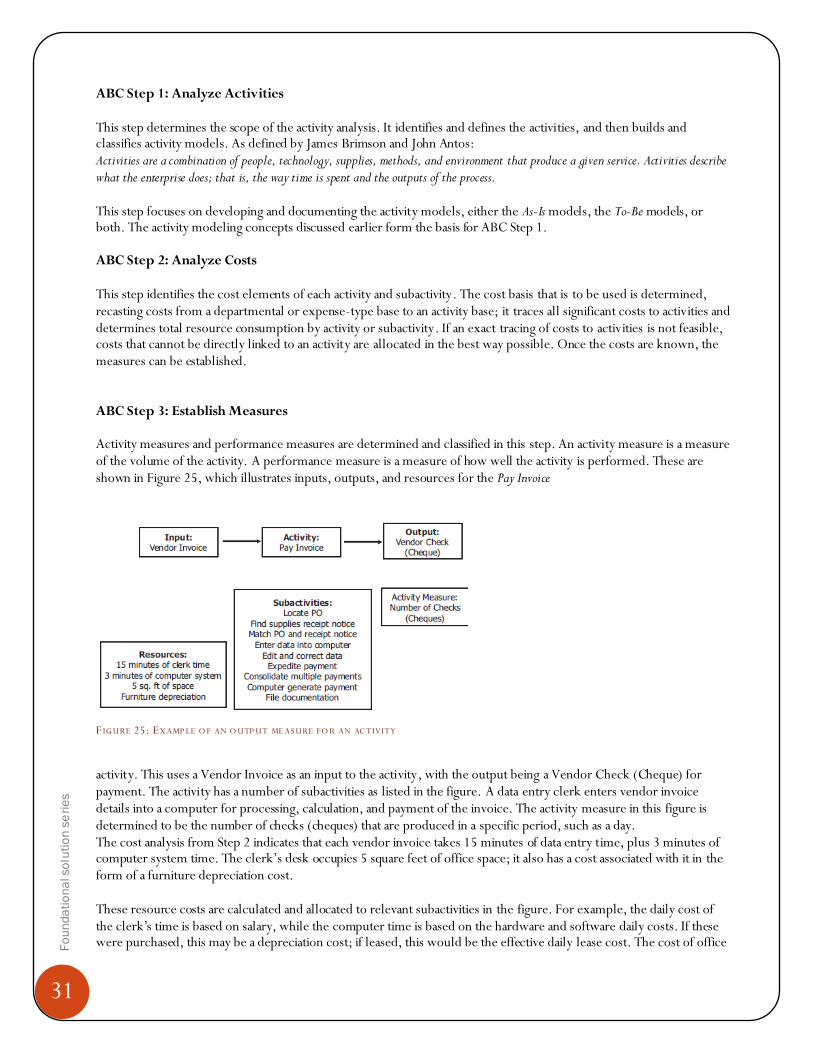
ABC Step 3: Establish Measures Activity measures and performance measures are determined and classified in this step. An activity measure is a measure of the volume of the activity. A performance measure is a measure of how well the activity is performed. These are shown in Figure 25, which illustrates inputs, outputs, and resources for the Pay Invoice
F IG URE 25: EX AMP LE O F AN O UTP UT ME AS URE FO R AN AC TIVITY
activity. This uses a Vendor Invoice as an input to the activity, with the output being a Vendor Check (Cheque) for payment. The activity has a number of subactivities as listed in the figure. A data entry clerk enters vendor invoice details into a computer for processing, calculation, and payment of the invoice. The activity measure in this figure is determined to be the number of checks (cheques) that are produced in a specific period, such as a day. The cost analysis from Step 2 indicates that each vendor invoice takes 15 minutes of data entry time, plus 3 minutes of computer system time. The clerk’s desk occupies 5 square feet of office space; it also has a cost associated with it in the form of a furniture depreciation cost. These resource costs are calculated and allocated to relevant subactivities in the figure. For example, the daily cost of the clerk’s time is based on salary, while the computer time is based on the hardware and software daily costs. If these were purchased, this may be a depreciation cost; if leased, this would be the effective daily lease cost. The cost of office
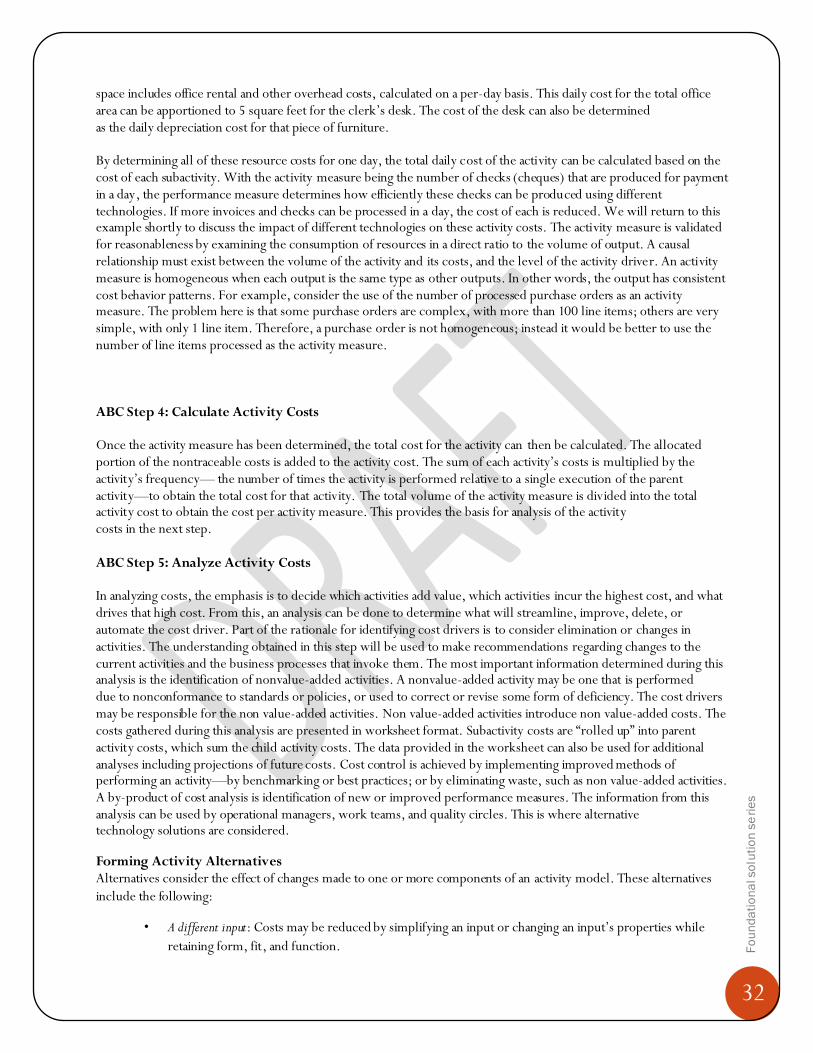
32
Fo
un
da
tio
na
l so
luti
on
se
rie
s
space includes office rental and other overhead costs, calculated on a per-day basis. This daily cost for the total office area can be apportioned to 5 square feet for the clerk’s desk. The cost of the desk can also be determined as the daily depreciation cost for that piece of furniture. By determining all of these resource costs for one day, the total daily cost of the activity can be calculated based on the cost of each subactivity. With the activity measure being the number of checks (cheques) that are produced for payment in a day, the performance measure determines how efficiently these checks can be produced using different technologies. If more invoices and checks can be processed in a day, the cost of each is reduced. We will return to this example shortly to discuss the impact of different technologies on these activity costs. The activity measure is validated for reasonableness by examining the consumption of resources in a direct ratio to the volume of output. A causal relationship must exist between the volume of the activity and its costs, and the level of the activity driver. An activity measure is homogeneous when each output is the same type as other outputs. In other words, the output has consistent cost behavior patterns. For example, consider the use of the number of processed purchase orders as an activity measure. The problem here is that some purchase orders are complex, with more than 100 line items; others are very simple, with only 1 line item. Therefore, a purchase order is not homogeneous; instead it would be better to use the number of line items processed as the activity measure.
ABC Step 4: Calculate Activity Costs Once the activity measure has been determined, the total cost for the activity can then be calculated. The allocated portion of the nontraceable costs is added to the activity cost. The sum of each activity’s costs is multiplied by the activity’s frequency— the number of times the activity is performed relative to a single execution of the parent activity—to obtain the total cost for that activity. The total volume of the activity measure is divided into the total activity cost to obtain the cost per activity measure. This provides the basis for analysis of the activity costs in the next step. ABC Step 5: Analyze Activity Costs In analyzing costs, the emphasis is to decide which activities add value, which activities incur the highest cost, and what drives that high cost. From this, an analysis can be done to determine what will streamline, improve, delete, or automate the cost driver. Part of the rationale for identifying cost drivers is to consider elimination or changes in activities. The understanding obtained in this step will be used to make recommendations regarding changes to the current activities and the business processes that invoke them. The most important information determined during this analysis is the identification of nonvalue-added activities. A nonvalue-added activity may be one that is performed due to nonconformance to standards or policies, or used to correct or revise some form of deficiency. The cost drivers may be responsible for the non value-added activities. Non value-added activities introduce non value-added costs. The costs gathered during this analysis are presented in worksheet format. Subactivity costs are ―rolled up‖ into parent activity costs, which sum the child activity costs. The data provided in the worksheet can also be used for additional analyses including projections of future costs. Cost control is achieved by implementing improved methods of performing an activity—by benchmarking or best practices; or by eliminating waste, such as non value-added activities. A by-product of cost analysis is identification of new or improved performance measures. The information from this analysis can be used by operational managers, work teams, and quality circles. This is where alternative technology solutions are considered.
Forming Activity Alternatives Alternatives consider the effect of changes made to one or more components of an activity model. These alternatives
include the following:
• A different input: Costs may be reduced by simplifying an input or changing an input’s properties while
retaining form, fit, and function.

33
Fo
un
da
tio
na
l so
luti
on
se
rie
s
• A different control: A revised regulation or specification may relax a process tolerance, thus causing a cost
decrease.
• A different by-product: An improved process may reduce or eliminate waste so a by-product can be reused.
For example, in a wood process mill, the sawdust waste can be used to produce other types of wood
products such as in the manufacture of particle board.
• A different mechanism: Changing the skill level of the resources may reduce the time and cost to execute a
task; or automating a process may reduce cost by displacing a manual activity—offset by the process
automation investment cost.
• A different set of activities: Changing activities can eliminate nonvalue-added activities.
Th e Bu sin ess An aly si s B ody of Knowl edg e
There are six knowledge areas defined, that combined, cover the core areas where the IIBA will set professional standards for those performing business analysis:
Enterprise Analysis
Requirements Planning and Management
Requirements Elicitation
Requirements Communication
Requirements Analysis and Documentation
Solution Assessment and Validation Each of the above is elaborated in the following section.
F IG URE 26: BUS INE SS ANAL YS IS BODY O F KNO WL E DG E (ANAL YS IS , 2006 )
Enterprise Analysis:
34
Fo
un
da
tio
na
l so
luti
on
se
rie
s
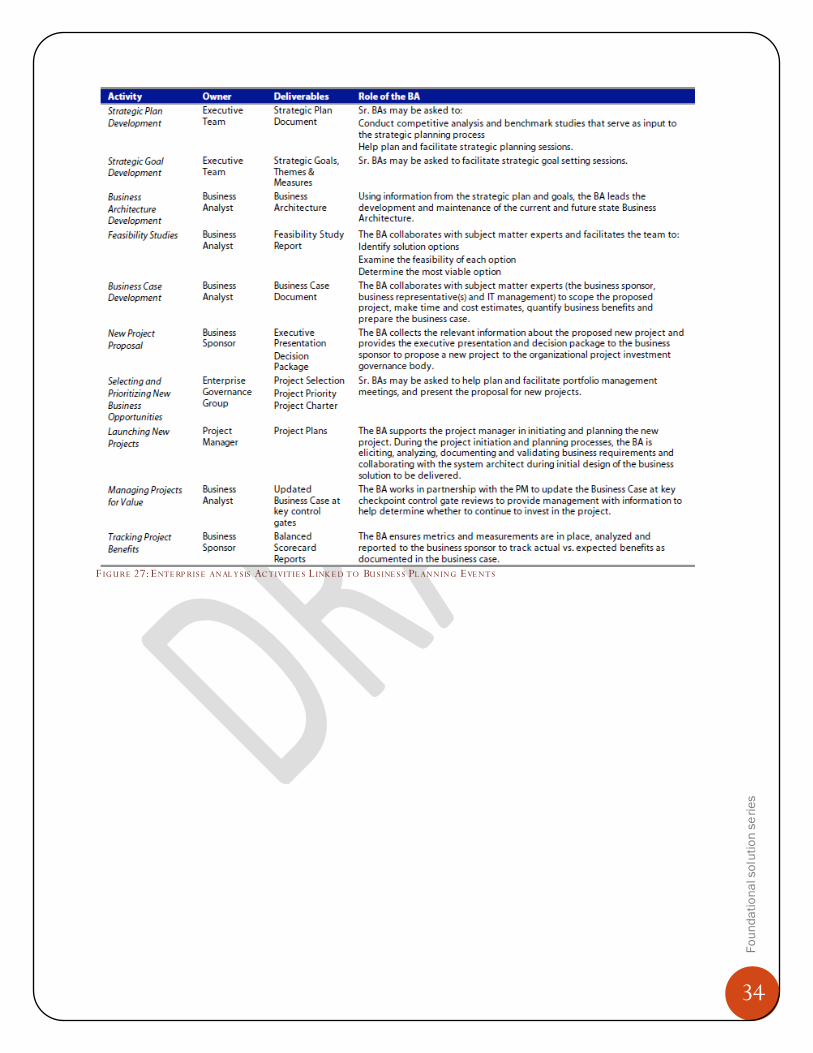
F IG URE 27: ENTE RP RIS E ANAL YS IS AC TIVITIE S L INK E D TO BUS INE S S PL ANNING EVE NTS
35
Fo
un
da
tio
na
l so
luti
on
se
rie
s
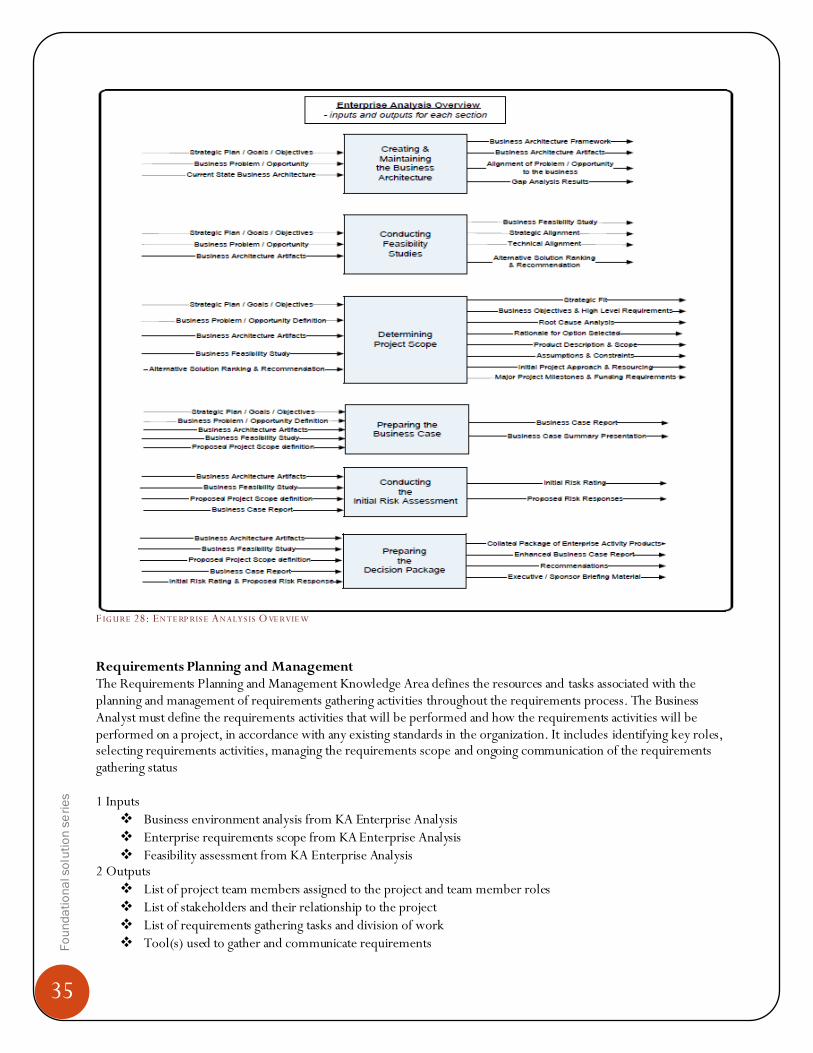
F IG URE 28: ENTE RP RIS E ANALYS IS O VE RVIE W
Requirements Planning and Management The Requirements Planning and Management Knowledge Area defines the resources and tasks associated with the planning and management of requirements gathering activities throughout the requirements process. The Business Analyst must define the requirements activities that will be performed and how the requirements activities will be performed on a project, in accordance with any existing standards in the organization. It includes identifying key roles, selecting requirements activities, managing the requirements scope and ongoing communication of the requirements gathering status 1 Inputs
Business environment analysis from KA Enterprise Analysis
Enterprise requirements scope from KA Enterprise Analysis
Feasibility assessment from KA Enterprise Analysis 2 Outputs
List of project team members assigned to the project and team member roles
List of stakeholders and their relationship to the project
List of requirements gathering tasks and division of work
Tool(s) used to gather and communicate requirements
36
Fo
un
da
tio
na
l so
luti
on
se
rie
s
Requirements Elicitation Eliciting requirements is a key task in business analysis. Because the requirements serve as the foundation for the solution to the business needs it is essential that the requirements be complete, clear, correct, and consistent. Leveraging proven means to elicit requirements will help meet these quality goals. The word elicit is defined: 1. to draw forth or bring out (something latent or potential) 2. to call forth or draw out (as information or a response) These definitions highlight the need to actively engage the stakeholders in defining requirements. 1 Input to Requirements Elicitation The techniques included in this Requirements Elicitation KA can be used to effectively elicit many types of requirements. Input to eliciting Enterprise Analysis requirements: A variety of means may be used to elicit business requirements and are dependent on the type of study, e.g. Creating a Business Architecture or Identifying Business Opportunity. Input to eliciting user requirements: In the situation where Enterprise Analysis has been completed and the project is ready to elicit user requirements, the following inputs are typical: The Enterprise Analysis KA activities define the overall scope of the problem and solution domain and the
goals. The business analyst uses the scope definition and goals to provide the boundaries for all requirements elicitation.
The Requirements Planning and Management KA activities identify and describe:
the stakeholders,
the requirements documentation and the deliverables that will be
created,
the appropriate technique(s) to elicit requirements that will be
employed,
the requirements traceability strategy that will be followed,
the requirements’ attributes that will be captured, and
the outputs of requirements elicitation. 2 Output of Requirements Elicitation Unlike other knowledge areas, e.g. Requirements Analysis and Documentation, the Requirements Elicitation KA does not have a prescribed set of deliverables. It is expected that the business analyst will reach a point during requirements elicitation when he/she feels that sufficient material has been elicited from the business experts to enable analysis and documentation to begin. The combined results of all the elicitation techniques used will serve as input to building the selected analytical models. Missing, incomplete or incorrect requirements will ideally be exposed during the analysis activities thus requiring additional requirements elicitation. For example, Requirements Workshops start by eliciting requirements and often end with the creation of models such as activity diagrams, prototypes, or even data models. Elicitation can include the details of the Product being sold, features of the product, current inventory and mode of operations, counter, websales, Phone calls, etc. How these are being managed NOW Requirements Analysis and Documentation The tasks defined as part of the Requirements Analysis and Documentation KA include:
Structure requirements
Create business domain model
37
Fo
un
da
tio
na
l so
luti
on
se
rie
s
Analyze user requirements
Analyze functional requirements
Analyze supplementary quality of service requirements
Determine assumptions and constraints
Determine requirements attributes
Document requirements
Validate requirements
Verify requirements
This will include analysis of the data captures during elicitation and how best these can be managed, stores arrangement of products, sales strategy, integrating communications and SMS alerts for web purchases and Phone call diverts and auto responders. An office Environment can be setup so that the Store is NOW a Managed store with Office like management. Flexibility of user to see products, and do an over the counter inquiry using self guided kiosks that even a child can operate. Not exactly an investment but can be a microphone that can pick the need and guide the user to the right place and choosing the item quickly. Requirements Communication 1 Inputs
Requirements document(s) from the Knowledge Area Requirements Analysis and Documentation
Notes from requirements gathering sessions from the Knowledge Area
Requirements Gathering
Project stakeholder analysis from the Knowledge Area Requirements Planning and Management
Communication plan from the Knowledge Area Requirements Planning and Management
2 Outputs
Amendments to requirements (going back to the Knowledge Area Requirements Analysis and Documentation)
Outstanding requirements issues needing further gathering, analysis and documentation
Project scope changes (going back to the Knowledge Area Requirements Planning and Management)
Requirements package (used in the Knowledge Area Requirements Implementation)
Signoff/approval of requirements
Solution Assessment and Validation
1 Inputs Approved design
Constructed build
High level understanding of technology potential
Implementation plan
Organization’s RFP/RFQ standards
Organization’s usability requirements
Prioritized, approved business requirements
QA standards and procedures

38
Fo
un
da
tio
na
l so
luti
on
se
rie
s
Recommended design
Technical constraints
Technology solution options
Test plan
2 Outputs
Assessment of the solution usability
Assured compliance with organizational standards
Conversion plan
Description of software releases/phases
Employee procedure documentation
Employee training
Feedback on problems/issues/concerns
High level requirements for next release
Implemented solution
Recommendation that aligns with requirements
RFP/RFQ
Solution design
Test plan aligned to requirements
Tools for Enterprise Analysis
There are two basic tools available for analyzing your enterprise in System Architect 2001: Activity Based Costing and Simulation. ABC: Activity Based Costing (ABC) introduces activities as an intermediary for assigning costs to products. ABC is based on the premise that activities cause costs through the consumption of resources and that the demands for products cause these activities to be performed. This approach gives insight into how effectively and efficiently resources are used and how activities in the enterprise contribute to the cost of the business.
F IG URE 29: AC TIVITY BASE D CO S TING EX AM PLE
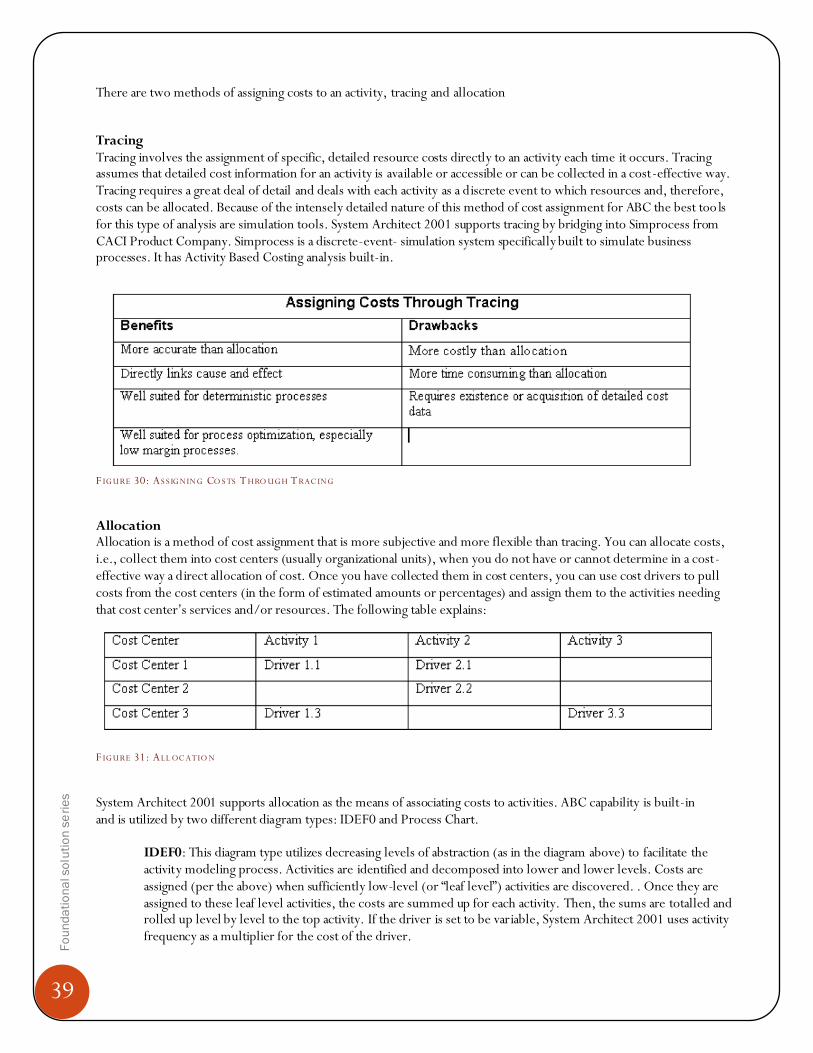
39
Fo
un
da
tio
na
l so
luti
on
se
rie
s
There are two methods of assigning costs to an activity, tracing and allocation
Tracing Tracing involves the assignment of specific, detailed resource costs directly to an activity each time it occurs. Tracing assumes that detailed cost information for an activity is available or accessible or can be collected in a cost-effective way. Tracing requires a great deal of detail and deals with each activity as a discrete event to which resources and, therefore, costs can be allocated. Because of the intensely detailed nature of this method of cost assignment for ABC the best too ls for this type of analysis are simulation tools. System Architect 2001 supports tracing by bridging into Simprocess from CACI Product Company. Simprocess is a discrete-event- simulation system specifically built to simulate business processes. It has Activity Based Costing analysis built-in.
F IG URE 30: AS S IG NING CO S TS T HRO UG H T RAC ING
Allocation Allocation is a method of cost assignment that is more subjective and more flexible than tracing. You can allocate costs, i.e., collect them into cost centers (usually organizational units), when you do not have or cannot determine in a cost-effective way a direct allocation of cost. Once you have collected them in cost centers, you can use cost drivers to pull costs from the cost centers (in the form of estimated amounts or percentages) and assign them to the activities needing that cost center’s services and/or resources. The following table explains:
F IG URE 31: ALL OC ATIO N
System Architect 2001 supports allocation as the means of associating costs to activities. ABC capability is built-in and is utilized by two different diagram types: IDEF0 and Process Chart.
IDEF0: This diagram type utilizes decreasing levels of abstraction (as in the diagram above) to facilitate the activity modeling process. Activities are identified and decomposed into lower and lower levels. Costs are assigned (per the above) when sufficiently low-level (or ―leaf level‖) activities are discovered. . Once they are assigned to these leaf level activities, the costs are summed up for each activity. Then, the sums are totalled and rolled up level by level to the top activity. If the driver is set to be variable, System Architect 2001 uses activity frequency as a multiplier for the cost of the driver.

40
Fo
un
da
tio
na
l so
luti
on
se
rie
s
Process Chart: This diagram type does not require the use of abstraction for activity analysis. Rather, the activity is laid out as an end-to-end process flow which may all exist on a single level of abstraction. Costs for an activity (Elementary Business Process in terms of that method) are summed up and displayed. The frequency multiplier is used as described above.
Simulation Process Simulation is the technique which allows representation of processes, people, and technology in a dynamic computer model. A model, when simulated, mimics the operations of the business. This is accomplished by stepping through the events in compressed time while displaying an animated picture of the flow. Because simulation software keeps track of statistics about model elements, performance metrics can be evaluated by analyzing the model output data. Like Activity Based Costing, process simulation embodies the concept that a business is a series of inter-related processes, and that these processes consist of activities which convert inputs to outputs. The process simulation approach manifests this concept and builds on it by organizing and analyzing cost information on an activity basis.
Procedure for Business Process Modeling and Analysis Step #1. Create A Process Model To create a process model, you start with mapping the business processes. Then, you drill-down into the processes where sub-processes are defined. Describing the objects that flow through the processes and linking the processes using connectors facilitates the workflow definition. Finally, you define the resources and assign them to the activities where they are used. Step #2. Simulate The Process Before simulating a model, you need to select the performance measures of interest. Most simulation tools automatically generate cycle time, entity count, resource utilization and cost reports. More sophisticated tools allow you to generate custom reports for tracking service levels or in-process inventory. For example, you may be interested in throughput and cycle time reports for entities, activity costs for processes, and utilization report resources. When you run a simulation, the process simulation tool automatically verifies your model and begins advancing the simulation clock. During the simulation, you see an animated picture of the flow that helps you visualize the process in motion. You can also have process simulation generate real-time graphs, letting you view key performance measures, during the simulation.
Step #3. Analyze the Results When the simulation is over, you can bring up the model results and analyze the performance measures of interest. To draw useful and correct conclusions from simulation results requires statistical input and output data analysis. Knowing which distribution to use for representing activity times or how many data points to collect is important in developing a statistically valid model. And, knowing how long to simulate a process or how many replications to run becomes significant for producing valid and accurate results. Step #4. Evaluate Alternatives The strength of process simulation is in its ability to incorporate stochastic (i.e. conjectural) situations in the model. It cannot offer an optimum solution. In order to find the best solution, one has to determine various scenarios and simulate them. This is where Design of Experiments can aid in searching and finding the best solution. With the aid of Design of Experiments, one can also compare the performance measures from Current State with measures from Future State alternatives.

41
Fo
un
da
tio
na
l so
luti
on
se
rie
s
Govern an ce of IT Sy st ems
IT GOVERNANCE A structure of relationships and processes to direct and control the enterprise in order to achieve the enterprise’s goals by adding value while balancing risk versus return over IT and its processes Specifically, COBIT provides Maturity Models for control over IT processes, so that management can map where the organisation is today, where it stands in relation to the best in class in its industry and to international standards and where the organisation wants to be; Critical Success Factors, which define the most important management-oriented implementation guidelines to achieve control over and within its IT processes; Key Goal Indicators, which define measures that tell management—after the fact—whether an IT process has achieved its business requirements; and Key Performance Indicators, which are lead indicators that define measures of how well the IT process is performing in enabling the goal to be reached COBIT also contains an Implementation Tool Set that provides lessons learned from those organisations that quickly and successfully applied COBIT in their work environments. It has two particularly useful tools—Management Awareness Diagnostic and IT Control Diagnostic—to assist in analysing an organisation’s IT control environment.
F IG URE 32: CO BIT (CO M M ITTEE , 2000)
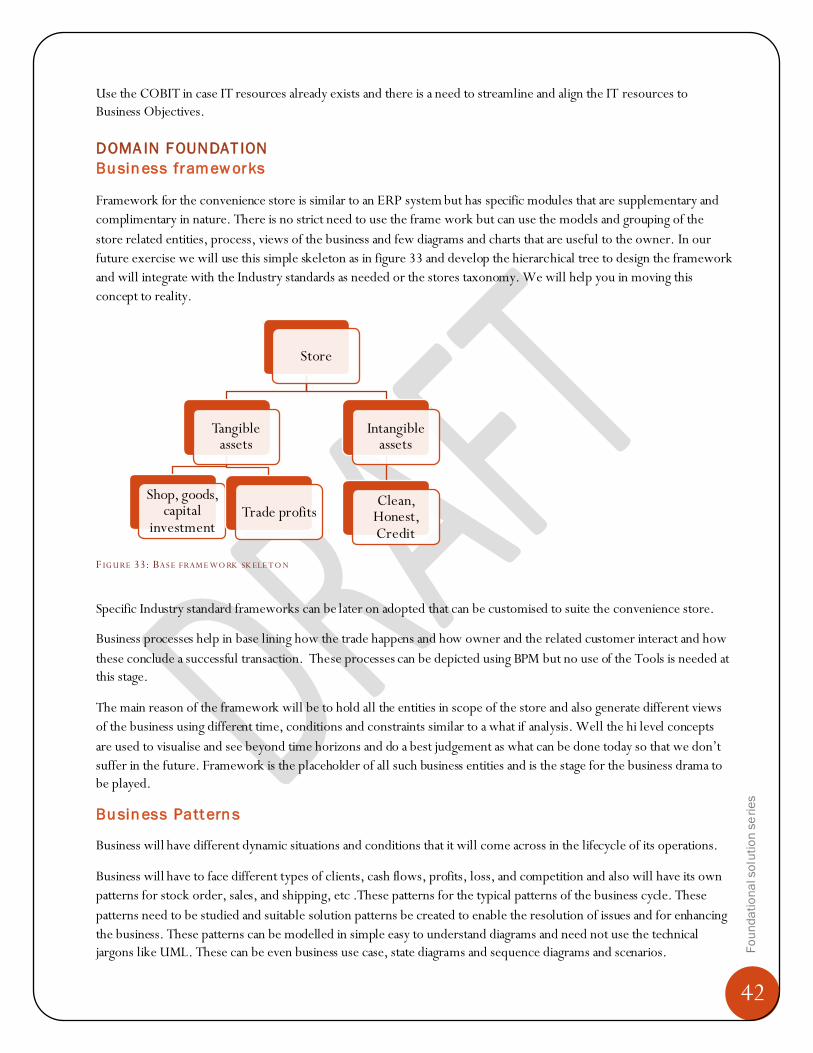
42
Fo
un
da
tio
na
l so
luti
on
se
rie
s
Use the COBIT in case IT resources already exists and there is a need to streamline and align the IT resources to
Business Objectives.
DOMA IN FOUNDAT ION
Bu sin ess framew orks
Framework for the convenience store is similar to an ERP system but has specific modules that are supplementary and
complimentary in nature. There is no strict need to use the frame work but can use the models and grouping of the
store related entities, process, views of the business and few diagrams and charts that are useful to the owner. In our
future exercise we will use this simple skeleton as in figure 33 and develop the hierarchical tree to design the framework
and will integrate with the Industry standards as needed or the stores taxonomy. We will help you in moving this
concept to reality.
F IG URE 33: BAS E FRAM E WO RK SK ELE T O N
Specific Industry standard frameworks can be later on adopted that can be customised to suite the convenience store.
Business processes help in base lining how the trade happens and how owner and the related customer interact and how
these conclude a successful transaction. These processes can be depicted using BPM but no use of the Tools is needed at
this stage.
The main reason of the framework will be to hold all the entities in scope of the store and also generate different views
of the business using different time, conditions and constraints similar to a what if analysis. Well the hi level concepts
are used to visualise and see beyond time horizons and do a best judgement as what can be done today so that we don’t
suffer in the future. Framework is the placeholder of all such business entities and is the stage for the business drama to
be played.
Bu sin ess Patt ern s
Business will have different dynamic situations and conditions that it will come across in the lifecycle of its operations.
Business will have to face different types of clients, cash flows, profits, loss, and competition and also will have its own
patterns for stock order, sales, and shipping, etc .These patterns for the typical patterns of the business cycle. These
patterns need to be studied and suitable solution patterns be created to enable the resolution of issues and for enhancing
the business. These patterns can be modelled in simple easy to understand diagrams and need not use the technical
jargons like UML. These can be even business use case, state diagrams and sequence diagrams and scenarios.
Store
Tangible assets
Shop, goods, capital
investmentTrade profits
Intangible assets
Clean, Honest, Credit
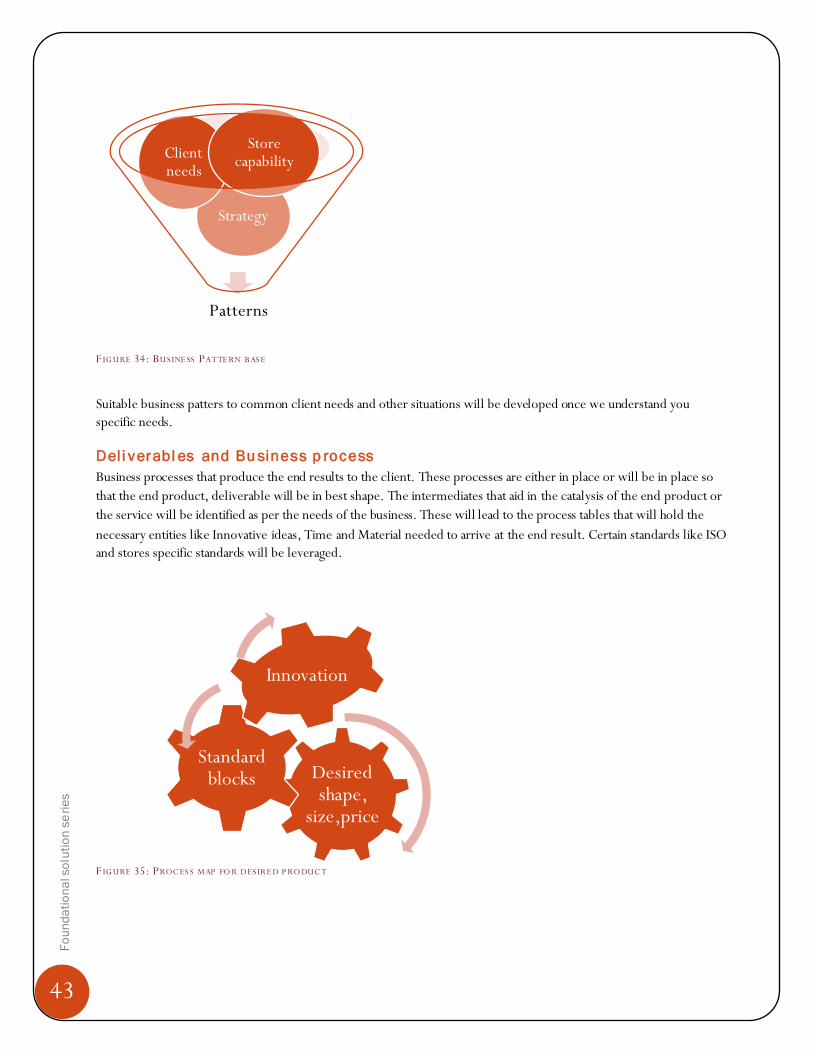
43
Fo
un
da
tio
na
l so
luti
on
se
rie
s
F IG URE 34: BUS INE SS PATTE RN B AS E
Suitable business patters to common client needs and other situations will be developed once we understand you
specific needs.
Deli verabl es and Bu siness p rocess
Business processes that produce the end results to the client. These processes are either in place or will be in place so
that the end product, deliverable will be in best shape. The intermediates that aid in the catalysis of the end product or
the service will be identified as per the needs of the business. These will lead to the process tables that will hold the
necessary entities like Innovative ideas, Time and Material needed to arrive at the end result. Certain standards like ISO
and stores specific standards will be leveraged.
F IG URE 35: PROC ES S M AP FO R DES IRE D P RO DUC T
Patterns
Strategy
Client needs
Store capability
Desired shape,
size,price
Standard blocks
Innovation

44
Fo
un
da
tio
na
l so
luti
on
se
rie
s
N on fun cti on al f eatures
Features that cannot be accounted or described physically like taste, smell, hospitality, need also be considered from a
Product sales point. Well we cannot impose those on the Manufacturer but can advertise that these are present.
Providing knowledge about the goods as an Add on service, providing menus, other things that one can cook with that
ITEM also will help sell more. Services that can make people experiment, mix and create their own flavours will boost
your sales. So the maturity and variety of sales material mix is needed for non functional features.
This leads to better and flexible way of using the same goods purchase at your store and customer might prefer to shop in at your store. Non functional features at times play more value than the real tangible product.
INTE RIOR DECORUM FOUNDATIONS
This foundation will concentrate on the shop layout, aesthetics and suitable selection of landscape for product storage
display, samples and arrangement of all the entities and also the soft aspects of the business. It takes you through the
details of the experiences of shoppers and how the demographic ratings have occurred in the past. It shows the detailed
sketch and layout plans for floor occupancy and optimum arrangement of the shop resources like men, material, time
and price for the best comfort of the client. Details are provided in the following paragraphs.
In tegrati on f eatu res
How men, material, process, technology, billing cycle, and the typical shoppers are glued in the best possible way so
that the trade occurs in the most satisfied way and with least resistance from competition. The overall integrated view
will be simple to understand and manage. Details of the features from the base view as shown in figure 36 will be
tabulated and the balance will be chalked out to retain the Best view of the Store and the highest level of customer
service will be provided.
F IG URE 36: STO RE AS AN INTE G RATE D VIE W
L and scap e f eatu res
Beautification, product layout, displays of non commercials, use of colors, shape, size, font type, size so that these can
become a part of the Brand. If another sub branch will be opened the same brand can be retained and success can be
repeated.
Products
Technology
Sales,
Marketing
Strategy, Vision
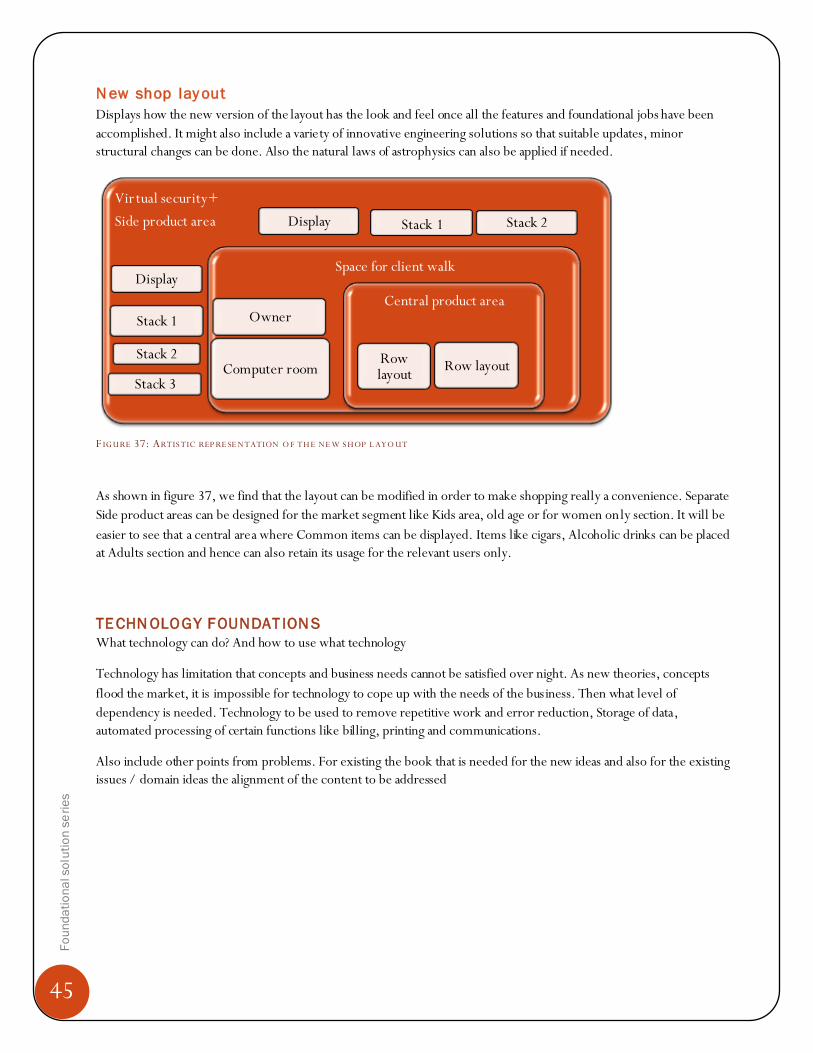
45
Fo
un
da
tio
na
l so
luti
on
se
rie
s
N ew shop lay out
Displays how the new version of the layout has the look and feel once all the features and foundational jobs have been
accomplished. It might also include a variety of innovative engineering solutions so that suitable updates, minor
structural changes can be done. Also the natural laws of astrophysics can also be applied if needed.
F IG URE 37: ARTIS TIC REP RE SE NTATION O F TH E NE W S HOP L AYO UT
As shown in figure 37, we find that the layout can be modified in order to make shopping really a convenience. Separate
Side product areas can be designed for the market segment like Kids area, old age or for women only section. It will be
easier to see that a central area where Common items can be displayed. Items like cigars, Alcoholic drinks can be placed
at Adults section and hence can also retain its usage for the relevant users only.
TE CHN OLOGY FOUNDAT ION S
What technology can do? And how to use what technology
Technology has limitation that concepts and business needs cannot be satisfied over night. As new theories, concepts
flood the market, it is impossible for technology to cope up with the needs of the business. Then what level of
dependency is needed. Technology to be used to remove repetitive work and error reduction, Storage of data,
automated processing of certain functions like billing, printing and communications.
Also include other points from problems. For existing the book that is needed for the new ideas and also for the existing
issues / domain ideas the alignment of the content to be addressed
Virtual security+
Side product area Display Stack 1 Stack 2
Display
Stack 1
Stack 2
Stack 3
Space for client walk
Owner
Computer room
Central product area
Row layout
Row layout
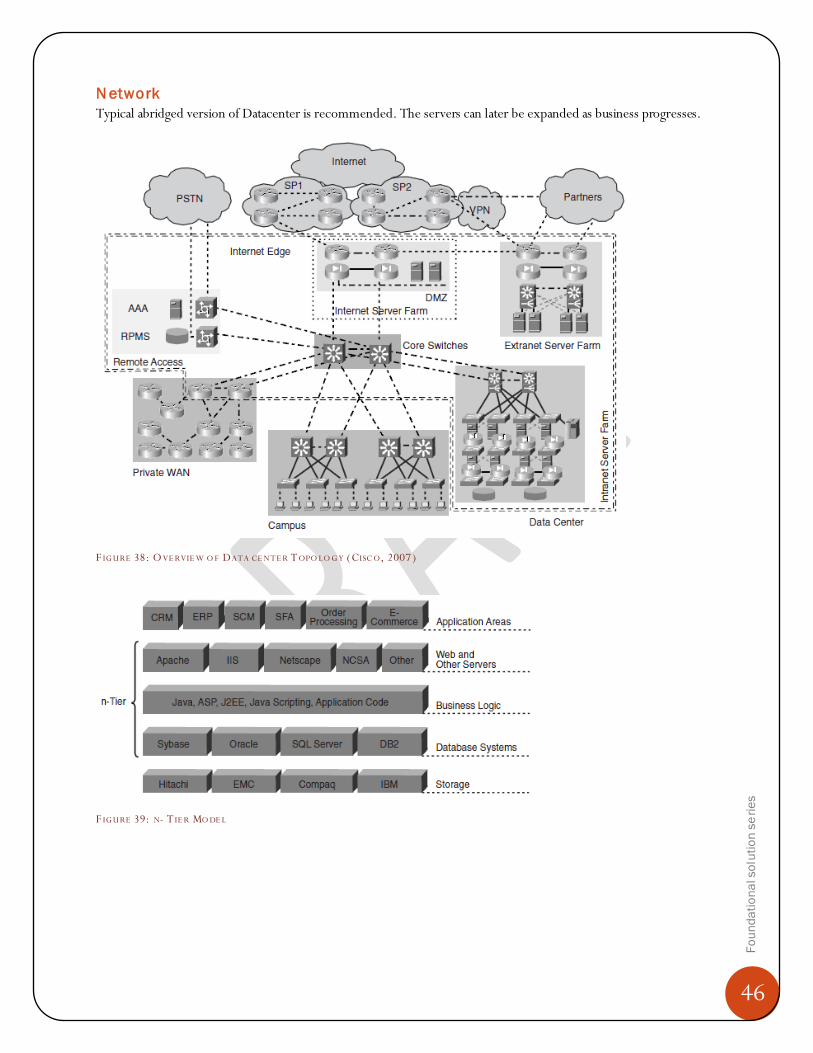
46
Fo
un
da
tio
na
l so
luti
on
se
rie
s
N etwork
Typical abridged version of Datacenter is recommended. The servers can later be expanded as business progresses.
F IG URE 38: O VE RVIE W O F DATA CE NTE R T OPO LO G Y (CISC O, 2007 )
F IG URE 39: N- T IE R MO DE L
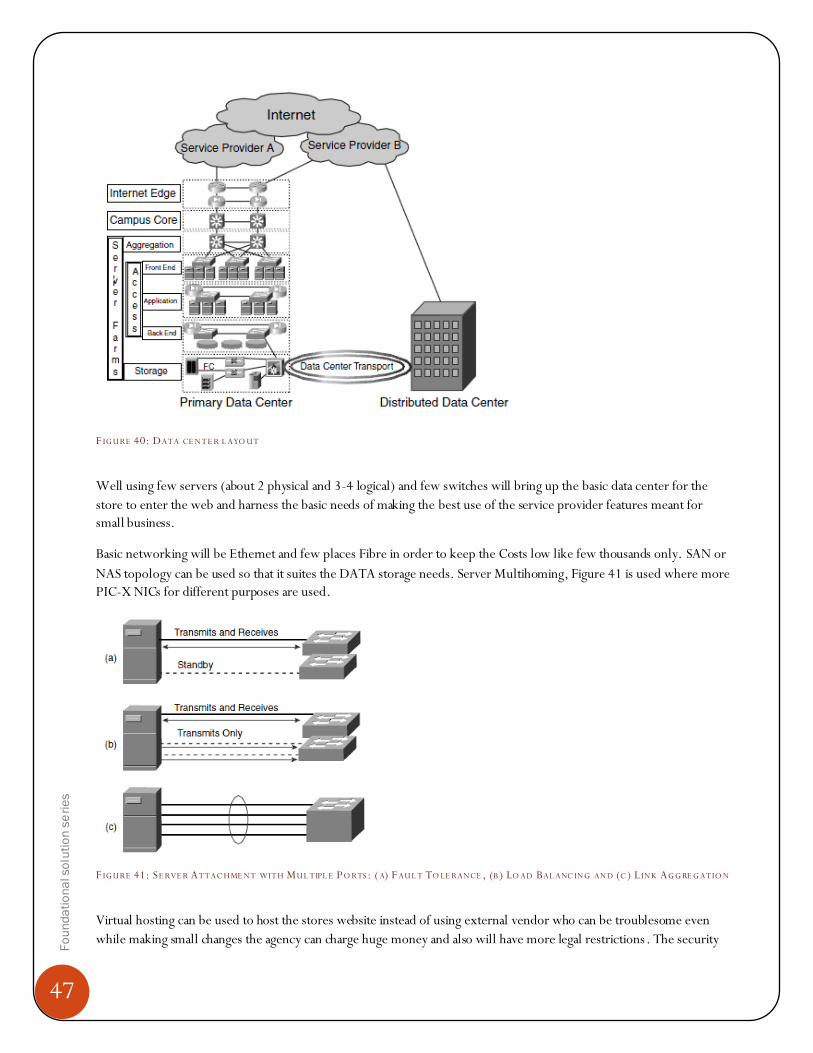
47
Fo
un
da
tio
na
l so
luti
on
se
rie
s
F IG URE 40: DATA CE NTE R L AYO UT
Well using few servers (about 2 physical and 3-4 logical) and few switches will bring up the basic data center for the
store to enter the web and harness the basic needs of making the best use of the service provider features meant for
small business.
Basic networking will be Ethernet and few places Fibre in order to keep the Costs low like few thousands only. SAN or
NAS topology can be used so that it suites the DATA storage needs. Server Multihoming, Figure 41 is used where more
PIC-X NICs for different purposes are used.
F IG URE 41: SE RVE R ATTAC HME NT WITH MUL TIPL E PO RTS : ( A) F AUL T TO LE RANCE , (B ) LO AD BAL ANC ING AND (C ) L INK AG G RE G ATIO N
Virtual hosting can be used to host the stores website instead of using external vendor who can be troublesome even
while making small changes the agency can charge huge money and also will have more legal restrictions. The security

48
Fo
un
da
tio
na
l so
luti
on
se
rie
s
for the data center hosted within your premises might be of concern but can be compromised to the sales done and the
personal home setup of the server.
Home edition data center is our ultimate aim to attain the self dependency and self efficiency is doing business without
external distractions of money makers. Its better to have a webserver at 90% efficiency and doing business and retaining
the sales profit to self rather than keeping the webserver at 99% efficiency and pay half of the profits to the vendor.
Typical servers that can be loaded on single machine are: Web server, App server, DB server, Email server, File server,
Directory server, DNS server, DHCP, RADIUS, Authentication server, Streaming server.
Collapsed Multitier design:
A collapsed multitier design is one in which all the server farms are directly connected at the access layer to the
aggregation switches, and there is no physical separation between the Layer 2 switches that support the different tiers.
F IG URE 42: CO M MO N SE RVE R F ARM ENVIRO NME NT
F IG URE 43: COL L AP SE D MUL TI TIE R DES IG N

49
Fo
un
da
tio
na
l so
luti
on
se
rie
s
Figure 43 presents the collapsed design used as economical design.
F IG URE 44: BL ADE CHASS IS UPL INK CO NNE C TIVITY
Option a in Figure 44 shows all the uplinks from both blade chassis’ Ethernet switches connected to a single switch in
the IP Network. This allows the uplinks to be channelled. In contrast, option b, shows each blade chassis Ethernet
switch connected to each IP network switch, also avoiding a single point of failure. This presents the advantage of having
a direct link to either switch A or B, thus avoiding unnecessary hops. Additionally, if each blade chassis Ethernet switch
supports more than two uplinks, they can also be channelled to switches A and B for greater redundancy and higher
bandwidth.
All of these can be put in about 2 server boxes or a large server based on the capacity needed and the transactions. A
separate VLAN can be designed using the IpV6 mode.
F IG URE 45: H IG H AVAIL AB IL ITY CL US TE R
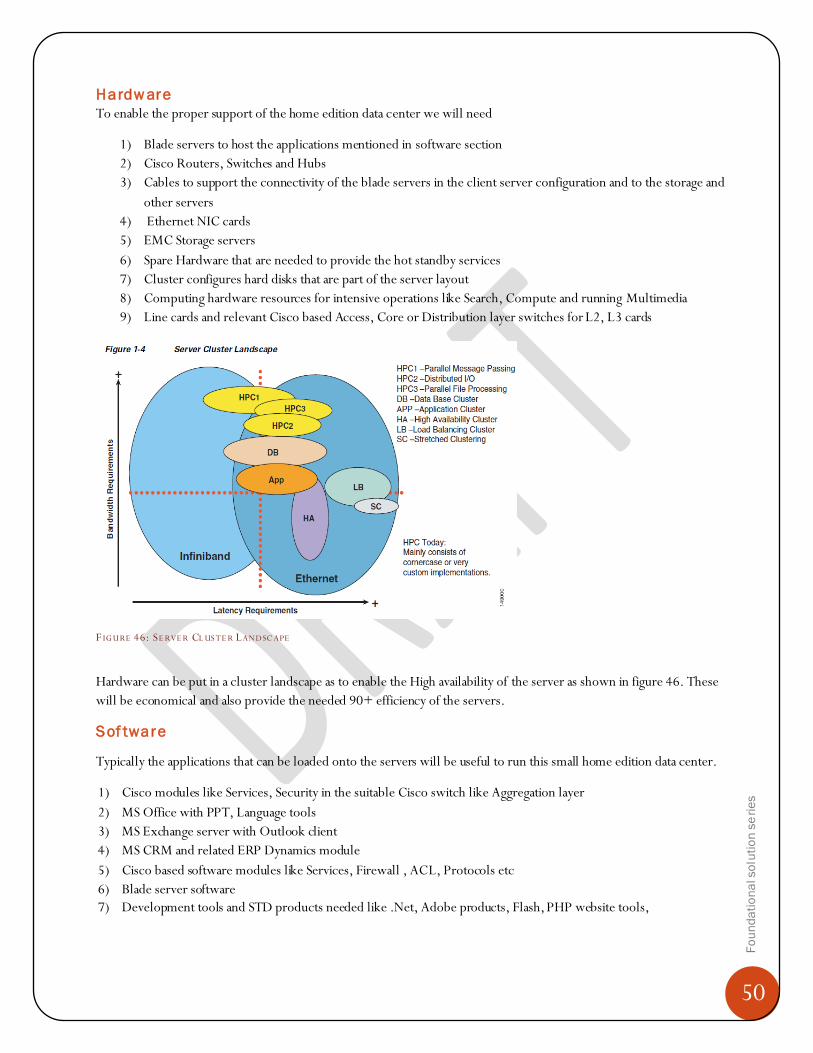
50
Fo
un
da
tio
na
l so
luti
on
se
rie
s
Hardw are
To enable the proper support of the home edition data center we will need
1) Blade servers to host the applications mentioned in software section
2) Cisco Routers, Switches and Hubs
3) Cables to support the connectivity of the blade servers in the client server configuration and to the storage and
other servers
4) Ethernet NIC cards
5) EMC Storage servers
6) Spare Hardware that are needed to provide the hot standby services
7) Cluster configures hard disks that are part of the server layout
8) Computing hardware resources for intensive operations like Search, Compute and running Multimedia
9) Line cards and relevant Cisco based Access, Core or Distribution layer switches for L2, L3 cards
F IG URE 46: SE RVE R CL US TE R LANDSC APE
Hardware can be put in a cluster landscape as to enable the High availability of the server as shown in figure 46. These
will be economical and also provide the needed 90+ efficiency of the servers.
Sof tware
Typically the applications that can be loaded onto the servers will be useful to run this small home edition data center.
1) Cisco modules like Services, Security in the suitable Cisco switch like Aggregation layer
2) MS Office with PPT, Language tools
3) MS Exchange server with Outlook client
4) MS CRM and related ERP Dynamics module
5) Cisco based software modules like Services, Firewall , ACL, Protocols etc
6) Blade server software
7) Development tools and STD products needed like .Net, Adobe products, Flash, PHP website tools,

51
Fo
un
da
tio
na
l so
luti
on
se
rie
s
Secu rity
Security is mainly at the Firewall level and there is no need of elaborate inside the VLANs as the users will be no more
than 5 -10 members.
Hence the Cisco Firewall module will be used, along with the Standards Application scanning like Norton products can
be subscribed. Care to be taken to see that a Single instance can scan multiple server boxes and also do the application
level scanning.
User level setting at the server and client machines is needed and the server boxes will be isolated from rest of the
Network by secure switches and the perimeter will be guarded possibly by an IDS system if possible.
Implemen tation guid elines
In order to achieve the end results the Implementation guidelines can be ordered from us for all the sections and tasks
from this document. Other details can also be availed from us in form of training and other features includes engaging
with suppliers, templates you will use, for business and for internal purposes.
Once you have completed few exercise of DO IT YOURSELF templates and sample works you can approach us or the
Implementation service provider to make this reality. You can lay your first foundation of incorporating the
foundational course that is generic framework for your business.
Alternately you can leave your issue with us and let us understand you better and your business. You can take this to
next step by ordering our custom solution by inviting us to talk to you and understand your business better. We have
different packages all at the most economical costs for you with loads of data for you to enhance and suite your needs for
your success and high performance.
We have a good understanding with our Solution Implementer and we always get the approval of all our solutions prior
to releasing to the market so that there will be no issues later. We also can work with our / your Implementor in order
to get the finer details of the solution in place and we can help you all along the course of the project and even we can
develop a small prototype or DEMO a running model of our solution.
Our solutions adhere to industry standards and have Interoperable and are scalable with other solutions. You can trust
us and leave your worries of later solutions being developed on top of this foundation solution. All our solutions are
certified safe and fit for use by the Canadian Industry board and quality standards.
Qu ali ty
We have been assessed at ISO 9001, US DoD and MIL standards and have obtained the necessary technology
certification from US Home Department. We do not get our quality and work assessed by service providers or middle
agents who might negotiate and compromise for money or might not favour us due to socio-political, ethnicity
backgrounds.
We will provide you with the guidance on how quality can be achieved at the unit level, why not selling top brands
products hi priced items might not be always the best option for quality. Quality is what people can afford and willing to
buy at their ease, time, quantity, quality and convenient location.
Costin g elemen ts
We will provide guidance on the costs that are inbuilt to the business and the products. We can provide insights about
how the final bundles, discounts, credits to right customers can be developed. We will provide the costing techniques
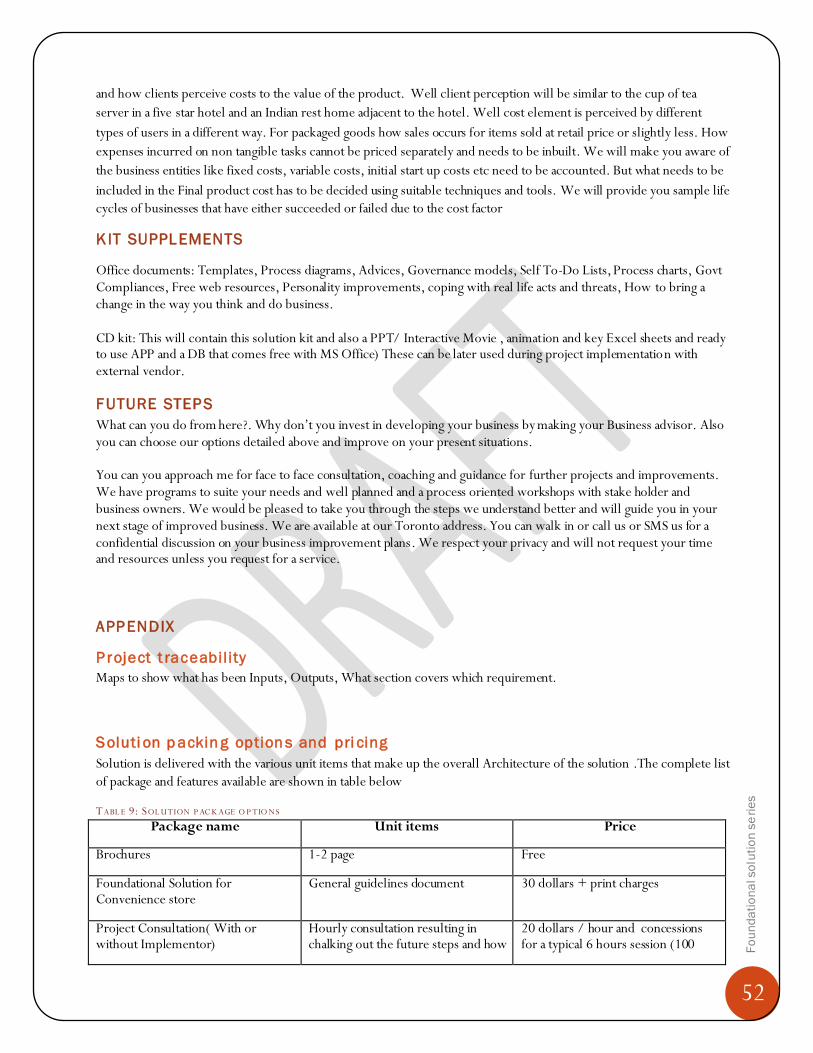
52
Fo
un
da
tio
na
l so
luti
on
se
rie
s
and how clients perceive costs to the value of the product. Well client perception will be similar to the cup of tea
server in a five star hotel and an Indian rest home adjacent to the hotel. Well cost element is perceived by different
types of users in a different way. For packaged goods how sales occurs for items sold at retail price or slightly less. How
expenses incurred on non tangible tasks cannot be priced separately and needs to be inbuilt. We will make you aware of
the business entities like fixed costs, variable costs, initial start up costs etc need to be accounted. But what needs to be
included in the Final product cost has to be decided using suitable techniques and tools. We will provide you sample life
cycles of businesses that have either succeeded or failed due to the cost factor
KIT SUPPL EMENTS
Office documents: Templates, Process diagrams, Advices, Governance models, Self To-Do Lists, Process charts, Govt Compliances, Free web resources, Personality improvements, coping with real life acts and threats, How to bring a change in the way you think and do business. CD kit: This will contain this solution kit and also a PPT/ Interactive Movie , animation and key Excel sheets and ready to use APP and a DB that comes free with MS Office) These can be later used during project implementation with external vendor.
FUTURE STEP S
What can you do from here?. Why don’t you invest in developing your business by making your Business advisor. Also you can choose our options detailed above and improve on your present situations. You can you approach me for face to face consultation, coaching and guidance for further projects and improvements. We have programs to suite your needs and well planned and a process oriented workshops with stake holder and business owners. We would be pleased to take you through the steps we understand better and will guide you in your next stage of improved business. We are available at our Toronto address. You can walk in or call us or SMS us for a confidential discussion on your business improvement plans. We respect your privacy and will not request your time and resources unless you request for a service.
APP ENDIX
P roject t raceabil ity
Maps to show what has been Inputs, Outputs, What section covers which requirement.
Soluti on p ackin g option s and pri cing
Solution is delivered with the various unit items that make up the overall Architecture of the solution .The complete list
of package and features available are shown in table below
T ABL E 9: SOL UTION P AC K AGE O P TIO NS
Package name Unit items Price
Brochures 1-2 page Free
Foundational Solution for Convenience store
General guidelines document 30 dollars + print charges
Project Consultation( With or without Implementor)
Hourly consultation resulting in chalking out the future steps and how
20 dollars / hour and concessions for a typical 6 hours session (100
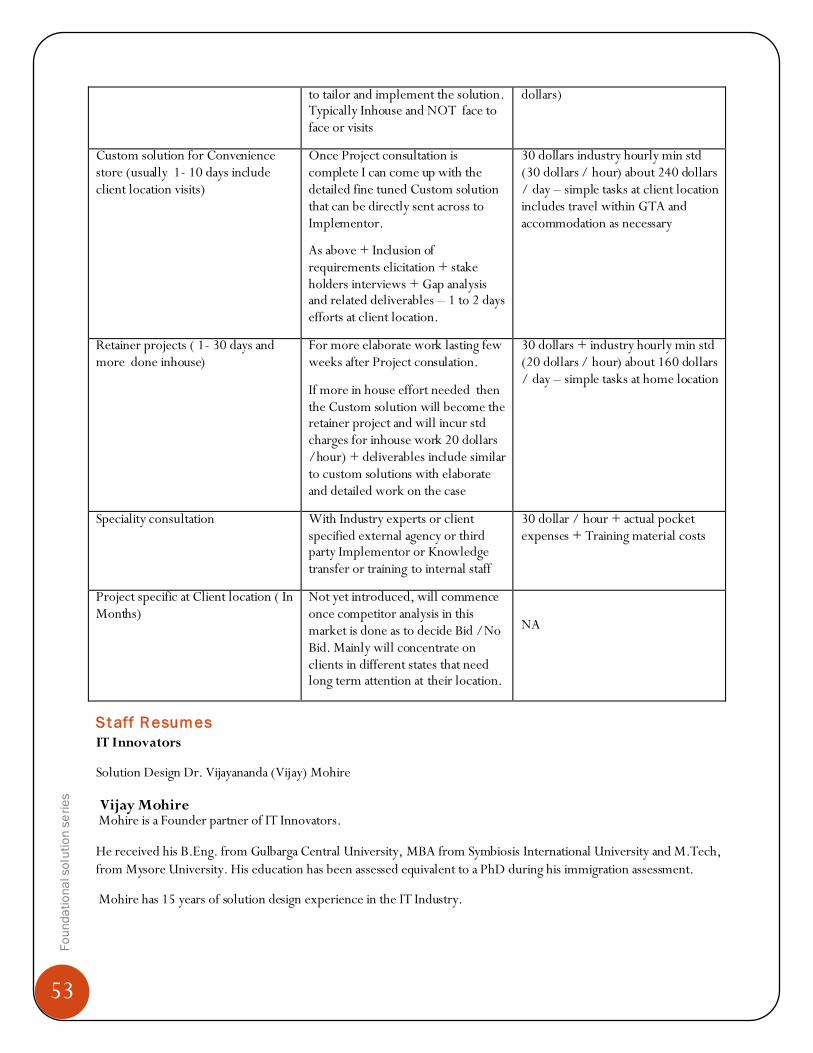
53
Fo
un
da
tio
na
l so
luti
on
se
rie
s
to tailor and implement the solution. Typically Inhouse and NOT face to face or visits
dollars)
Custom solution for Convenience store (usually 1- 10 days include client location visits)
Once Project consultation is complete I can come up with the detailed fine tuned Custom solution that can be directly sent across to Implementor.
As above + Inclusion of requirements elicitation + stake holders interviews + Gap analysis and related deliverables – 1 to 2 days efforts at client location.
30 dollars industry hourly min std (30 dollars / hour) about 240 dollars / day – simple tasks at client location includes travel within GTA and accommodation as necessary
Retainer projects ( 1- 30 days and more done inhouse)
For more elaborate work lasting few weeks after Project consulation.
If more in house effort needed then the Custom solution will become the retainer project and will incur std charges for inhouse work 20 dollars /hour) + deliverables include similar to custom solutions with elaborate and detailed work on the case
30 dollars + industry hourly min std (20 dollars / hour) about 160 dollars / day – simple tasks at home location
Speciality consultation With Industry experts or client specified external agency or third party Implementor or Knowledge transfer or training to internal staff
30 dollar / hour + actual pocket expenses + Training material costs
Project specific at Client location ( In Months)
Not yet introduced, will commence once competitor analysis in this market is done as to decide Bid /No Bid. Mainly will concentrate on clients in different states that need long term attention at their location.
NA
St aff R esumes
IT Innovators
Solution Design Dr. Vijayananda (Vijay) Mohire
Vijay Mohire Mohire is a Founder partner of IT Innovators.
He received his B.Eng. from Gulbarga Central University, MBA from Symbiosis International University and M.Tech,
from Mysore University. His education has been assessed equivalent to a PhD during his immigration assessment.
Mohire has 15 years of solution design experience in the IT Industry.

54
Fo
un
da
tio
na
l so
luti
on
se
rie
s
Dr. Mohire’s experience has been in wide range of technologies and server technical support, hardware and facilities
planning, management and technical consulting, computer operations, applications development, distributed processing
system support, and micro system support.
D iscl aimer
This document has been prepared for sole purpose of demonstrating author’s work capability and his familiarity in
working with similar tasks. Some of the content has been referred from various books and a reference has been provided
in Bibliography section. This document or its content is not for commercial purpose or for any advertisement but for
self appraisal and educational purpose only. Author cannot be held responsible for the accuracy of the external content
or for any copyrights owned by the respective book authors. Please contact author in case of any further clarifications
needed in this regards.
Bibliography Analysis, I. I. (2006). A Guide to the Business Analysis Body of Knowledge. USA: IIBA.
Cisco. (2007). Cisco Data Center Infrastructure 2.5 Design Guide. SanJose, CA, USA: Cisco.
Committee, C. S. (2000). COBIT Audit Guidelines. Chicago: Information Systems Audit and Control Foundation.
Finkelstein, C. (2006). Enterprise Architecture for Integration. In C. Finkelstein. Boston: Artech House.


