Research paper Structural effects on dissolution of silica polymorphs in various solutions Jianxi Zhu a , Cuihua Tang b,⇑ , Jingming Wei a , Zhaohui Li c , Minwang Laipan a , Hongping He a , Xiaoliang Liang a , Qi Tao a , Limei Cai b a CAS Key Laboratory of Mineralogy and Metallogeny/Guangdong Provincial Key Laboratory of Mineral Physics and Materials, Guangzhou Institute of Geochemistry, Chinese Academy of Sciences, 511 Kehua Street, Guangzhou 510640, China b College of Resources and Environment, Yangtze University, Wuhan 430100, China c Geosciences Department, University of Wisconsin-Parkside, Kenosha, WI 53141, USA article info Article history: Received 14 September 2017 Received in revised form 2 October 2017 Accepted 4 October 2017 Available online 28 October 2017 Keywords: Structural effects Dissolution a-Quartz a-Cristobalite EPR XPS abstract The dissolution and precipitation of silica minerals in rocks, soils, and sediments are essential processes of material transformations near the Earth’s surface. In this study, the dissolution of a-quartz and a- cristobalite are investigated at 25 °C in HNO 3 , NaOH, KCl, and MgCl 2 solutions. The amounts of silicon release from a-quartz in HNO 3 and electrolyte solutions are larger than those from a-cristobalite, and the circumstance is in consistence with the density of surface silanols. In NaOH solutions, the amounts of silicon release increase significantly and the maximum amount is about 30 times higher than that in acid and electrolyte solutions. Moreover, the maximum silicon release is inversely proportional to the density of surface silanols, resulting in a lower silicon release from a-quartz in comparison to that from a-cristobalite. It could be deduced that there is a possible correlation with structural defects, for instance, oxygen vacancies, demonstrated by the electron paramagnetic resonance (EPR) spectrum. By analyzing the surface composition of samples after dissolution, the result of X-ray photoelectron spec- troscopy (XPS) confirms that no stable amorphous silica layer form on the surface of a-quartz and a- cristobalite under the current experimental conditions, along with the verification of high-resolution transmission electron microscope (TEM). Furthermore, the surface species of a-quartz and a-cristobalite after reacting with different solutions are also qualitatively determined by XPS. Ó 2017 Elsevier B.V. All rights reserved. 1. Introduction Interactions between solutes and mineral surface are critical in rocks, soils, sediments and natural water systems during geochem- ical and environmental processes due to a variety of geochemical behaviors, involving mineral crystal growth, weathering, dissolu- tion, co-precipitation and adsorption reactions, occurring at inter- face between minerals and aqueous solutions [1,2]. Surface dissolution and precipitation play significant roles in environmen- tal interfacial reactions and geochemical cycling of elements. For example, dissolution of silica and silicate minerals during the weathering of rocks is an important step in global silicon and car- bon cycles, thus, affects development of ecosystem and predictions of future climate change related to increasing greenhouse gas con- centration in the Earth’s atmosphere [3,4]. Silica mineral is one of most important minerals in earth’s con- tinental crust, with an abundance as high as 12%. Silica minerals widely exist in rocks, soils, and sediments by forms of crystalline and amorphous silica due to the diversity of the linkage among SiO 4 tetrahedra, which consist of a group of silica polymorphs, including quartz, cristobalite, tridymite, etc. According to previous researches, the various crystalline structures of minerals always determine their diverse surface microstructures and properties. The surface properties of the most common silica mineral, i.e. a- quartz, have been widely investigated in the past decades because of its widespread distribution [5–8]. The occurrence of cristobalite in active geothermal systems has been reported in several researches and the devitrification of volcanic glasses was attribu- ted to the formation of low-cristobalite (a-cristobalite) in these environments [9,10]. Therefore, a-cristobalite is always likely to co-exist with a-quartz and other clay minerals in soils and sedi- ments. Although the content and distribution of a-cristobalite in nature should not be negligible, investigation on a-cristobalite is still limited, especially from the perspective of surface chemistry. Therefore, it’s necessary to carry out researches on its dissolution characteristics and to contrast the dissolution behaviors of a- quartz and a-cristobalite. The results could provide theoretical basis for objective evaluation of element migration in soils and https://doi.org/10.1016/j.ica.2017.10.003 0020-1693/Ó 2017 Elsevier B.V. All rights reserved. ⇑ Corresponding authors. E-mail address: [email protected](C. Tang). Inorganica Chimica Acta 471 (2018) 57–65 Contents lists available at ScienceDirect Inorganica Chimica Acta journal homepage: www.elsevier.com/locate/ica
Transcript
Inorganica Chimica Acta 471 (2018) 57–65
Contents lists available at ScienceDirect
Inorganica Chimica Acta
journal homepage: www.elsevier .com/locate / ica
Research paper
Structural effects on dissolution of silica polymorphs in various solutions
https://doi.org/10.1016/j.ica.2017.10.0030020-1693/� 2017 Elsevier B.V. All rights reserved.
Jianxi Zhu a, Cuihua Tang b,⇑, Jingming Wei a, Zhaohui Li c, Minwang Laipan a, Hongping He a,Xiaoliang Liang a, Qi Tao a, Limei Cai b
aCAS Key Laboratory of Mineralogy and Metallogeny/Guangdong Provincial Key Laboratory of Mineral Physics and Materials, Guangzhou Institute of Geochemistry, ChineseAcademy of Sciences, 511 Kehua Street, Guangzhou 510640, ChinabCollege of Resources and Environment, Yangtze University, Wuhan 430100, ChinacGeosciences Department, University of Wisconsin-Parkside, Kenosha, WI 53141, USA
a r t i c l e i n f o a b s t r a c t
Article history:Received 14 September 2017Received in revised form 2 October 2017Accepted 4 October 2017Available online 28 October 2017
The dissolution and precipitation of silica minerals in rocks, soils, and sediments are essential processesof material transformations near the Earth’s surface. In this study, the dissolution of a-quartz and a-cristobalite are investigated at 25 �C in HNO3, NaOH, KCl, and MgCl2 solutions. The amounts of siliconrelease from a-quartz in HNO3 and electrolyte solutions are larger than those from a-cristobalite, andthe circumstance is in consistence with the density of surface silanols. In NaOH solutions, the amountsof silicon release increase significantly and the maximum amount is about 30 times higher than thatin acid and electrolyte solutions. Moreover, the maximum silicon release is inversely proportional tothe density of surface silanols, resulting in a lower silicon release from a-quartz in comparison to thatfrom a-cristobalite. It could be deduced that there is a possible correlation with structural defects, forinstance, oxygen vacancies, demonstrated by the electron paramagnetic resonance (EPR) spectrum. Byanalyzing the surface composition of samples after dissolution, the result of X-ray photoelectron spec-troscopy (XPS) confirms that no stable amorphous silica layer form on the surface of a-quartz and a-cristobalite under the current experimental conditions, along with the verification of high-resolutiontransmission electron microscope (TEM). Furthermore, the surface species of a-quartz and a-cristobaliteafter reacting with different solutions are also qualitatively determined by XPS.
� 2017 Elsevier B.V. All rights reserved.
1. Introduction
Interactions between solutes and mineral surface are critical inrocks, soils, sediments and natural water systems during geochem-ical and environmental processes due to a variety of geochemicalbehaviors, involving mineral crystal growth, weathering, dissolu-tion, co-precipitation and adsorption reactions, occurring at inter-face between minerals and aqueous solutions [1,2]. Surfacedissolution and precipitation play significant roles in environmen-tal interfacial reactions and geochemical cycling of elements. Forexample, dissolution of silica and silicate minerals during theweathering of rocks is an important step in global silicon and car-bon cycles, thus, affects development of ecosystem and predictionsof future climate change related to increasing greenhouse gas con-centration in the Earth’s atmosphere [3,4].
Silica mineral is one of most important minerals in earth’s con-tinental crust, with an abundance as high as 12%. Silica minerals
widely exist in rocks, soils, and sediments by forms of crystallineand amorphous silica due to the diversity of the linkage amongSiO4 tetrahedra, which consist of a group of silica polymorphs,including quartz, cristobalite, tridymite, etc. According to previousresearches, the various crystalline structures of minerals alwaysdetermine their diverse surface microstructures and properties.The surface properties of the most common silica mineral, i.e. a-quartz, have been widely investigated in the past decades becauseof its widespread distribution [5–8]. The occurrence of cristobalitein active geothermal systems has been reported in severalresearches and the devitrification of volcanic glasses was attribu-ted to the formation of low-cristobalite (a-cristobalite) in theseenvironments [9,10]. Therefore, a-cristobalite is always likely toco-exist with a-quartz and other clay minerals in soils and sedi-ments. Although the content and distribution of a-cristobalite innature should not be negligible, investigation on a-cristobalite isstill limited, especially from the perspective of surface chemistry.Therefore, it’s necessary to carry out researches on its dissolutioncharacteristics and to contrast the dissolution behaviors of a-quartz and a-cristobalite. The results could provide theoreticalbasis for objective evaluation of element migration in soils and
58 J. Zhu et al. / Inorganica Chimica Acta 471 (2018) 57–65
sediments, as well as tracing the cycle process of silicon element inthe lithosphere, hydrosphere, atmosphere, and biosphere. In addi-tion, they could provide further supports for the study of surfaceheterogeneity of SiO2 polymorphs.
Many systematic studies on silica minerals dissolution wereconducted, though mostly focused on a-quartz. The dissolutionkinetics of a-quartz under different conditions were provided inabundant experimental works [11–17] and theoretical calculations[18–20]. In experimental studies, the temperature and chemistrycharacteristics of solutions, including pH and electrolyte ions,exerted important effects on dissolution behavior. Moreover, theeffects of defects distribution on dissolution kinetics of a-quartzwere also discussed. Under highly undersaturated geochemicalenvironments, such as soils and sediments, dislocation densitywas not a controlling factor for quartz dissolution [21]. Whilereferring to the effect of different crystal structures and crystalfaces, a-quartz was more easily attacked in hydrofluoric acid solu-tion because of the loose packing of its atoms, in comparison tocoesite, as well as proceeded by hydrofluoric acid at a rate at leasta hundred fold greater on a plane perpendicular to the optic axisthan on the prism faces [22]. The dissolution of prismatic quartzsurfaces by KOH/H2O solutions at 400 K were almost two ordersof magnitude faster than the rhombohedral surface as revealedby atomic force microscopy [23]. Additionally, the species of sur-face silanol (isolated silanols (Q3) and geminal silanols (Q2)) alsoaffect the solubility of silica because of their different chemicalreactivity [22,24]. Moreover, the dissolution of colloidal silicawas investigated by theoretical and experimental methods [25–27]. Infrequently, the precipitation and dissolution behaviors ofa-cristobalite from 150 to 300 �C were determined. It was specu-lated that all silica polymorphs precipitate in water by the samerate-limiting elementary reaction within the uncertainties [28].
According to a previous study, although it had been confirmedthat the surface structure of polymorphs was a key factor of chem-ical attack, a detailed work on differences of dissolution behaviorbetween a-quartz and coesite was not carried out [22]. Further-more, in our previous studies, based on the comparison of the sur-face microstructures, properties, and reactivity between a-quartzand a-cristobalite enabled us to confirm their surface heterogene-ity [29,30]. The solubility of quartz, cristobalite, and amorphoussilica were successfully plotted and compared in the respectivethree-phase curves. However, a uniform conclusion on the dissolu-tion difference among silica polymorphs could not be reached bythe referred results since the data were cited from different Refs.[31]. Therefore, based on our reported work on surface heterogene-ity of a-quartz and a-cristobalite, detailed information on theirdissolution behaviors still needs further excavation. The aim of thispaper is to examine the structural effects on dissolution behaviorsof a-quartz and a-cristobalite in different solution environments.Their dissolution kinetics in acid, base, and electrolyte solutionswere determined. With the aid of XPS and EPR, the possible disso-lution mechanism and the difference between a-quartz and a-cristobalite were specified.
2. Experimental sections
2.1. Materials
The a-quartz was collected from Guiding, Guizhou Province ofChina, and the commercially available a-cristobalite was pur-chased from Veston Silicon Co., Ltd. (Guiping County, Guangxi Pro-vince of China). Both was finely ground by a planetary ball grinder(FRITSCH Pulverisette 6, Germany) for 2 h to assure a homoge-neous particle size about 5 lm, measured by a laser particle size
analyzer (JL-1177 full-automatic laser particle size analyzer,Chengdu, China). The BET specific surface areas of 3.8 m2/g for a-quartz and 3.6 m2/g for a-cristobalite were determined by aMicromeritics ASAP 2020 M specific surface area and porosity ana-lyzer. The powder samples were immersed in 0.01 M HCl solutionfor 24 h, and then rinsed with deionized water until free of chlorideion. The minerals were calcined in a muffle furnace at 450 �C for12 h. The SiO2 contents of final products were over 96% by elemen-tal analyses (Table 1 in supplemental materials), and both a-quartzand a-cristobalite had purities higher than 95% by X-ray diffraction(XRD) analysis.
2.2. Characterization techniques
XPS analyses were carried out on a Thermo Fisher Scientificinstrument equipped with an Al-Ka source (10 mA, 14 kV) andoperated at 1486.8 eV during the measurements. The base pressurein the spectrometer analyzer chamber was lower than 2 � 10�8
mbar. The charge neutralizer filament was used during all experi-ments to control charging of the samples. All dried mineral sam-ples were taken to analyze as quickly as possible so that freshand clean samples were present in all analysis. The Carbon C 1 sline with a position at 284.8 eV was used as reference to correctthe charging effect.
The EPR spectra of a-quartz and a-cristobalite were obtained atX-band (� 9.4 GHz) with a Bruker EMX-plus model spectrometerat liquid nitrogen temperature (77 K). In order to make a compar-ative study on paramagnetic defects, the all minerals had an iden-tical mass of 30 mg with error within 2%. Attention was paid tominimize the adhesion of powders on the wall of quartz tubeswhen loading the samples.
High-resolution transmission electron observations were con-ducted on a JEM 2010 high-resolution TEM. All samples were pre-pared by depositing dilute silica mineral dispersions (100 mg/L)onto a copper mesh grid.
2.3. Dissolution experiments
The dissolution experiments of a-quartz and a-cristobalitewere conducted in two parallel approaches as follows:
(1) The silicon releases during a-quartz and a-cristobalite disso-lution were determined as a function of concentrations ofHNO3, NaOH, KCl, and MgCl2 at 25 �C, respectively. Specifi-cally, 0.2 g of a-quartz powder and 20 ml of HNO3 solutionswith concentrations of 0.1, 0.5, 1.0, 2.0, 4.0, 6.0, 8.0 mol/Lwere added to each 50 ml Teflon centrifuge tube. Dissolutionof a-cristobalite was also conducted in the same way. Themixtures were shaken continuously at 180 rpm for 96 h inan incubator shaker at 25 ± 1 �C. Then, the mixtures werecentrifuged at 4000 rpm for 10 min. The supernatant solu-tions were diluted to appropriate concentrations with deion-ized water after filtering through polyether sulfone (PES)membrane (u 13 mm/0.45 lm). The concentrations of totalsilicon (
PSi) in the supernatant solutions were directly
determined by inductively-coupled plasma optical emissionspectrometer (ICP-OES) (PerkinElmer Instruments, Optima2000 DV), using standards made from the correspondingmediums to directly correct for any possible matrix interfer-ence. The same experimental procedure was applied inNaOH solutions with concentrations of 0.1, 0.5, 1.0, 2.0mol/L, as well as in KCl and MgCl2 solutions with concentra-tions of 0.01, 0.1, 0.2 mol/L. The effects of deionized water onsolubility of a-quartz and a-cristobalite under our experi-mental conditions were negligible in a control experiment
J. Zhu et al. / Inorganica Chimica Acta 471 (2018) 57–65 59
by immersing samples in deionized water. All the preparedsamples after being separated from supernatant solutionswere dried in vacuum freezing dryer for 24 h and storedfor further XPS investigation.
(2) The dissolution kinetics of a-quartz and a-cristobalite weredetermined at 25 �C by adding 1 g of a-quartz or a-cristo-balite powder into each 250 ml polypropylene centrifugebottle, respectively, and then mixed with 100 ml 1 mol/LHNO3 solution on a magnetic stirring apparatus. The solu-tion was sampled at a regular time interval, and 8 ml of sus-pensions were fetched and filtered through PES membranesfor measurement. The concentrations of silicon of all sam-ples were measured with ICP-OES as described in part (1).The dissolution kinetics of a-quartz and a-cristobalite in0.1 mol/L NaOH, 0.01 mol/L KCl, and 0.01 mol/L MgCl2 solu-tions at 25 �C were conducted in the same way.
3. Results and discussions
3.1. Dissolution in HNO3 and NaOH solutions under differentconcentrations
The dissolution reaction of silica minerals is identified as achemical process that water molecule interacted with the surfaceto cleave the Si� Obr � Si linkages, resulting in hydrolyzed prod-ucts. The characteristics of surface silanols depend on the chemicalenvironment of solutions., With the point of zero charge (PZC) of2.8 and 3.2 for a-quartz and a-cristobalite [30], the silica surfacesare positively charged in strong acid solutions, while negativelycharged in solutions whose pH is 3 and above. Under ambient con-ditions, the surface silanols interact with H+ or OH- to form neutral,positive or negative surface species via protonation (Eq. (1) anddeprotonation (Eq. (2):
> SiOH þ H3Oþ ¼> SiOHþ
2 þ H2O ð1Þ
> SiOH þ OH� ¼> SiO� þ H2O ð2Þwhere > SiOHþ
2 , > SiOH, > SiO� stands for the protonated, neutral,and deprotonated surface sites, respectively. Thus, the predominantsurface sites in HNO3 and NaOH solutions are > SiOHþ
2 and > SiO�,respectively [8]. The characteristics of surface sites could signifi-cantly affect the solubility and reaction mechanism of silica miner-als [32,33].
The silicon releases from a-quartz and a-cristobalite in HNO3
and NaOH solutions of different concentrations at 25 �C show quitedifferent trends (Fig. 1). In HNO3 solutions, protons will interactwith the surface silanols to form the structure ofSi� Obr � Si� OHþ
2 (Obr is for bridge oxygen), which prompts the
Fig. 1. Silicon releases during a-quartz and a-cristobalite dissolution at
hydrophilicity of the surface and hydrolysis of Si� Obr � Sibonds�H2O interacts with the structure of Si� Obr � Si� OHþ
2 byhydrogen bonding, which makes the distortion of silicon-oxygentetrahedron, formation of a penta-coordinated structure. There-fore, the Si� Obr � Si linkages become easier to break, finallyresulting in the dissociation from silicon-oxygen tetrahedron bulkto form two silanols: Si� Obr � Si� ðOHÞ2Hþ and Si� OH [15]. Asimplified dissolution mechanism in HNO3 solution is illustratedin Fig. 2a. As the density of surface silanols on a-quartz is higherthan that on a-cristobalite [29,30], the amount of silicon releasefrom a-quartz is slightly higher than that from a-cristobalite underthe experimental solution concentrations. At lower concentrationsof H+, a short period of increased silicon release will occur and themaximum appears at 2.0 mol/L (Fig. 1a). When the concentrationsof acid solutions increase further, the silicon releases fall off con-versely, which is in good agreement with the result reported inthe literature [15]. However, there is still lack of reasonable expla-nation on this phenomenon. A mechanism of protonation of bridgeoxygen (Si� ObrðHþÞ � Si) proposed by Xiao et al. [34] is likely togive us some enlightenment. As the pKa value of Si� ObrðHþÞ � Siis very small [35], protonation of the bridge oxygen is unlikely tohappen unless in an extremely acidic solution and the breakageof silicon-oxygen bridge bonds in Si� ObrðHþÞ � Si is also unlikelyin comparison to Si� Obr � Si� OHþ
2 . The experiment data over2.0 mol/L HNO3 seems to agree with this mechanism, which wasdisagreed by Zhang et al. [36]. Furthermore, in an extremely acidicenvironment, water molecules exist in the form of H3O+, makingwater molecules hard to get close to the positively charged surface.
While in NaOH solutions, the silicon releases from both a-quartz and a-cristobalite increase with the concentration of NaOHsolution. The maximum is about 6.5 mg/m2 and 10 mg/m2 for a-quartz and a-cristobalite, respectively, in contrast to 0.35 mg/m2
and 0.23 mg/m2 in HNO3 solution. Remarkably, the silicon releasefrom a-cristobalite is larger than that from a-quartz. When thesolution pH is higher than the PZC of a-quartz and a-cristobalite,Si� Obr � Si� O� is the predominating reactive site on the surface.The dissolution reaction profile involves in three processes(Fig. 2b). Initially, the formation of Si� Obr � Si� O� in alkalinesolutions promotes a longer (or weakened) Si� Obr � Si bond,and it permits an easier hydrolysis reaction and breakage of bonds.Owning to the strong dipolar behavior of water molecules with theelectronegative of oxygen and electropositive of hydrogen, H+ fromwater molecule is donated to Si� Obr � Si� O� for the formation ofa relatively stable structure of Si� Obr � Si� OH. Then, the OH-
from the water played the role of attacking the silicon atom inSi� Obr � Si� OH bond. The silicon-oxygen tetrahedron transfersto a fivefold coordinated structure. The penta-coordinated Si formsa reaction intermediate. At last, the rupture of theSi� Obr � SiðOH�Þ � OH bond leads to the formation of Si� O�
br
25 �C as affected by the concentrations of HNO3 (a) and NaOH (b).
Fig. 2. Schematic illustrations of the dissolution processes in HNO3 (a) and NaOH solutions (b).
60 J. Zhu et al. / Inorganica Chimica Acta 471 (2018) 57–65
and Si� ðOHÞ2. The proportion of Si� Obr � Si� O� increases withthe pH of solution according to the reaction (2). Therefore, the dis-solution of a-quartz and a-cristobalite increased with the NaOHconcentrations. Moreover, based on the dissolution mechanism,similar to that in HNO3 solution, the amount of silicon releasesfrom a-quartz should have been larger than that from a-cristo-balite. However, an opposite trend was observed. We deduce thisopposite trend to their crystal structure defects, such as oxygenvacancies (see detailed illustration in the EPR section).
3.2. Dissolution kinetics analysis
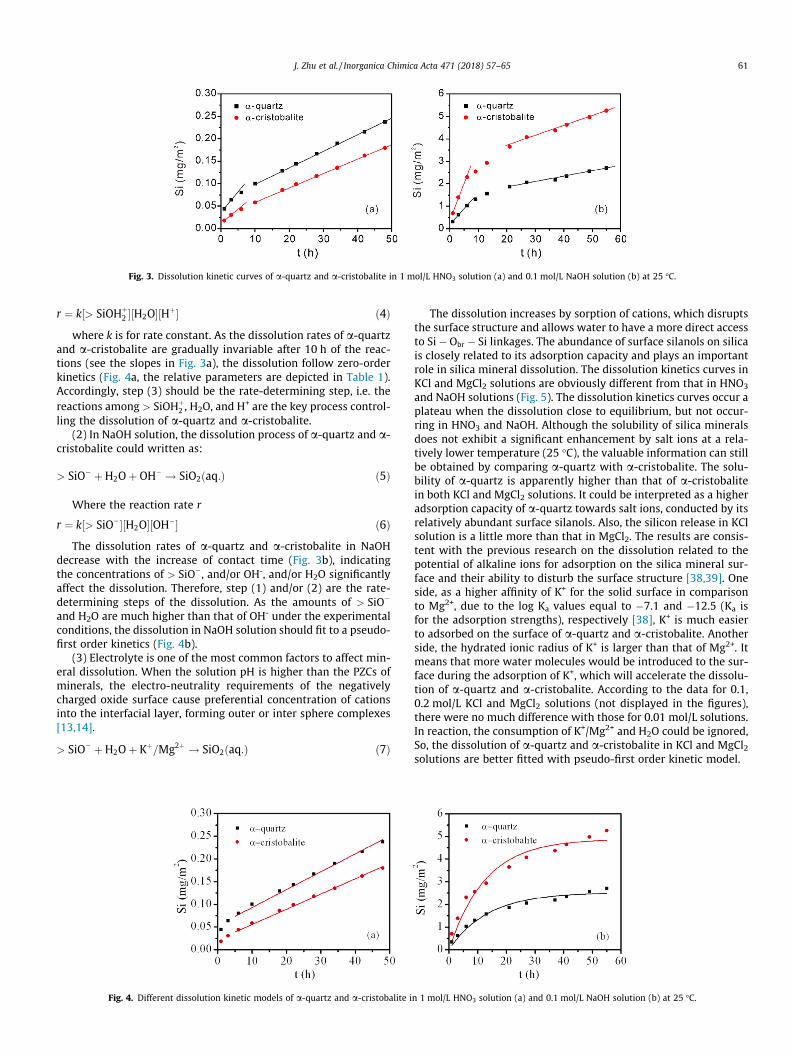
Dissolution kinetics of a-quartz and a-cristobalite in 1 mol/LHNO3 and 0.1 mol/L NaOH solutions are showed in Fig. 3. At theinitial stage in HNO3 solution, the dissolution rate is much larger(judging from the slope of the straight line in Fig. 3a) not onlybecause the surface structures (Si� Obr � Si� OHþ
2 ) related to thedissolution reaction are sufficient, but also the high-energy surfacesites or fine particles [37]. The same explanation can be applied todissolutions in NaOH solution, with the primary surface species ofSi� Obr � Si� O�. As dissolution proceeding, the rates decrease,deducing from the gentle slopes.
The dissolution of silica minerals is mainly caused by the attackof H2O molecules against surface structure of Si� Obr � Si. To bespecific, the protonation and deprotonation of surface silanolsaffect the surface hydrophilicity and hydrophobicity. Then, thereaction between water molecules and surface structure changesthe bond length of Si� Obr � Si, resulting in the dissolution of sil-ica. Therefore, the dissolution of a-quartz and a-cristobalite is clo-sely related to surface site structures, H2O molecules, andpredominant ions in solution. Generally, the dissolution processinvolves four steps: (1) diffusion process of the reactant towardthe solid surface, (2) adsorption of the reactant on the surface ofsolid, (3) reaction between the solid and reactant, (4) desorptionand diffusion of the products to the liquid phase. One of these stepscan be the key process controlling the reaction rate of the dissolu-tion, which can be distinguished according to the dissolutionkinetics.
(1) In HNO3 solution, the collapse of Si� Obr � Si is caused byH+, H2O molecules, and the surface structure of > SiOHþ
2 , with areaction:
> SiOHþ2 H2OþHþ ! SiO2ðaq:Þ ð3Þ
Thus, the reaction rate r at the surface is expressed as:
Fig. 3. Dissolution kinetic curves of a-quartz and a-cristobalite in 1 mol/L HNO3 solution (a) and 0.1 mol/L NaOH solution (b) at 25 �C.
J. Zhu et al. / Inorganica Chimica Acta 471 (2018) 57–65 61
r ¼ k½> SiOHþ2 �½H2O�½Hþ� ð4Þ
where k is for rate constant. As the dissolution rates of a-quartzand a-cristobalite are gradually invariable after 10 h of the reac-tions (see the slopes in Fig. 3a), the dissolution follow zero-orderkinetics (Fig. 4a, the relative parameters are depicted in Table 1).Accordingly, step (3) should be the rate-determining step, i.e. thereactions among > SiOHþ
2 , H2O, and H+ are the key process control-ling the dissolution of a-quartz and a-cristobalite.
(2) In NaOH solution, the dissolution process of a-quartz and a-cristobalite could written as:
> SiO� þH2Oþ OH� ! SiO2ðaq:Þ ð5Þ
Where the reaction rate r
r ¼ k½> SiO��½H2O�½OH�� ð6ÞThe dissolution rates of a-quartz and a-cristobalite in NaOH
decrease with the increase of contact time (Fig. 3b), indicatingthe concentrations of > SiO�, and/or OH-, and/or H2O significantlyaffect the dissolution. Therefore, step (1) and/or (2) are the rate-determining steps of the dissolution. As the amounts of > SiO�
and H2O are much higher than that of OH- under the experimentalconditions, the dissolution in NaOH solution should fit to a pseudo-first order kinetics (Fig. 4b).
(3) Electrolyte is one of the most common factors to affect min-eral dissolution. When the solution pH is higher than the PZCs ofminerals, the electro-neutrality requirements of the negativelycharged oxide surface cause preferential concentration of cationsinto the interfacial layer, forming outer or inter sphere complexes[13,14].
> SiO� þH2Oþ Kþ=Mg2þ ! SiO2ðaq:Þ ð7Þ
Fig. 4. Different dissolution kinetic models of a-quartz and a-cristobalite i
The dissolution increases by sorption of cations, which disruptsthe surface structure and allows water to have a more direct accessto Si� Obr � Si linkages. The abundance of surface silanols on silicais closely related to its adsorption capacity and plays an importantrole in silica mineral dissolution. The dissolution kinetics curves inKCl and MgCl2 solutions are obviously different from that in HNO3
and NaOH solutions (Fig. 5). The dissolution kinetics curves occur aplateau when the dissolution close to equilibrium, but not occur-ring in HNO3 and NaOH. Although the solubility of silica mineralsdoes not exhibit a significant enhancement by salt ions at a rela-tively lower temperature (25 �C), the valuable information can stillbe obtained by comparing a-quartz with a-cristobalite. The solu-bility of a-quartz is apparently higher than that of a-cristobalitein both KCl and MgCl2 solutions. It could be interpreted as a higheradsorption capacity of a-quartz towards salt ions, conducted by itsrelatively abundant surface silanols. Also, the silicon release in KClsolution is a little more than that in MgCl2. The results are consis-tent with the previous research on the dissolution related to thepotential of alkaline ions for adsorption on the silica mineral sur-face and their ability to disturb the surface structure [38,39]. Oneside, as a higher affinity of K+ for the solid surface in comparisonto Mg2+, due to the log Ka values equal to �7.1 and �12.5 (Ka isfor the adsorption strengths), respectively [38], K+ is much easierto adsorbed on the surface of a-quartz and a-cristobalite. Anotherside, the hydrated ionic radius of K+ is larger than that of Mg2+. Itmeans that more water molecules would be introduced to the sur-face during the adsorption of K+, which will accelerate the dissolu-tion of a-quartz and a-cristobalite. According to the data for 0.1,0.2 mol/L KCl and MgCl2 solutions (not displayed in the figures),there were no much difference with those for 0.01 mol/L solutions.In reaction, the consumption of K+/Mg2+ and H2O could be ignored,So, the dissolution of a-quartz and a-cristobalite in KCl and MgCl2solutions are better fitted with pseudo-first order kinetic model.
n 1 mol/L HNO3 solution (a) and 0.1 mol/L NaOH solution (b) at 25 �C.
Table 1Dissolution kinetic parameters of different models of a-quartz (Q) and a-cristobalite (C) in different solutions.
HNO3 NaOHZero-order kinetic model Pseudo-first order kinetic model
Fig. 5. Dissolution kinetic models of a-quartz and a-cristobalite in 0.01 mol/L KCl (a) and MgCl2 (b) solutions at 25 �C.
62 J. Zhu et al. / Inorganica Chimica Acta 471 (2018) 57–65
3.3. EPR
EPR spectroscopy is a valid experimental technique for elucidat-ing the crystal defects at the atomic scale that contain at least oneunpaired electron(s) in the highest occupied electronic orbital. Ithas been widely used in the discovery and detailed characteriza-tion of various species of paramagnetic defects [40–43], whichhave been linked to ‘‘point” defects rather than to macroscopicfaults (dislocations, cracks, bulk inclusions etc.). Paramagneticdefects in quartz are divided into two broad groups: impurity ions(Al, Fe, H, Cu, Ag, Ge, P, Ti) and E’-centers [44]. In the quartz struc-ture, the E’-center is well-defined structurally as the absence of an
Fig. 6. A simplified model of oxygen vacancy (a) and the EPR spectrum of the a-quartz (Q) and a-cristobalite (C) treated with HNO3 and NaOH solutions (b). Q-H-1M is for a-quartz sample treated with 1 mol/L HNO3 solution, and Q-OH-1M is fora-quartz sample treated with 1 mol/L NaOH solution; C-H-1M is for a-cristobalitesample treated with 1 mol/L HNO3 solution; C-OH-1M is for a-cristobalite sampletreated with 1 mol/L NaOH solution.
oxygen atom between two silicon atoms, namely oxygen vacancy(Fig. 6a). Also, paramagnetic signal arising from Al and Fe, etc.impurity ions are common in a-quartz, along with that associatedwith oxygen vacancies. Previous EPR studies demonstrate that theE’-centers generated in the paramagnetic samples under differentconditions generally get positively charged [45,46].
Most EPR studies on paramagnetic defects were focused on a-quartz [47–50]. While, the structural information of a-cristobalitederivable from EPR haven’t yet been drawn enough attention. Infact, the distribution of the defects is not uniform and may varywidely from one mineral to another, depending on the growth his-tory of the crystal and the characteristics of the surrounding envi-ronment. The clear display of the resonance lines of g value of2.008 is either attributed to the E’-centers [51], or paramagneticimpurity (Fig. 6b). The contents of paramagnetic impurity ions ina-quartz and a-cristobalite are 1.67% and 1.88%, respectively.(Table S1) In addition, the intensity of a-quartz is apparentlyhigher than that of a-cristobalite. Therefore, the signal from oxy-gen vacancy defects in a-quartz is much larger than that in a-cristobalite. That’s to say, the oxygen vacancies in a-quartz areobviously abundant than that in a-cristobalite. This may wellinterpret the reduced release of silicon from a-quartz in NaOHsolution in comparison with a-cristobalite, since the OH- ions orig-inated from water in the first dissolution step are trapped in thedefects with positive charge. The trapped OH- ions slow downthe procedure of attacking on Si-O bridge bonds. Meanwhile, thereis no significant change in the EPR spectra of raw a-quartz and a-quartz treated with 1 mol/L HNO3 solution (Q-H-1M), as well as a-cristobalite (CAH-1M). However, the EPR signals of a-quartz (Q-OH-1M) and a-cristobalite (CAOH-1M) treated with 1 mol/L NaOHsolution become weakened, especially in CAOH-1M sample. This isbecause dissolution in HNO3 was weak, while dissolution in NaOHsolution occurs intensely. Furthermore, the dissolution of a-quartzand a-cristobalite may lead the release of paramagnetic impurityions in the structures, which also wakens the corresponding EPRsignal.
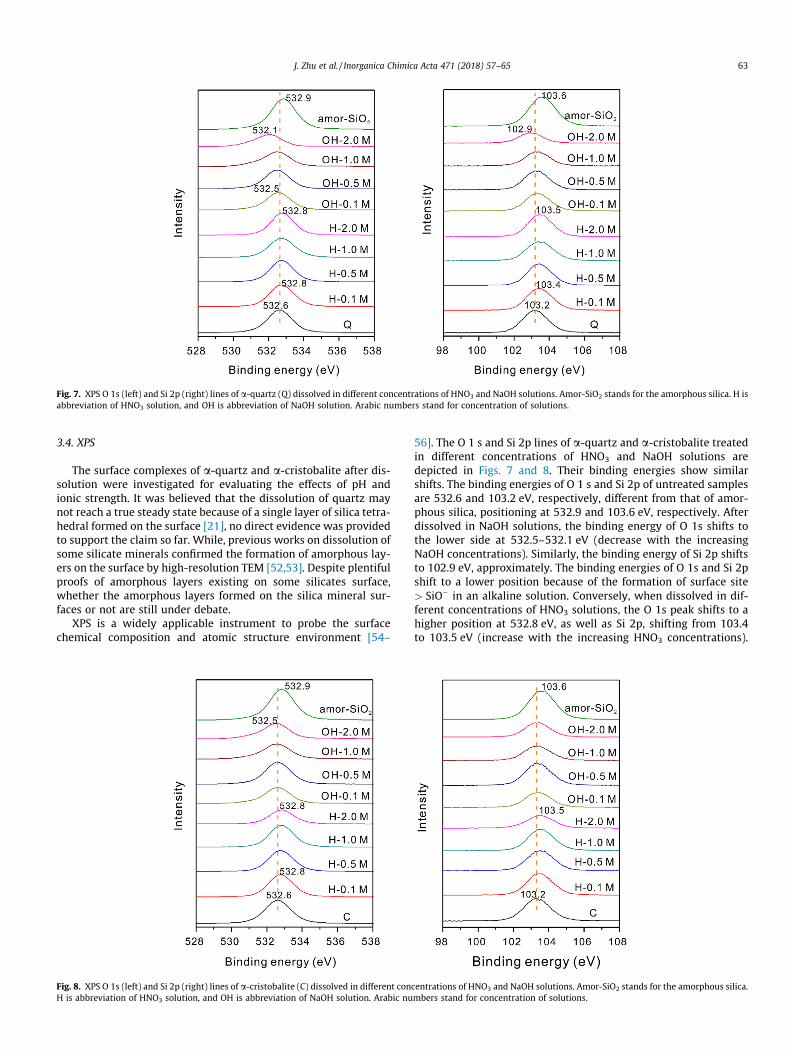
Fig. 7. XPS O 1s (left) and Si 2p (right) lines of a-quartz (Q) dissolved in different concentrations of HNO3 and NaOH solutions. Amor-SiO2 stands for the amorphous silica. H isabbreviation of HNO3 solution, and OH is abbreviation of NaOH solution. Arabic numbers stand for concentration of solutions.
J. Zhu et al. / Inorganica Chimica Acta 471 (2018) 57–65 63
3.4. XPS
The surface complexes of a-quartz and a-cristobalite after dis-solution were investigated for evaluating the effects of pH andionic strength. It was believed that the dissolution of quartz maynot reach a true steady state because of a single layer of silica tetra-hedral formed on the surface [21], no direct evidence was providedto support the claim so far. While, previous works on dissolution ofsome silicate minerals confirmed the formation of amorphous lay-ers on the surface by high-resolution TEM [52,53]. Despite plentifulproofs of amorphous layers existing on some silicates surface,whether the amorphous layers formed on the silica mineral sur-faces or not are still under debate.
XPS is a widely applicable instrument to probe the surfacechemical composition and atomic structure environment [54–
Fig. 8. XPS O 1s (left) and Si 2p (right) lines of a-cristobalite (C) dissolved in different conH is abbreviation of HNO3 solution, and OH is abbreviation of NaOH solution. Arabic nu
56]. The O 1 s and Si 2p lines of a-quartz and a-cristobalite treatedin different concentrations of HNO3 and NaOH solutions aredepicted in Figs. 7 and 8. Their binding energies show similarshifts. The binding energies of O 1 s and Si 2p of untreated samplesare 532.6 and 103.2 eV, respectively, different from that of amor-phous silica, positioning at 532.9 and 103.6 eV, respectively. Afterdissolved in NaOH solutions, the binding energy of O 1s shifts tothe lower side at 532.5–532.1 eV (decrease with the increasingNaOH concentrations). Similarly, the binding energy of Si 2p shiftsto 102.9 eV, approximately. The binding energies of O 1s and Si 2pshift to a lower position because of the formation of surface site> SiO� in an alkaline solution. Conversely, when dissolved in dif-ferent concentrations of HNO3 solutions, the O 1s peak shifts to ahigher position at 532.8 eV, as well as Si 2p, shifting from 103.4to 103.5 eV (increase with the increasing HNO3 concentrations).
centrations of HNO3 and NaOH solutions. Amor-SiO2 stands for the amorphous silica.mbers stand for concentration of solutions.
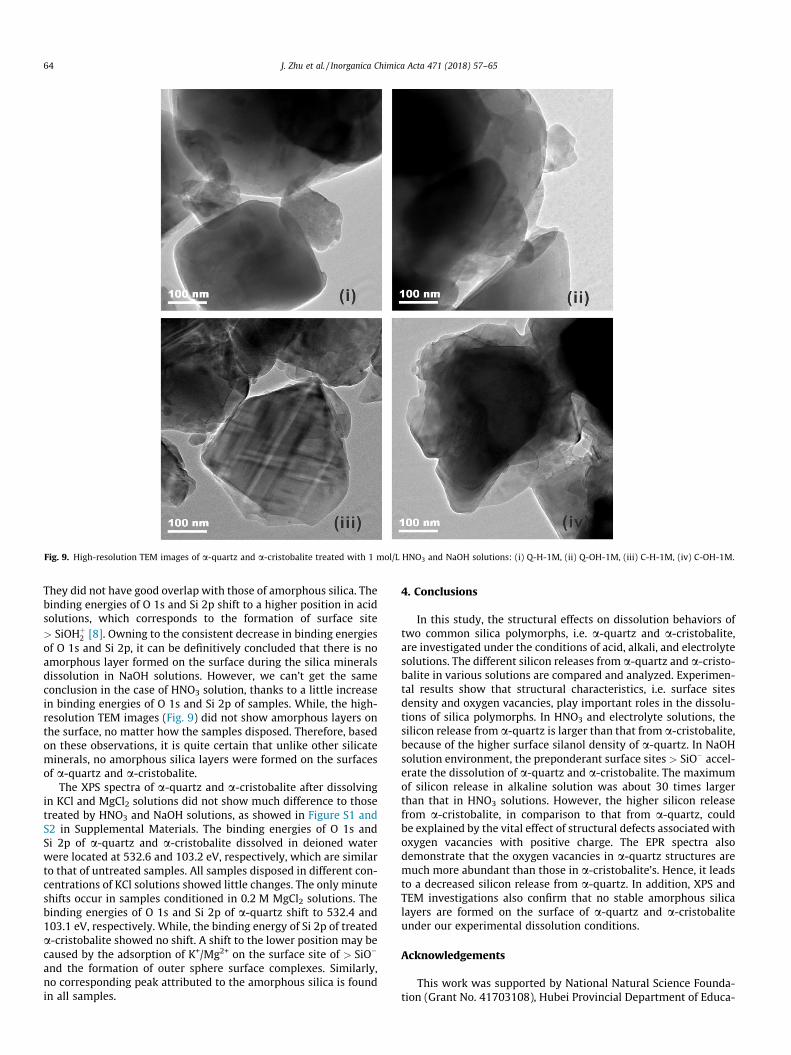
Fig. 9. High-resolution TEM images of a-quartz and a-cristobalite treated with 1 mol/L HNO3 and NaOH solutions: (i) Q-H-1M, (ii) Q-OH-1M, (iii) C-H-1M, (iv) C-OH-1M.
64 J. Zhu et al. / Inorganica Chimica Acta 471 (2018) 57–65
They did not have good overlap with those of amorphous silica. Thebinding energies of O 1s and Si 2p shift to a higher position in acidsolutions, which corresponds to the formation of surface site> SiOHþ
2 [8]. Owning to the consistent decrease in binding energiesof O 1s and Si 2p, it can be definitively concluded that there is noamorphous layer formed on the surface during the silica mineralsdissolution in NaOH solutions. However, we can’t get the sameconclusion in the case of HNO3 solution, thanks to a little increasein binding energies of O 1s and Si 2p of samples. While, the high-resolution TEM images (Fig. 9) did not show amorphous layers onthe surface, no matter how the samples disposed. Therefore, basedon these observations, it is quite certain that unlike other silicateminerals, no amorphous silica layers were formed on the surfacesof a-quartz and a-cristobalite.
The XPS spectra of a-quartz and a-cristobalite after dissolvingin KCl and MgCl2 solutions did not show much difference to thosetreated by HNO3 and NaOH solutions, as showed in Figure S1 andS2 in Supplemental Materials. The binding energies of O 1s andSi 2p of a-quartz and a-cristobalite dissolved in deioned waterwere located at 532.6 and 103.2 eV, respectively, which are similarto that of untreated samples. All samples disposed in different con-centrations of KCl solutions showed little changes. The only minuteshifts occur in samples conditioned in 0.2 M MgCl2 solutions. Thebinding energies of O 1s and Si 2p of a-quartz shift to 532.4 and103.1 eV, respectively. While, the binding energy of Si 2p of treateda-cristobalite showed no shift. A shift to the lower position may becaused by the adsorption of K+/Mg2+ on the surface site of > SiO�
and the formation of outer sphere surface complexes. Similarly,no corresponding peak attributed to the amorphous silica is foundin all samples.
4. Conclusions
In this study, the structural effects on dissolution behaviors oftwo common silica polymorphs, i.e. a-quartz and a-cristobalite,are investigated under the conditions of acid, alkali, and electrolytesolutions. The different silicon releases from a-quartz and a-cristo-balite in various solutions are compared and analyzed. Experimen-tal results show that structural characteristics, i.e. surface sitesdensity and oxygen vacancies, play important roles in the dissolu-tions of silica polymorphs. In HNO3 and electrolyte solutions, thesilicon release from a-quartz is larger than that from a-cristobalite,because of the higher surface silanol density of a-quartz. In NaOHsolution environment, the preponderant surface sites > SiO� accel-erate the dissolution of a-quartz and a-cristobalite. The maximumof silicon release in alkaline solution was about 30 times largerthan that in HNO3 solutions. However, the higher silicon releasefrom a-cristobalite, in comparison to that from a-quartz, couldbe explained by the vital effect of structural defects associated withoxygen vacancies with positive charge. The EPR spectra alsodemonstrate that the oxygen vacancies in a-quartz structures aremuch more abundant than those in a-cristobalite’s. Hence, it leadsto a decreased silicon release from a-quartz. In addition, XPS andTEM investigations also confirm that no stable amorphous silicalayers are formed on the surface of a-quartz and a-cristobaliteunder our experimental dissolution conditions.
Acknowledgements
This work was supported by National Natural Science Founda-tion (Grant No. 41703108), Hubei Provincial Department of Educa-
J. Zhu et al. / Inorganica Chimica Acta 471 (2018) 57–65 65
tion Science Research Project Support Program (Grant No.Q20171311), CAS/SAFEA International Partnership Program forCreative Research Teams (Grant No. 20140491534), GuangdongProvincial Youth Top-notch Talent Support Program (Grant No.2015TQ01Z797), Youth Innovation Promotion Association CAS(Grant No. 2014324). This is a contribution (No. IS-2444) fromGIGCAS.
Appendix A. Supplementary data
Supplementary data associated with this article can be found, inthe online version, at https://doi.org/10.1016/j.ica.2017.10.003.
References
[1] Y.E. Freedman, M. Magaritz, G.L. Long, D. Ronen, Interaction of metal withmineral surfaces in a natural groundwater environment, Chem. Geol. 116(1994) 111–121.
[2] S. Sjoberg, Silica in aqueous environments, J. Non-Cryst. Solids 196 (1996) 51–57.
[3] R.A. Berner, A.C. Lasaga, R.M. Garrels, The carbonate-silicates geochemicalcycle and its effect on atmospheric carbon-dioxide over the past 100 millionyears, Am. J. Sci. 283 (1983) 641–683.
[4] J. Gaillardet, B. Dupre, P. Louvat, C.J. Allegre, Global silicate weathering andCO2 consumption rates deduced from the chemistry of large rivers, Chem.Geol. 159 (1999) 3–30.
[5] B. Fubini, Surface chemistry and quartz hazard, Ann Occup. Hyg. 42 (1998)521–530.
[6] A. Manceau, M. Schlegel, K.L. Nagy, L. Charlet, Evidence for the formation oftrioctahedral clay upon sorption of Co2+ on quartz, J. Colloid Interface Sci. 220(1999) 181–197.
[7] O.S. Pokrovsky, S.V. Golubev, J.A. Mielczarski, Kinetic evidences of theexistence of positively charged species at the quartz-aqueous solutioninterface, J. Colloid Interface Sci. 296 (2006) 189–194.
[8] Y. Duval, J.A. Mielczarski, O.S. Pokrovsky, E. Mielczarski, J.J. Ehrhardt, Evidenceof the existence of three types of species at the quartz-aqueous solutioninterface at pH 0–10: XPS surface group quantification and surfacecomplexation modeling, J. Phys. Chem. B 106 (2002) 2937–2945.
[10] K. Kimbara, Some cristobalite and tridymites in geothermal area, Geol. SurveyJpn. 14 (1977) 13.
[11] P.V. Brady, J.V. Walther, Kinetics of quartz dissolution at low-temperatures,Chem. Geol. 82 (1990) 253–264.
[12] W.H. Casey, A.C. Lasaga, G.V. Gibbs, Mechanisms of silica dissolution asinferred from the kinetic isotope effect, Geochim. Cosmochim. Acta 54 (1990)3369–3378.
[13] P.M. Dove, D.A. Crerar, Kinetics of quartz dissolution in electrolyte-solutionsusing a hydrothermal mixed flow reactor, Geochim. Cosmochim. Acta 54(1990) 955–969.
[14] G. Berger, E. Cadore, J. Schott, P.M. Dove, Dissolution rate of quartz in lead andsodium electrolyte-solutions between 25-degrees-C and 300-degrees-C: effectof the nature of surface complexes and reaction affinity, Geochim. Cosmochim.Acta 58 (1994) 541–551.
[15] P.M. Dove, The dissolution kinetics of quartz in sodium-chloride solutions at25-degrees-C to 300-degrees-C, Am. J. Sci. 294 (1994) 665–712.
[16] P.M. Dove, C.J. Nix, The influence of the alkaline earth cations, magnesium,calcium, and barium on the dissolution kinetics of quartz, Geochim.Cosmochim. Acta 61 (1997) 3329–3340.
[17] P.M. Dove, The dissolution kinetics of quartz in aqueous mixed cationsolutions, Geochim. Cosmochim. Acta 63 (1999) 3715–3727.
[18] B.R. Bickmore, J.C. Wheeler, B. Bates, K.L. Nagy, D.L. Eggett, Reaction pathwaysfor quartz dissolution determined by statistical and graphical analysis ofmacroscopic experimental data, Geochim. Cosmochim. Acta 72 (2008) 4521–4536.
[19] S. Nangia, B.J. Garrison, Reaction rates and dissolution mechanisms of quartzas a function of pH, J. Phys. Chem. A 112 (2008) 2027–2033.
[20] M.C. Davis, D.J. Wesolowski, J. Rosenqvist, S.L. Brantley, K.T. Mueller, Solubilityand near-equilibrium dissolution rates of quartz in dilute NaCl solutions at398–473 K under alkaline conditions, Geochim. Cosmochim. Acta 75 (2011)401–415.
[21] A.E. Blum, R.A. Yund, A.C. Lasaga, The effect of dislocation density on thedissolution rate of quartz, Geochim. Cosmochim. Acta 54 (1990) 283–297.
[22] F.M. Ernsberger, Structural effects in the chemical reactivity of silica andsilicates, J. Phys. Chem. Solids 13 (1960) 347–351.
[23] S.V. Yanina, K.M. Rosso, P. Meakin, Defect distribution and dissolutionmorphologies on low-index surfaces of a-quartz, Geochim. Cosmochim. Acta70 (2006) 1113–1127.
[24] P.M. Dove, N. Han, A.F. Wallace, J.J. De Yoreo, Kinetics of amorphous silicadissolution and the paradox of the silica polymorphs, Proc. Natl. Acad. Sci. U.S.A. 105 (2008) 9903–9908.
[25] J.D. Rimstidt, H.L. Barnes, The kinetics of silica-water reactions, Geochim.Cosmochim. Acta 44 (1980) 1683–1699.
[26] F. Wetzel, G.F. de Souza, B.C. Reynolds, What controls silicon isotopefractionation during dissolution of diatom opal?, Geochim Cosmochim. Acta131 (2014) 128–137.
[27] T.H. Elmer, M.E. Nordberg, Solubility of silica in nitric acid solutions, J. Am.Ceram. Soc. 41 (1958) 517–520.
[28] P.J.N. Renders, C.H. Gammons, H.L. Barnes, Precipitation and dissolution rateconstants for cristobalite from 150oC to 300oC, Geochim. Cosmochim. Acta 59(1995) 77–85.
[29] C. Tang, J. Zhu, Q. Zhou, J. Wei, R. Zhu, H. He, Surface heterogeneity of SiO2polymorphs: an XPS investigation of a-quartz and a-cristobalite, J. Phys.Chem. C 118 (2014) 26249–26257.
[30] C. Tang, J. Zhu, Z. Li, R. Zhu, Q. Zhou, J. Wei, H. He, Q. Tao, Surface chemistry andreactivity of SiO2 polymorphs: acomparative study on a-quartz and a-cristobalite, Appl. Surf. Sci. 355 (2015) 1161–1167.
[31] R.O. Fournier, J.J. Rowe, Solubility of cristobalite along 3-phase curve, gas plusliquid plus cristobalite, Am. Mineral. 47 (1962). 897-&.
[32] A.J. Gratz, P. Bird, Quartz dissolution-negative crystal experiments and a ratelaw, Geochim. Cosmochim. Acta 57 (1993) 965–976.
[33] A.J. Gratz, P. Bird, Quartz dissolution-theory of rough and smooth surfaces,Geochim. Cosmochim. Acta 57 (1993) 977–989.
[34] Y.T. Xiao, A.C. Lasaga, Ab-initio quantum-mechanical studies of the kineticsand mechanisms of silicate dissolution-H+(H3O+) catalysis, Geochim.Cosmochim. Acta 58 (1994) 5379–5400.
[35] J. Sauer, Molecular-structure of orthosilicic acid, silanol, and H3SiOH.AlH3complex-models of surface hydroxyls in silica and zeolites, Journal of PhysicalChemistry-Us, 91 (1987) 2315–2319.
[37] J. Schott, S. Brantley, D. Crerar, C. Guy, M. Borcsik, C. Willaime, Dissolutionkinetics of strained calcite, Geochim. Cosmochim. Acta 53 (1989) 373–382.
[38] D.L. Dugger, J.H. Stanton, B.N. Irby, B.L. McConnell, W.W. Cummings, R.W.Maatman, The exchange of twenty metal ions with the weakly acidic silanolgroup of silica gel, J. Phys. Chem. 68 (1964) 757–760.
[39] D.B. Kent, M. Kastner, Mg2+ removal in the system Mg2+—amorphous SiO2—H2O by adsorption and Mg-hydroxysilicate precipitation, Geochim.Cosmochim. Acta 49 (1985) 1123–1136.
[40] J. Isoya, J.A. Weil, P.H. Davis, EPR of atomic hydrogen 1H and 2H in a-quartz, J.Phys. Chem. Solids 44 (1983) 335–343.
[41] R.I. Mashkovtsev, Y.M. Pan, Biradical states of oxygen-vacancy defects inalpha-quartz: centers E ‘‘(2) and E ”(4), Phys. Chem. Miner. 38 (2011) 647–654.
[42] J.H.E. Griffiths, J. Owen, I.M. Ward, Paramagnetic resonance in neutron-irradiated diamond and smoky quartz, Nature 173 (1954) 439–440.
[43] M.C.M. Obrien, The structure of the colour centres in smoky quartz, Proc. R.Soc. Lond. Ser. A Math. Phys. Eng. Sci. 231 (1955) 404–414.
[44] J.A. Weil, A review of electron-spin spectroscopy and its application to thestudy of paramagnetic defects in crystalline quartz, Phys. Chem. Miner. 10(1984) 149–165.
[45] M. Walters, A. Reisman, Radiation-induced neutral electron trap generation inelectrically biased insulated gate field-effect transistor gate insulators, J.Electrochem. Soc. 138 (1991) 2756–2762.
[46] J.F. Conley, P.M. Lenahan, A.J. Lelis, T.R. Oldham, Electron spin resonanceevidence that E’(gamma) centers can behave as switching oxide traps, IEEETrans. Nucl. Sci. 42 (1995) 1744–1749.
[47] J. Arends, A.J. Dekker, W.G. Perdok, Color centers in quartz produced bycrushing, Physica Status Solidi (b) 3 (1963) 2275–2279.
[48] T.I. Barry, P. McNamara, W.J. Moore, Paramagnetic resonance and opticalproperties of amethyst, J. Chem. Phys. 42 (1965). 2599-&.
[49] P.B. Feng, Y. Wang, X. Rong, J.H. Su, C.Y. Ju, J.F. Du, Characterization of theelectronic structure of E-2 ’ defect in quartz by pulsed EPR spectroscopy, Phys.Lett. A 376 (2012) 2195–2199.
[50] R.I. Mashkovtsev, Y.M. Pan, Triplet states of oxygen vacancy defects in alpha-quartz: Center E-9 ’’, EPL 107 (2014) 5.
[51] S.P. Hyun, Y.H. Cho, P.S. Hahn, An electron paramagnetic resonance study of Cu(II) sorbed on quartz, J. Colloid Interface Sci. 257 (2003) 179–187.
[52] C. Zhu, In situ feldspar dissolution rates in an aquifer, Geochim. Cosmochim.Acta 69 (2005) 1435–1453.
[53] C. Zhu, D.R. Veblen, A.E. Blum, S.J. Chipera, Naturally weathered feldsparsurfaces in the Navajo Sandstone aquifer, Black Mesa, Arizona: electronmicroscopic characterization, Geochimica Et Cosmochimica Acta 70 (2006)4600–4616.
[54] J. Weissenrieder, S. Kaya, J.-L. Lu, H.-J. Gao, S. Shaikhutdinov, H.-J. Freund, M.Sierka, T. Todorova, J. Sauer, Atomic structure of a thin silica film on a Mo (112)substrate: a two-dimensional network of SiO4 tetrahedra, Phys. Rev. Lett. 95(2005) 076103.
[55] S. Kaya, J. Weissenrieder, D. Stacchiola, S. Shaikhutdinov, H.-J. Freund,Formation of an ordered ice layer on a thin silica film, J. Phys. Chem. C 111(2007) 759–764.
[56] S.R. Chowdhury, E.K. Yanful, A.R. Pratt, Chemical states in XPS and Ramananalysis during removal of Cr (VI) from contaminated water by mixedmaghemite–magnetite nanoparticles, J. Hazard. Mater. 235 (2012) 246–256.