12
Raymond James 41 st Annual Institutional Investors Conference 2019 Year End
Raymond James 41st Annual
Institutional Investors Conference
2019 Year End
2
Forward Looking Statements and Non-GAAP Financial Measures
Investor Update
This presentation may contain certain forward-looking statements provided by Company management. These statements are intended to be covered
by the safe-harbor provisions of the Private Securities Litigation Reform Act of 1995. Forward-looking statements include all statements that do not
relate solely to historical or current facts, including statements regarding future operations, financial results, cash flows, costs and cost management
initiatives, capital structure management, growth rates, and operational and strategic initiatives, and can also be identified by the use of words like
“may,” “believe,” “will,” “expect,” “project,” “estimate,” “anticipate,” “intend,” “plan,” “initiative,” “continue” or words or phrases of similar meaning. These
forward-looking statements speak only as of the date hereof and are based on our current plans and expectations and are subject to a number of
known and unknown uncertainties and risks, many of which are beyond our control. These risks and uncertainties are described under headings such
as “Risk Factors” in our annual report on Form 10-K for the year ended December 31, 2019 and other reports filed with the Securities and Exchange
Commission. As a consequence, current plans, anticipated actions and future financial position and results of operations may differ significantly from
those expressed in any forward-looking statements in today’s presentation. You are cautioned not to unduly rely on such forward-looking statements
when evaluating the information presented and we do not intend to update any of these forward-looking statements.
The presentation may contain certain non-GAAP measures, including Adjusted EBITDA.
The Company’s earnings releases for the quarter and year ended December 31, 2019, and similar earnings releases for the prior three December 31st
year ends, located on the Company’s investor relations page at www.hcahealthcare.com, include reconciliations of certain non-GAAP financial
measures with the most directly comparable financial measure calculated in accordance with GAAP. These non-GAAP financial measures should not
be considered alternatives to the GAAP financial measures.
References to “Company” used herein refer to HCA Healthcare, Inc.
and its affiliates, unless otherwise stated or indicated by context.
3
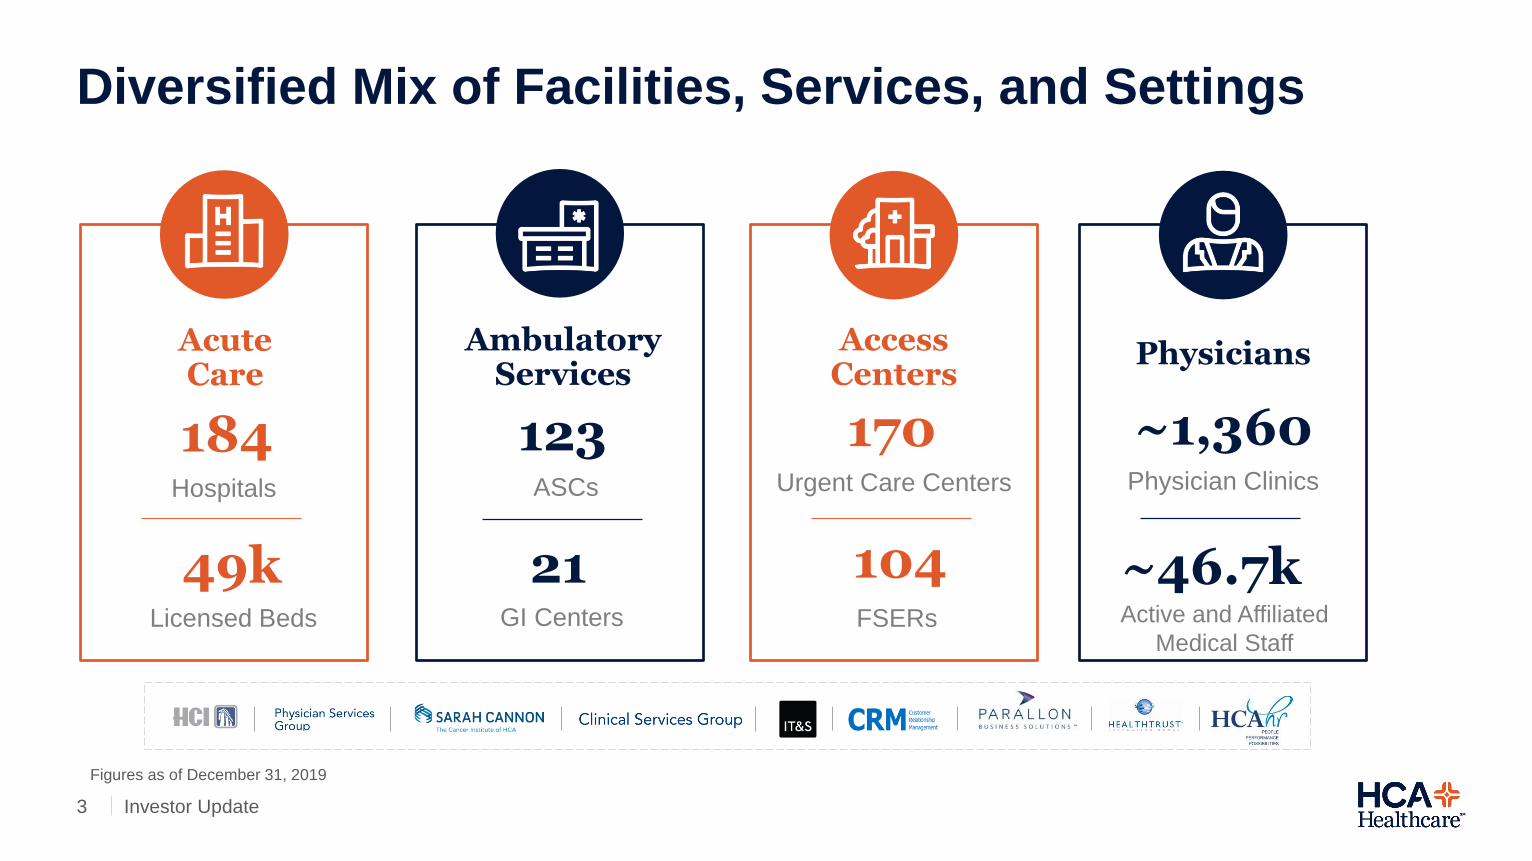
Figures as of December 31, 2019
Acute Care
184Hospitals
Licensed Beds
49k
Ambulatory Services
123ASCs
GI Centers
21
Access Centers
170Urgent Care Centers
FSERs
104
Physicians
Physician Clinics
Active and Affiliated
Medical Staff
~1,360
~46.7k
Diversified Mix of Facilities, Services, and Settings
Investor Update
4
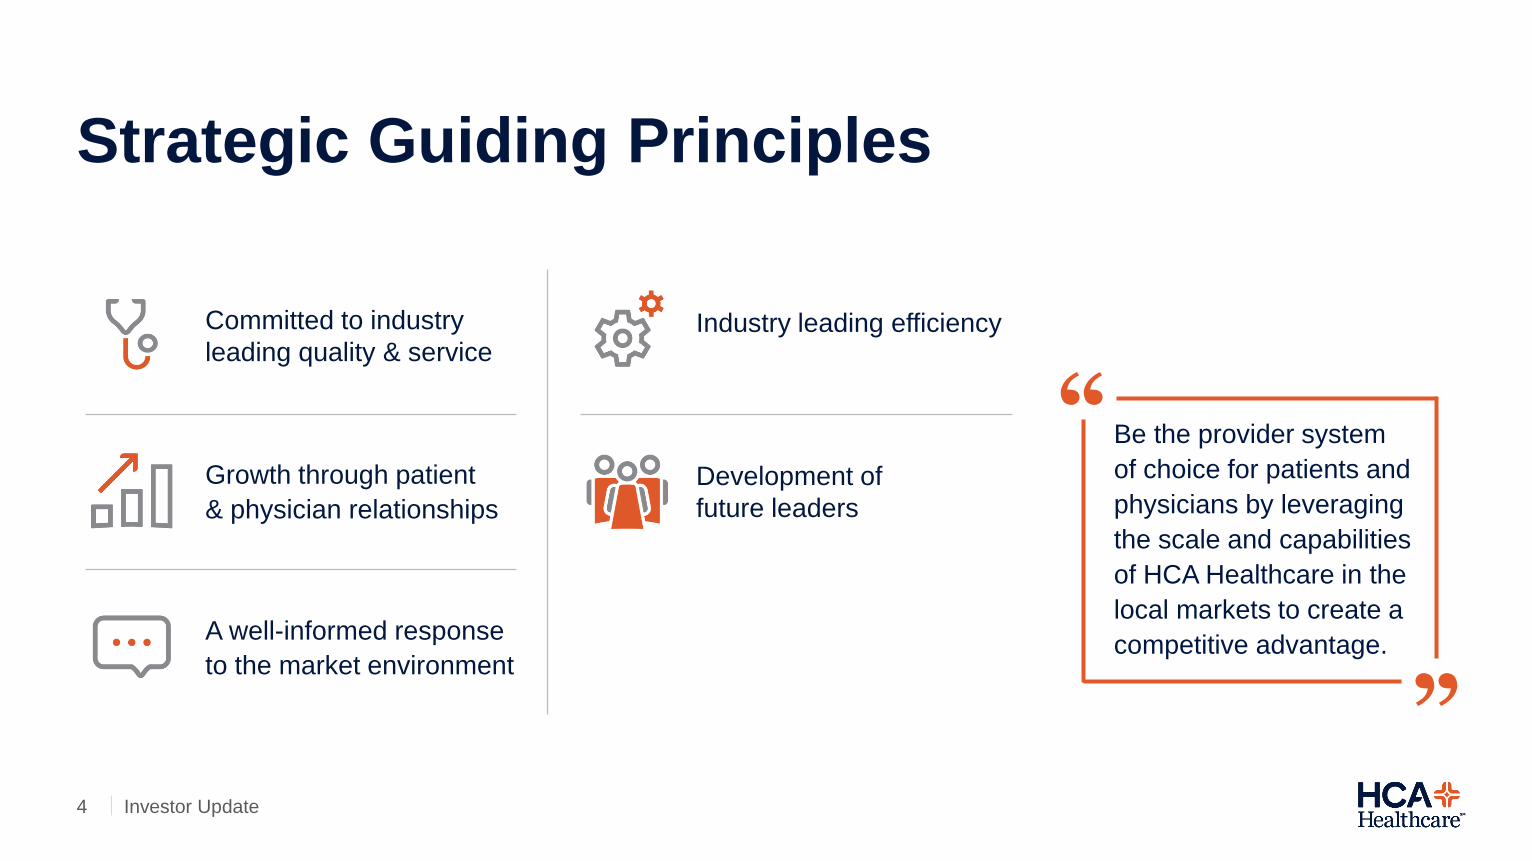
Strategic Guiding Principles
Be the provider system
of choice for patients and
physicians by leveraging
the scale and capabilities
of HCA Healthcare in the
local markets to create a
competitive advantage.
Committed to industry
leading quality & service
Growth through patient
& physician relationships
A well-informed response
to the market environment
Industry leading efficiency
Development of
future leaders
“
“
Investor Update
5
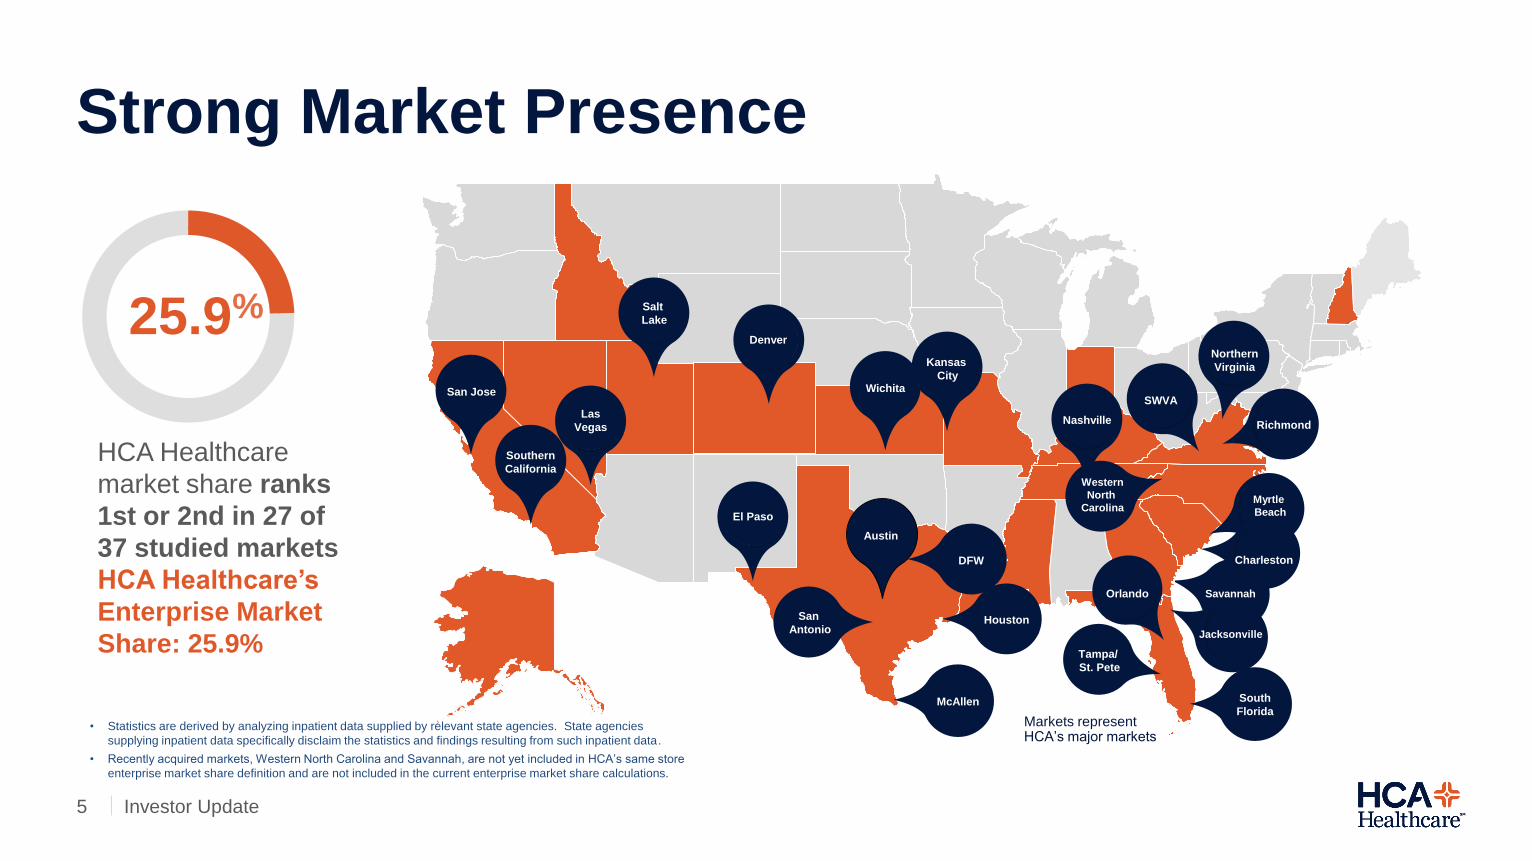
Savannah
HCA Healthcare
market share ranks
1st or 2nd in 27 of
37 studied markets
HCA Healthcare’s
Enterprise Market
Share: 25.9%
25.9%
San Jose
Southern
California
Las
Vegas
Salt
Lake
Denver
El PasoEl Paso
Wichita
Kansas
City
Austin
San
Antonio
DFW
McAllen
Houston
Nashville
Northern
Virginia
South
Florida
Richmond
Tampa/
St. Pete
SWVA
Myrtle
Beach
Charleston
Orlando
Jacksonville
Markets represent HCA’s major markets
Strong Market Presence
Investor Update
• Statistics are derived by analyzing inpatient data supplied by relevant state agencies. State agencies
supplying inpatient data specifically disclaim the statistics and findings resulting from such inpatient data.
• Recently acquired markets, Western North Carolina and Savannah, are not yet included in HCA’s same store
enterprise market share definition and are not included in the current enterprise market share calculations.
Western
North
Carolina
6
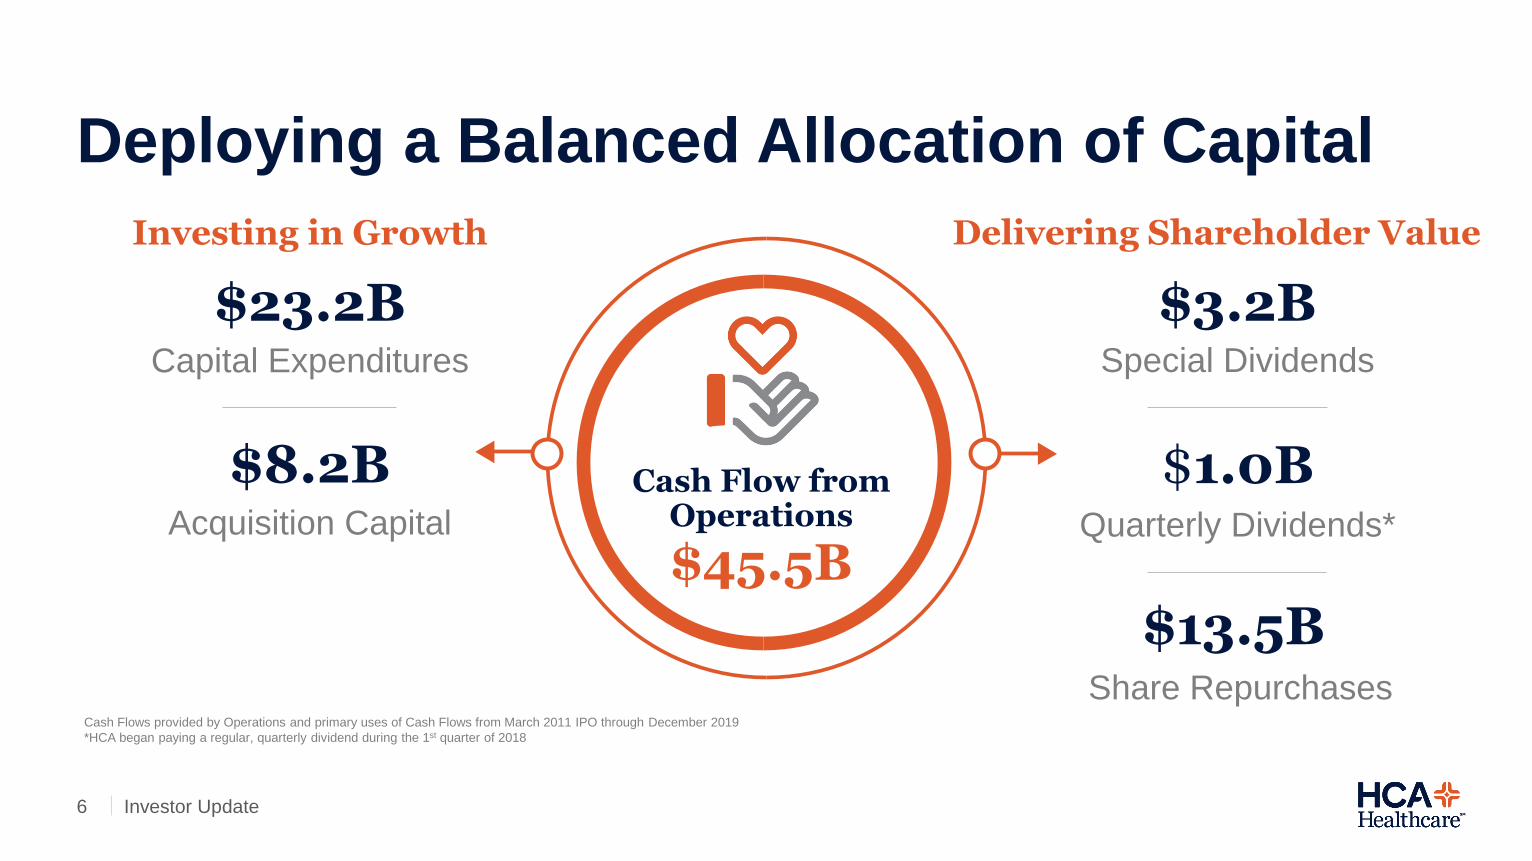
$45.5B
Cash Flow from Operations
$23.2BCapital Expenditures
Investing in Growth
$8.2BAcquisition Capital
Delivering Shareholder Value
$3.2BSpecial Dividends
$1.0BQuarterly Dividends*
$13.5BShare Repurchases
Cash Flows provided by Operations and primary uses of Cash Flows from March 2011 IPO through December 2019
*HCA began paying a regular, quarterly dividend during the 1st quarter of 2018
Deploying a Balanced Allocation of Capital
Investor Update
7
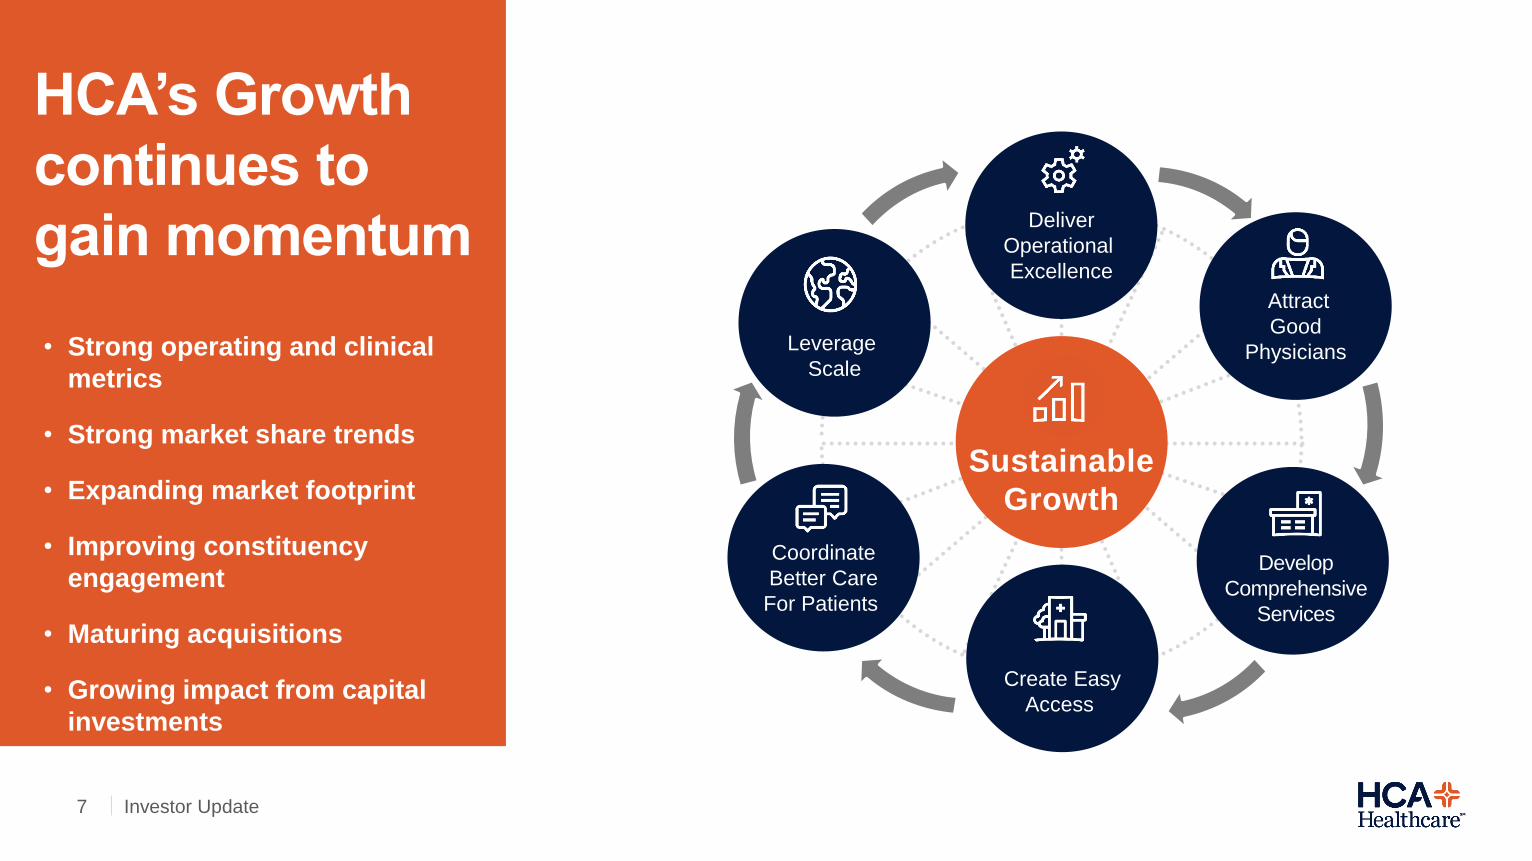
HCA’s Growth
continues to
gain momentum
Investor Update
Sustainable
Growth
Deliver
Operational
Excellence
Coordinate
Better Care
For Patients
Attract
Good
Physicians
Create Easy
Access
Leverage
Scale
Develop
Comprehensive
Services
• Strong operating and clinical
metrics
• Strong market share trends
• Expanding market footprint
• Improving constituency
engagement
• Maturing acquisitions
• Growing impact from capital
investments
8
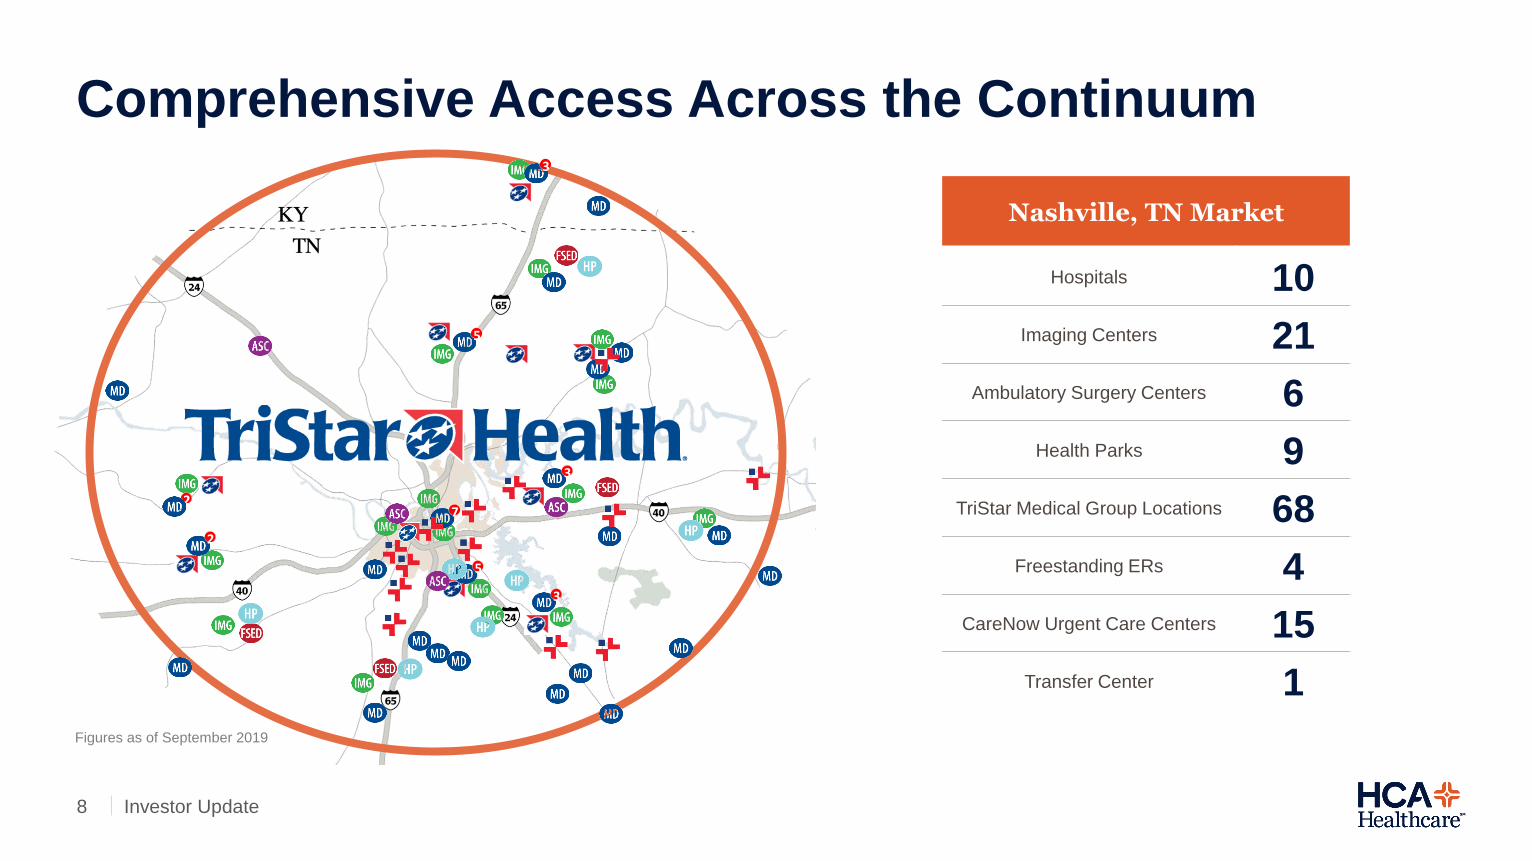
Nashville, TN Market
Hospitals 10
Imaging Centers 21
Ambulatory Surgery Centers 6
Health Parks 9
TriStar Medical Group Locations 68
Freestanding ERs 4
CareNow Urgent Care Centers 15
Transfer Center 1
Figures as of September 2019
2
3
5
3
3
5
7
2
Comprehensive Access Across the Continuum
Investor Update
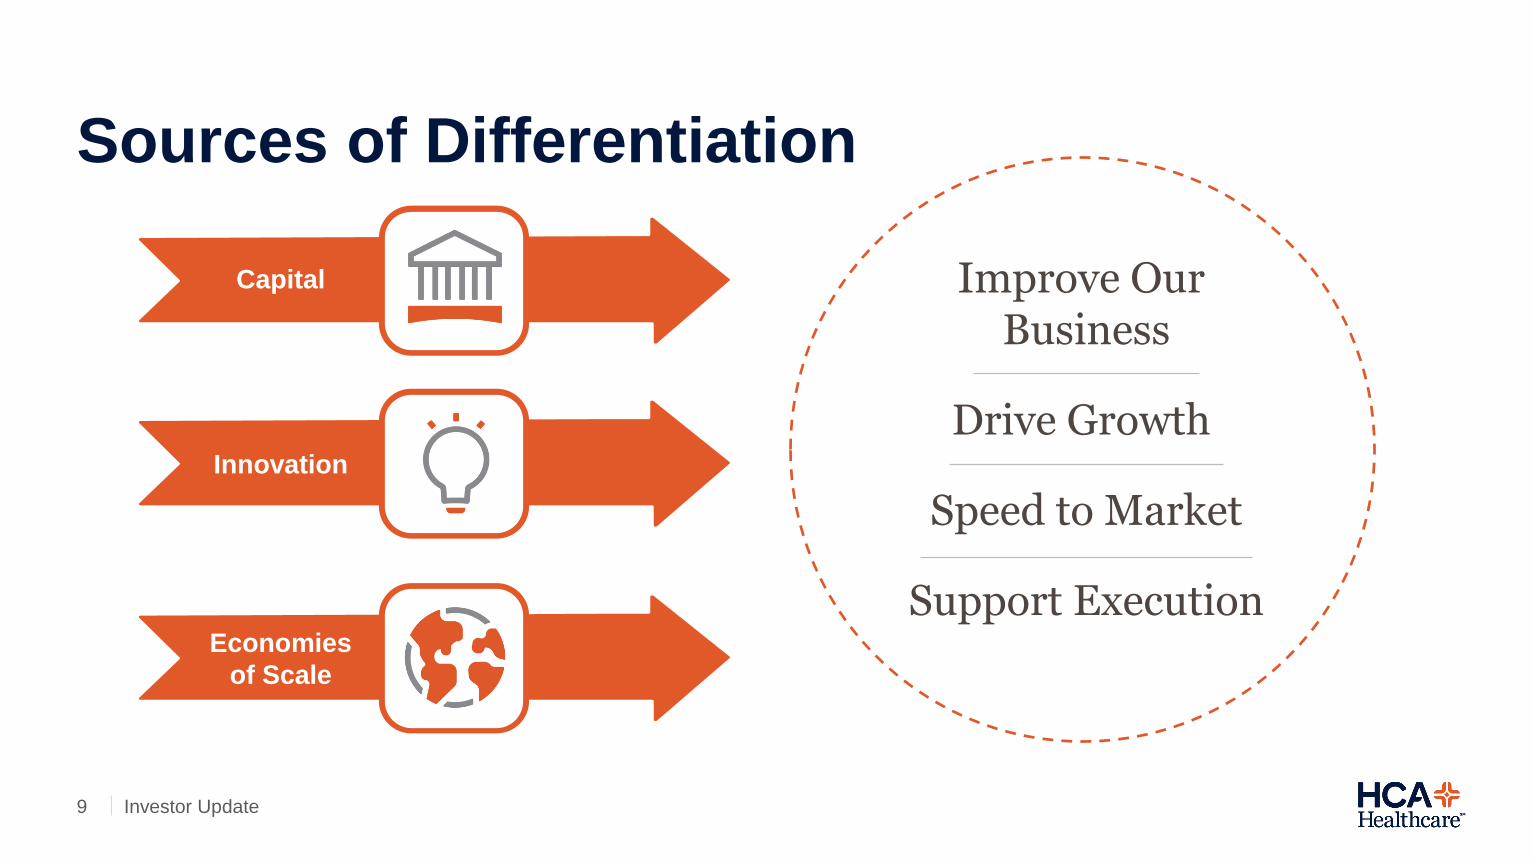
9
Improve Our Business
Drive Growth
Speed to Market
Support Execution
Capital
Innovation
Economies
of Scale
Sources of Differentiation
Investor Update
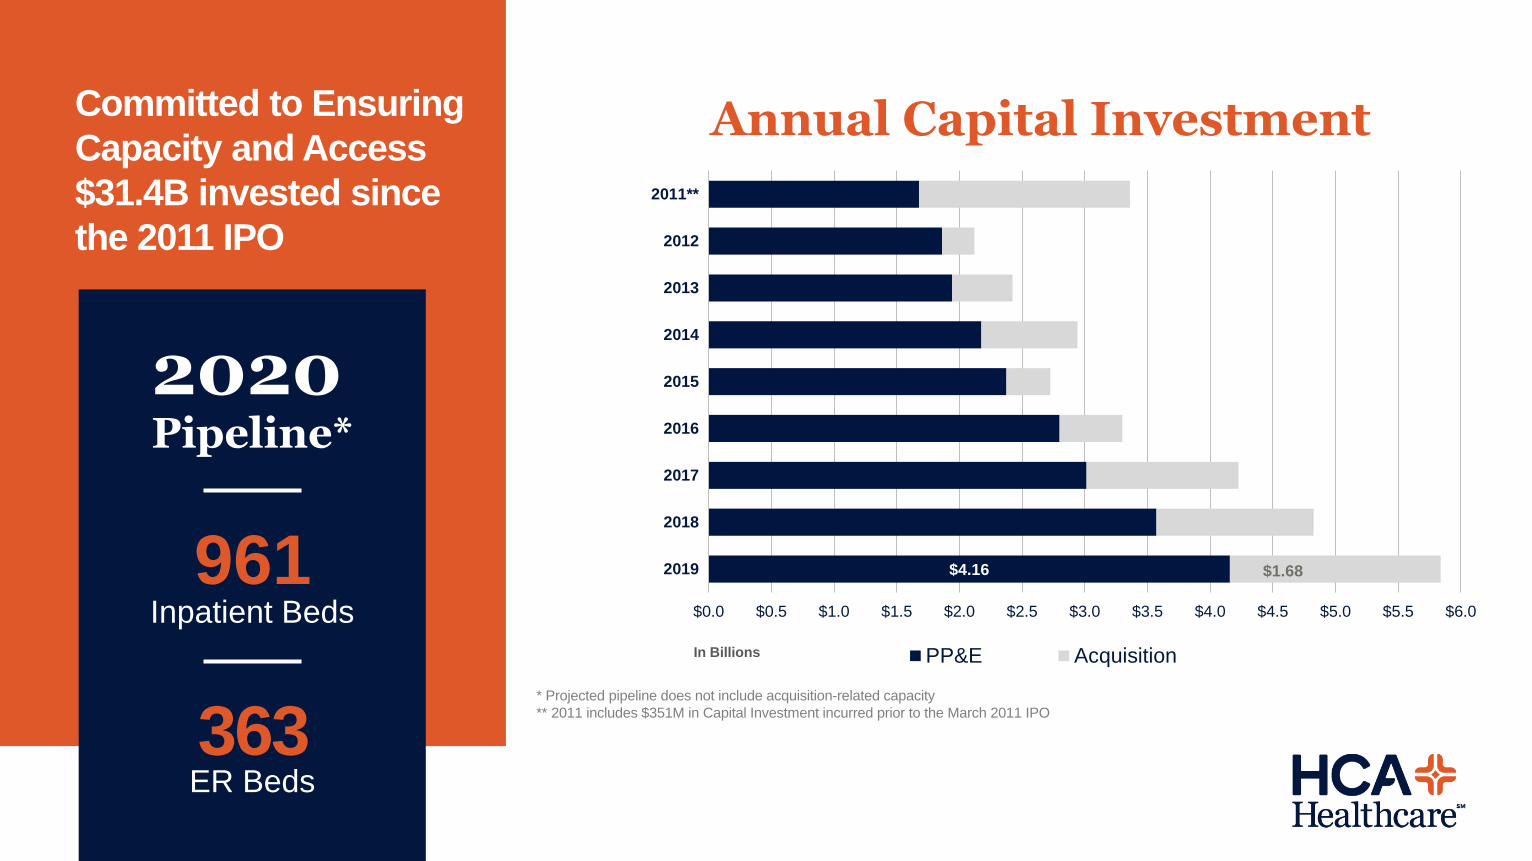
$4.16 $1.68
$0.0 $0.5 $1.0 $1.5 $2.0 $2.5 $3.0 $3.5 $4.0 $4.5 $5.0 $5.5 $6.0
2019
2018
2017
2016
2015
2014
2013
2012
2011**
PP&E Acquisition
Investor Update
Committed to Ensuring
Capacity and Access
$31.4B invested since
the 2011 IPO
Annual Capital Investment
* Projected pipeline does not include acquisition-related capacity
** 2011 includes $351M in Capital Investment incurred prior to the March 2011 IPO
961
2020Pipeline*
Inpatient Beds
363ER Beds
In Billions
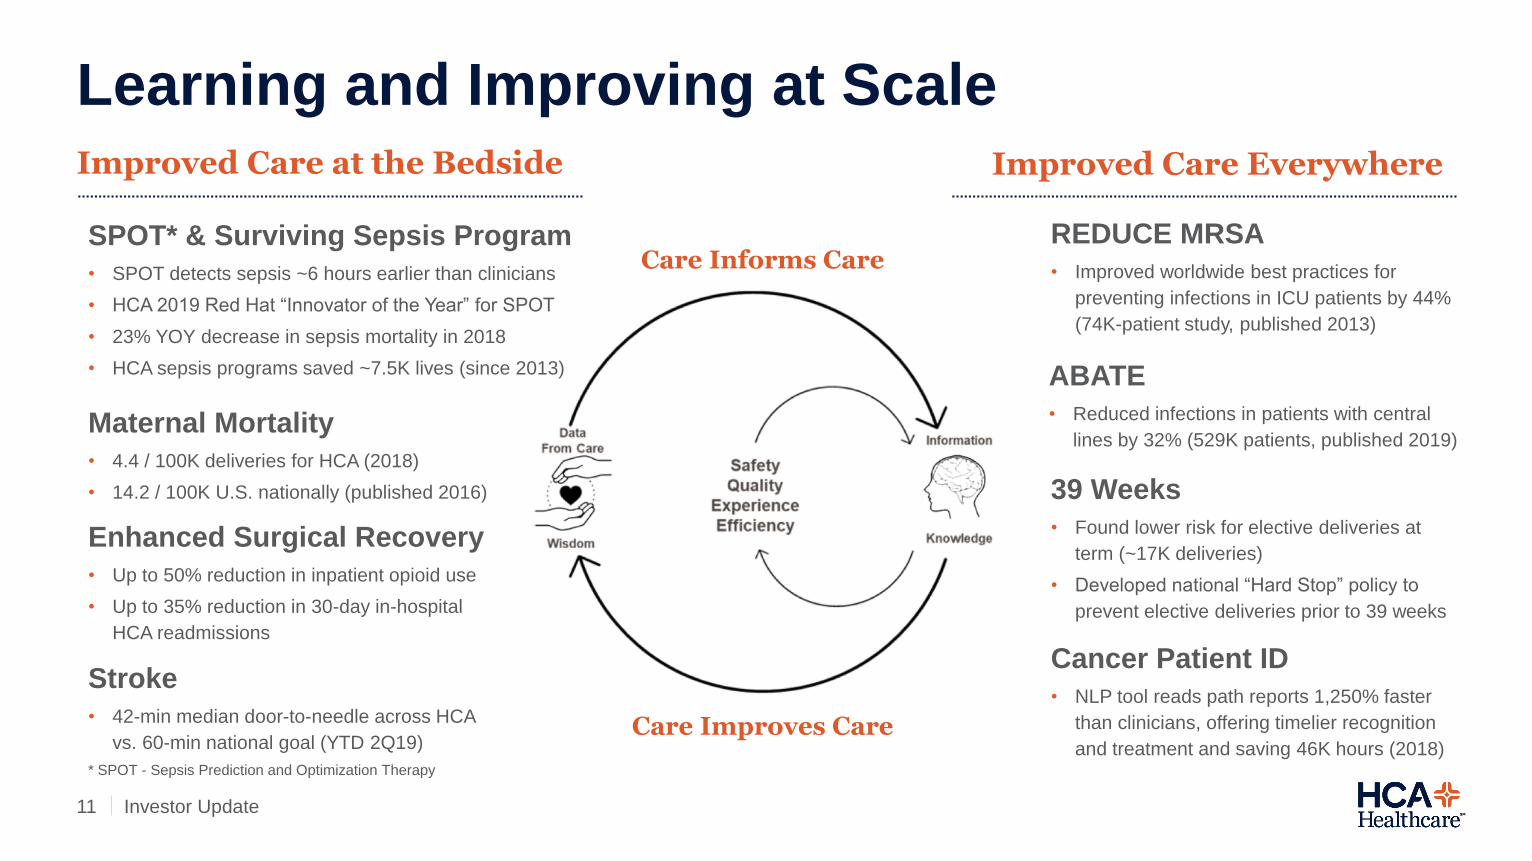
11
Learning and Improving at Scale
Care Informs Care
Care Improves Care
Improved Care EverywhereImproved Care at the Bedside
Cancer Patient ID
• NLP tool reads path reports 1,250% faster
than clinicians, offering timelier recognition
and treatment and saving 46K hours (2018)
39 Weeks
• Found lower risk for elective deliveries at
term (~17K deliveries)
• Developed national “Hard Stop” policy to
prevent elective deliveries prior to 39 weeks
ABATE
• Reduced infections in patients with central
lines by 32% (529K patients, published 2019)
REDUCE MRSA
• Improved worldwide best practices for
preventing infections in ICU patients by 44%
(74K-patient study, published 2013)
Stroke
• 42-min median door-to-needle across HCA
vs. 60-min national goal (YTD 2Q19)
Enhanced Surgical Recovery
• Up to 50% reduction in inpatient opioid use
• Up to 35% reduction in 30-day in-hospital
HCA readmissions
Maternal Mortality
• 4.4 / 100K deliveries for HCA (2018)
• 14.2 / 100K U.S. nationally (published 2016)
SPOT* & Surviving Sepsis Program
• SPOT detects sepsis ~6 hours earlier than clinicians
• HCA 2019 Red Hat “Innovator of the Year” for SPOT
• 23% YOY decrease in sepsis mortality in 2018
• HCA sepsis programs saved ~7.5K lives (since 2013)
Investor Update
* SPOT - Sepsis Prediction and Optimization Therapy
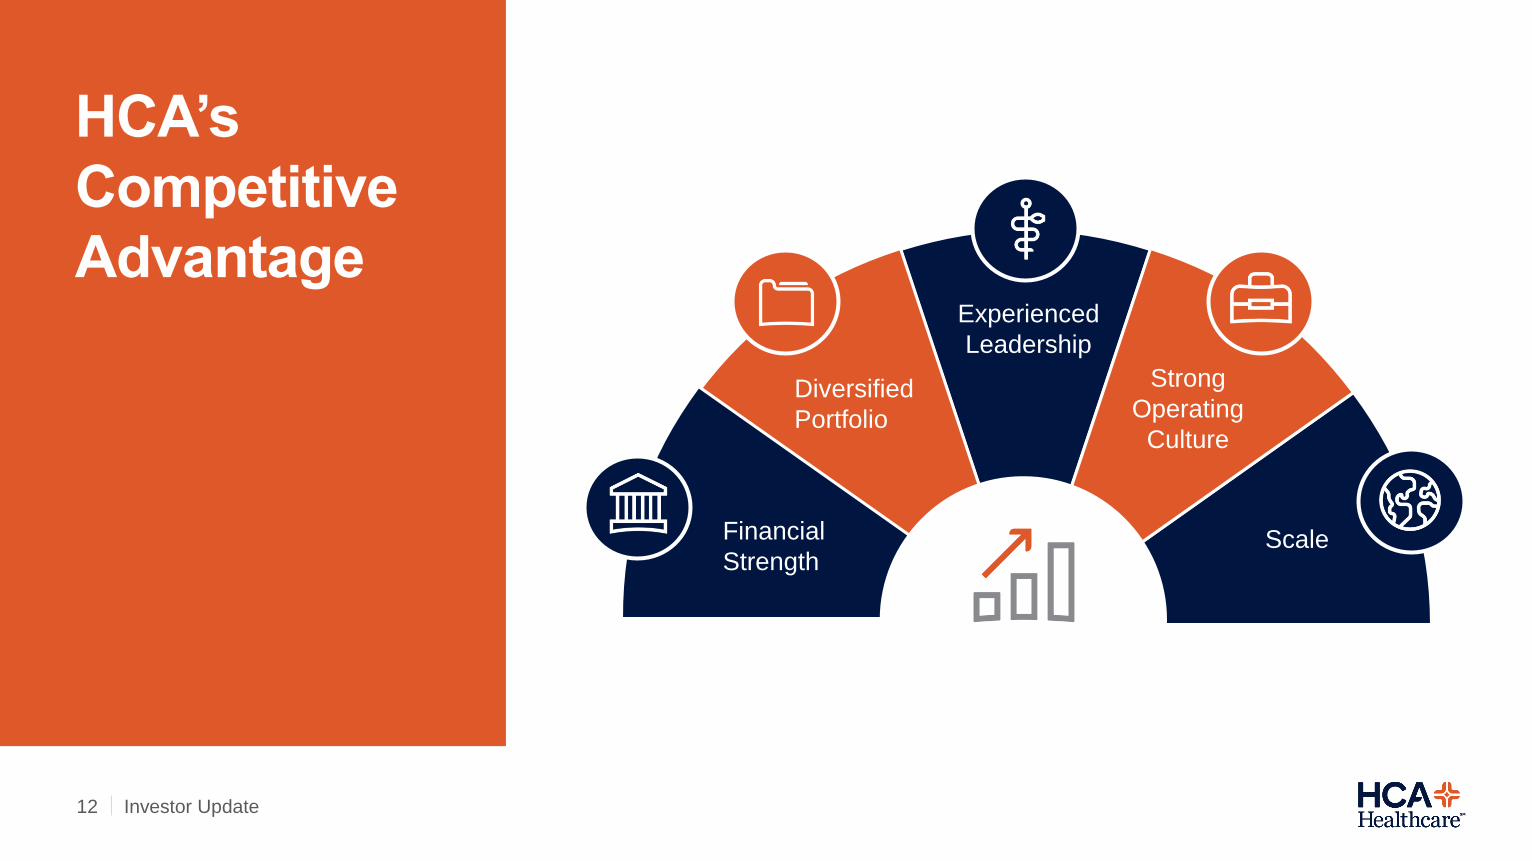
12
HCA’s
Competitive
AdvantageExperienced
Leadership
Strong
Operating
Culture
Scale
Diversified
Portfolio
Financial
Strength
Investor Update


![Transcript of the Conference Call with Analyst/ Institutional Investors [Company Update]](https://static.documents.pub/doc/80x56/577ca6bf1a28abea748c0255/transcript-of-the-conference-call-with-analyst-institutional-investors-company.jpg)


