Interannual variability of the satellite observed and WRF modeled soil moisture in connection with dust events Min Huang 1 ([email protected]) G. Carmichael 2 , D. Tong 1 1 George Mason University, USA; 2 U Iowa, USA Acknowledgements to: CCI soil moisture and SMAP data teams NASA SUSMAP and NCA funding CCI Soil Moisture User Workshop | Vienna, Austria | 18/09/2017 Dust storm in Phoenix, Arizona, on Aug 23, 2017
Transcript
Interannual variability of the satellite observed and
WRF modeled soil moisture in connection with dust events
•V3: wetter than V2 in 2005, drier than V2 in 2011 •V3P shows stronger interannual variability than V3C• Strongest anti-correlation: V3C SM and DOD anomaly, followed by V3P and DOD
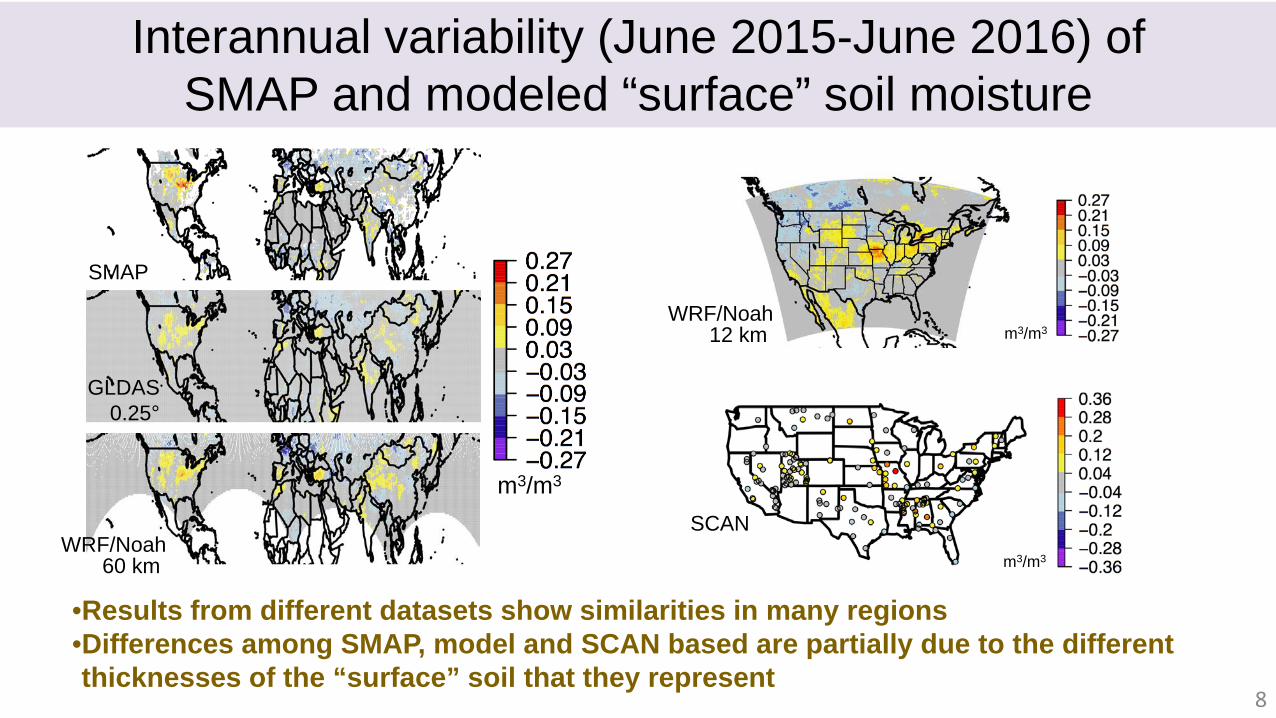
SMAP
GLDAS0.25°
WRF/Noah60 km
m3/m3
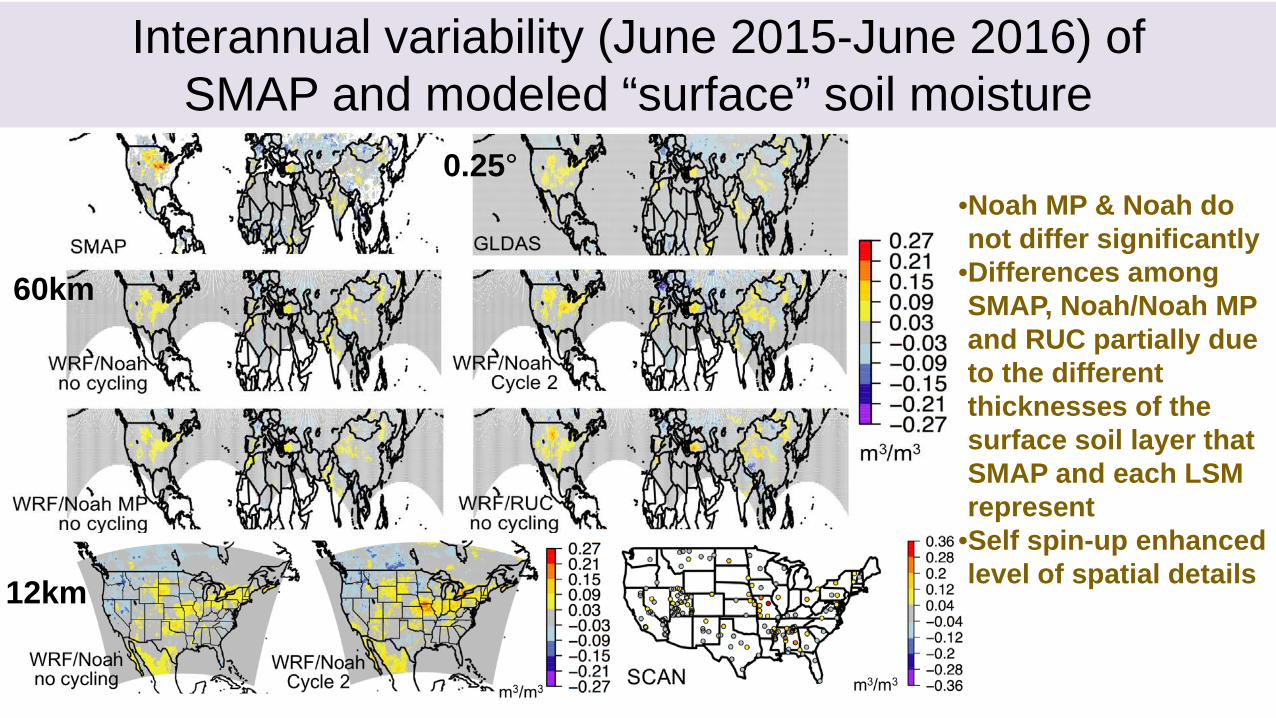
Interannual variability (June 2015-June 2016) of SMAP and modeled “surface” soil moisture
SCAN
m3/m3
WRF/Noah12 km m3/m3
•Results from different datasets show similarities in many regions•Differences among SMAP, model and SCAN based are partially due to the different thicknesses of the “surface” soil that they represent
8
SMAP SM
WRF SM
m3/m3
MODIS NDVI-based dust source probability in 2016 (~1% larger than in 2015 in total)
• Drier and windier in N Africa in 2015 than in 2016, moister and less windy in W US and NW China
• WRF shows similar SM interannualvariability to SMAP
9
W US N Africa NW ChinaSMAP SM 6e-5 -0.01 0.001WRF SM 0.014 -0.011 0.023WRF frictionvelocity
-0.006 0.011 -0.007
Regional mean values:
Interannual variability (June 2015-June 2016) of vegetation, soil moisture, winds – which impact soil dust emissions
Interannual variability (June 2015-June 2016) of dust frequency in relation to land/atmospheric weather
•June 2016 compared to June 2015:othe drier/windier W US and NW China: dustierothe moister/windier N Africa regions: less dusty
•MODIS may have missed some dust events at other times; In-situ data analysis added10
AQS PM10, at 17 LST
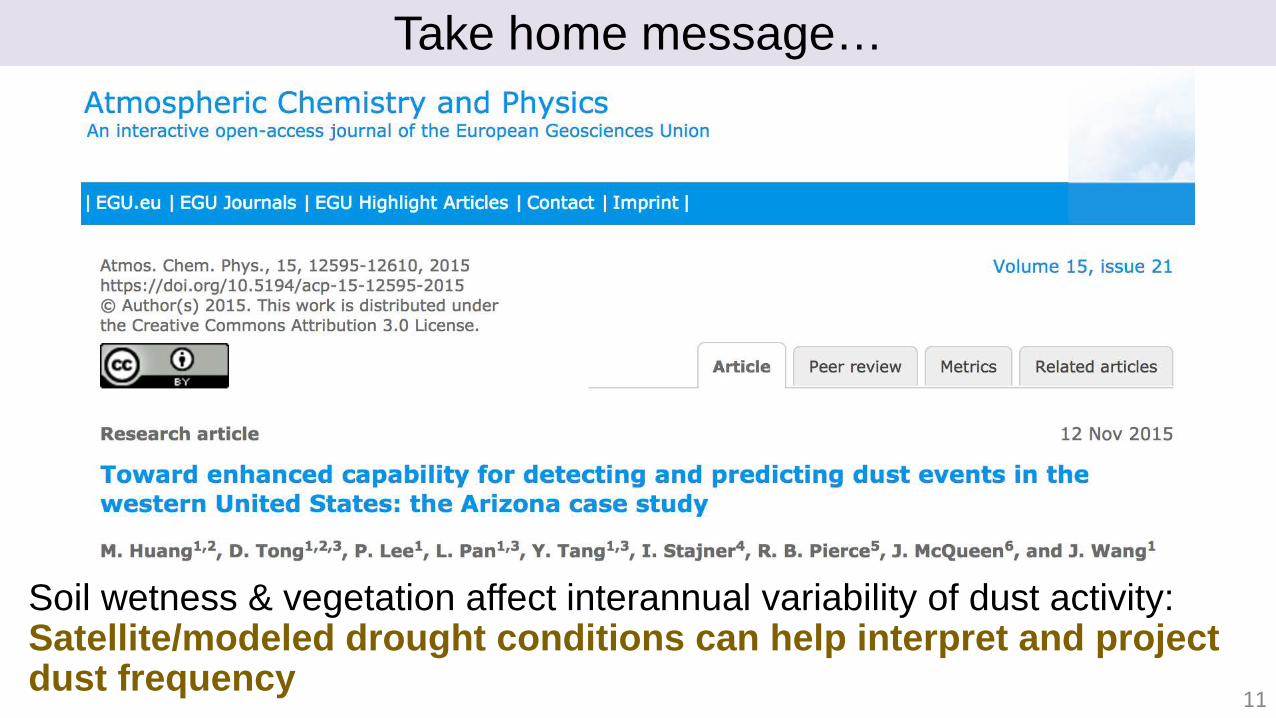
Soil wetness & vegetation affect interannual variability of dust activity: Satellite/modeled drought conditions can help interpret and project dust frequency
11
Take home message…
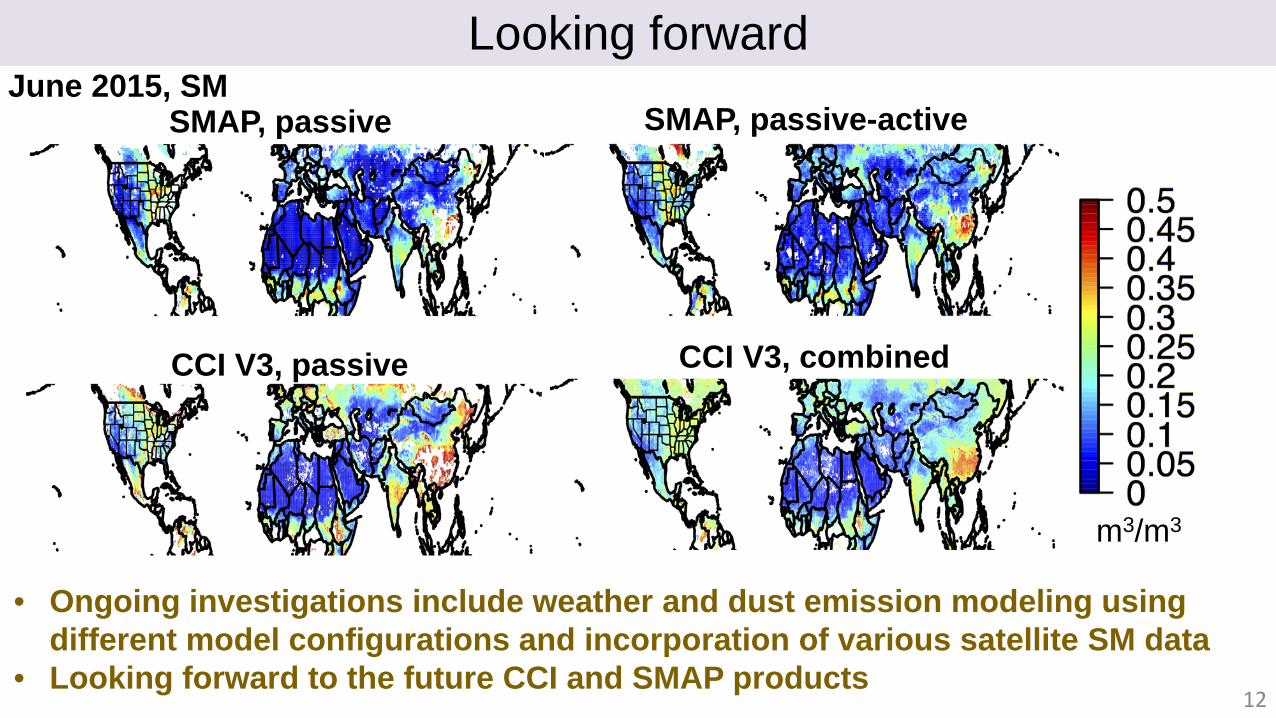
• Ongoing investigations include weather and dust emission modeling using different model configurations and incorporation of various satellite SM data
• Looking forward to the future CCI and SMAP products
Looking forward
m3/m3
SMAP, passive SMAP, passive-active
CCI V3, combinedCCI V3, passive
12
June 2015, SM
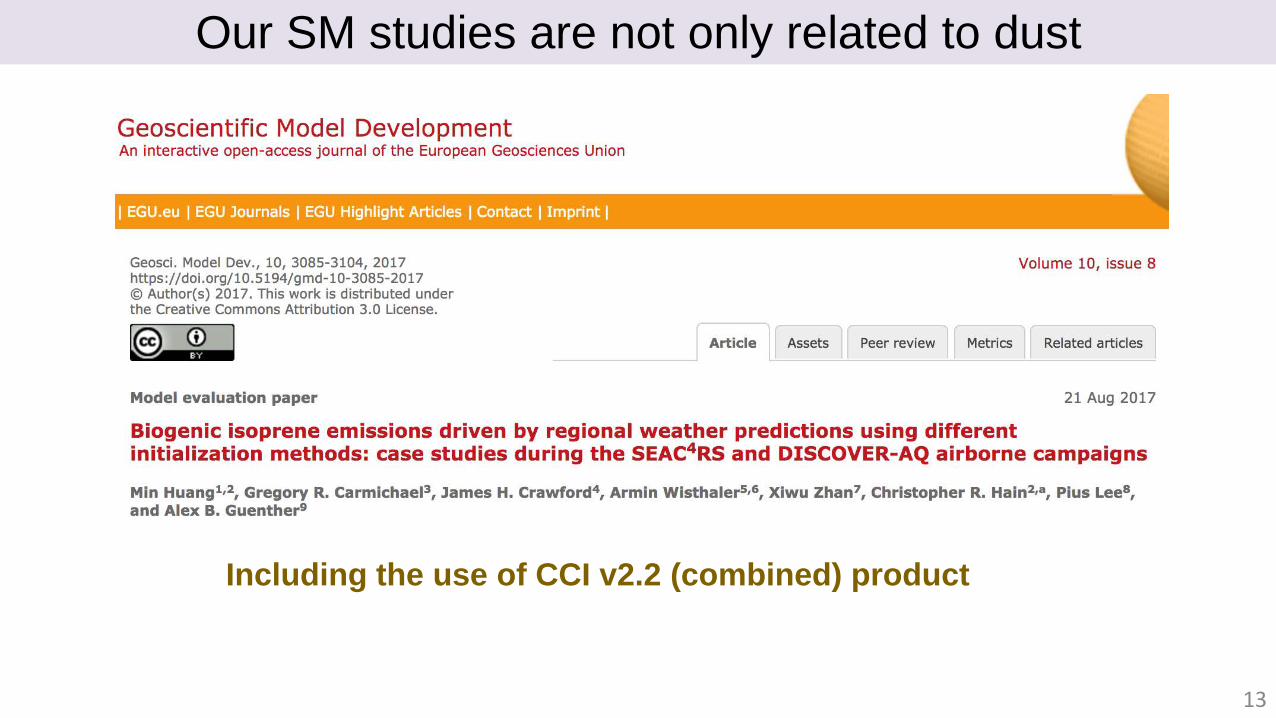
Our SM studies are not only related to dust
Including the use of CCI v2.2 (combined) product
13
60km
0.25°
Interannual variability (June 2015-June 2016) of SMAP and modeled “surface” soil moisture
12km
•Noah MP & Noah do not differ significantly
•Differences among SMAP, Noah/Noah MP and RUC partially due to the different thicknesses of the surface soil layer that SMAP and each LSM represent