
Interannual variability of the satellite observed and
WRF modeled soil moisture in connection with dust events
Min Huang1 ([email protected]) G. Carmichael2, D. Tong1
1George Mason University, USA; 2U Iowa, USAAcknowledgements to: CCI soil moisture and SMAP data teams
NASA SUSMAP and NCA funding
CCI Soil Moisture User Workshop | Vienna, Austria | 18/09/2017Dust storm in Phoenix, Arizona, on Aug 23, 2017

Ecosystems•Nourishes forests•Neutralizes acid rain
Climate•Absorbs sunlight•Reduces the planetary albedo over bright surfaces
•Deposition on snow/ice & accelerate their melting
•Modifies monsoon
Human life•May be associated with certain human diseases such as the “valley fever”
•Degrades visibility and prevents normal outdoor activities and transportation
The 1930s “dust bowl” A 2015 dust storm, Las Vegas
Goudie, 2013; Panikkath et al., 2013 Carslaw et al., 2010; Brahney et al., 2013; Zhao et al., 2012 2
Dust affects human life, ecosystems, climate
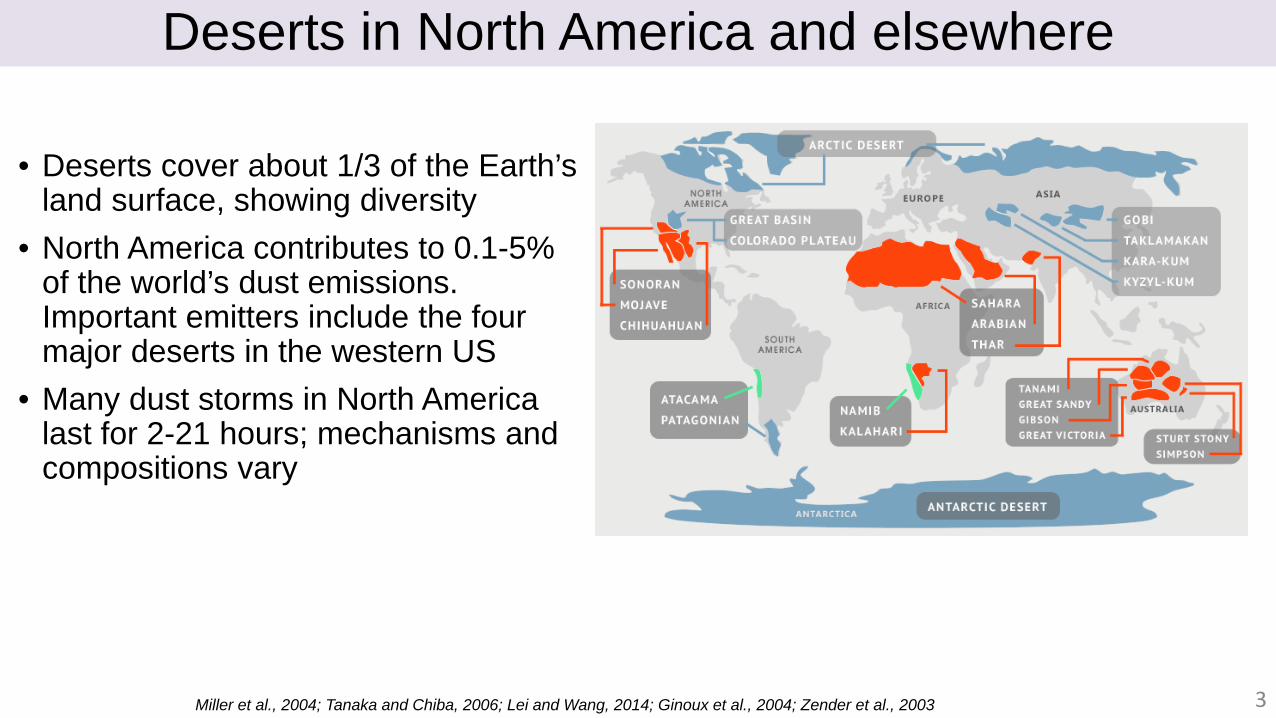
Deserts in North America and elsewhere
• Deserts cover about 1/3 of the Earth’s land surface, showing diversity
• North America contributes to 0.1-5% of the world’s dust emissions. Important emitters include the four major deserts in the western US
• Many dust storms in North America last for 2-21 hours; mechanisms and compositions vary
Miller et al., 2004; Tanaka and Chiba, 2006; Lei and Wang, 2014; Ginoux et al., 2004; Zender et al., 2003 3

• Extra-regional impacts: SW US weaker than NW US
Non-US contributions in spring 2001, larger than in other seasons
Fairlie et al., 2007
4
Dust temporal changes in the Western US
• Need to extend and better understand the temporal changes of dust activities (incl. connection with soil moisture) using diverse datasets
Brahney et al., 2013
• Multi-decadal in-situ observations showed intensified dust activities in the western US with weaker extra-regional impacts

MODIS dust optical depth (DOD, representing scenes dominated by dust), spring-summer 2005-2013
•Spatial variability: high from Sonoran desert to Phoenix •Diurnal variability: Terra (late a.m.) < Aqua (early p.m.)
Method in Ginoux et al., 2012
5

MODIS DOD in relation to three drought indicators, spring-summer 2005-2013
•Persistently dry/hot weather in spring-summer, except 05, 08, 10 •MODIS NDVI and CCI soil moisture reflect spatial and temporal drought variability
r(SM, DOD) = -0.58r(NDVI, DOD) = -0.82r(PDSI, DOD) = -0.79
2005 (wet) 2011 (dry)
MODIS NDVI
CCI SM, v2.1 combined
m3/m3
DOD-drought connections:•Spatially: In all years dustier in drier regions (SW Arizona)
•Temporally: overall less dusty in wet years 6

CCI version impact on soil moisture interannual variability
r(SMV2C, DOD) = -0.58r(SMV3C, DOD) = -0.88r(SMV3P, DOD) = -0.68
2005 (wet) 2011 (dry)
m3/m3
V2C
V3C
V3P
5%
0.8%
-8%
-18%
7
•V3: wetter than V2 in 2005, drier than V2 in 2011 •V3P shows stronger interannual variability than V3C• Strongest anti-correlation: V3C SM and DOD anomaly, followed by V3P and DOD
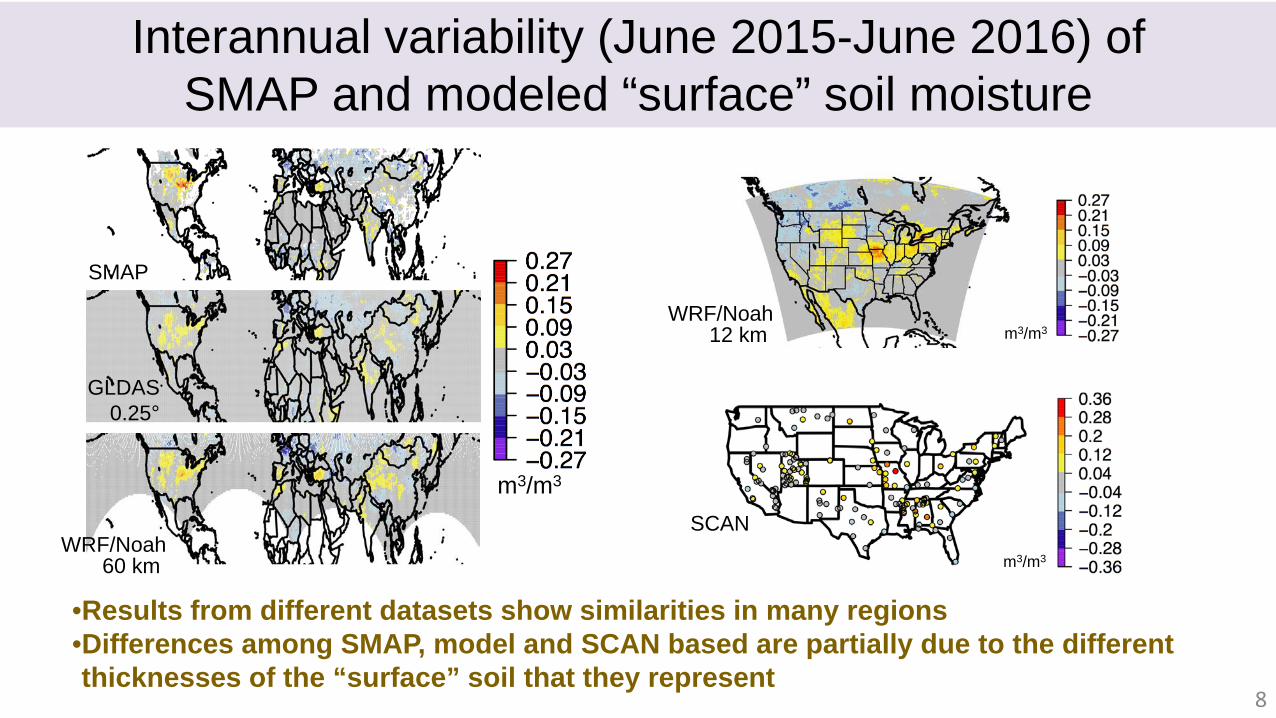
SMAP
GLDAS0.25°
WRF/Noah60 km
m3/m3
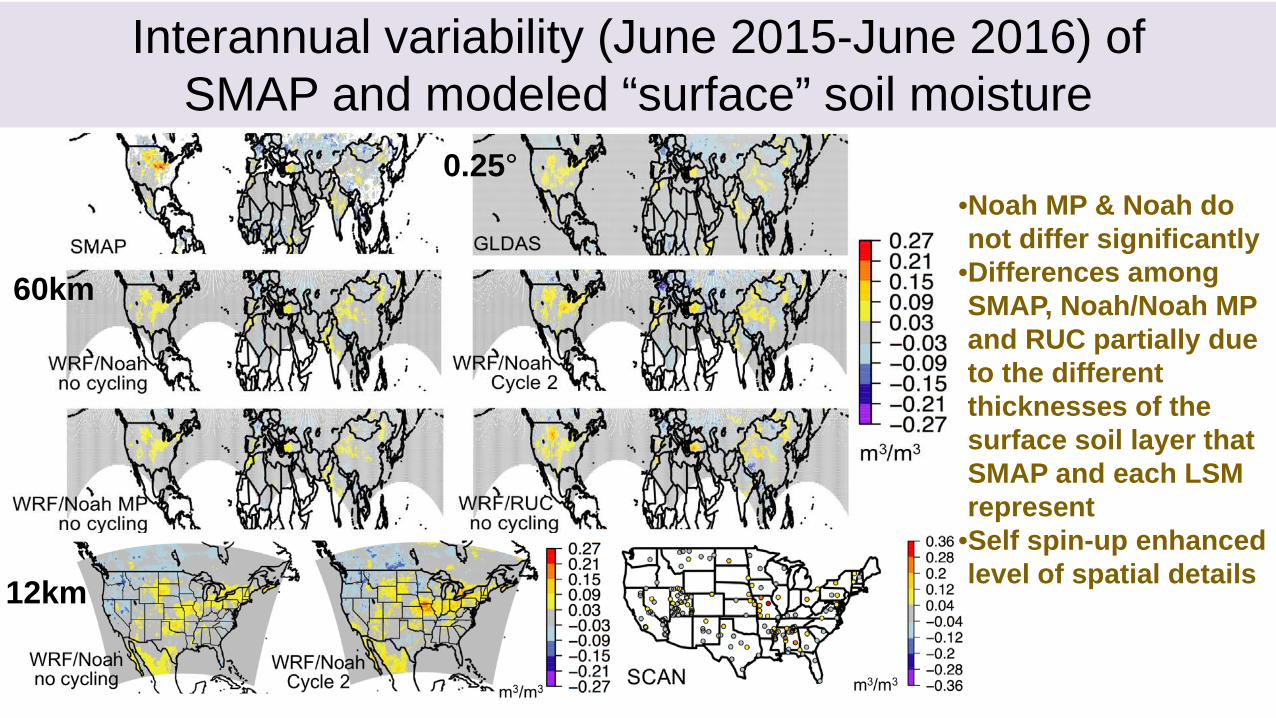
Interannual variability (June 2015-June 2016) of SMAP and modeled “surface” soil moisture
SCAN
m3/m3
WRF/Noah12 km m3/m3
•Results from different datasets show similarities in many regions•Differences among SMAP, model and SCAN based are partially due to the different thicknesses of the “surface” soil that they represent
8

SMAP SM
WRF SM
m3/m3
MODIS NDVI-based dust source probability in 2016 (~1% larger than in 2015 in total)
• Drier and windier in N Africa in 2015 than in 2016, moister and less windy in W US and NW China
• WRF shows similar SM interannualvariability to SMAP
9
W US N Africa NW ChinaSMAP SM 6e-5 -0.01 0.001WRF SM 0.014 -0.011 0.023WRF frictionvelocity
-0.006 0.011 -0.007
Regional mean values:
Interannual variability (June 2015-June 2016) of vegetation, soil moisture, winds – which impact soil dust emissions

Interannual variability (June 2015-June 2016) of dust frequency in relation to land/atmospheric weather
•June 2016 compared to June 2015:othe drier/windier W US and NW China: dustierothe moister/windier N Africa regions: less dusty
•MODIS may have missed some dust events at other times; In-situ data analysis added10
AQS PM10, at 17 LST
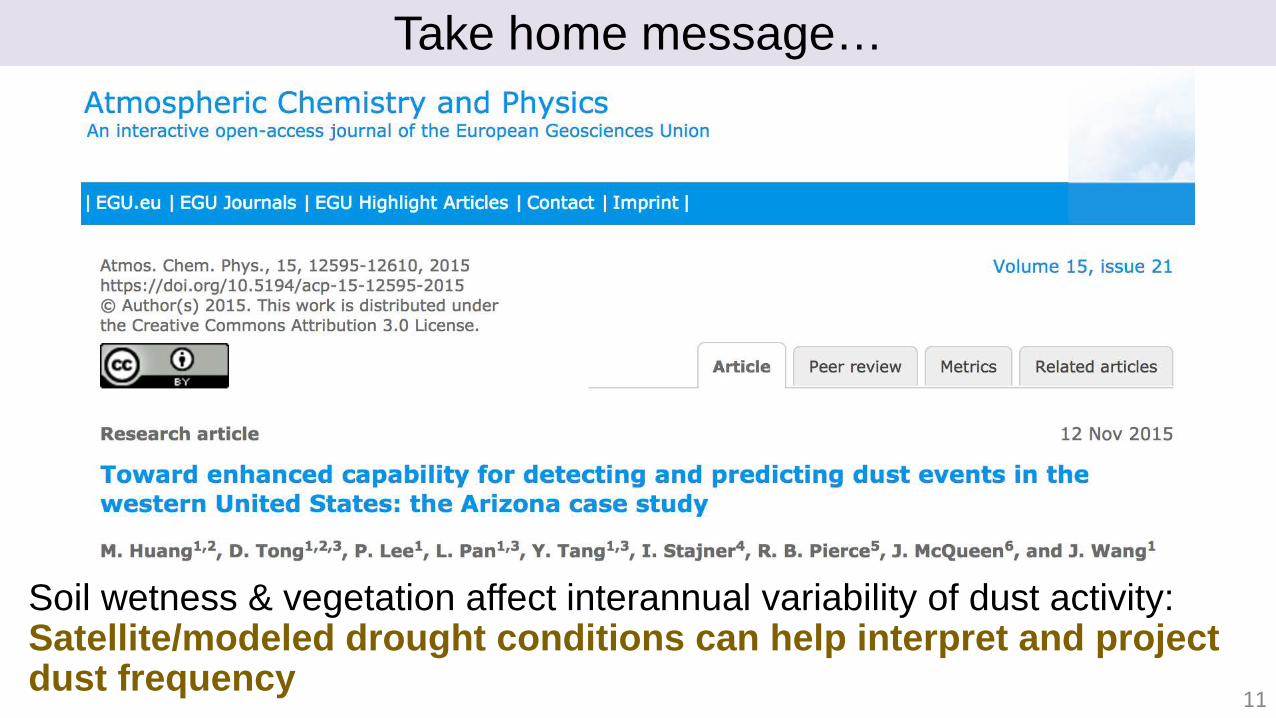
Soil wetness & vegetation affect interannual variability of dust activity: Satellite/modeled drought conditions can help interpret and project dust frequency
11
Take home message…
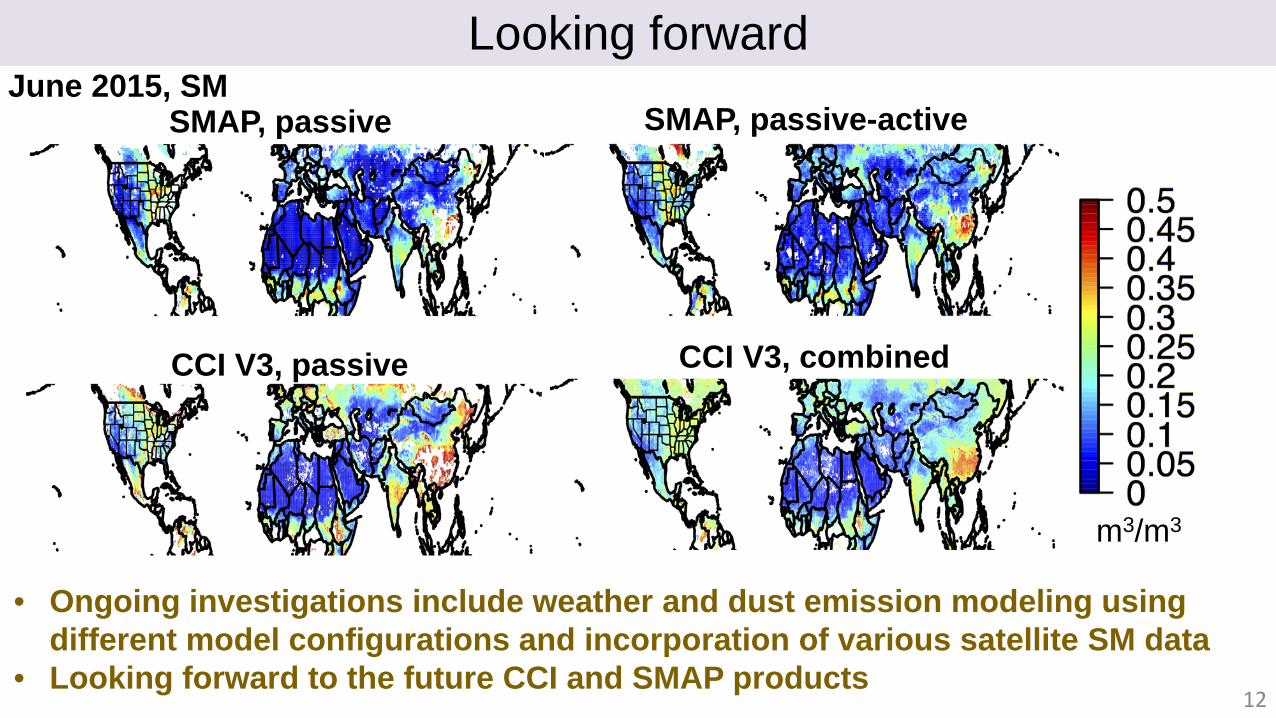
• Ongoing investigations include weather and dust emission modeling using different model configurations and incorporation of various satellite SM data
• Looking forward to the future CCI and SMAP products
Looking forward
m3/m3
SMAP, passive SMAP, passive-active
CCI V3, combinedCCI V3, passive
12
June 2015, SM
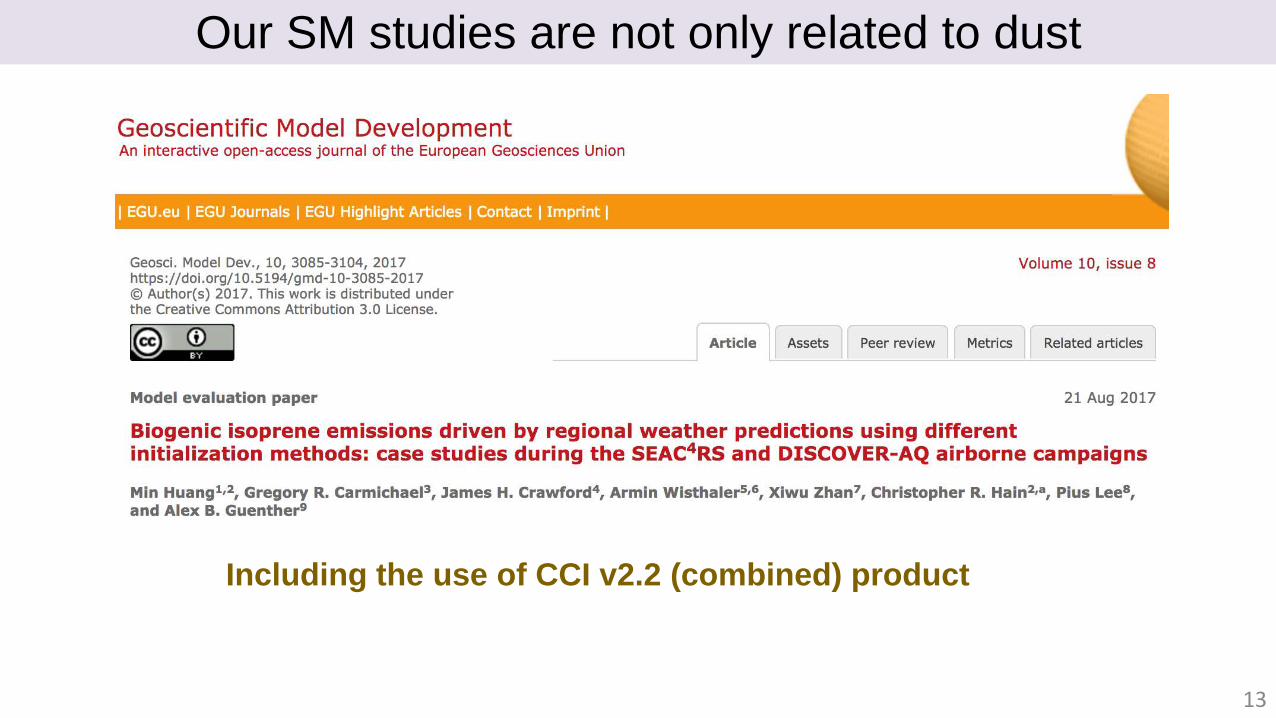
Our SM studies are not only related to dust
Including the use of CCI v2.2 (combined) product
13
60km
0.25°
Interannual variability (June 2015-June 2016) of SMAP and modeled “surface” soil moisture
12km
•Noah MP & Noah do not differ significantly
•Differences among SMAP, Noah/Noah MP and RUC partially due to the different thicknesses of the surface soil layer that SMAP and each LSM represent
•Self spin-up enhanced level of spatial details


