48
Interference at Cellular Systems Gunawan Wibisono
| Date post: | 14-Apr-2018 |
| Category: |
Documents |
| Upload: | bernardhenryp |
| View: | 222 times |
| Download: | 0 times |
7/27/2019 Interference at Cellular Systems Gunawan W 29052013
http://slidepdf.com/reader/full/interference-at-cellular-systems-gunawan-w-29052013 1/48
Interference at Cellular Systems
Gunawan Wibisono
7/27/2019 Interference at Cellular Systems Gunawan W 29052013
http://slidepdf.com/reader/full/interference-at-cellular-systems-gunawan-w-29052013 2/48
Agenda
• Cellular Technology
• Frequency Spectrum
•
Interferences• Interference Mitigation
7/27/2019 Interference at Cellular Systems Gunawan W 29052013
http://slidepdf.com/reader/full/interference-at-cellular-systems-gunawan-w-29052013 3/48
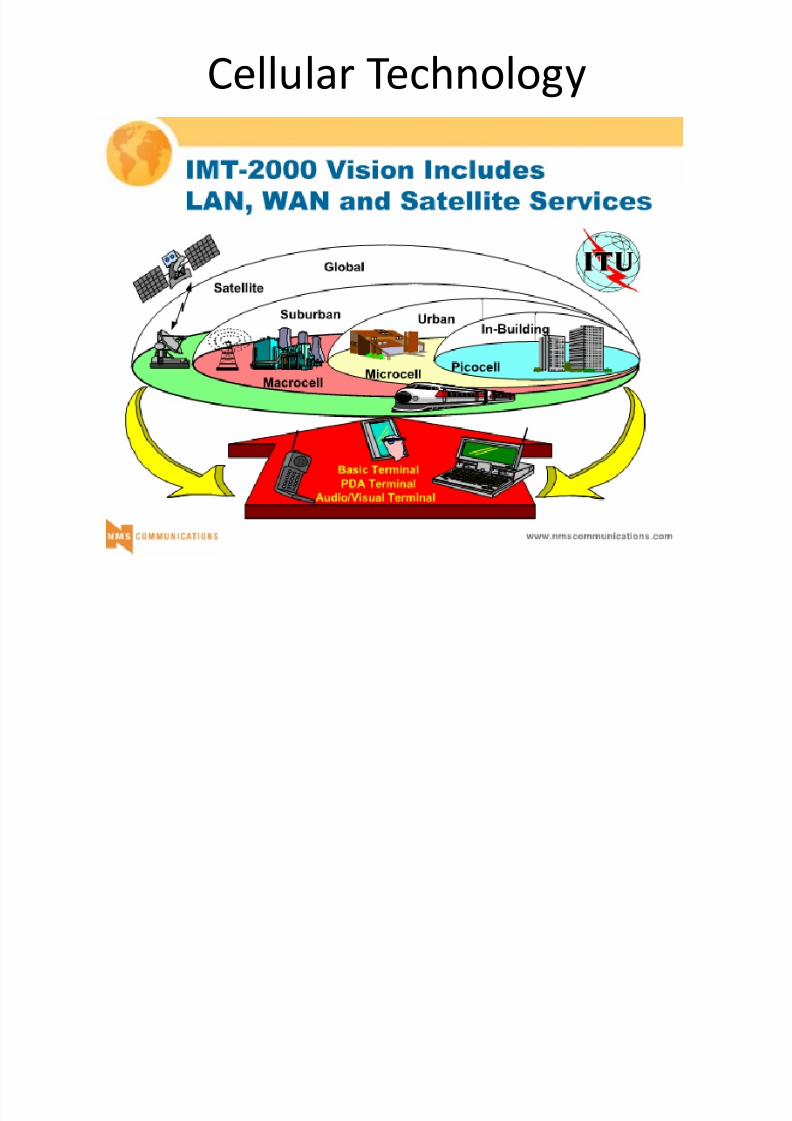
Cellular Technology
7/27/2019 Interference at Cellular Systems Gunawan W 29052013
http://slidepdf.com/reader/full/interference-at-cellular-systems-gunawan-w-29052013 4/48
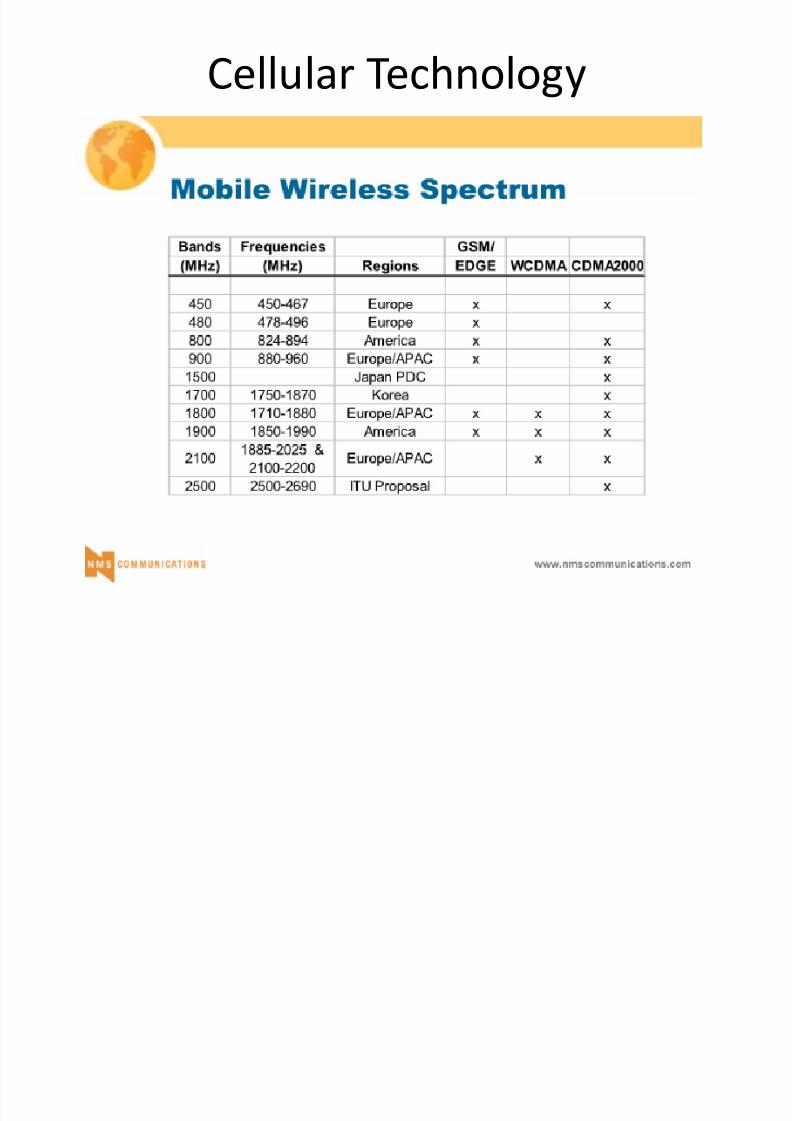
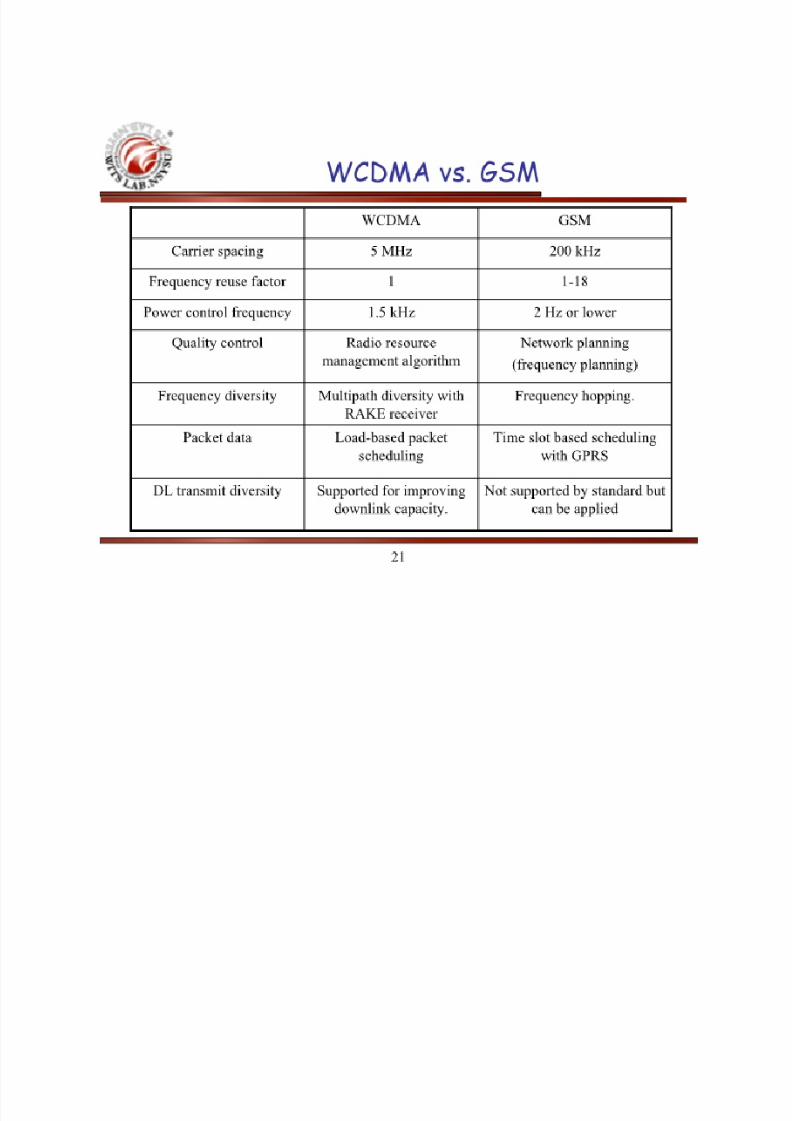
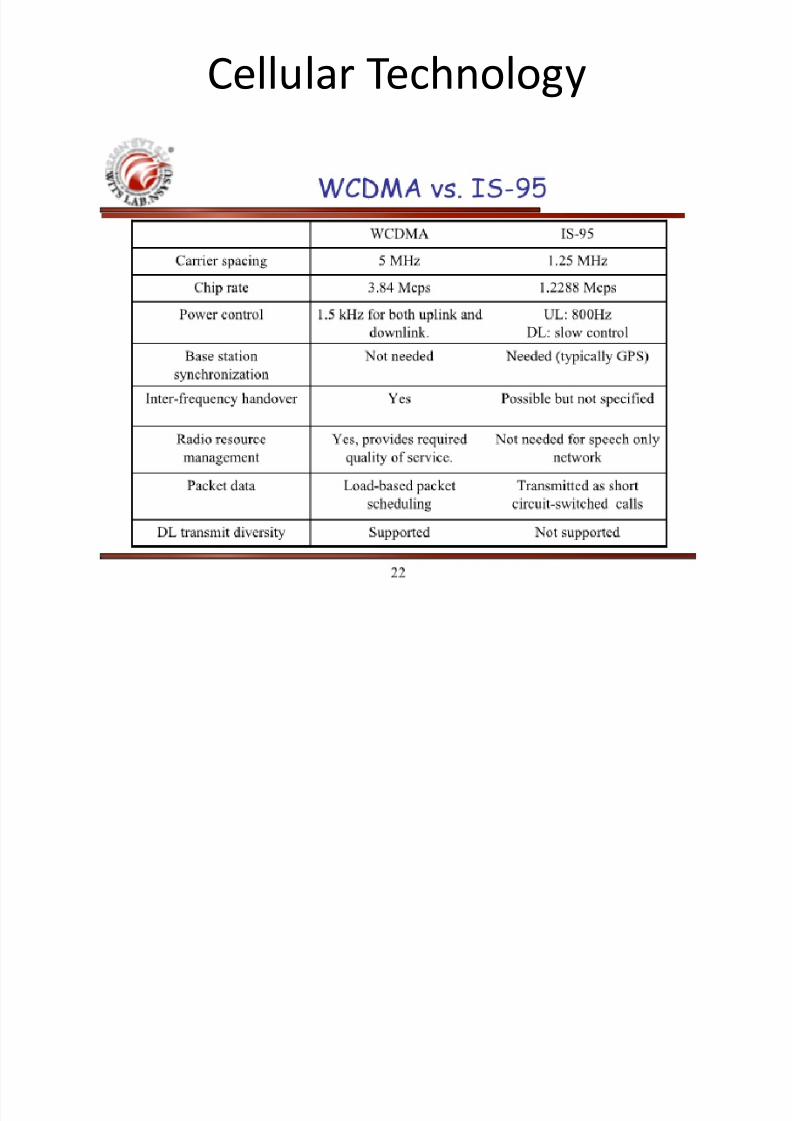
Cellular Technology
7/27/2019 Interference at Cellular Systems Gunawan W 29052013
http://slidepdf.com/reader/full/interference-at-cellular-systems-gunawan-w-29052013 5/48
7/27/2019 Interference at Cellular Systems Gunawan W 29052013
http://slidepdf.com/reader/full/interference-at-cellular-systems-gunawan-w-29052013 6/48
Cellular Technology
7/27/2019 Interference at Cellular Systems Gunawan W 29052013
http://slidepdf.com/reader/full/interference-at-cellular-systems-gunawan-w-29052013 7/48
Cellular Technology

7/27/2019 Interference at Cellular Systems Gunawan W 29052013
http://slidepdf.com/reader/full/interference-at-cellular-systems-gunawan-w-29052013 8/48
Frequency Spectrum

7/27/2019 Interference at Cellular Systems Gunawan W 29052013
http://slidepdf.com/reader/full/interference-at-cellular-systems-gunawan-w-29052013 9/48
Nov-11-2003IEEE 802.20 Contribution # C802.20-03-99
9
ITU-R Reference Documents
[1] Recommendation M.1455: “KEYCHARACTERISTICS FOR THE INTERNATIONAL MOBILETELECOMMUNICATIONS-2000 (IMT-2000) RADIO
INTERFACES”
[2] Recommendation SM.329-7: “SPURIOUS
EMISSIONS”
[3] Recommendation M.1225: “GUIDELINESFOR EVALUATION OF RADIO TRANSMISSIONTECHNOLOGIES FOR IMT-2000”
7/27/2019 Interference at Cellular Systems Gunawan W 29052013
http://slidepdf.com/reader/full/interference-at-cellular-systems-gunawan-w-29052013 10/48
Nov-11-2003IEEE 802.20 Contribution # C802.20-03-99
10
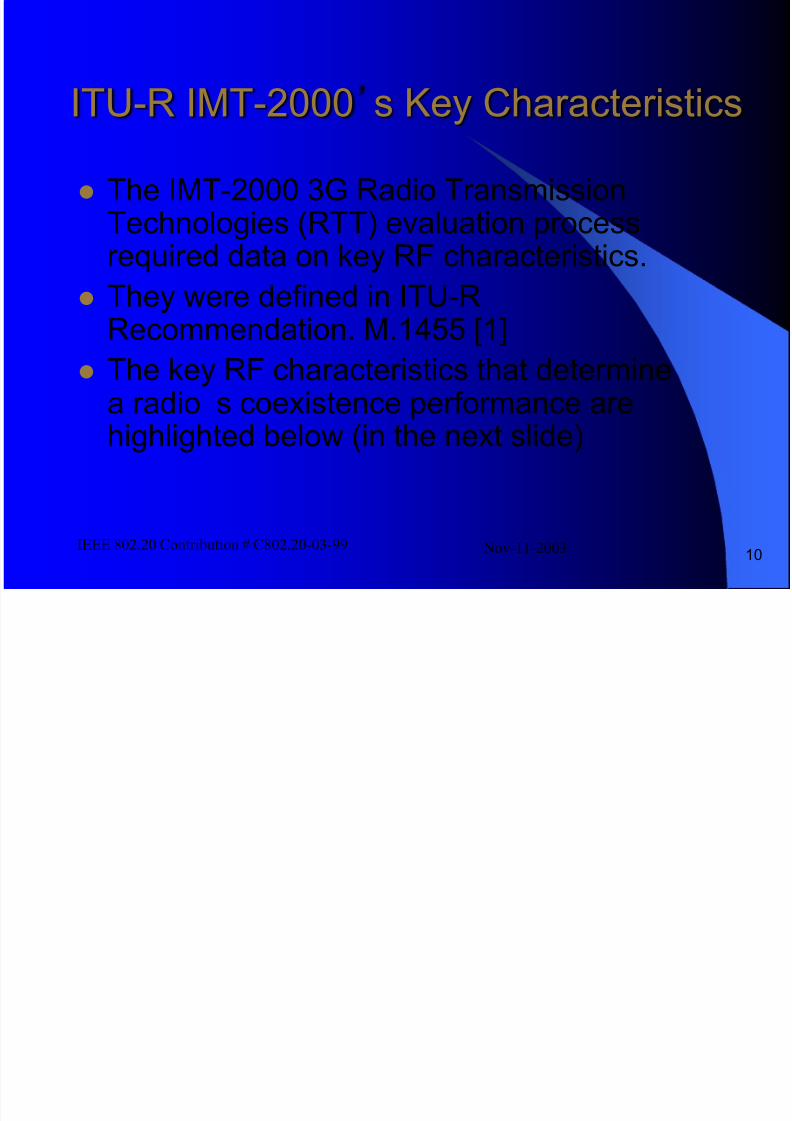
ITU-R IMT-2000’s Key Characteristics
The IMT-2000 3G Radio TransmissionTechnologies (RTT) evaluation processrequired data on key RF characteristics.
They were defined in ITU-RRecommendation. M.1455 [1]
The key RF characteristics that determine
a radio’s coexistence performance arehighlighted below (in the next slide)

7/27/2019 Interference at Cellular Systems Gunawan W 29052013
http://slidepdf.com/reader/full/interference-at-cellular-systems-gunawan-w-29052013 11/48
Nov-11-2003IEEE 802.20 Contribution # C802.20-03-99
11
Coexistence-Affecting Key RF
Performance Characteristics (1/2)
Radio Transmitter:
Transmit power & emission mask ACLR*
Spurious Emissions
Frequency Accuracy & Stability
* ACLR = Adjacent Channel Leakage (power) Ratio

7/27/2019 Interference at Cellular Systems Gunawan W 29052013
http://slidepdf.com/reader/full/interference-at-cellular-systems-gunawan-w-29052013 12/48
Nov-11-2003IEEE 802.20 Contribution # C802.20-03-99
12
Coexistence-Affecting Key RF
Performance Characteristics (2/2)
Radio Receiver:
Sensitivity Intermodulation sensitivity
Blocking
Spurious response
Selectivity

7/27/2019 Interference at Cellular Systems Gunawan W 29052013
http://slidepdf.com/reader/full/interference-at-cellular-systems-gunawan-w-29052013 13/48
Nov-11-2003IEEE 802.20 Contribution # C802.20-03-99
13
Transmitter Characteristics (1/5)
3.3.1 Emission Mask
The maximum transmit power and emission maskshould be stated (for both MS and BS).
If the proposed radio technology supports several power classes, they should be specified as well.
Test results and a statement on the specifiedemission mask(s) are required.

7/27/2019 Interference at Cellular Systems Gunawan W 29052013
http://slidepdf.com/reader/full/interference-at-cellular-systems-gunawan-w-29052013 14/48
Nov-11-2003IEEE 802.20 Contribution # C802.20-03-99
14
Transmitter Characteristics (2/5)
3.3.2 ACLR
ACLR is defined as the attenuation of the transmit
power which is“spilled
”into the adjacent channels(due to filtering imperfections).
It is measured relative to the carrier signal power and expressed as dBc attenuation values.
ACLR is a function of the frequency offset from the
assigned channel frequency.
Test results and a statement on the specified ACLR are required.

7/27/2019 Interference at Cellular Systems Gunawan W 29052013
http://slidepdf.com/reader/full/interference-at-cellular-systems-gunawan-w-29052013 15/48
Nov-11-2003IEEE 802.20 Contribution # C802.20-03-99
15
Transmitter Characteristics (3/5)
3.3.3 Spurious Emissions
ITU-R Recommendation M.329-7 [2] defines
spurious emissions as “Emission on a frequency, or frequencies, which are outside the necessarybandwidth and the level of which may be reducedwithout affecting the corresponding transmission of information.Spurious emissions include harmonic emissions,parasitic emissions, intermodulation products andfrequency conversion products but exclude out-of-band emissions.”

7/27/2019 Interference at Cellular Systems Gunawan W 29052013
http://slidepdf.com/reader/full/interference-at-cellular-systems-gunawan-w-29052013 16/48
Nov-11-2003IEEE 802.20 Contribution # C802.20-03-99
16
Transmitter Characteristics (4/5)
3.3.3 Spurious Emissions (cont’d)
Spurious emissions are generated by non-linear
components in the transmitter in the process of carrier signal generation, mixing, modulation andamplification.
Test results and a statement on the specifiedperformance levels for each type of spuriousemission are required.

7/27/2019 Interference at Cellular Systems Gunawan W 29052013
http://slidepdf.com/reader/full/interference-at-cellular-systems-gunawan-w-29052013 17/48
Nov-11-2003IEEE 802.20 Contribution # C802.20-03-99
17
Transmitter Characteristics (5/5)
3.3.4 Frequency Accuracy and Stability
Frequency accuracy is expressed in PPM (parts per
million) and is a measure of the frequency deviationfrom the assigned carrier frequency.
Frequency stability is a measure of this deviation thatis caused by operational time-varying factors such astemperature, humidity etc.
Test results and a statement on the specifiedfrequency accuracy and stability are required.

7/27/2019 Interference at Cellular Systems Gunawan W 29052013
http://slidepdf.com/reader/full/interference-at-cellular-systems-gunawan-w-29052013 18/48
Nov-11-2003IEEE 802.20 Contribution # C802.20-03-99
18
Receiver Characteristics (1/5)
3.3.5 Receiver Sensitivity
Reference [1] defines receiver sensitivity as the
minimum power, measured at the antenna port, atwhich the frame error rate (FER) or bit error rate(BER) are below a certain specified limit.
Sensitivity is a function of the information bit rate,Eb/No, temperature and the receiver noise-figure(NF).
Test results and a statement on the specifiedreceiver sensitivity levels are required.
7/27/2019 Interference at Cellular Systems Gunawan W 29052013
http://slidepdf.com/reader/full/interference-at-cellular-systems-gunawan-w-29052013 19/48
Nov-11-2003IEEE 802.20 Contribution # C802.20-03-99
19
Receiver Characteristics (2/5)
3.3.6 Intermodulation Sensitivity
Defined as the levels of out-of-band interferingsignals that when mixed in the receiver front-end,produce an in-band third order non-linearity product.
Test results and a statement on the specified
receiver intermodulation sensitivity levels arerequired.

7/27/2019 Interference at Cellular Systems Gunawan W 29052013
http://slidepdf.com/reader/full/interference-at-cellular-systems-gunawan-w-29052013 20/48
Nov-11-2003IEEE 802.20 Contribution # C802.20-03-99
20
Receiver Characteristics (3/5)
3.3.7 Receiver Blocking
Receiver blocking is the effect of a strong out-of-
band signal, present at the input of the receiver, onthe receiver ’s ability to detect an in-band wantedsignal.
The blocking signal reduces the specified receiver sensitivity by a certain number of dB's.
Test results and a statement on the specifiedreceiver blocking performance levels are required.

7/27/2019 Interference at Cellular Systems Gunawan W 29052013
http://slidepdf.com/reader/full/interference-at-cellular-systems-gunawan-w-29052013 21/48
Nov-11-2003IEEE 802.20 Contribution # C802.20-03-99
21
Receiver Characteristics (4/5)
3.3.8 Spurious Response
Spurious response in a receiver occurs when
unwanted signals, having frequencies other than thetuned frequency, produce a receiver output as if theywere wanted signals.
Spurious response is specified in terms of thefrequencies and signal levels that produce suchunwanted receiver output.
Test results and a statement on the specified receiver spurious response performance are required.

7/27/2019 Interference at Cellular Systems Gunawan W 29052013
http://slidepdf.com/reader/full/interference-at-cellular-systems-gunawan-w-29052013 22/48
Nov-11-2003IEEE 802.20 Contribution # C802.20-03-99
22
Receiver Characteristics (5/5)
3.3.9 Selectivity
Receiver selectivity is a measure of the receiver ’s
ability to reject signals from adjacent channels whilereceiving a wanted signal on its tuned frequency.
Selectivity is specified as the ratio (in dB) of theadjacent channel signal level to the assigned channelsignal level in which a reference BER/FER ismaintained.
Test results and a statement on the specified receiver selectivity performance are required.

7/27/2019 Interference at Cellular Systems Gunawan W 29052013
http://slidepdf.com/reader/full/interference-at-cellular-systems-gunawan-w-29052013 23/48
30 Mar. –
1 Apr. 2004 Skopje Measurement of Frequency, Field Strengthand Power Flux Density © ADP
23
Measurement sites
Fixed installations. A suitable site for a fixed installation isone where the fields of the emissions to be recorded will be relatively undisturbed by local structures or terrainfeatures. Fixed sites are primarily used for measurementsat low frequencies (typically less than 30 MHz).
Mobile installations comprise of field strength measuringequipment housed in a monitoring vehicle. Their advantage compared to fixed installations is that they canobserve both the space and time distribution of fieldstrength. This property is particularly useful in the contextof VHF/UHF field-strength measurements, where
measurements need to be taken at variable heights. Nevertheless, due to the propagation characteristics inthese bands, the antenna has to be adjusted to the directionand polarization of the received signal.
7/27/2019 Interference at Cellular Systems Gunawan W 29052013
http://slidepdf.com/reader/full/interference-at-cellular-systems-gunawan-w-29052013 24/48
30 Mar. –
1 Apr. 2004 Skopje Measurement of Frequency, Field Strengthand Power Flux Density © ADP
24
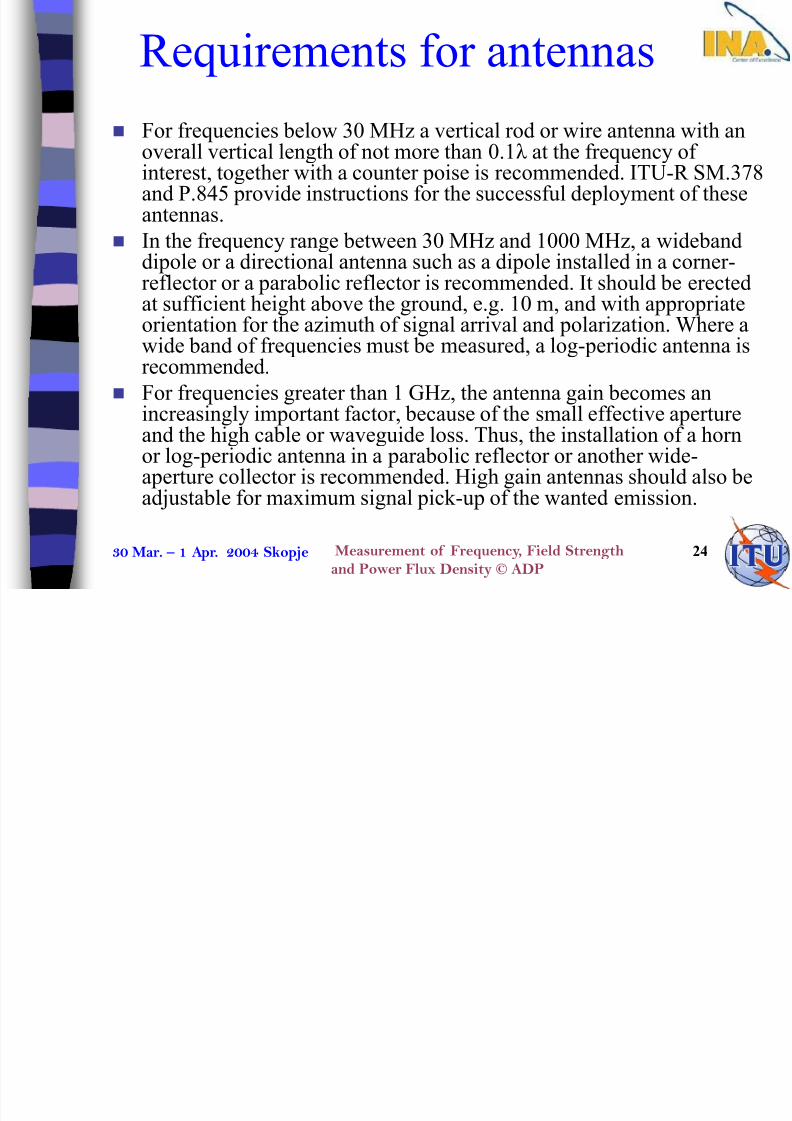
Requirements for antennas
For frequencies below 30 MHz a vertical rod or wire antenna with anoverall vertical length of not more than 0.1λ at the frequency of interest, together with a counter poise is recommended. ITU-R SM.378and P.845 provide instructions for the successful deployment of theseantennas.
In the frequency range between 30 MHz and 1000 MHz, a widebanddipole or a directional antenna such as a dipole installed in a corner-
reflector or a parabolic reflector is recommended. It should be erectedat sufficient height above the ground, e.g. 10 m, and with appropriateorientation for the azimuth of signal arrival and polarization. Where awide band of frequencies must be measured, a log-periodic antenna isrecommended.
For frequencies greater than 1 GHz, the antenna gain becomes an
increasingly important factor, because of the small effective apertureand the high cable or waveguide loss. Thus, the installation of a hornor log-periodic antenna in a parabolic reflector or another wide-aperture collector is recommended. High gain antennas should also beadjustable for maximum signal pick-up of the wanted emission.

7/27/2019 Interference at Cellular Systems Gunawan W 29052013
http://slidepdf.com/reader/full/interference-at-cellular-systems-gunawan-w-29052013 25/48
30 Mar. –
1 Apr. 2004 Skopje Measurement of Frequency, Field Strengthand Power Flux Density © ADP 25
Measurements along a route
Influenced by the local receiving conditions, the true values of the fieldstrength can significantly differ from the predicted ones. It is thereforenecessary they are verified by measurements in order to determine theradio coverage of a large area.
All measurements must be recorded along with their geographical co-ordinate data for locating the points of measurements and for mappingthe results that were gathered on the most accessible roads of the area
in question. Digital network systems (such as GSM, DCS1800, UMTS, or DAB)
are sensitive to the effects of reflected reception. In this case, besidesmeasuring the signal level, the reception quality measurement, made
by the measurement of the bit-error ratio (BER) or channel impulseresponse (CIR) measurement, is also necessary to evaluate the system
performance. Using special monitoring equipment which automaticallygenerates calls, these measurements can be made on operational digitalnetworks without any adverse effect.
7/27/2019 Interference at Cellular Systems Gunawan W 29052013
http://slidepdf.com/reader/full/interference-at-cellular-systems-gunawan-w-29052013 26/48
30 Mar. –
1 Apr. 2004 Skopje Measurement of Frequency, Field Strengthand Power Flux Density © ADP26
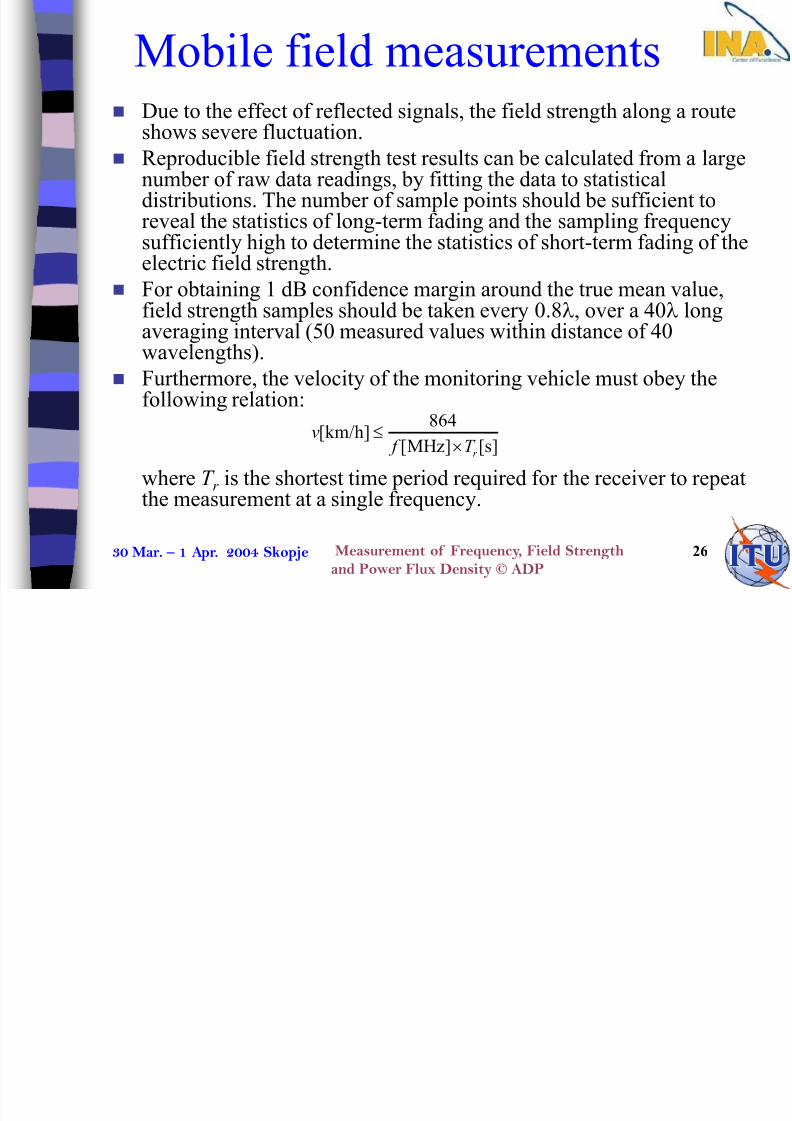
Mobile field measurements Due to the effect of reflected signals, the field strength along a route
shows severe fluctuation. Reproducible field strength test results can be calculated from a large
number of raw data readings, by fitting the data to statisticaldistributions. The number of sample points should be sufficient toreveal the statistics of long-term fading and the sampling frequencysufficiently high to determine the statistics of short-term fading of theelectric field strength.
For obtaining 1 dB confidence margin around the true mean value,field strength samples should be taken every 0.8, over a 40 longaveraging interval (50 measured values within distance of 40wavelengths).
Furthermore, the velocity of the monitoring vehicle must obey thefollowing relation:
where T r is the shortest time period required for the receiver to repeat
the measurement at a single frequency.
864[km/h][MHz] [s]r
v f T
7/27/2019 Interference at Cellular Systems Gunawan W 29052013
http://slidepdf.com/reader/full/interference-at-cellular-systems-gunawan-w-29052013 27/48
30 Mar. –
1 Apr. 2004 Skopje Measurement of Frequency, Field Strengthand Power Flux Density © ADP27
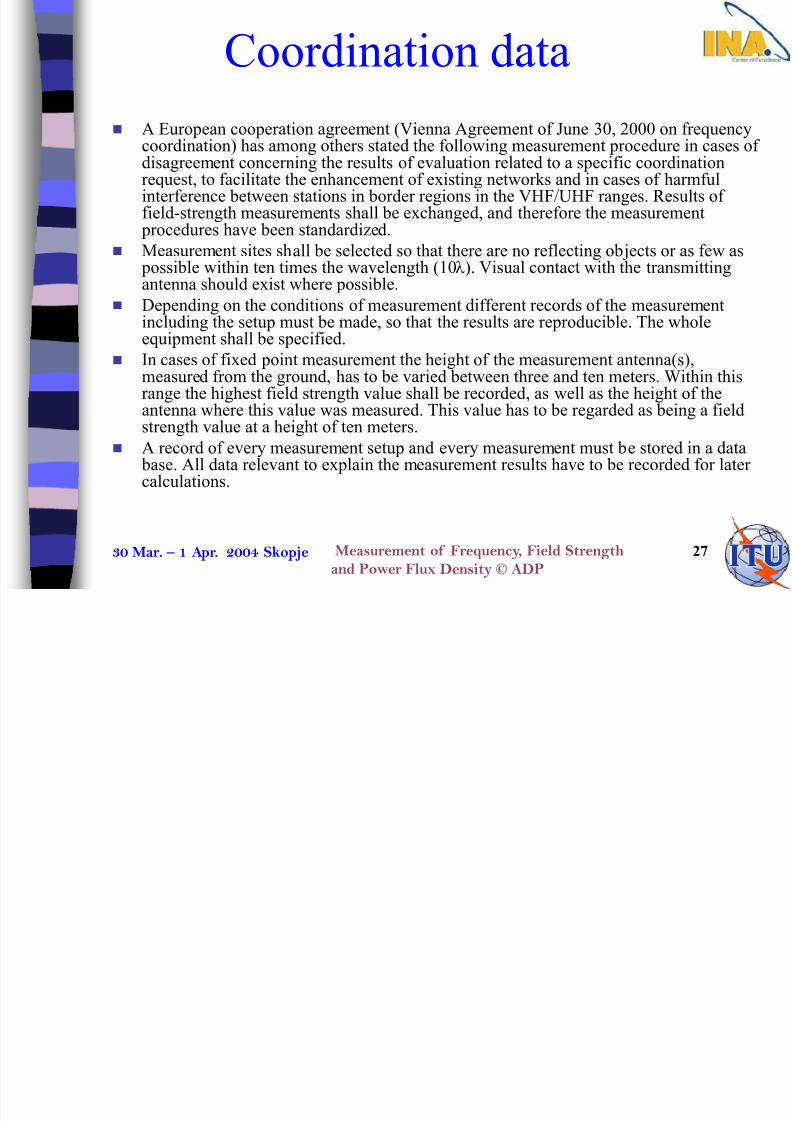
Coordination data
A European cooperation agreement (Vienna Agreement of June 30, 2000 on frequencycoordination) has among others stated the following measurement procedure in cases of disagreement concerning the results of evaluation related to a specific coordinationrequest, to facilitate the enhancement of existing networks and in cases of harmfulinterference between stations in border regions in the VHF/UHF ranges. Results of field-strength measurements shall be exchanged, and therefore the measurement procedures have been standardized.
Measurement sites shall be selected so that there are no reflecting objects or as few as possible within ten times the wavelength (10). Visual contact with the transmittingantenna should exist where possible.
Depending on the conditions of measurement different records of the measurementincluding the setup must be made, so that the results are reproducible. The wholeequipment shall be specified.
In cases of fixed point measurement the height of the measurement antenna(s),measured from the ground, has to be varied between three and ten meters. Within thisrange the highest field strength value shall be recorded, as well as the height of the
antenna where this value was measured. This value has to be regarded as being a fieldstrength value at a height of ten meters.
A record of every measurement setup and every measurement must be stored in a data base. All data relevant to explain the measurement results have to be recorded for later calculations.

7/27/2019 Interference at Cellular Systems Gunawan W 29052013
http://slidepdf.com/reader/full/interference-at-cellular-systems-gunawan-w-29052013 28/48
Departemen Komunikasi dan Informatika
MOBILE OPERATORS IN INDONESIA(FDD / Paired Band)
21/10/2013 DG POSTEL
Notes:
Reference: Number of subscribers: Annual report of operators year 2008, Ditjen
Postel.28
Telkomsel Indosat XL Axiata Hutch CPT Axis
Starting of operation
1995 1994 1996 2004 2004
Number of subs (end of
2008)
65,300,000 36,500,000 26,000,000 4,501,000 3,000,000
Standard GSM/UMTS /HSPA
GSM/UMTS /HSPA
GSM/UMTS /HSPA
GSM/UMTS /HSPA
GSM/UMTS /HSPA
Frequency
Band (MHz)
900/1800/
2100
900/1800/
2100
900/1800/
2100
900/1800/
2100
900/1800/
2100Bandwidth 40 MHz FDD 40 MHz FDD 20 MHz FDD 15 MHz FDD 20 MHz FDD
7/27/2019 Interference at Cellular Systems Gunawan W 29052013
http://slidepdf.com/reader/full/interference-at-cellular-systems-gunawan-w-29052013 29/48
Departemen Komunikasi dan Informatika
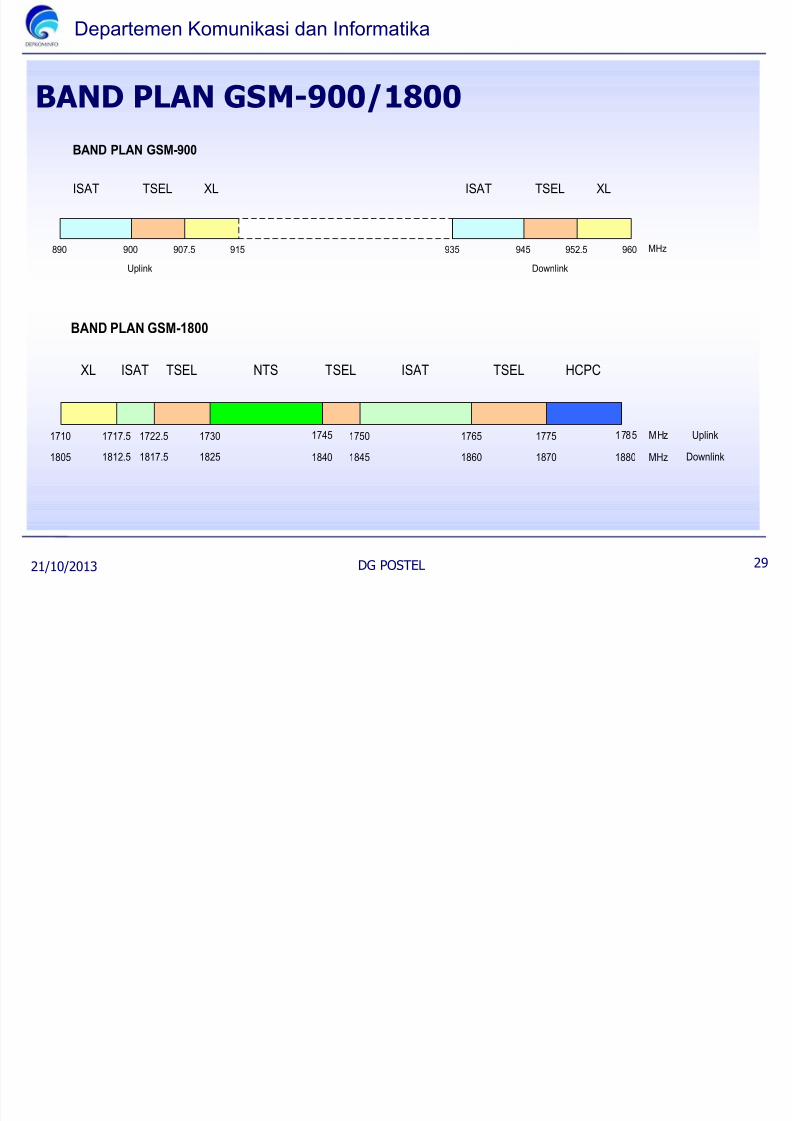
BAND PLAN GSM-900/1800
21/10/2013 DG POSTEL
BAND PLAN GSM-900
ISAT TSEL
890 900 MHz
Uplink Downlink
907.5 915
XL ISAT TSEL XL
935 945 952.5 960
BAND PLAN GSM-1800
1745
XL ISAT TSEL NTS TSEL ISAT HCPCTSEL
1710 1717.5 1722.5 1730 1750 1765 1775 1785 MHz
1805 1812.5 1817.5 1825 1845 1860 1870 18801840 MHz
Uplink
Downlink
29
7/27/2019 Interference at Cellular Systems Gunawan W 29052013
http://slidepdf.com/reader/full/interference-at-cellular-systems-gunawan-w-29052013 30/48
Departemen Komunikasi dan Informatika
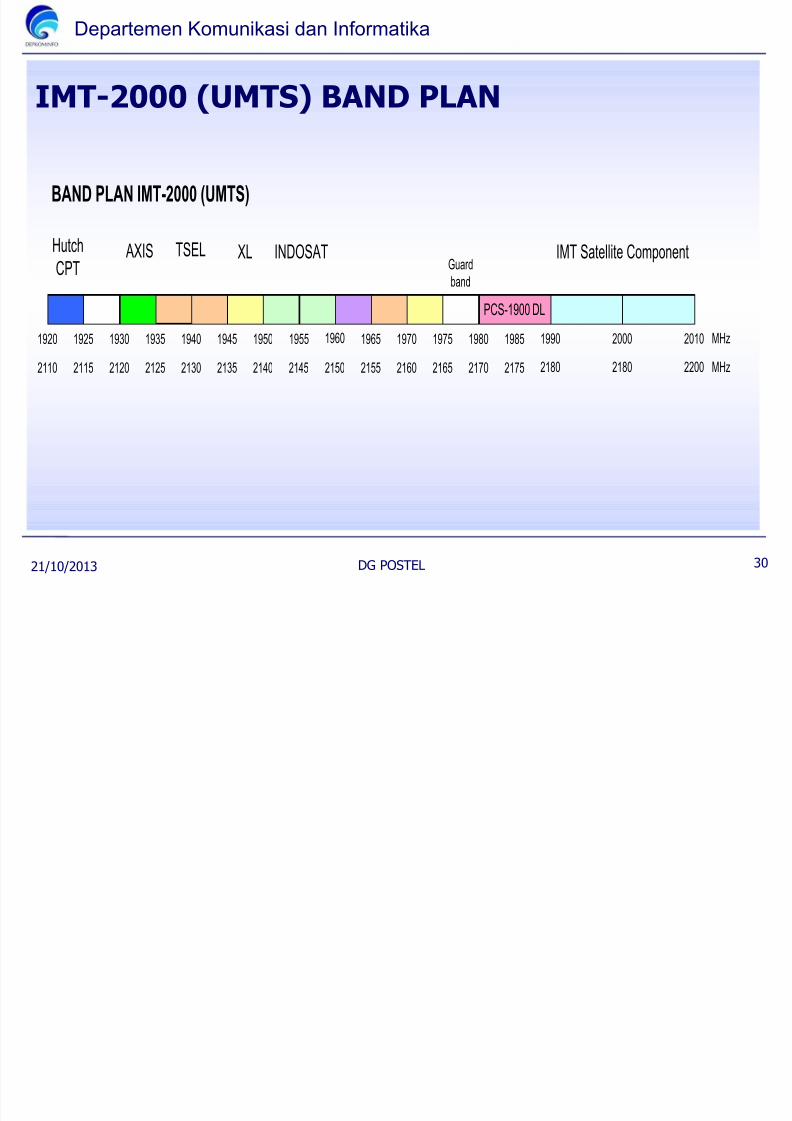
IMT-2000 (UMTS) BAND PLAN
21/10/2013 DG POSTEL
BAND PLAN IMT-2000 (UMTS)
1955
Hutch
CPT AXIS TSEL INDOSAT
1920 MHz
2110 2145 MHz
1925
2115
1930
2120
1935
2125
1940
2130
XL
1945
2135
1950
2140
1965
2155
1960
2150
1975
2165
1970
2160
1985
2175
1980
2170
PCS-1900 DL
1990
2180
2000
2180
2010
2200
IMT Satellite ComponentGuard
band
30

7/27/2019 Interference at Cellular Systems Gunawan W 29052013
http://slidepdf.com/reader/full/interference-at-cellular-systems-gunawan-w-29052013 31/48
Departemen Komunikasi dan Informatika
MOBILE AND FWA OPERATORS ININDONESIA
(FDD / Paired Band)
21/10/2013 DG POSTEL
Notes:• Bakrie Esia: 4 carrier 1.23 MHz di West Java, DKI, Banten,
• Telkom: 4 carrier 1.23 MHz exclude West Java, DKI, Banten
• Reference: Number of subscribers: Annual report of operators year 2008, Ditjen Postel.
31
SAMPOERNA TI
MOBILE-8
BAKRIETELECOM
TELKOMFLEXI
INDOSATSTARONE
SMART
Starting of operation
1985 1990s 1990s 2002 2002 2004
Number of subs(Y:2008)
N/A 3,004,400 7,300,000 12,725,000 761,589 N/A
Standard CDMA CDMA CDMA CDMA CDMA CDMA
FrequencyBand (MHz)
450 850 850 850 850 1900
Bandwidth 3.69 MHzFDD
4.92 MHzFDD
4.92 MHzFDD
4.96 MHzFDD
2.26 MHzFDD
6.15 MHzFDD
D K ik i d I f ik

7/27/2019 Interference at Cellular Systems Gunawan W 29052013
http://slidepdf.com/reader/full/interference-at-cellular-systems-gunawan-w-29052013 32/48
Departemen Komunikasi dan Informatika
BAND PLAN CDMA-850
21/10/2013 DG POSTEL
BAND PLAN CDMA-850
37 78 119
835
Sub Band ex AMPS-A
160 201 242 283 384 425 466
880
507 548 589 630
Sub Band ex AMPS-B
835
890
BAKRIE TELKOMRsv MOBILE-8 Rsv ISAT
Wilayah Layanan: Jakarta, Banten dan Jawa Barat
TELKOM BAKRIERsv MOBILE-8 Rsv ISAT
Wilayah Layanan: Nasional, selain Jakarta, Banten dan Jawa Barat
Uplink Downlink
Tiap raster channel AMPS 30 kHz, 1 kanal CDMA = 41 kanal AMPS = 1.23 MHz
MHz
MHz
1019
32
7/27/2019 Interference at Cellular Systems Gunawan W 29052013
http://slidepdf.com/reader/full/interference-at-cellular-systems-gunawan-w-29052013 33/48
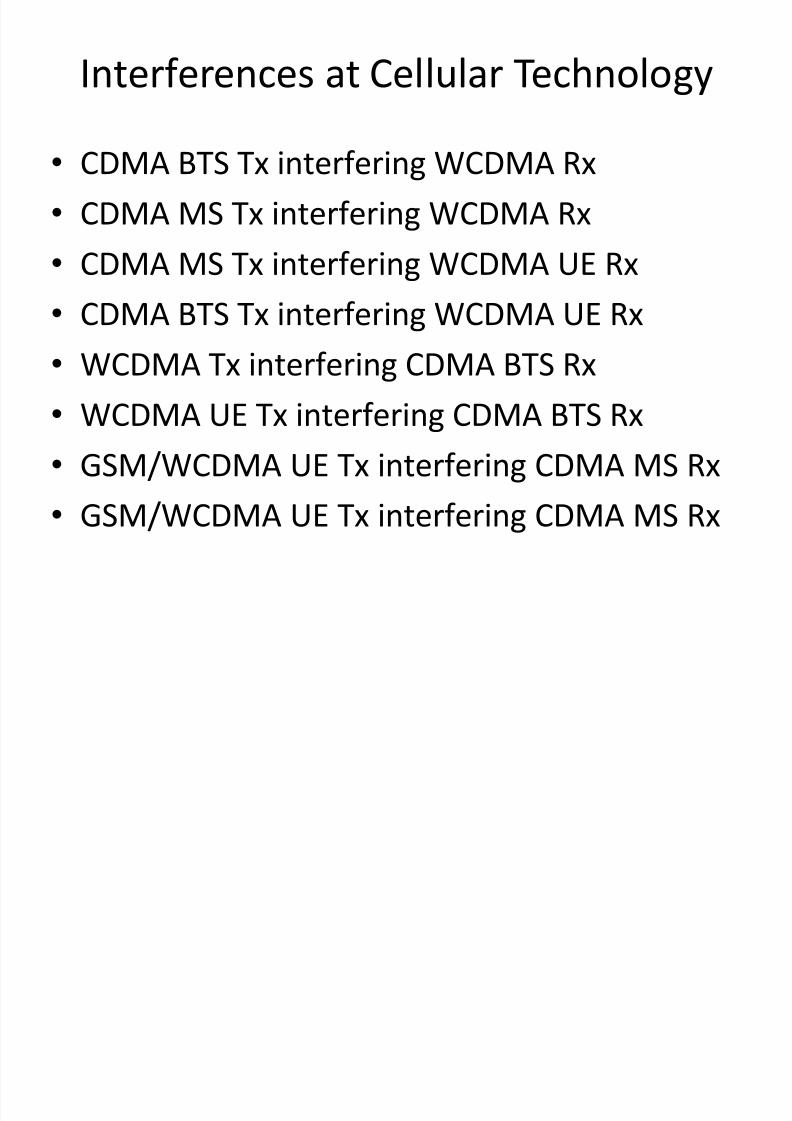
Interferences at Cellular Technology
• CDMA BTS Tx interfering WCDMA Rx
• CDMA MS Tx interfering WCDMA Rx
• CDMA MS Tx interfering WCDMA UE Rx
• CDMA BTS Tx interfering WCDMA UE Rx
• WCDMA Tx interfering CDMA BTS Rx
•WCDMA UE Tx interfering CDMA BTS Rx
• GSM/WCDMA UE Tx interfering CDMA MS Rx
• GSM/WCDMA UE Tx interfering CDMA MS Rx
7/27/2019 Interference at Cellular Systems Gunawan W 29052013
http://slidepdf.com/reader/full/interference-at-cellular-systems-gunawan-w-29052013 34/48
Interference
• To evaluate interference implications
– Qualitative method
direct implication into devices
– Quantitative method
• Simulation (many application tool can be used)
• Monitoring/Drive test
7/27/2019 Interference at Cellular Systems Gunawan W 29052013
http://slidepdf.com/reader/full/interference-at-cellular-systems-gunawan-w-29052013 35/48
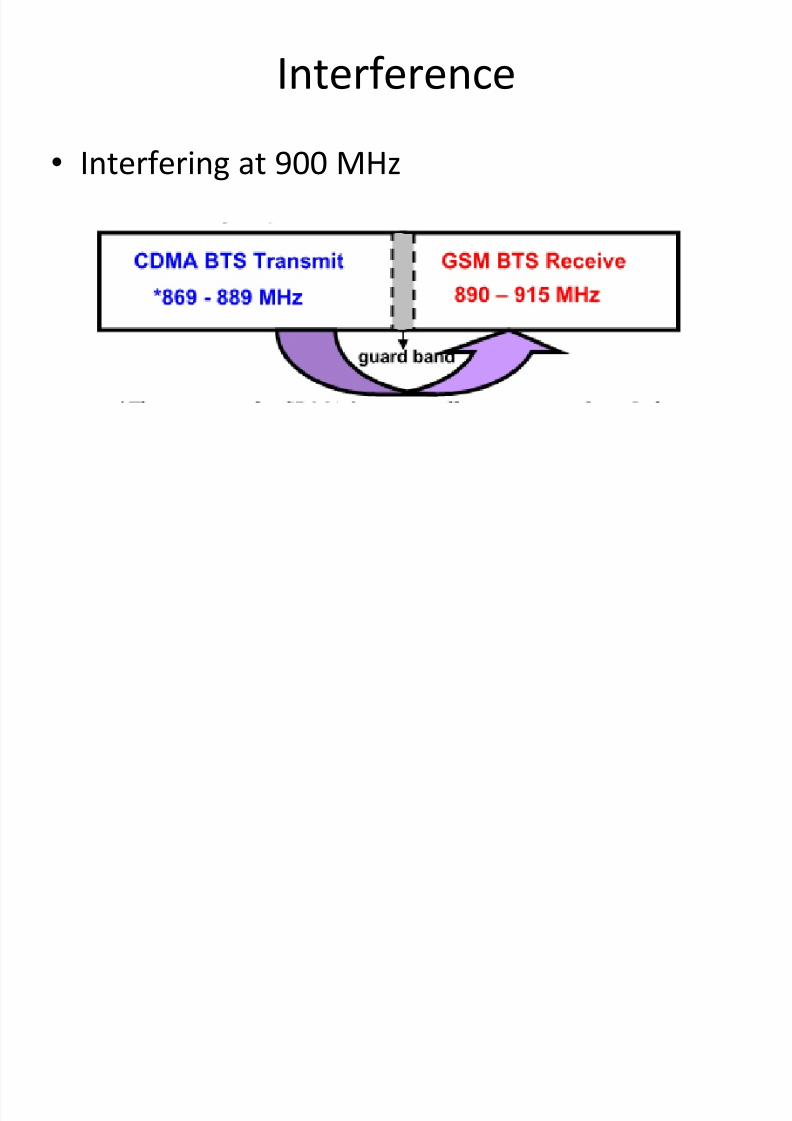
Interference
• Interfering at 900 MHz
7/27/2019 Interference at Cellular Systems Gunawan W 29052013
http://slidepdf.com/reader/full/interference-at-cellular-systems-gunawan-w-29052013 36/48
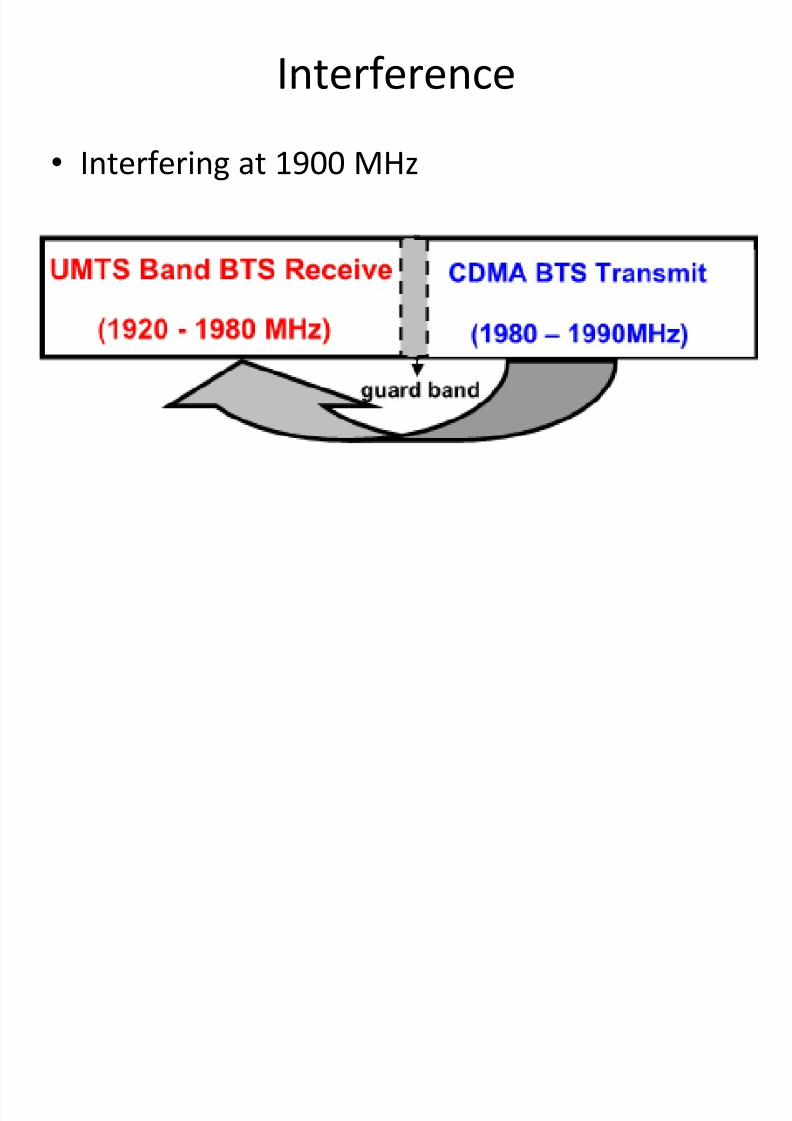
Interference
• Interfering at 1900 MHz
7/27/2019 Interference at Cellular Systems Gunawan W 29052013
http://slidepdf.com/reader/full/interference-at-cellular-systems-gunawan-w-29052013 37/48
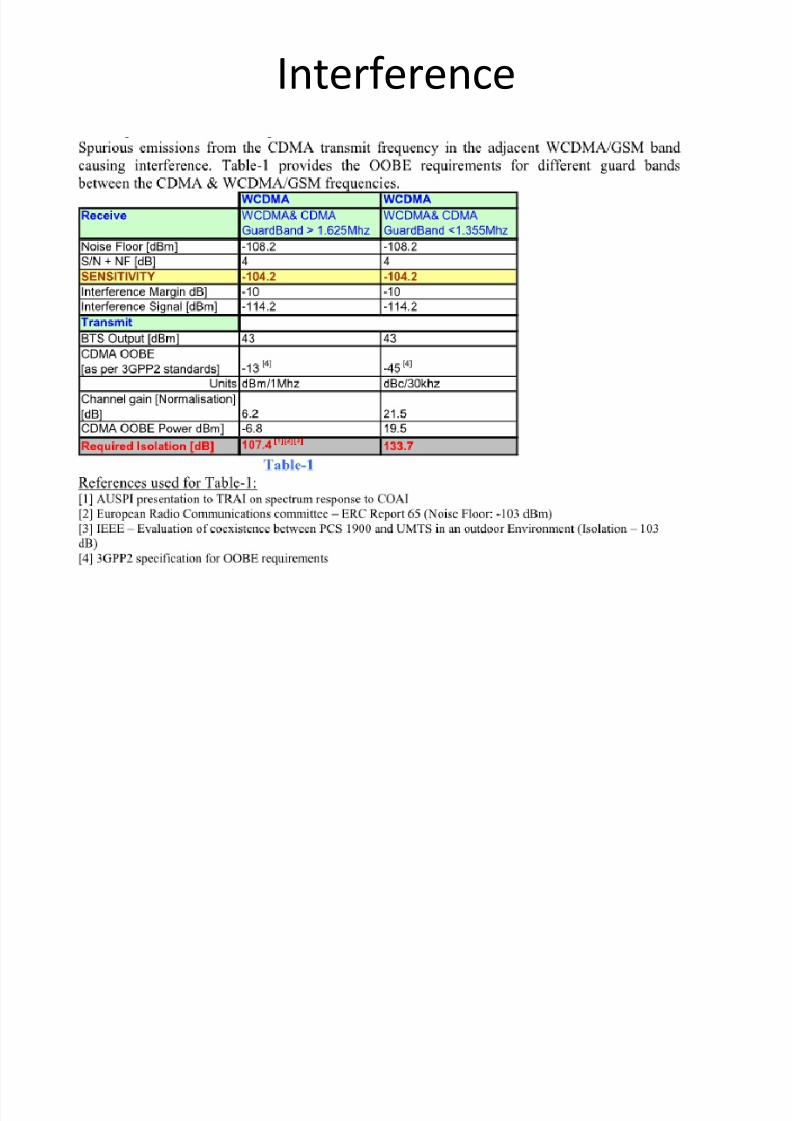
Interference
• Interference from adjacent channel are
– Out of band emission (OOBE)
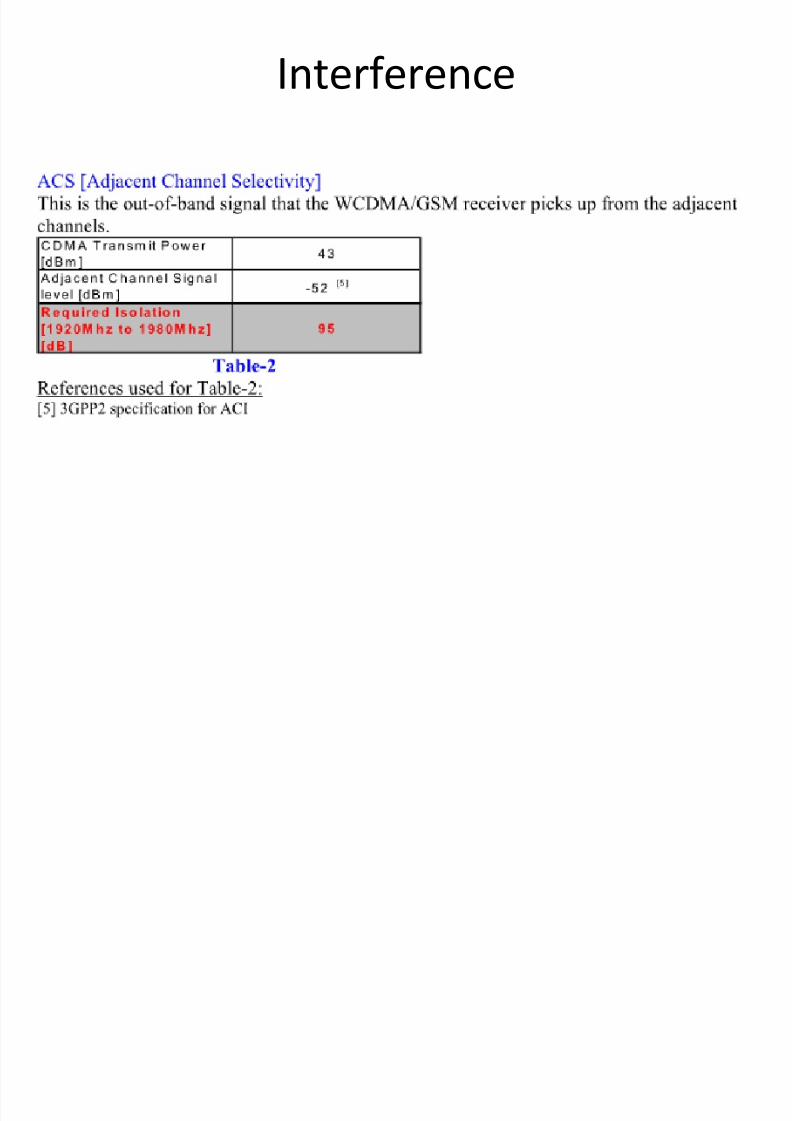
– Adjacent channel selectivity (ACS)
7/27/2019 Interference at Cellular Systems Gunawan W 29052013
http://slidepdf.com/reader/full/interference-at-cellular-systems-gunawan-w-29052013 38/48
Interference
7/27/2019 Interference at Cellular Systems Gunawan W 29052013
http://slidepdf.com/reader/full/interference-at-cellular-systems-gunawan-w-29052013 39/48
Interference

7/27/2019 Interference at Cellular Systems Gunawan W 29052013
http://slidepdf.com/reader/full/interference-at-cellular-systems-gunawan-w-29052013 40/48
7/27/2019 Interference at Cellular Systems Gunawan W 29052013
http://slidepdf.com/reader/full/interference-at-cellular-systems-gunawan-w-29052013 41/48
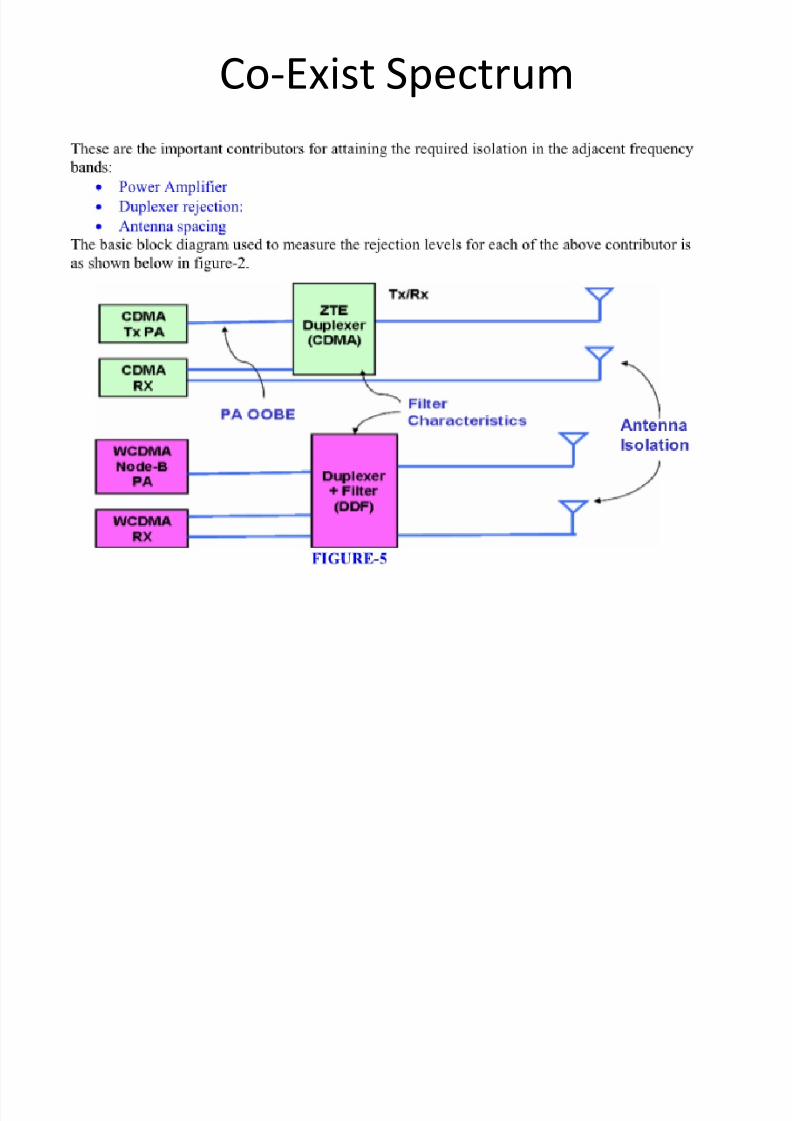
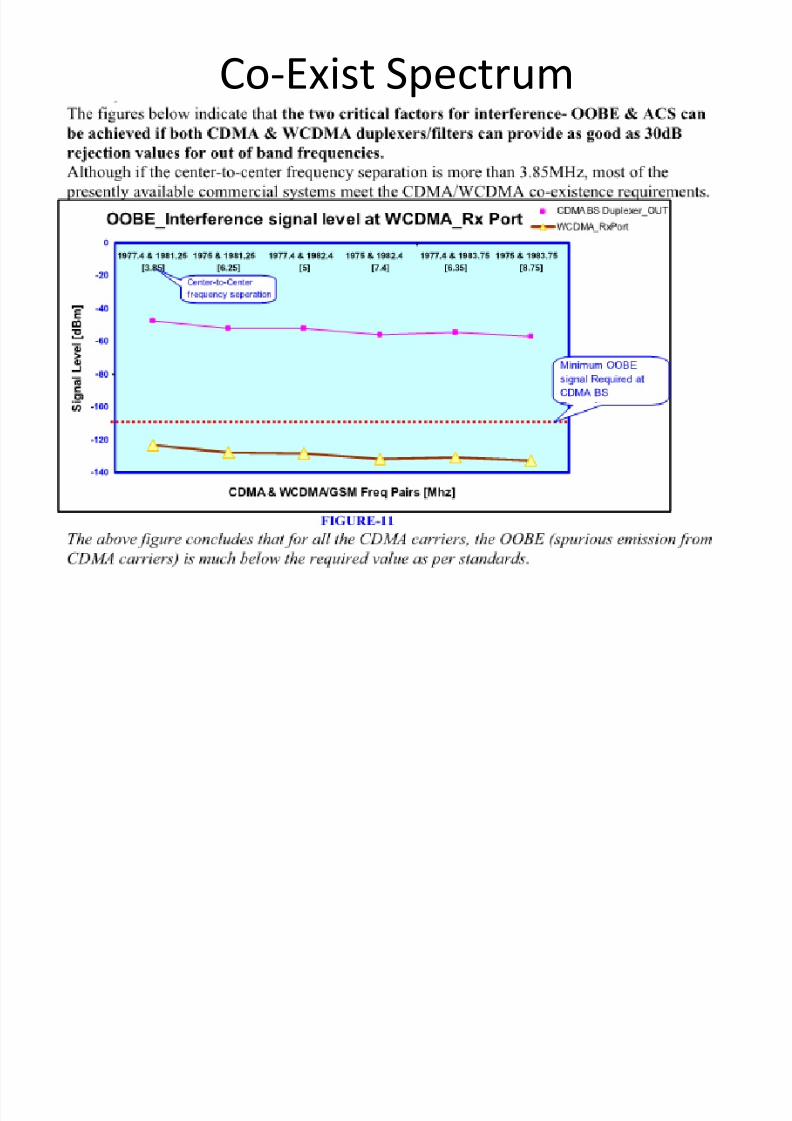
Co-Exist Spectrum
7/27/2019 Interference at Cellular Systems Gunawan W 29052013
http://slidepdf.com/reader/full/interference-at-cellular-systems-gunawan-w-29052013 42/48
Co-Exist Spectrum
7/27/2019 Interference at Cellular Systems Gunawan W 29052013
http://slidepdf.com/reader/full/interference-at-cellular-systems-gunawan-w-29052013 43/48
7/27/2019 Interference at Cellular Systems Gunawan W 29052013
http://slidepdf.com/reader/full/interference-at-cellular-systems-gunawan-w-29052013 44/48
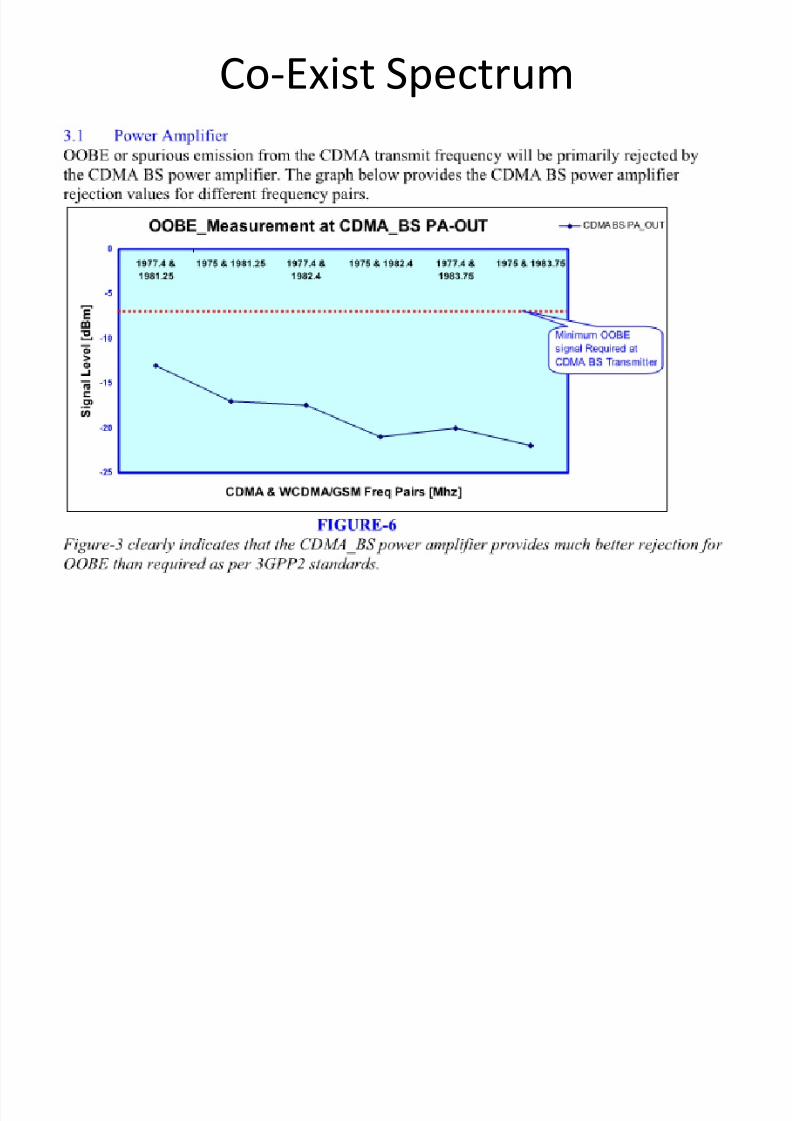
Co-Exist Spectrum
7/27/2019 Interference at Cellular Systems Gunawan W 29052013
http://slidepdf.com/reader/full/interference-at-cellular-systems-gunawan-w-29052013 45/48
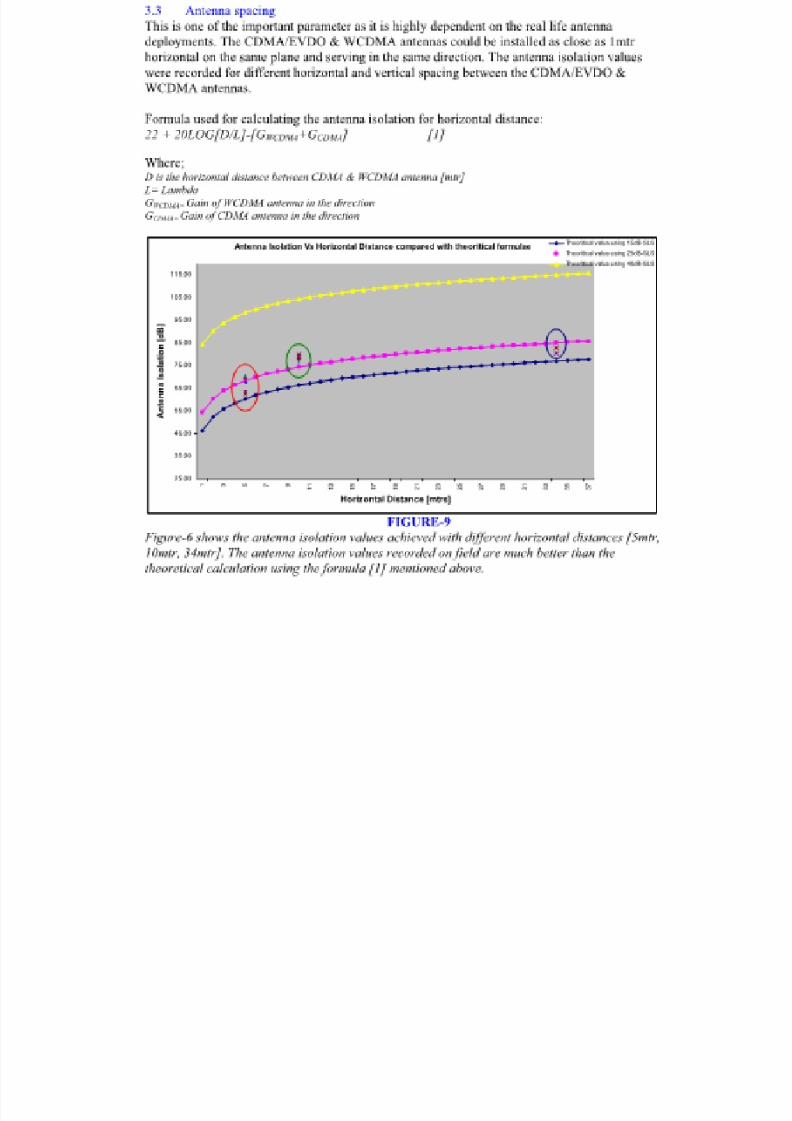
Co-Exist Spectrum

7/27/2019 Interference at Cellular Systems Gunawan W 29052013
http://slidepdf.com/reader/full/interference-at-cellular-systems-gunawan-w-29052013 46/48
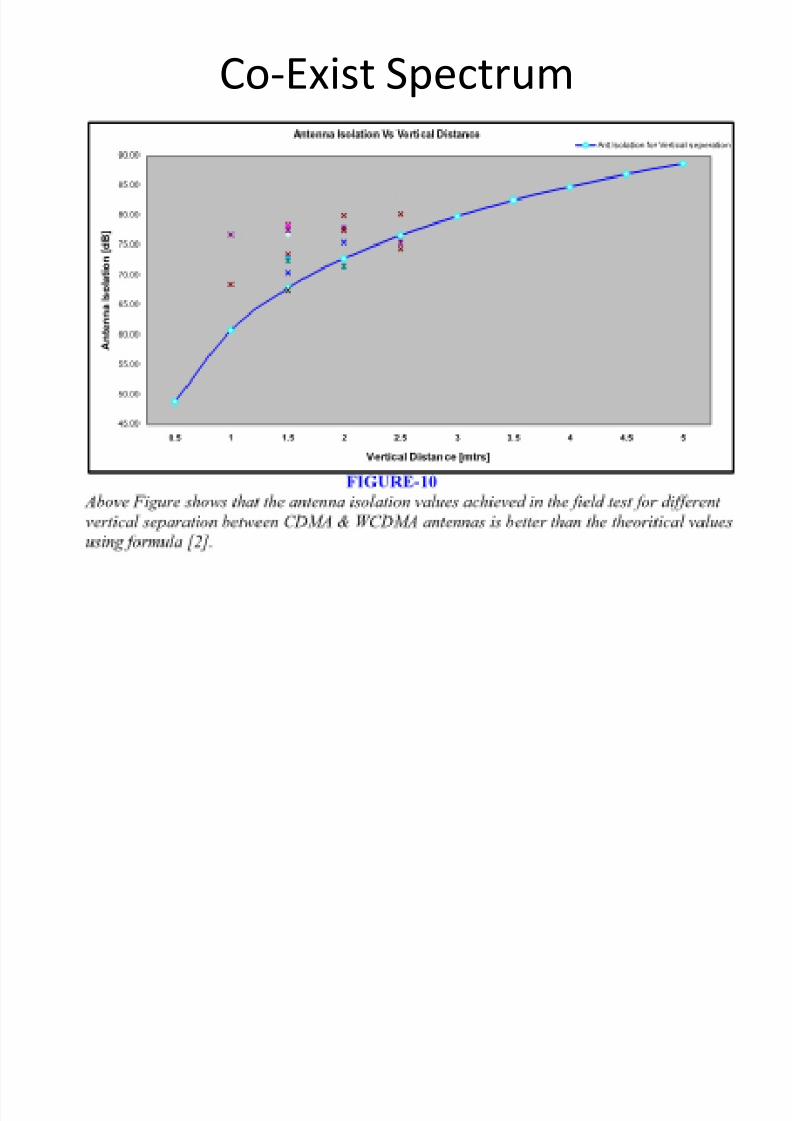
Co-Exist Spectrum

7/27/2019 Interference at Cellular Systems Gunawan W 29052013
http://slidepdf.com/reader/full/interference-at-cellular-systems-gunawan-w-29052013 47/48
7/27/2019 Interference at Cellular Systems Gunawan W 29052013
http://slidepdf.com/reader/full/interference-at-cellular-systems-gunawan-w-29052013 48/48
Closing
• Co-exist spectrum for two systems is allowed,
if the rejection spectrum is satisfied the
minimum requirement
• Some methods to get the minimum rejection
requirement are power amplifier, filter, and
antenna isolation


