25
INTERIM REPORT ON THE FIRST QUARTER OF 2008 Group

INTERIM REPORT ON THE FIRST QUARTER OF 2008
Group

T O D ’ S G r o u p - 2 0 0 8 Q u a r t e r l y R e p o r t
M a r c h 3 1 s t , 2 0 0 8
Table of contents
TABLE OF CONTENTS
Company’s data . . . . . . . . . . . . . . . . . . . . . . . . . . . . . . . . . . . . . . . . . . . . . . . . . . . . . . . . . . . . . . . . . . . . . . . . . . . . . . . . . . . . . . . . . . . . . . . . . . . . . . . . . . . . . . . 1
Corporate governance bodies . . . . . . . . . . . . . . . . . . . . . . . . . . . . . . . . . . . . . . . . . . . . . . . . . . . . . . . . . . . . . . . . . . . . . . . . . . . . . . . . . . . . . . . . . . . . 2
TOD’S Group . . . . . . . . . . . . . . . . . . . . . . . . . . . . . . . . . . . . . . . . . . . . . . . . . . . . . . . . . . . . . . . . . . . . . . . . . . . . . . . . . . . . . . . . . . . . . . . . . . . . . . . . . . . . . . . . . . 3
Group’s organizational chart . . . . . . . . . . . . . . . . . . . . . . . . . . . . . . . . . . . . . . . . . . . . . . . . . . . . . . . . . . . . . . . . . . . . . . . . . . . . . . . . . . . . . . . . . . . . . . 4
Distribution network as of March 31st , 2008 . . . . . . . . . . . . . . . . . . . . . . . . . . . . . . . . . . . . . . . . . . . . . . . . . . . . . . . . . . . . . . . . . . . . . . . . 5
Key consolidated financial f igures . . . . . . . . . . . . . . . . . . . . . . . . . . . . . . . . . . . . . . . . . . . . . . . . . . . . . . . . . . . . . . . . . . . . . . . . . . . . . . . . . . . . . . . 6
Information on operating performance
Group’s activity ................................................................................................................................................. 9
Group’s brands .................................................................................................................................................. 9
Foreign currency markets .............................................................................................................................. 10
Principal events and transactions during the period ................................................................................ 10
Group’s results in Q1 2008 ........................................................................................................................... 11
Signif icant events occurring after the end of the period ......................................................................... 18
Business outlook .............................................................................................................................................. 18
Guidelines for preparation of the Quarterly Report ............................................................................... 18
Accounting policies ......................................................................................................................................... 19
Alternative indicators of performances ...................................................................................................... 20
Scope of consolidation ................................................................................................................................... 21
Transactions with related parties ................................................................................................................ 21
Declaration pursuant to Article 154bis(2) of the Consol idated Law on Financial Intermediation . 23

T O D ’ S G r o u p - 2 0 0 8 Q u a r t e r l y R e p o r t
M a r c h 3 1 s t , 2 0 0 8
1 Company’s data
Company’s data
Registered off ice
TOD’S S.p.a.
Via Fil ippo Della Valle, 1
63019 Sant'Elpidio a Mare (Ascoli Piceno) - Italy
Tel. +39 0734 8661
Legal data Parent company
Share capital resolved Euro 64,000,000
Sahare capital subscribed and paid euro 60,961,840
Fiscal Code and registration number on Company Register of Court of Ascoli Piceno: 01113570442
Registered with the Chamber of Commerce of Ascoli Piceno under n. 114030 R.E.A.
Off ices e Show rooms Dusseldorf – Kaistrasse, 2
Hong Kong – Three Pacif ic Place, 1 Queen’s Road East
London – Old Bond Street, 16
Milano - Corso Venezia, 30
Milano - Via Savona, 56
Milano - Via Serbelloni 1-4
Milano - Via della Spiga, 22
Milano - Viale Montenero 63
New York - 450, West 15th Street
Paris – Rue Royale, 20
Tokyo – Omotesando Building, 5-1-5 Jingumae
Seoul – 89-10, Cheongdam-dong, Kangnam-ku
Shanghai - 1366 Nanjing West Road, Plaza 66 Tower 2
Production facil it ies Comunanza (AP) - Via Merloni, 7
Comunanza (AP) - Via S.Maria, 2-4-6
Sant'Elpidio a Mare (AP) - Via Fil ippo Della Valle, 1
Bagno a Ripoli, Loc. Vall ina (FI) - Via del Roseto, 60
Bagno a Ripoli, Loc. Vall ina (FI) - Via del Roseto, 50
Tolentino (MC) - Via Sacharov 41/43

T O D ’ S G r o u p - 2 0 0 8 Q u a r t e r l y R e p o r t
M a r c h 3 1 s t , 2 0 0 8
2 Corporate governance bodies
Corporate governance bodies
Board of directors (1) Diego Della Valle ChairmanAndrea Della Valle Vice- ChairmanLuigi AbeteMaurizio BoscaratoLuigi CambriLuca Cordero di MontezemoloEmanuele Della ValleFabrizio Della ValleEmilio MacellariPierfrancesco SaviottiStefano SinciniVito Varvaro (4)
Executive Committee Diego Della Valle ChairmanAndrea Della ValleFabrizio Della ValleEmilio MacellariStefano SinciniVito Varvaro (5)
Compensation Luigi Abete ChairmanCommittee Luigi Cambri
Pierfrancesco Saviotti
Internal Control and Maurizio Boscarato ChairmanCorporate Governance Luigi CambriCommittee Pierfrancesco Saviotti
Board of statutory (2) Enrico Colombo ChairmanAuditors Gian Mario Perugini Acting stat. auditor
Fabrizio Redaelli Acting stat. auditorMassimo Foschi Substitute auditorGilfredo Gaetani Substitute auditor
Indipendent Auditors (3) Deloitte & Touche S.p.a.
Manager charged with preparing Rodolfo Ubaldithe company’s f inancial report
( 1 ) Term of the of f ice: 2006-2008 (resolut ion of the Shareholders’ meet ing as of Apri l 28 th , 2006)( 2 ) Term of the of f ice: 2007-2009 (resolut ion of the Shareholders’ meet ing as of Apri l 27 th , 2007)( 3 ) Term of the of f ice: 2006-2011 (resolut ion of the Shareholders’ meet ing as of Apri l 28 th , 2006)( 4 ) Appointed by the Shareholders’ meet ing on Apri l 22 nd , 2008( 5 ) Appointed by the Board of Directors on April 22 nd , 2008

T O D ’ S G r o u p - 2 0 0 8 Q u a r t e r l y R e p o r t
M a r c h 3 1 s t , 2 0 0 8
3 Composition of the Group
TOD’S Group
TOD’S S.p.a.Parent Company, owner ofthe Tod’s, Hogan and Faybrands and l icensee of theRoger Viv ier and Derek Lambrands ( * ) .
( * ) Shoes, leather goods, andaccessory l ine
Del.Com. S.r. l .Subholding for operat ion of nationalsubsidiaries .
TOD’S International B.V.Subholding for operation ofinternational subsidiaries and DOS inThe Netherlands.
An.Del. Usa Inc.Subholding for operat ion ofsubsidiaries in the United States.
Del.Pav S.r.l .Company that operates DOS in Ita ly.Deva Mode S.r.l .Company that operates DOS in Ita ly.
Fi langieri 29 S.r.l .Company that operates DOS in Ita ly.
Re.Se.Del. S.r.l .Company for services.
Spiga 22 S.r.l .Company that operates DOS in Ita ly.
Via Roma 40 S.r. l .Company that operates DOS in Ita ly.
Gen.del . SACompany that operates DOS inSwitzerland.TOD’S Belgique S.p.r.l .Company that operates DOS inBelgium.
TOD’S Deutschland GmbhCompany that di str ibutes andpromotes products in Germany andmanages DOS in Germany.
TOD’S Espana SLCompany that operates DOS inSpain.
TOD’S France SasCompany that distr ibutes andpromotes products in France andmanages DOS in France.
TOD’S Hong Kong LtdCompany that distributes andpromotes products in Far East andSouth Pacific and manages DOS inHong Kong.
TOD’S Retail India Private LtdCompany that operates DOS inIndia .
TOD’S Japan KKCompany that operates DOS inJapan.
TOD’S Korea Inc.Company that promotes products inKorea
TOD’S Luxembourg S.A.Company that operates DOS inLuxembourg.
TOD’S Macao LtdCompany that operates DOS in Macao.
TOD’S Saint Barth SasCompany that operates DOS in SaintBarth.
TOD’S (Shanghai) Trading Co. LtdCompany that operates DOS in China.
TOD’S Singapore Pte Ltd TOD’SSingapore Pte LtdCompany that operates DOS inSingapore.
TOD’S UK LtdCompany that operates DOS in GreatBrita in.
Webcover LtdCompany that operates DOS in GreatBrita in.
Cal.Del. Usa Inc.Company that operates DOS inCal i forn ia (USA).
Colo. Del. Usa Inc.Company that operates DOS inColorado (USA).
Deva Inc.Company that distr ibutes andpromotes products in North America,and manages of DOS in New Jersey(USA).
Flor. Del. Usa Inc.Company that operates DOS in F lorida(USA).Hono. Del. Inc.Company that operates DOS in Hawai(USA).I l . Del . Usa Inc.Company that operates DOS in inI l l inois (USA).Neva. Del. Inc.Company that operates DOS inNevada (USA).Or. Del. Usa Inc.Company that operates DOS inCal i forn ia (USA).Sandel SAProduct ion Company.Un.Del. KftProduct ion Company

T O D ’ S G r o u p - 2 0 0 8 Q u a r t e r l y R e p o r t
M a r c h 3 1 s t , 2 0 0 8
4 Group’s organizational chart
Group’s organizational chart
TOD’S S.p.a.
TOD’S International BVAmsterdam – The Netherlands
S.C. - Euro 2,600,200
An.Del. USA Inc.New York U.S.A.
S.C. - Usd 3,700,000
Del.Com S.r.l.S.Elpidio a Mare - Italy
S.C. - Euro 31,200
TOD’S Hong Kong LtdHong Kong
S.C. - Usd 50,000
TOD’S UK LtdLondon – Great Britain
S.C. - Gbp 350,000
TOD’S Belgique S.p.r.l.Bruxelles - BelgiumS.C. - Euro 300,000
TOD’S Espana SLMadrid – Spain
S.C. - Euro 468,539.77
TOD’S Japan KKTokio - Japan
S.C. - Jpy 100,000,000
TOD’S Korea IncSeoul - Korea
S.C. Won 100,000,000
TOD’S Saint Barth SasSaint Barthélemy
S.C. - Euro 500,000
TOD’S Singapore LtdSingapore
S.C. - Sgd 300,000
Un.Del KftTata - Hungary
S.C. - Huf 42,900,000
TOD’S Luxembourg S.A.Luxembourg
S.C. Euro 31,000.00
TOD’S Macao LdaMacao
S.C. Mop 850,000
TOD’S France SasParis - France
S.C. - Euro 780,000
TOD’S Deutschland GmbhDusseldorf - GermanyS.C. - Euro 153,387.56
Cal.Del. USA Inc.Beverly Hills, Ca U.S.A.
S.C. - Usd 10,000
Colo.Del. USA IncDenver, Co U.S.A.S.C. - Usd 10,000
Deva Inc.Wilmington, DE U.S.A.
S.C. - Usd 500,000
Flor.Del. USA Inc.Tallahassee, Fl U.S.A.
S.C. - Usd 10,000
Hono.Del. Inc.Honolulu, Hi U.S.A.S.C. - Usd 10,000
Deva Mode S.r.l.S.Elpidio a Mare - Italy
S.C. - Euro 50,000
Spiga 22 S.r.l.S.Elpidio a Mare - ItalyS.C.. - Euro 50,000
Via Roma 40 S.r.l.S.Elpidio a Mare - Italy
S.C.. - Euro 50.000
Re.Se.Del. S.r.l.S.Elpidio a Mare - Italy
S.C. - Euro 25,000
Del.Pav. S.r.l.S.Elpidio a Mare - Italy
S.C. - Euro 50,000
Filangieri 29 S.r.l.Napoli - Italy
S.C. - Euro 100,000
TOD’S (Shanghai) Trading Co. LtdShanghai- China
S.C. USD 6,000,000
TOD’S India Retail Private LtdMumbai – India
S.C. INR 113,900,000
Webcover LtdLondon – Great Britain
S.C. - Gbp 1,000
Il.Del. USA Inc.Springfield, Il U.S.A.S.C. - Usd 10,000
Neva.Del. Inc.Carson City, Nv U.S.A.
S.C. - Usd 10,000
Or.Del. USA Inc.Sacramento, Ca U.S.A.
S.C. - Usd 10,000
100%
100%
100%
100%
100%
90%
99%
100%
100%
100%
100%
50% 50%
Gen.Del. SAGinevra – Switzerland
S.C. Chf 200,000
Sandel SASan Marino
S.C. - Euro 258.000
1%
TOD’S Tex. Del. Inc.Dallas, Tx U.S.AS.C. - Usd 10,000
100%
100%
100%
1% 99%
10%
100%
100%
100%
100%
100%
100%
100%
100%
100%
100%
100%
100%
100%
100%
50%
100%
100%
50%
50%
100%
1%
100%

T O D ’ S G r o u p - 2 0 0 8 Q u a r t e r l y R e p o r t
M a r c h 3 1 s t , 2 0 0 8
5 Distr ibution network
Distribution network as of March 31st , 2008
(D)=DOS (F)=FRANCHISING
Europe (D) (F)Italy 36 9
Belgium 1France 11
Germany 7
Great Britain 5 1Greece 2
Luxembourg 1Netherlands 1
Portugal 1
Russia 3Spain 1
Switzerland 3Turkey 1
Total 66 17
Asia (D) (F)Japan 28 1
China 4 7Korea 7 7
Philippines 1
Hong Kong 7Indonesia 2
Macao 1Malaysia 2
Singapore 3 1
Taiwan 12Thailandia 3
U.S.A. 1Total 50 37
USA (D) (F)
U.S.A. 14
RoW (D) (F)
Saudi Arabia 1United Arab E. 4
Kuwait 1Lebanon 2
Total 8
DOS, 2008 new openings
ItaliaMilanoVia Sant’Andrea, 17RomaVia Condotti , 53/A
UsaDal las8687 North CentralExpresswaySuite 1312
Far EastBei j ing (*)China World ShoppingMall1 J ian Guo Men WaiAvenueKyotoIsetan2F, Shio koj i kudaruhigashi ki j imachi , karasumadori, Shimokyo-ku
SendaiFuj i sak i department storemain b ldg . 4th f loor ,3-2-17,Ich iban-cho, Aoba-kuShanghai (*)1266 Nan J ing Xi LuShanghai (*)SHOP 210APlaza 66, 1266 NanjingXiRoad
Tian jin1/F, Tian j in Fr iendsh ipStore,21 Youyi Road
(*) Network in franchis ingconvers ion
Franchised Stores, 2008 new openings
Europa
Salonicco54, Proxenou Koromilastreet
Far East
Kuala LumpurPav il l ionLot 2.33 .01 , Level 2,
For a complete list of reta il outlets operated by the DOS and franchising network, reference should be
made to the corporate web site: www.todsgroup.com
T O D ’ S G r o u p - 2 0 0 8 Q u a r t e r l y R e p o r t
M a r c h 3 1 s t , 2 0 0 8
6 Key consol idated f inancia l f igures
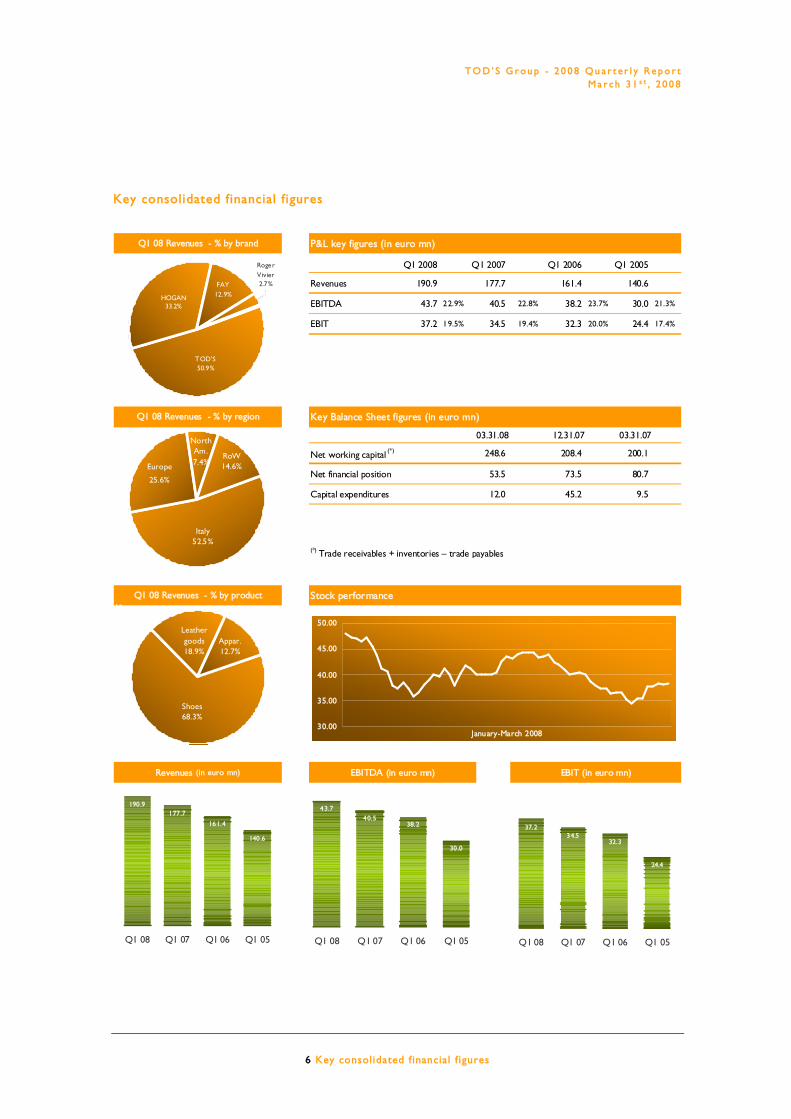
Key consolidated financial f igures
P&L key figures (in euro mn)
Q1 2008 Q1 2007 Q1 2006 Q1 2005
Revenues 190.9 177.7 161.4 140.6
EBITDA 43.7 22.9% 40.5 22.8% 38.2 23.7% 30.0 21.3%
EBIT 37.2 19.5% 34.5 19.4% 32.3 20.0% 24.4 17.4%
Key Balance Sheet figures (in euro mn)
03.31.08 12.31.07 03.31.07
Net working capital(*) 248.6 208.4 200.1
Net financial position 53.5 73.5 80.7
Capital expenditures 12.0 45.2 9.5
(*) Trade receivables + inventories – trade payables
Stock performance
Q1 08 Revenues - % by brand
EBITDA (in euro mn) EBIT (in euro mn)
Q1 08 Revenues - % by region
Q1 08 Revenues - % by product
Revenues (in euro mn)
Altro
0.3%
Roger
Vivier
2.7%FAY
12.9%HOGAN
33.2%
TOD'S
50.9%
190.9
177.7
161.4
140.6
Q1 08 Q1 07 Q1 06 Q1 05
Italy52.5%
Europe
25.6%
NorthAm.
7.4%RoW14.6%
Shoes68.3%
Leather
goods
18.9%
Appar.
12.7%
0.1%
43.7
40.538.2
30.0
Q1 08 Q1 07 Q1 06 Q1 05
37.234.5
32.3
24.4
Q1 08 Q1 07 Q1 06 Q1 05
30.00
35.00
40.00
45.00
50.00
January-March 2008

T O D ’ S G r o u p - 2 0 0 8 Q u a r t e r l y R e p o r t
M a r c h 3 1 s t , 2 0 0 8
7 Key consol idated f inancia l f igures
Principal Stock Market indicators (in euro)
Official pr ice at 01.02.2008 48.11
Official pr ice at 03.31.2008 38.25
Minimum price in 2008 32.20
Maximum price in 2008 48.45
Market capital ization at 01.02.2008 1,466,437,061
Market capital ization at 03.31.2008 1,165,895,190
Dividend per share 2007 1,25
Dividend per share 2006 1,25
Average number of outstanding shares 30,480,920
Average number of outstanding options 1,296,120
Total average number 31,777,040
The Group employees
03.31.08 12.31.07 03.31.07 03.31.06
Year to date 2,472 2,280 2,176 2,082
Average 2,421 2,233 2,169 2,024
EX = executives
WHC = white collar employees
BLC = blue collar employees
2008 Group employees
EX
2%
WHC
67%
BLC
31%
Information on operating performance
Group

T O D ’ S G r o u p - 2 0 0 8 Q u a r t e r l y R e p o r t
M a r c h 3 1 s t , 2 0 0 8
9 Report on operations
Group’s activity
The TOD’S Group operates in the luxury sector under its proprietary brands (TOD’S, HOGAN,
and FAY) and licensed brands (ROGER VIVIER e DEREK LAM). It actively creates, produces and
distributes shoes, leather goods and accessories, and apparel. The company’s mission is to offer
top-quality products that satisfy the practical demands and desires of consumers worldwide.
Group’s brands
The TOD’S brand is positioned on the luxury market and combines tradition,
top quality and modernity. It offers consumers shoes, leather goods, accessories and apparel
whose design is exclusive, functional and never ostentatious, interpreting timeless elegance.
TOD’S products embody the high quality of goods “Made in Italy” that are handcrafted for daily
use while offering a sophisticated and elegant look. Certain products, such as the Driving Shoe or
the D-Bag, beloved by celebrities and leaders around the world, have become icons representing
a unique and recognisably elegant style for men and women.
The HOGAN brand is positioned in the elegant luxury sportswear market,
offering consumers contemporary style shoes, leather goods, accessories and apparel with an
international vision.
HOGAN products, which are distinguished by their innovative character and high quality, have
created a unique style, contributing to changes in the fashion habits of consumers who want a
functional, comfortable, but also sporty and elegant product for everyday life.
HOGAN products are trend-setters in defining an elegant and sporty look. Some of its models
are best sellers, such as its Interactive shoes.
This brand offers consumers a line of high-quality apparel that is distinguished by
the technical treatment of fabrics, obsession for detail and extreme functionality, combining style
and quality with excellence. FAY products can be worn everywhere: from the sports stadium to

T O D ’ S G r o u p - 2 0 0 8 Q u a r t e r l y R e p o r t
M a r c h 3 1 s t , 2 0 0 8
10 Report on operations
the off ice, and from the city to the countryside. In every season, the FAY collection offers
innovative, recognisable products for men, women and children.
Foreign currency markets
On the currency markets, the euro continued appreciating against all of the most important foreign
currencies in Q1 2008. Compared with the average values reported in Q1 2007, the U.S. dollar, the
Hong Kong dollar and the British pound slipped by an average 12%, while the euro remained stable
against the Japanese yen (-0.8%).
Principal events and transactions during the period
No events or transactions took place in Q1 2008 such as would impact the assets, l iabil it ies,
f inancial position and operating result of the TOD’S Group as reported in the Annual Report at
December 31st , 2007.
Starting from January 2008, the Group has operated directly on the Chinese market through its
own network of directly operated stores (DOS). As previously mentioned, the Group formally
acquired the three DOS in Shanghai and Bei jing through its subsidiary TOD’S (Shanghai) Trading
Co. Ltd, which were identif ied in the 2007 Annual Report as special purpose entities. It began
expanding its distribution network by opening another three DOS: at Tianjin in January and at
Kunming and Sanya after the end of the first quarter. The take-over of the two retail outlets in
Hangzhou and Chengdu is currently being defined.
The impact of these new activit ies on the Group’s organisation is insignif icant.

T O D ’ S G r o u p - 2 0 0 8 Q u a r t e r l y R e p o r t
M a r c h 3 1 s t , 2 0 0 8
11 Report on operations
Group’s results in Q1 2008
The TOD’S Group generated 190.9 mill ion euros in revenues in Q1 2008, up 13.2 mill ion euros
from the same period of 2007, for a 7.4% increase. First quarter EBIT totalled 37.2 mill ion euros,
up 2.8 mill ion euros. On a comparable exchange rate basis (average of exchange rates reported
during Q1 2007), revenues would have been 193.6 mill ion euros, with a growth rate of 8.9%,
while the impact of exchange rates as a percentage of operating sales results (EBIT and EBITDA)
would have been virtually neutral.
( In euro 000’s)
FY 07 Principal economic indicators Q1 2008 Q1 2007 Change %
6 5 7 , 0 8 9 S a l e s r e ven u e s 1 9 0 , 9 2 2 1 7 7 , 7 3 8 1 3 , 1 8 4 7 . 4
1 5 2 , 9 7 3 E B I T DA 4 3 , 7 4 9 4 0 , 4 6 0 3 , 2 8 9 8 . 1
( 2 6 , 4 4 1 ) D e p r e c . , a m or t . , w r i t e d ow n s ( 6 , 5 2 1 ) ( 5 , 9 9 9 ) ( 5 2 2 ) 8 . 7
1 2 6 , 5 3 2 E B I T 3 7 , 2 2 8 3 4 , 4 6 1 2 , 7 6 7 8 . 0
Fo r e i g n ex c h a n g e i m p a c t on r eve nu e s 2 , 7 0 0
A d j u s t e d S a l e s re ve nu e s 1 9 3 , 6 2 2 1 7 7 , 7 3 8 1 5 , 8 8 4 8 . 9
Fo r e i g n ex c h a n g e i m p a c t on o p er a t i n g c o s t ( 2 , 1 0 0 )
A d j u s t e d E B I T DA 4 4 , 3 4 9 4 0 , 4 6 0 3 , 8 8 9 9 . 6
Fo r e i g n ex c h a n g e i m p a c t on d e p r e c . & a m or t . ( 1 5 0 )
A d j u s t e d E B I T 3 7 , 6 7 8 3 4 , 4 6 1 3 , 2 1 7 9 . 3
E B I T DA % 2 2 . 9 2 2 . 8
E B I T % 1 9 . 5 1 9 . 4
A d j u s t e d E B I T DA % 2 2 . 9 2 2 . 8
A d j u s t e d E B I T % 1 9 . 5 1 9 . 4
( In euro 000’s)
03.31.07 Principal Balance Sheet indicators 03.31.08 12.31.07 Change
200,144 Net working capital (*) 248,553 208,453 40,100
80,689 Net financia l position 53,475 73,541 (20,066)
9,461 Capita l expenditures 12,039 45,199 n,s ,
( * ) Trade rece ivab les + inventor ies – trade payab les

T O D ’ S G r o u p - 2 0 0 8 Q u a r t e r l y R e p o r t
M a r c h 3 1 s t , 2 0 0 8
12 Report on operations
Revenues. Consolidated revenues totalled 190.9 mill ion euros in Q1 2008, up 7.4% from the first
quarter of 2007. On a comparable exchange rate basis, where the same average exchange rates
for the January-March 2007 are used, revenues and the growth grate from the same period of the
previous year would have been 193.6 mill ion euros and 8.9%, respectively.
Analysis of the
revenues of
distribution
channel shows
that the first
three months of
the year were
characterised by
the prevalence of
sales on the
wholesale
channel. In Q1
2008, wholesale
revenues
(In euro mn) Q1 2008 % Q1 2007 % Change %DOS 70.6 37.0 65.7 37.0 4.9 7.5
WS 120.3 63.0 112.0 63.0 8.3 7.4Total 190.9 100.0 177.7 100.0 13.2 7.4
WS
63.0%
DOS
37.0%
0
20
40
60
80
100
120
140
160
180
200
Q1 2008 Q1 2007
WS
DOS
grew by 7.4% (8.4% on a comparable exchange rate basis), due to the organic growth in sales to
independent customers. This growth figure assumes even more signif icance if one considers that
revenues in Q1 2007 included the wholesale component of sales to the ten franchised stores in
South Korea and China, which were converted into DOS in August 2007 (South Korea) and
January 2008 (China) . Following those conversions, there were three fewer franchised stores at
March 31st , 2008 than a year earlier.
The DOS network generated major results, with revenues totall ing 70.6 mil l ion euros in Q1
2008, up 7.5% (or 9.8% on a comparable exchange rate basis) from the first three months of
2007, partly due to the higher number of retail outlets.
The same store sales growth (SSSG) figure, calculated as the worldwide average of revenue
growth rates reported by DOS existing at January 1s t , 2007, was 2.6% in the first 19 weeks of the
year (January 1st – May 4th , 2008).

T O D ’ S G r o u p - 2 0 0 8 Q u a r t e r l y R e p o r t
M a r c h 3 1 s t , 2 0 0 8
13 Report on operations
A total of nine DOS were opened in Q1 2008, including the new TOD’S boutique on Via dei
Condotti in Rome, dedicated entirely to women’s fashion, and on Via Sant’Andrea in Milan, the
first Italian boutique of ROGER VIVIER.
At March 31st , 2008 the Group’s distribution network was comprised by 130 DOS and 62
franchised stores, compared with 117 DOS and 65 franchised stores on March 31st , 2007.
TOD’S brand revenues totalled 97.2 mill ion euros in Q1 2008, up 1.7% from the first three
months of 2007. On a comparable exchange rate basis, the increase would have been 3.8%.
The HOGAN brand
confirmed the
excellent results
realised in 2007,
with revenues of
63.3 mill ion euros
in Q1 2008, up
18.6% from the
first three months
of 2007.
FAY brand revenues
were 24.5 million
euros in Q1 2008,
for an increase of
(In euro mn) Q1 2008 % Q1 2007 % Change %
TOD'S 97.2 50.9 95.6 53.8 1.6 1.7
HOGAN 63.3 33.2 53.4 30.0 9.9 18.6FAY 24.5 12.9 23.6 13.3 0.9 4.0
RV 5.1 2.6 3.7 2.1 1.3 35.6Other 0.8 0.4 1.4 0.8 (0.6) (45.3)
Total 190.9 100.0 177.7 100.0 13.2 7.4
TOD'S
50.9%
HOGAN
33.2%
FAY12.9%
RV
2.6%
0
20
40
60
80
100
120
140
160
180
200
Q1 2008 Q1 2007
TOD'S HOGAN
FAY RV
4% from Q1 2007.
Finally, the ROGER VIVIER brand confirmed its excellent growth potential, by posting 5.1 mill ion
euros in revenues during the period, up 35.6% from Q1 2007.
At the individual segment level, shoe revenues rose sharply this year, signall ing the ongoing
reinforcement of the Group’s leadership in this merchandise segment. In Q1 2008, segment
revenues totalled 130.4 mill ion euros, up 11.5% (or 12.9% on a comparable exchange rate basis)
from Q1 2007.

T O D ’ S G r o u p - 2 0 0 8 Q u a r t e r l y R e p o r t
M a r c h 3 1 s t , 2 0 0 8
14 Report on operations
Leather goods and
accessory revenues
totalled 36 mill ion
euros. On a
comparable
exchange rate
basis, they fell by
2.8%. At the
beginning of the
season, leather
goods showed signs
of weakness,
suffering much
more than shoes
(In euro mn) Q1 2008 % Q1 2007 % Change %
Shoes 130.4 68.3 117.0 65.8 13.4 11.5
Leather goods 36.0 18.9 38.1 21.5 (2.1) (5.5)Apparel 24.3 12.7 22.1 12.4 2.2 9.9
Other 0.2 0.1 0.5 0.3 (0.4) (66.1)Total 190.9 100.0 177.7 100.0 13.2 7.4
0.1%
Shoes
68.3%
Leather
goods
18.9%
Apparel
12.7%
0
20
40
60
80
100
120
140
160
180
200
Q1 2008 Q1 2007
ApparelLeather goodsShoes
from the effects of intense competition and the challenging foreign currency and macroeconomic
situation.
Apparel revenues reflected the performance of FAY brand sales. In Q1 2008, they totalled 24.3
mill ion euros, up 9.9% from the same period of the previous year.
On a comparable
exchange rate
basis, revenues
grew on all the
markets where the
Group operates.
Excellent results
were generated in
Italy, as a result of
the leadership of
the Group’s three
principal brands.
Revenues in Q1
2008 totalled 100.3
(In euro mn) Q1 2008 % Q1 2007 % Change %
Italy 100.3 52.5 88.9 50.0 11.3 12.7
Europe 48.8 25.6 47.5 26.7 1.4 2.9North America 14.0 7.4 14.7 8.3 (0.7) (4.8)
RoW 27.8 14.6 26.6 15.0 1.3 4.7Total 190.9 100.0 177.7 100.0 13.2 7.4
Italy52.5%
Europe25.6%
NordAm.
7.4%RoW14.6%
020406080
100120140160180200
Q1 2008 Q1 2007
Italy EuropeNorth. Am. RoW

T O D ’ S G r o u p - 2 0 0 8 Q u a r t e r l y R e p o r t
M a r c h 3 1 s t , 2 0 0 8
15 Report on operations
million euros, up 12.7% from Q1 2007.
In the rest of Europe, sales totalled 48.8 mil l ion euros, up 2.9% from Q1 2007 (3.5% on a
comparable exchange rate basis).
The figure for the American market was heavily impacted by the sharp appreciation of the euro
against the dollar. On a comparable exchange rate basis, revenues in this area were 16 mill ion
euros, up 8.2% from Q1 2007.
Finally, sales on Asian markets totalled 27.8 mill ion euros, up 4.7% from Q1 2007, stemming from
the excellent results realised in Southeast Asia. Growth was 6.6% on a comparable exchange rate
basis.
O p e r a t i n g r e s u l t s . Both earnings indicators, EBITDA and EBIT, show growth from the level reported
in Q1 2007, consistently with management expectations.
( In euro 000’s)Q 1 2 0 0 8 Q 1 2 0 0 7 F Y 2 0 0 7
Revenues
Sales revenues 190,922 177,738 657,089
Others revenues and income 3,207 2,124 12,965
Totale r icavi 194,129 179,862 670,054
Operating Costs
Change in inventories of work in proc. and finis. goods 4,594 755 30,296
Costs of row materials, suppl ies and material for cons . (50,685) (48,021) (187,103)
Costs for services (63,296) (56,474) (213,991)
Costs of use of th ird party assets (10,277) (9,435) (38,660)
Costs of labour (25,691) (22,107) (89,327)
Other operating charges (5,025) (4,120) (18,296)
Total operating costs (150,380) (139,402) (517,081)
EBITDA 43,749 40,460 152,973
Amortization, depreciation and write-downs
Amortization of intangible assets (1,443) (1,241) (5,141)
Depreciation of tangib le assets (5,078) (4,758) (20,423)
Other adjustments - - (494)
Total amortization, depreciation and write-downs (6,521) (5,999) (26,058)
Provisions - - (383)
EBIT 37,228 34,461 126,532

T O D ’ S G r o u p - 2 0 0 8 Q u a r t e r l y R e p o r t
M a r c h 3 1 s t , 2 0 0 8
16 Report on operations
EBITDA during the period was 43.7 million euros,
representing 22.9% of consolidated revenues at 31
March. In Q1 2007, the same indicator was 40.5 million
euros, representing 22.8% of revenues for the same
period.
The effects of changes in exchange rates from the
average rates for the previous reference period were
insignificant. EBITDA would climb another 0.6 million
euros, to 44.3 million euros (with its proportion of
revenues remaining unchanged at 22.9%).
The cost structure does not show significant changes.
The quarter showed growth in spending for personnel,
which reflected the increase in number of employees,
EBITDA (in euro mn)
44.3
43.7
40.5
Q1 2008comparable exch.
rate basis
Q1 2008 Q1 2007
especially in consequence of the major expansion in the DOS network compared with the
situation at 31 March 2007, and the systematic evolution in compensation dynamics. In Q1 2008,
labour costs totalled 25.7 mill ion (including 0.7 mil l ion euros for the portion of a bonus
recognised for all of FY 2008), compared with 22.1 mill ion in Q1 2007. At 31 March 2008 this
component represented 13.5% of revenues (Q1 2007: 12.4%). At the same date, the Group had
2,664 employees, 276 more than at 31 March 2007.
The impact of amortisation and depreciation of non-
current assets (intangible assets and property, plant
and equipment) was largely unchanged.
EBIT for Q1 2008 was 37.2 million (34.5 million in
2007), representing 19.5% of consolidated sales (19.4%
in Q1 2007). It was 2.8 mill ion euros higher (+8%) than
in the same period a year earlier, with these values
climbing to 3.2 million and 9.3% on a comparable
exchange rate basis. The impact of the change in
exchange rates on profitabil ity was irrelevant for EBIT
as well, which remained unchanged at 19.5%.
EBIT (in euro mn)
37.7
37.2
34.5
Q1 2008
comparable exch.
rate basis
Q1 2008 Q1 2007

R e s o c o n t o t r i m e s t r a l e
( 3 1 . 0 3 . 2 0 0 8 )
17 Report on operations
Capital expenditure. The Group invested 12.0 mill ion euros in non-current assets during Q1
2008, up from the figure for the previous reference period, when the outlay for capital expendi-
tures was 9.5 mill ion euros. Signif icant resources (more
than 8 mill ion euros) were allocated to the DOS
network.
These were focused on the execution of three
important projects: set-up of the new TOD’S DONNA
boutique in Rome and the ROGER VIVIER boutique in
Milan, with the latter occupying a prestigious 18th
century palace, and the opening in Milan of the restyled
flagship store of TOD’S (in terms of image and size) on
Via della Spiga, which marked the first application of
the new concept realised for the brand.
INVESTMENTS BY ALLOCATION
Other
20%
Produc.
13%DOS
67%
Net financia l position. This totalled 53.5 mil l ion euros at the end of the period: cash and cash
equivalents totalled 76.6 mill ion euros, as compared with total l iabil it ies of 23.1 mill ion euros, of
which 10.2 mill ion euros are payable from FY 2009.
At 31 December 2007 the net f inancial position was 73.5 mill ion euros, with 95.8 mill ion euros in
assets and 22.2 mill ion in liabil it ies.
Net financia l posit ion (in euro 000’s)
03.31.07 03.31.08 12.31.07 Change
Current f inancia l assets
101,532 Cash and cash equiva lents 76,608 95,753 (19,145)
101,532 Cash 76,608 95,753 (19,145)
Current f inancia l l iabi l i t ies
(7,089) Current account overdraft (11,423) (10,496) (927)
(2,061) Current share of medium-long term financing (1,482) (1,482) -
(9,150) Current f inancia l l iabi l i t ies (12,905) (11,978) (927)
92,382 Current net financia l posit ion 63,703 83,775 (20,072)
Non-current f inancial l iab il i ties
(11,693) Financing (10,228) (10,234) 6
(11,693) Non-current f inancial l iab il i ties (10,228) (10,234) 6
80,689 Net financia l posit ion 53,475 73,541 (20,066)

T O D ’ S G r o u p - 2 0 0 8 Q u a r t e r l y R e p o r t
M a r c h 3 1 s t , 2 0 0 8
18 Report on operations
The changes in net f inancial position were consistent with the financial dynamics for the period in
question. The first quarter of every year is structurally characterised by the investment of
resources to finance the temporary increase in net working capital (trade receivables and
inventories net of trade payables), generated by the high exposure to independent customers
resulting from the wholesale component of revenues and the accumulation of inventories for the
Spring-Summer 2008 collection on the DOS network, which wil l free up cash resources in the
following quarter.
( In euro 000’s)
Net working capita l 31.03.08 12.31.07 Change
Inventories 223,383 218,731 4,652
Trade receivables 157,351 108,410 48,941
Trade payables (132,181) (118,688) (13,493)
Net working capita l 248,553 208,453 40,100
May 19th is the ex-coupon date for the FY 2007 dividend, resolved by the Shareholders’ Meeting
of the parent company TOD’S S.p.a. on April 22nd , 2008. The dividend, totall ing 38,101,150.00
euros, at the rate of 1.25 (one and 25/100) euros for each of the 30,480,920 shares of capital
stock at the payment date, will be paid to al l shareholders entered on the Register of
Shareholders at the ex-coupon date.
Significant events occurring after the end of the period
No signif icant events involving the Group’s activit ies have occurred since March 31st , 2008.
Business outlook
Analysis of the current situation of markets and the figures presented for the first quarter allow
us to look forward to a positive change in performance for the whole year, with strong growth in
revenues and profits.
Guidelines for preparation of the Quarterly Report
The TOD’S Group Quarterly Report on Operations at March 31st , 2008 was prepared pursuant
to Article 154 ter (5) of the Consolidated Law on Financial Intermediation (“TUF”) introduced by

T O D ’ S G r o u p - 2 0 0 8 Q u a r t e r l y R e p o r t
M a r c h 3 1 s t , 2 0 0 8
19 Report on operations
Legislative Decree 195/2007, in implementation of Directive 2004/109/EC (the “Transparency
Directive”).
The consolidated financial statements were approved by the Board of Directors of TOD’S S.p.a.
on May 14th , 2008, and on the same date that body authorized its publication.
Accounting policies
The accounting policies appl ied to prepare the financial f igures reported on the Quarterly Report
at March 31st , 2008 was prepared by applying IAS/IFRS, issued by IASB and approved by the
European Union at the reporting date. IAS/IFRS refers to the International Accounting Standards
(IAS), International Financial Reporting Standards (IFRS), and all interpretative documents issued
by the IFRIC (previously called the Standing Interpretations Committee).
The same accounting standards used to prepare the consolidated financial statements at
December 31st , 2007 were used to prepare this Report.
Preparation of the financial f igures reported on the Quarterly Report at March 31st , 2008 entails
making estimates and assumptions based on the management’s best valuation. I f these estimates
and assumptions should change in future from the actual circumstances, they will obviously be
modif ied for the period in which those circumstances changed.
Specif ically in regard to determination of eventual impairment losses affecting f ixed assets,
complete tests are performed only when the annual report is prepared, when all information as
might be necessary is available, unless there are indications that require immediate valuation of
eventual impairment losses or the occurrence of events that required repetition of the
procedure.
The rates applied for translation of the financial statements of subsidiaries using a functional
currency other than the currency used for consolidation, are il lustrated in the following table and
compared with those used in the previous period:
T O D ’ S G r o u p - 2 0 0 8 Q u a r t e r l y R e p o r t
M a r c h 3 1 s t , 2 0 0 8
20 Report on operations
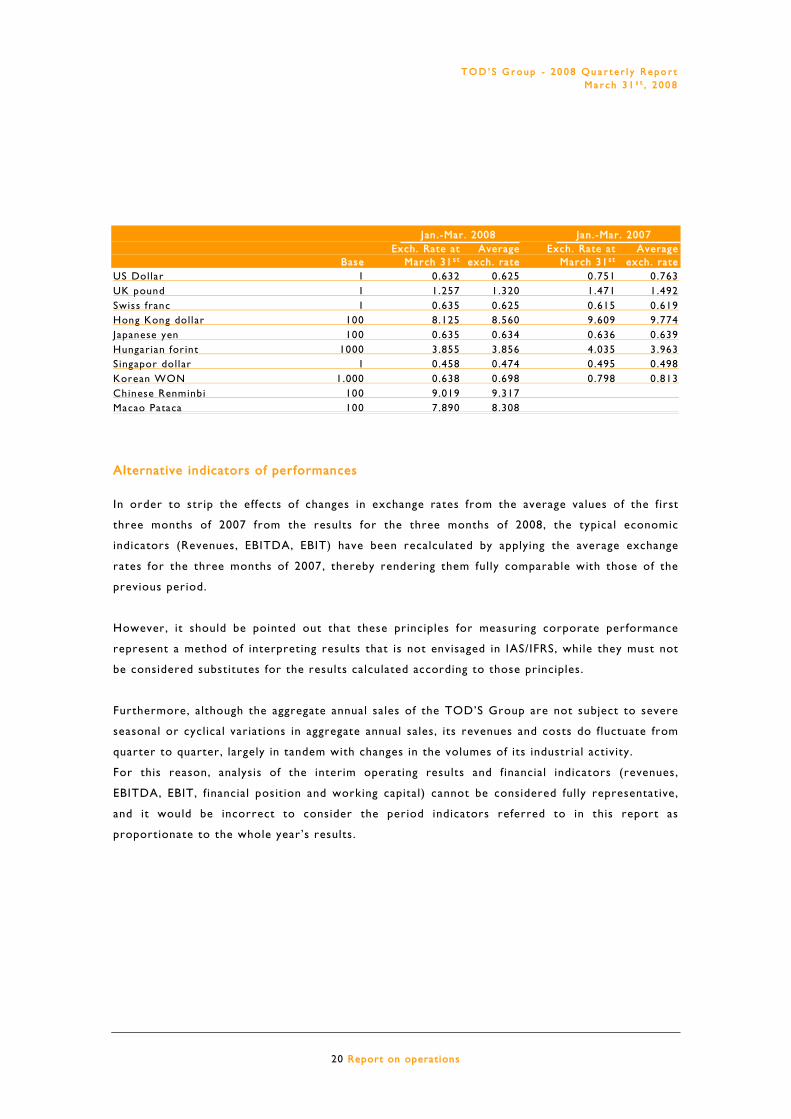
Jan.-Mar. 2008 Jan.-Mar. 2007
Exch. Rate at Average Exch. Rate at AverageBase March 31 s t exch. rate March 31 s t exch. rate
US Dollar 1 0.632 0.625 0.751 0.763
UK pound 1 1.257 1.320 1.471 1.492
Swiss franc 1 0.635 0.625 0.615 0.619
Hong Kong dollar 100 8.125 8.560 9.609 9.774
Japanese yen 100 0.635 0.634 0.636 0.639
Hungarian for int 1000 3.855 3.856 4.035 3.963
Singapor dollar 1 0.458 0.474 0.495 0.498
Korean WON 1.000 0.638 0.698 0.798 0.813
Chinese Renminbi 100 9.019 9.317
Macao Pataca 100 7.890 8.308
Alternative indicators of performances
In order to strip the effects of changes in exchange rates from the average values of the first
three months of 2007 from the results for the three months of 2008, the typical economic
indicators (Revenues, EBITDA, EBIT) have been recalculated by applying the average exchange
rates for the three months of 2007, thereby rendering them fully comparable with those of the
previous period.
However, it should be pointed out that these principles for measuring corporate performance
represent a method of interpreting results that is not envisaged in IAS/IFRS, while they must not
be considered substitutes for the results calculated according to those principles.
Furthermore, although the aggregate annual sales of the TOD’S Group are not subject to severe
seasonal or cyclical variations in aggregate annual sales, its revenues and costs do fluctuate from
quarter to quarter, largely in tandem with changes in the volumes of its industrial activity.
For this reason, analysis of the interim operating results and financial indicators (revenues,
EBITDA, EBIT, f inancial position and working capital) cannot be considered fully representative,
and it would be incorrect to consider the period indicators referred to in this report as
proportionate to the whole year’s results.

T O D ’ S G r o u p - 2 0 0 8 Q u a r t e r l y R e p o r t
M a r c h 3 1 s t , 2 0 0 8
21 Report on operations
Scope of consolidation
Compared with March 31st , 2007, the scope of consolidation includes the subsidiaries TOD’S
Macao Ltd, TOD’S (Shanghai) Trading Co Ltd and TOD’S India Retail Pte Ltd. There was no
change instead from the Statutory Financial Statements at December 31st , 2007. The activit ies of
the special purpose entities in Shanghai and Bei jing were also included in the scope of
consolidation. These entities were acquired by TOD’S (Shanghai) Trading Co Ltd at January 1st ,
2008.
Transactions with related parties
In the first three months of 2008, the TOD’S Group participated in a number of transactions with
parties that have an interest in the Group itself (mainly directors). These transactions, which
were all exclusively in the Group’s interest, were carried out by applying contractual conditions
that would theoretically be applied in an arm’s length transaction, in compliance with the
governance rules aimed at assuring their regularity, transparency, and substantial fairness.
The principal object of transactions with related parties was the sale of products, lease of spaces
for retail outlets, show rooms, and off ices, the user license for the Roger Vivier brand, provision
of advertising services.
The following table il lustrates the details of these transactions: the transactions amongst Group’s
companies included in the scope of consolidation were eliminated from the consolidated financial
statements, and thus they are not shown in these notes.
i . Commercial transactions with unconsolidated subsidiaries
Revenues and costs Q1 2008 Q1 2007
(In euro 000’s) Capital ized Capital ized
Costs Revenues expenses Costs Revenues expenses
Sell ing products
Specia l Purpose Entit ies 782 941
Total 782 941
Receivables and payables 03.31.08 03.31.07
(In euro 000’s) Receivables Payables Receivables Payables
Specia l Purpose Entit ies 4,281
Total 4 ,251 4,281

T O D ’ S G r o u p - 2 0 0 8 Q u a r t e r l y R e p o r t
M a r c h 3 1 s t , 2 0 0 8
22 Report on operations
i i . Commercial transactions with other related entities – Revenues and costs
Revenues and costs Q1 2008 Q1 2007
(In euro 000’s) Capital ized Capital ized
Costs Revenues expenses Costs Revenues expenses
Sell ing products
Roger Vivier Par is S.a.s . 373 459 20 523
Ordinary leases
Immobi l iare De.Im. S.r. l . 672 27 796 30
Difran S.a.s. 47
Holpaf BV 766 725
User license contract “Roger Vivier”
Gousson - Consultadoria & Mark. Lda 618 1,717 448 1,192
Advertising services
Forma Pura S .r. l . 315 462
Total 2 ,744 2,203 2,498 1,745
i i i . Commercial transactions with other related entities – receivables and payables
Receivables and payables 03.31.08 03.31.07
(In euro 000’s) Receivables Payables Receivables Payables
Roger Vivier Par is S.a.s . 912 407 638 153
Immobi l iare De.Im. S.r. l . 320 21 303
Difran S.a.s. 56
Holpaf BV 6 6
Gousson - Consultadoria & Mark. Lda 7,887 1,429 2,611 448
Forma Pura S .r. l . 7 453 798
Total 9 ,126 2,351 3,270 1,708
Milan, May 14st , 2008
The Chairman of the Board of Directors
Diego Della Valle

T O D ’ S G r o u p - 2 0 0 8 Q u a r t e r l y R e p o r t
M a r c h 3 1 s t , 2 0 0 8
23 Report on operations
Declaration pursuant to Article 154bis(2) of the Consolidated Law on Financial
Intermediation
The manager charged with preparing the company’s f inancial reports certif ies, pursuant to Article
154bis(2) of the Consol idated Law on Financial Intermediation, that the accounting information
presented in this document corresponds to the accounting documents, books, and ledger entries.
The manager charged with preparing the company’s f inancial reports
Rodolfo Ubaldi


