1 Intermodal Connectivity to BRT: A Comparative Analysis of Bogotá and Curitiba Intermodal Connectivity to BRT: A Comparative Analysis of Bogotá and Curitiba Fábio Duarte, Pontifícia Universidade Católica do Paraná Fernando Rojas, Pontificia Universidad Javeriana, Bogotá Abstract Bogotá and Curitiba have become important references for public transportation in Latin America and have gained worldwide recognition for their technically and managerially innovative bus-based public transportation systems (Bus Rapid Tran- sit, BRT). However, despite the huge success of these projects, most people living in these cities still use other modes for their daily trips. e main aim of this paper is to investigate whether, and how, these cities adopt a multimodal approach when plan- ning and implementing their innovative BRT projects. We compare how pedestrians, cyclists, and taxi and car users are linked to the BRT system in each of these cities and conclude that minor changes in both systems could improve their multimodality. Introduction Bogotá and Curitiba have become important references for public transportation in Latin America and have gained worldwide recognition, both in the technical and scientific literature, for their technically and managerially innovative bus-based public transportation systems. Technical manuals, such as those published by Embarq (2010) or ITDP (2007), depict Bogotá and Curitiba as reference models for public transportation because of the Bus Rapid Transit (BRT) networks successfully implemented in these cities. e World Bank even considers that BRT “can enable
Transcript
1
Intermodal Connectivity to BRT: A Comparative Analysis of Bogotá and Curitiba
Intermodal Connectivity to BRT: A Comparative Analysis of Bogotá
and CuritibaFábio Duarte, Pontifícia Universidade Católica do Paraná Fernando Rojas, Pontificia Universidad Javeriana, Bogotá
Abstract
Bogotá and Curitiba have become important references for public transportation in Latin America and have gained worldwide recognition for their technically and managerially innovative bus-based public transportation systems (Bus Rapid Tran-sit, BRT). However, despite the huge success of these projects, most people living in these cities still use other modes for their daily trips. The main aim of this paper is to investigate whether, and how, these cities adopt a multimodal approach when plan-ning and implementing their innovative BRT projects. We compare how pedestrians, cyclists, and taxi and car users are linked to the BRT system in each of these cities and conclude that minor changes in both systems could improve their multimodality.
IntroductionBogotá and Curitiba have become important references for public transportation in Latin America and have gained worldwide recognition, both in the technical and scientific literature, for their technically and managerially innovative bus-based public transportation systems. Technical manuals, such as those published by Embarq (2010) or ITDP (2007), depict Bogotá and Curitiba as reference models for public transportation because of the Bus Rapid Transit (BRT) networks successfully implemented in these cities. The World Bank even considers that BRT “can enable
Journal of Public Transportation, Vol. 15, No. 2, 2012
2
new categories of passengers, including more women and children, to benefit from an improved level of safe, accessible, and reliable public transport” (Rickert 2010, p. 1). BRT is also considered an important element of a greenhouse gas reduction policy (Wright and Fulton 2005).
BRT has undoubtedly improved the quality of public transportation in several Latin American cities, from Santiago de Chile to Caracas. Also in Latin America, Curi-tiba and Bogotá are examples of best practices. However, the success of a public transportation project should not be based on a single major mode. In some cities in developed countries, BRT has been chosen over LRT (light rail transit), mainly for economic reasons, such as in Ottawa in the late 1970s (Rathwell and Schijns 2002), or to complement more robust rail systems, such as the Metro in Shanghai and Beijing (Xu 2004). In developing countries, BRT has been implemented as the main, if not only, mass transportation system, examples being South Africa (Cape Town) and Asia (Jakarta). Most of the developing countries have experienced an increase in the number of private vehicles per capita, reaching an annual increase of 10 percent (UN-Habitat, 2010), or vehicle sales increasing over 50 percent per year in China (Sperling and Claussen 2004, p. 11); but non-motorized modes are still relevant, even for important metropolises in developing world, reaching 33 percent in Delhi and Bangalore, 53 percent in Beijing (LTA Academy 2011), 33 percent in São Paulo (Metrô 2007), and 37 percent in Rio de Janeiro (Rio de Janeiro 2004). Com-mon forms of public transportation include vans, minibuses, and taxis.
The same scientific journals that highlight the merits of BRT frequently publish papers that point out the importance of a multimodal approach in meeting con-temporary mobility challenges, such as the need to achieve socioeconomic equi-librium or reduce environmental impacts associated with urban transportation. Vincent and Jerram (2006, p. 222) even calculate “that it is likely that a BRT system can achieve significantly greater CO2 reductions than LRT” in American cities, both because the electricity used to power LRT comes from fossil fuels and because the cost of building an LRT is significantly higher than the corresponding cost for a BRT. The implication of the latter is that because more BRT than LRT can be built for the same dollar amount, which will translate into greater CO2 emissions.
The main aim of this paper is to investigate whether, and how, Bogotá and Curitiba adopt a multimodal approach when planning and implementing their innovative BRT projects. A comparison is made of how pedestrians, cyclists, and taxi and car users are linked to the BRT system in each of these cities. Then, based on this, some brief recommendations are presented for improving urban mobility in these cities,
3
Intermodal Connectivity to BRT: A Comparative Analysis of Bogotá and Curitiba
demonstrating that the combination of different modes can enhance an urban mobility network and may improve the overall quality of trips for its users.
BRT in Curitiba and Bogotá: An OverviewCuritiba, a PioneerCuritiba is considered one of the first cities to have implemented a BRT system. It pioneered BRT in Latin America and has been a key inspiration for other cities on the continent, including Bogotá (Duarte Carvajal 2009; Ardila 2004).
The first BRT line in Curitiba was planned at the end of the 1960s and launched in 1974, when the city had 609,000 inhabitants. However, at the time, it was not considered a BRT. In fact, what has become known as the Curitiba BRT has its origins in a series of sociotechnical struggles spanning 40 years: every time the bus system was challenged, mainly because it had insufficient capacity to move a growing population, a rail project was presented as the solution; and every time such a project was presented, the necessary financial support was not available and the rail project was abandoned (Duarte et al. 2001). Nevertheless, as Duarte et al. (2011) have shown, some of the innovations associated with the Curitiba BRT are the result of these failed rail projects.
This sociotechnical relationship between rail and bus started in 1969, before the first bus corridor was implemented. The most recent development in this relation-ship involves a new metro project for the city, which was approved in 2008. Again, this is based on the same argument as previous rail projects (Duarte et al. 2011): that the BRT network is reaching its maximum capacity, moving more than 2.2 million passengers daily from a population of 1.7 million in Curitiba and more 1.3 million in the metropolitan area.
The main characteristics of Curitiba’s BRT that can be traced back to failed rail projects include bus platforms at the same level as the floor of the bus; speedy boarding and alighting; prepaid fares; automated fare collection; greater spacing between bus stops (from 500 m up to 3 km); and integration of trunk and feeder lines in main stations. These characteristics are now seen as the basic framework of a full BRT.
The BRT extends over 72 kilometers and runs along what are known as the North-South, East-West, and Boqueirão corridors, as shown in Figure 1. A new 18 kilome-ter corridor, called the Green Line, is under construction, transforming a former
Journal of Public Transportation, Vol. 15, No. 2, 2012
4
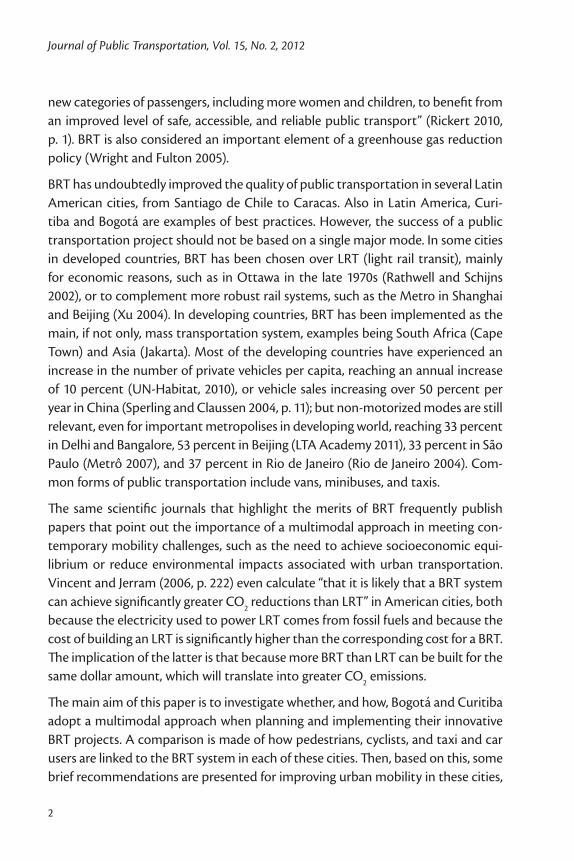
federal highway in a metropolitan axis, a central BRT corridor, and restricted freight traffic. The fleet at the time of writing consists of 1,915 buses, of which 60 run on biofuels and 185 run in segregated corridors (Lindau et al. 2010; Hagen 2009).1
Source: Urbs
Figure 1. High density along the North-South BRT corridor in Curitiba
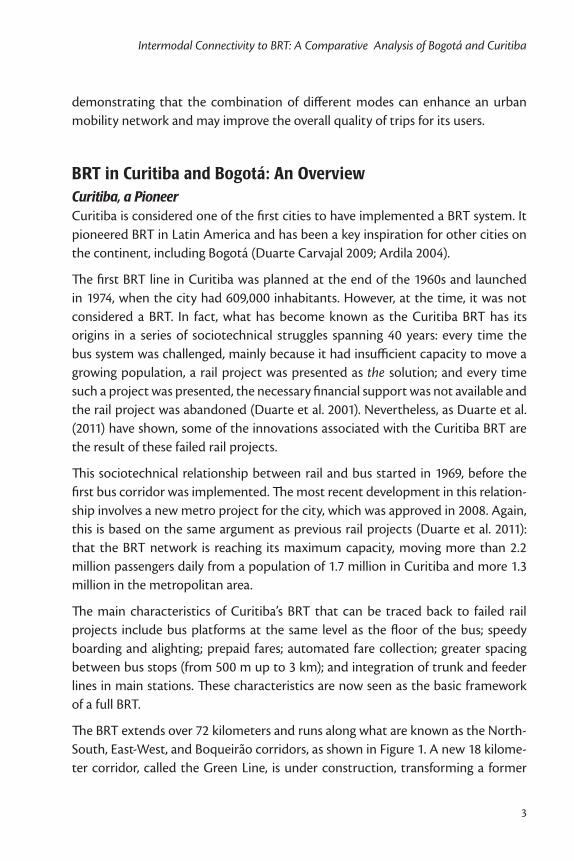
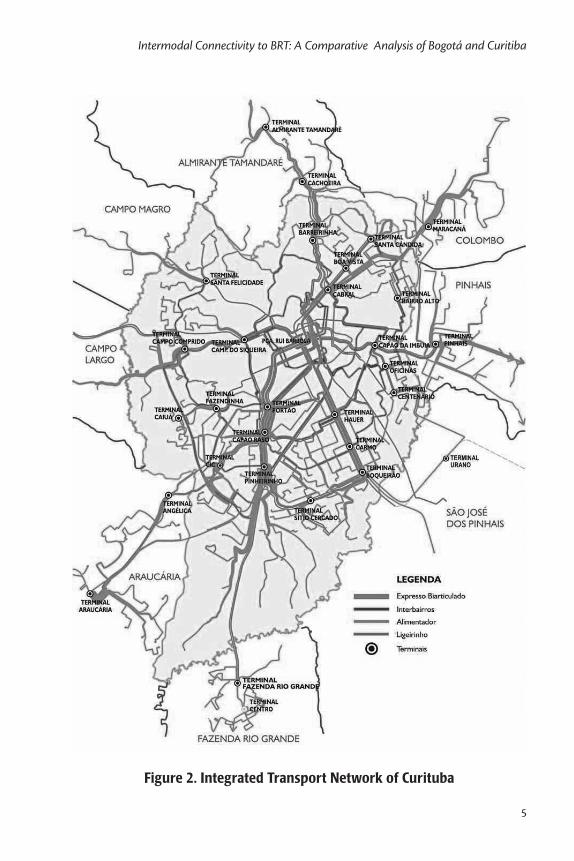
All public transportation in Curitiba is part of the RIT (Integrated Transport Net-work) (Figure 2), which also provides partial coverage in neighboring cities. It is run by URBS, a 99.9% publicly-owned company, whose president is appointed by the mayor of Curitiba.
Bogotá, Revamping BRTBogotá implemented its BRT system at the end of the 1990s. A private company called Transporte del Tercer Milenio Transmilenio S.A., was created to plan and operate the new system. Since then, its name has become synonymous with the whole system (Gómez 2003). When the BRT system was implemented, the city was experiencing marked growth in private transportation, and public transportation was very disorganized, operated by a myriad of small and micro bus companies with more than 20,000 buses and minibuses. Average vehicle speed was between 12 km/h and 18 km/h (Gómez 2003).
5
Intermodal Connectivity to BRT: A Comparative Analysis of Bogotá and Curitiba
Figure 2. Integrated Transport Network of Curituba
Journal of Public Transportation, Vol. 15, No. 2, 2012
6
The first corridor came into operation in 2000. From the beginning, the system was planned to be a full BRT network, and the original plan foresaw 388 km of corridors and 4,500 buses, at a cost of US$5 million per kilometer (Duarte Carvajal 2009). At the time of writing, two of the network’s eight phases have been completed, and a third is under construction, corresponding to a total of 84 kilometers of segregated bus corridors, in which 1,290 articulated and bi-articulated buses circulate.
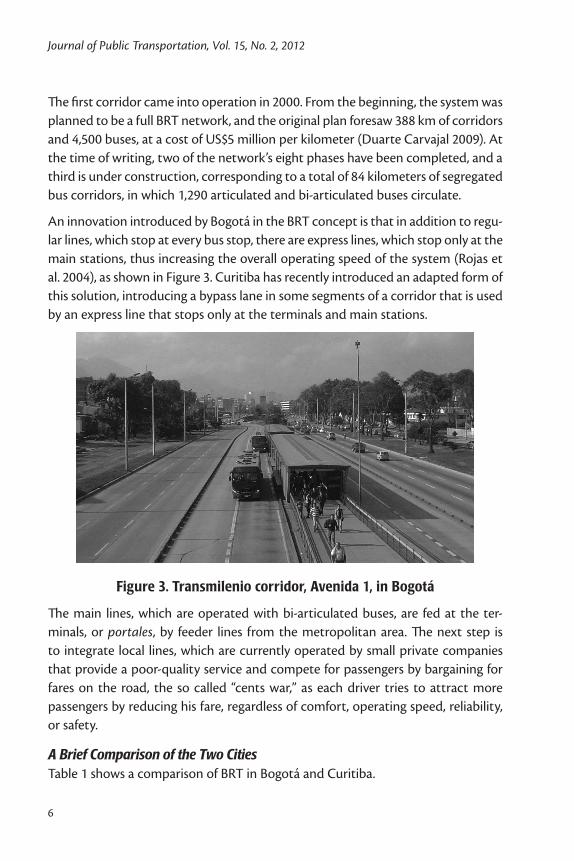
An innovation introduced by Bogotá in the BRT concept is that in addition to regu-lar lines, which stop at every bus stop, there are express lines, which stop only at the main stations, thus increasing the overall operating speed of the system (Rojas et al. 2004), as shown in Figure 3. Curitiba has recently introduced an adapted form of this solution, introducing a bypass lane in some segments of a corridor that is used by an express line that stops only at the terminals and main stations.
Figure 3. Transmilenio corridor, Avenida 1, in Bogotá
The main lines, which are operated with bi-articulated buses, are fed at the ter-minals, or portales, by feeder lines from the metropolitan area. The next step is to integrate local lines, which are currently operated by small private companies that provide a poor-quality service and compete for passengers by bargaining for fares on the road, the so called “cents war,” as each driver tries to attract more passengers by reducing his fare, regardless of comfort, operating speed, reliability, or safety.
A Brief Comparison of the Two CitiesTable 1 shows a comparison of BRT in Bogotá and Curitiba.
7
Intermodal Connectivity to BRT: A Comparative Analysis of Bogotá and Curitiba
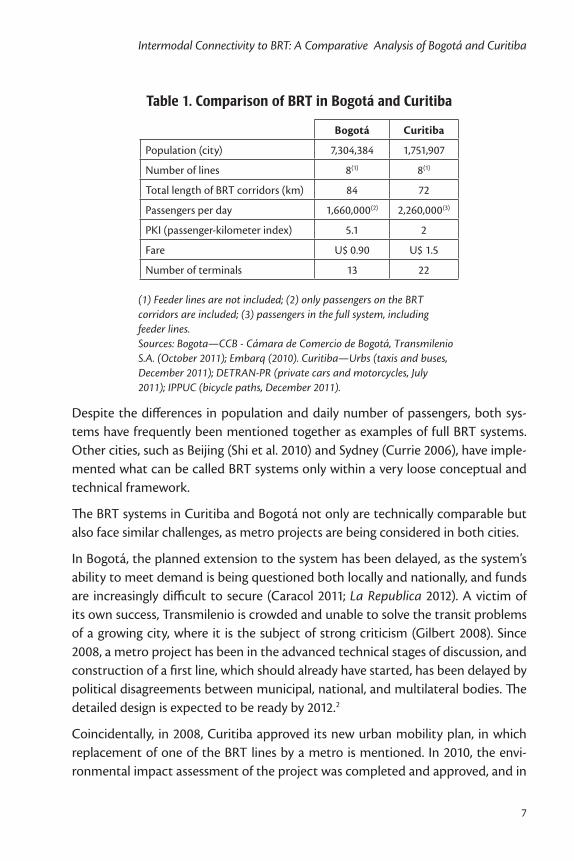
Table 1. Comparison of BRT in Bogotá and Curitiba
Bogotá Curitiba
Population (city) 7,304,384 1,751,907
Number of lines 8(1) 8(1)
Total length of BRT corridors (km) 84 72
Passengers per day 1,660,000(2) 2,260,000(3)
PKI (passenger-kilometer index) 5.1 2
Fare U$ 0.90 U$ 1.5
Number of terminals 13 22 (1) Feeder lines are not included; (2) only passengers on the BRT corridors are included; (3) passengers in the full system, including feeder lines. Sources: Bogota—CCB - Cámara de Comercio de Bogotá, Transmilenio S.A. (October 2011); Embarq (2010). Curitiba—Urbs (taxis and buses, December 2011); DETRAN-PR (private cars and motorcycles, July 2011); IPPUC (bicycle paths, December 2011).
Despite the differences in population and daily number of passengers, both sys-tems have frequently been mentioned together as examples of full BRT systems. Other cities, such as Beijing (Shi et al. 2010) and Sydney (Currie 2006), have imple-mented what can be called BRT systems only within a very loose conceptual and technical framework.
The BRT systems in Curitiba and Bogotá not only are technically comparable but also face similar challenges, as metro projects are being considered in both cities.
In Bogotá, the planned extension to the system has been delayed, as the system’s ability to meet demand is being questioned both locally and nationally, and funds are increasingly difficult to secure (Caracol 2011; La Republica 2012). A victim of its own success, Transmilenio is crowded and unable to solve the transit problems of a growing city, where it is the subject of strong criticism (Gilbert 2008). Since 2008, a metro project has been in the advanced technical stages of discussion, and construction of a first line, which should already have started, has been delayed by political disagreements between municipal, national, and multilateral bodies. The detailed design is expected to be ready by 2012.2
Coincidentally, in 2008, Curitiba approved its new urban mobility plan, in which replacement of one of the BRT lines by a metro is mentioned. In 2010, the envi-ronmental impact assessment of the project was completed and approved, and in
Journal of Public Transportation, Vol. 15, No. 2, 2012
8
2011, the municipality obtained federal funds for implementation of the first 14 km of the metro, to be built under the southern BRT corridor.3
Outside the BRT networkThe aim in this paper is to investigate whether, and how, other existing modes of transportation are addressed in the context of urban mobility in these cities. To this end, it is worth describing briefly the participation of other modes in daily trips in these cities. Table 2 summarizes the relevant data.
Table 2. Comparison of Urban Mobility in Bogotá and Curitiba
Bogotá Curitiba
Population (city) 7,304,384 1,751,907
Private cars, # 895,293 869,125
Price of gasoline (litres) U$1.30 U$1.30
Taxis, # 49,350 2,252
Flag drop $0.91 $2.2
Fare per kilometer $0.37 U$ 1.1
Motorcycles, # 163,757 112,417
Bicycles (km of bicycle paths) 316 140
Sources: Bogota—CCB–Cámara de Comercio de Bogotá; Transmilenio S. A (December 2011); Bogotá Transporte (taxis, March 2012). Curitiba—Urbs (taxis, March 2012); DETRAN-PR (private cars and motorcycles, July 2011); IPPUC (bicycle paths, December 2011).
In Bogotá, 58 percent of all daily trips are made by public transportation (10% use Transmilenio), while private cars are responsible for 14 percent, taxis 5 percent, and bicycles and pedestrians 17 percent (CCB 2007). Despite the fact that there are no regular or reliable data on modal share in Curitiba, it is possible that, based on a survey conducted by the National Public Transportation Association (ANTP 2009), buses are responsible for 36 percent of all trips in cities with more than 1 million inhabitants, private cars 28 percent, and bicycles less than 2 percent, while 33 per-cent of trips are made on foot. These numbers not only show the significant position public transportation occupies in both cities but also indicate that a multimodal approach is important to cater for the majority of the population, particularly mem-bers of the poorest segment, who depend on non-motorized modes for their com-plete journey, or at least a significant part of it. Multimodality is, therefore, essential in these two cities, as it is in several other cities in developing countries where there is even a modern public transportation system in place. BRT systems operate along
9
Intermodal Connectivity to BRT: A Comparative Analysis of Bogotá and Curitiba
main corridors, and other modes are needed to reach these corridors. Hence, it can be seen that a multimodal approach is beneficial for BRT projects.
BRT and Multimodality Passengers can access the BRT system in Bogotá and Curitiba through both bus stops and terminals. However, terminals are a key intermodal element to the BRT systems in both cities because this is where feeder routes connect passengers to other destinations outside the BRT network. For this reason, the terminals were taken as a proxy to analyze how well the BRT system in these two cities is integrated with other modes including bicycles, pedestrians, private automobiles, and taxis.
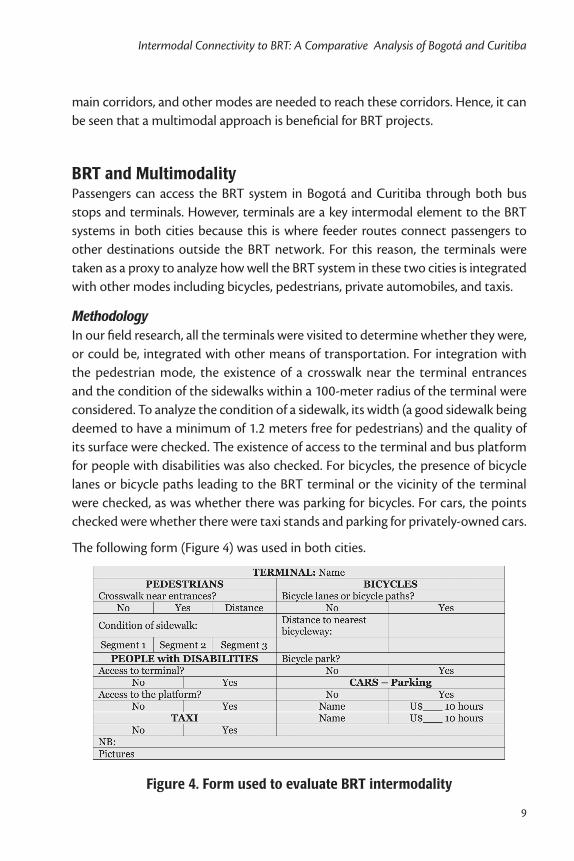
MethodologyIn our field research, all the terminals were visited to determine whether they were, or could be, integrated with other means of transportation. For integration with the pedestrian mode, the existence of a crosswalk near the terminal entrances and the condition of the sidewalks within a 100-meter radius of the terminal were considered. To analyze the condition of a sidewalk, its width (a good sidewalk being deemed to have a minimum of 1.2 meters free for pedestrians) and the quality of its surface were checked. The existence of access to the terminal and bus platform for people with disabilities was also checked. For bicycles, the presence of bicycle lanes or bicycle paths leading to the BRT terminal or the vicinity of the terminal were checked, as was whether there was parking for bicycles. For cars, the points checked were whether there were taxi stands and parking for privately-owned cars.
The following form (Figure 4) was used in both cities.
Figure 4. Form used to evaluate BRT intermodality
Journal of Public Transportation, Vol. 15, No. 2, 2012
10
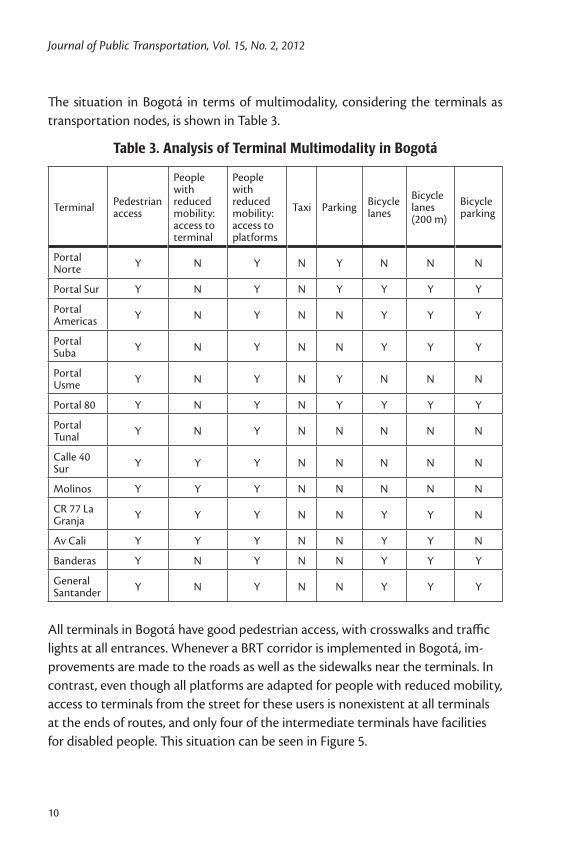
The situation in Bogotá in terms of multimodality, considering the terminals as transportation nodes, is shown in Table 3.
Table 3. Analysis of Terminal Multimodality in Bogotá
Terminal Pedestrian access
People with reduced mobility: access to terminal
People with reduced mobility: access to platforms
Taxi Parking Bicycle lanes
Bicycle lanes (200 m)
Bicycle parking
Portal Norte Y N Y N Y N N N
Portal Sur Y N Y N Y Y Y Y
Portal Americas Y N Y N N Y Y Y
Portal Suba Y N Y N N Y Y Y
Portal Usme Y N Y N Y N N N
Portal 80 Y N Y N Y Y Y Y
Portal Tunal Y N Y N N N N N
Calle 40 Sur Y Y Y N N N N N
Molinos Y Y Y N N N N N
CR 77 La Granja Y Y Y N N Y Y N
Av Cali Y Y Y N N Y Y N
Banderas Y N Y N N Y Y Y
General Santander Y N Y N N Y Y Y
All terminals in Bogotá have good pedestrian access, with crosswalks and traffic lights at all entrances. Whenever a BRT corridor is implemented in Bogotá, im-provements are made to the roads as well as the sidewalks near the terminals. In contrast, even though all platforms are adapted for people with reduced mobility, access to terminals from the street for these users is nonexistent at all terminals at the ends of routes, and only four of the intermediate terminals have facilities for disabled people. This situation can be seen in Figure 5.
11
Intermodal Connectivity to BRT: A Comparative Analysis of Bogotá and Curitiba
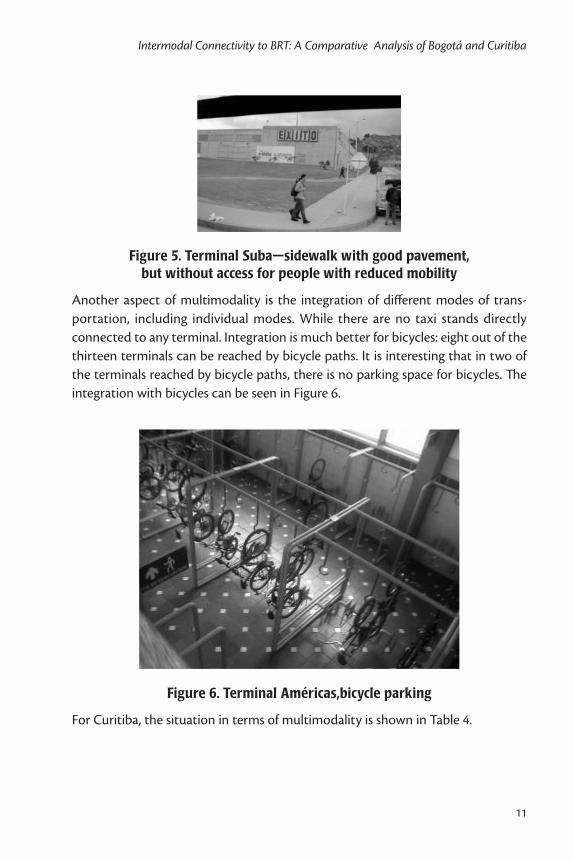
Figure 5. Terminal Suba—sidewalk with good pavement, but without access for people with reduced mobility
Another aspect of multimodality is the integration of different modes of trans-portation, including individual modes. While there are no taxi stands directly connected to any terminal. Integration is much better for bicycles: eight out of the thirteen terminals can be reached by bicycle paths. It is interesting that in two of the terminals reached by bicycle paths, there is no parking space for bicycles. The integration with bicycles can be seen in Figure 6.
Figure 6. Terminal Américas,bicycle parking
For Curitiba, the situation in terms of multimodality is shown in Table 4.
Journal of Public Transportation, Vol. 15, No. 2, 2012
12
Table 4. Analysis of Terminal Multimodality in Curitiba
Terminal Pedestrian access
People with reduced mobility: access to terminal
People with reduced mobility: access to platforms
Taxi Parking Bicycle lanes
Bicycle lanes (200 m)
Bicycle parking
Campina do Siqueira partial partial Y Y N Y Y N
Campo Comprido Y Y Y Y N Y N N
Capão Raso Y Y Y Y N N Y N
Carmo Y Y Y Y Y Y N Y
Centenário N N Y Y N N N N
CIC partial Y Y N Y N Y N
Fazendinha Y Y Y Y N N Y N
Hauer partial Y Y Y N N Y N
Oficinas N N Y N N N N N
Pinheirinho Y Y N Y N Y Y N
Pinhais Y Y Y Y Y N N Y
Potão N N Y N N N N N
Santa Cândida Y Y Y Y N N N N
Sitio Cercado Y partial partial N N N N N
Capão da Imbuia N N Y N N Y Y N
Boa Vista N N Y Y N N Y N
Boqueirão Y Y Y Y Y N N N
Cabral Y Y Y Y N N N N
Caiuá N partial Y N N N N N
Santa Felicidade Y/irregular Y Y Y N N N N
Barreirinha Y Y Y N N N N N
Bairro Alto N partial Y N N Y N N
Only 55 percent of terminals in Curitiba have pedestrian-friendly access. In some cases, the access was considered to be only partial because of the poor quality of the sidewalks and the absence of disability ramps. Only one terminal is not adapted
13
Intermodal Connectivity to BRT: A Comparative Analysis of Bogotá and Curitiba
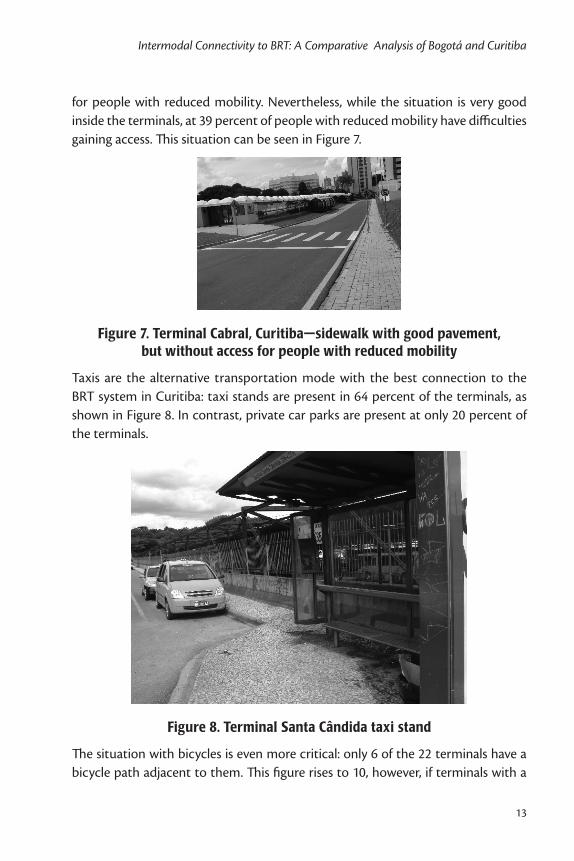
for people with reduced mobility. Nevertheless, while the situation is very good inside the terminals, at 39 percent of people with reduced mobility have difficulties gaining access. This situation can be seen in Figure 7.
Figure 7. Terminal Cabral, Curitiba—sidewalk with good pavement, but without access for people with reduced mobility
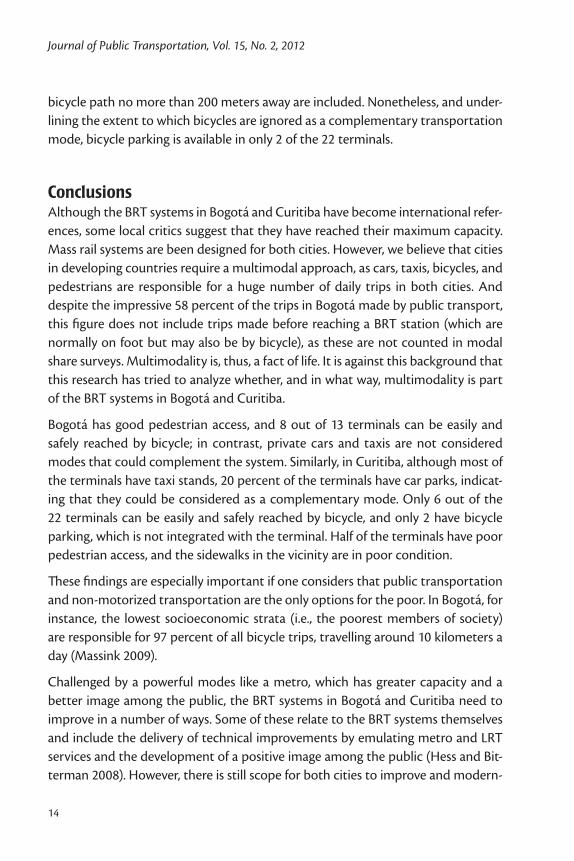
Taxis are the alternative transportation mode with the best connection to the BRT system in Curitiba: taxi stands are present in 64 percent of the terminals, as shown in Figure 8. In contrast, private car parks are present at only 20 percent of the terminals.
Figure 8. Terminal Santa Cândida taxi stand
The situation with bicycles is even more critical: only 6 of the 22 terminals have a bicycle path adjacent to them. This figure rises to 10, however, if terminals with a
Journal of Public Transportation, Vol. 15, No. 2, 2012
14
bicycle path no more than 200 meters away are included. Nonetheless, and under-lining the extent to which bicycles are ignored as a complementary transportation mode, bicycle parking is available in only 2 of the 22 terminals.
ConclusionsAlthough the BRT systems in Bogotá and Curitiba have become international refer-ences, some local critics suggest that they have reached their maximum capacity. Mass rail systems are been designed for both cities. However, we believe that cities in developing countries require a multimodal approach, as cars, taxis, bicycles, and pedestrians are responsible for a huge number of daily trips in both cities. And despite the impressive 58 percent of the trips in Bogotá made by public transport, this figure does not include trips made before reaching a BRT station (which are normally on foot but may also be by bicycle), as these are not counted in modal share surveys. Multimodality is, thus, a fact of life. It is against this background that this research has tried to analyze whether, and in what way, multimodality is part of the BRT systems in Bogotá and Curitiba.
Bogotá has good pedestrian access, and 8 out of 13 terminals can be easily and safely reached by bicycle; in contrast, private cars and taxis are not considered modes that could complement the system. Similarly, in Curitiba, although most of the terminals have taxi stands, 20 percent of the terminals have car parks, indicat-ing that they could be considered as a complementary mode. Only 6 out of the 22 terminals can be easily and safely reached by bicycle, and only 2 have bicycle parking, which is not integrated with the terminal. Half of the terminals have poor pedestrian access, and the sidewalks in the vicinity are in poor condition.
These findings are especially important if one considers that public transportation and non-motorized transportation are the only options for the poor. In Bogotá, for instance, the lowest socioeconomic strata (i.e., the poorest members of society) are responsible for 97 percent of all bicycle trips, travelling around 10 kilometers a day (Massink 2009).
Challenged by a powerful modes like a metro, which has greater capacity and a better image among the public, the BRT systems in Bogotá and Curitiba need to improve in a number of ways. Some of these relate to the BRT systems themselves and include the delivery of technical improvements by emulating metro and LRT services and the development of a positive image among the public (Hess and Bit-terman 2008). However, there is still scope for both cities to improve and modern-
15
Intermodal Connectivity to BRT: A Comparative Analysis of Bogotá and Curitiba
ize their BRT systems by enhancing their interaction with other modes. Pedestrians and cyclists are obviously the main target because they are users of non-motorized modes.
In November 2011, Bogotá inaugurated a public bicycle-sharing program called BiciBog, the pilot project of which operated near Transmilenio stations so that bicycles could feed into the BRT system. Likewise, Curitiba plans to issue an invi-tation to tender for a Bicycle Plan in 2012. With regard to taxis and private cars, improved intermodality with these forms of transport offers several advantages. First, by providing taxi stands and car parks, park-and-ride schemes can be stimu-lated. Second, as the number of cars increases and the shortage of parking spaces in cities central areas in particular becomes more acute, new car parks could provide BRT operators with a source of revenue that could be reinvested in the BRT system.
This paper has endeavored to show that the multimodality that is important for daily trips in both Bogotá and Curitiba is not currently part of these successful BRT systems but could become part of them.
Endnotes1 For more information about the Green Line, see http://www.urbs.curitiba.pr.gov.br/PORTAL/noticias/index.php?cod=217.
2 See the official website at http://www.metroenbogota.com/category/movilidad-bogota/metro-de-bogota.
3 See the official website at http://www.metro.curitiba.pr.gov.br.
Acknowledgments
The authors would like to thank Wesley Medeiros (PUCPR, Curitiba) and Juan Manuel Restrepo (PUJ, Bogota), both undergraduate students, for their help. This research was partially funded by the Brazilian National Council for Research (CNPq) and Fundação Araucária.
References
ANTP—Associação Nacional dos Transportes Públicos. 2009. Relatório Geral da Mobilidade Urbana. São Paulo, ANTP.
Journal of Public Transportation, Vol. 15, No. 2, 2012
16
Ardila, G. A. 2004. Transit planning in Curitiba and Bogotá. Roles in interaction, risk, and change. Ph.D. thesis, Department of Urban Studies and Planning, Massa-chusetts Institute of Technology.
Caracol. 2011. Desde 2009 Caracol Radio denunció retrasos en las obras de Trans-milenio en Soacha. Radio Caracol. 21 de Julio.
CCB—Cámara de Comercio de Bogotá. 2007. Observatorio de movilidad de Bogotá y la región. Technical report, Camara de Comercio de Bogotá.
Currie, G. 2006. Bus Rapid Transit in Australasia: Performance, lessons learned and futures. Journal of Public Transportation, BRT Special Edition: 1-22.
DETRAN-PR. 2011. Estatisticas de Trânsito—Frota de veículos por Tipo e Município 2011. Available at http://www.detran.pr.gov.br/modules/conteudo/conteudo.php?conteudo=311.
Duarte Carvajal, E. 2009. Una visión de transporte urbano sostenible en Colombia. Bogota, Universidad Nacional de Colombia.
Duarte, F., R. Firmino, and O. Prestes. 2011. Learning from failures: Avoiding asym-metrical views of public transportation initiatives in Curitiba. Journal of Urban Technology 18(3): 81–100.
Embarq. Modernizing public transportation. World Resources Institute, Washing-ton, 2010.
Gilbert, A. 2008. Bus Rapid Transit: Is Transmilenio a miracle cure? Transport Reviews 28(4): 439–467.
Gomez, J. 2003. TransMilenio: La Joya de Bogotá. Bogotá: TransMilenio S.A..
Hagen, J. 2009. The future is on the surface: Curitiba opens the green line. Sus-tainable Transport 21: 32–24. Available at: http://www.itdp.org/documents/st_magazine/itdp-sustran-20100101.pdf
Hess, D., and A. Bitterman. 2008. Bus Rapid Transit identity: An overview of current “branding” practice. Journal of Public Transportation 11(2): 19–42.
IPPUC. 2011. Mapa temático – Ciclovias. Available at http://ippucweb.ippuc.org.br/ippucweb/sasi/home/visualizar.php?doc=../arquivos/documentos/D87/D87_002_BR.pdf
ITDP. 2007. Bus Rapid Transit Planning Guide. New York: Institute for Transporta-tion & Development Policy.
17
Intermodal Connectivity to BRT: A Comparative Analysis of Bogotá and Curitiba
La Republica. 2012. Nuevos retrasos de la Fase III de Transmilenio: Estación Museo Nacional, lista en 2013. La República, 23 de Febrero.
Lindau, L., D. Hidalgo, and D. Facchini. 2010. Curitiba, the cradle of Bus Rapid Tran-sit. Built Environment 36(3): 274–282.
LTA Academy. 2011. Passenger transport mode shares in world cities journeys: Shar-ing urban transport solutions. Issue 7, November: 60-70. Available at http://ltaacademy.gov.sg/doc/JOURNEYS_Nov2011.pdf
Massink, R. 2009. Estimating the climate value of bicycling in Bogotá, Colombia, using a shadow pricing methodology. Master’s thesis, University of Twente and Universidad de los Andes. Available at: http://essay.utwente.nl/59405/1/scriptie_R_Massink.pdf
Metrô. 2007. Pesquisa Origem-Destino. Available at http://www.nossasaopaulo.org.br/observatorio/regioes.php?regiao=33&tema=13&indicador=115
Rathwell, S., and S. Schijns. 2002. Ottawa and Brisbane: Comparing a mature bus-way system with its state-of-the-art progeny. Journal of Public Transportation 5(2): 162–182. Available at http://www.gobrt.org/Journal_of_Public_Trans-port_BRT_Issue.pdf#page=8
Rickert, T. 2010. Technical and operational challenges to inclusive Bus Rapid Transit: A guide for practitioners. World Bank, Washington.
Rio de Janeiro. 2004. Plano Diretor de Transporte Urbano da Região Metropolitana do Estado do Rio de Janeiro. Rio de Janeiro, Governo do Estado do Rio de Janeiro.
Rojas, F., J. D. Estrada, D. A. Rezende, and C. M. Garcias. 2004. Planeación, gestión y administración exitosa de un proyecto urbano: Transmilenio, el caso del sistema de transporte público de Bogotá. In: Xxxix Asamblea Anual de Cla-dea (Consejo Latinoamericano de Escuelas de Administración), Puerto Plata (República Dominicana). Anais… Puerto Plata: CLADEA.
Shi, J., Z. Wu, and J. Jin. 2011. Reform Beijing to a public transit oriented city – From the view of transportation equity. Journal of Advanced Transportation 45(2): 96–106.
Sperling, D., and E. Claussen. 2004. Motorizing the developing world. Access 24, Spring: 10–15.
Journal of Public Transportation, Vol. 15, No. 2, 2012
18
UN-Habitat. 2010. Urban researchers roundtable: Bridging the urban transport divide, 24 March. Available at http://greenmobility.wordpress.com/2010/03/12/world-urban-forum-5
Urbs—Urbanização Curitiba S.A. 2012. Informativo do serviço de táxi. http://www.urbs.curitiba.pr.gov.br/PORTAL/taxi/InformativoTarifa.pdf
Vincent, W., and L. Jerram. 2006. The potential for Bus Rapid Transit to reduce transportation-related CO2 emissions. Journal of Public Transportation, BRT Special Edition: 219–237.
Wright, L. and L. Fulton. 2005. Climate change mitigation and transport in develop-ing nations. Transport Reviews 25(6): 691–717.
Xu, K. 2004. Bus Rapid Transit (BRT) development in China: Challenges and prog-ress. International Mayors Forum, November 10–11. Available at www.gobrt.org/China_Conference-12-2004-MF_BriefingBook_EN.pdf#page=151
About the Authors
Fábio Duarte ([email protected]) and Fernando Rojas ([email protected]) are with the Pontifícia Universidade Católica do Paraná, Curitiba, Brazil.

![[A4] XIAOMEI_Guangzhou BRT and New BRT in China - Ed](https://static.documents.pub/doc/80x56/577ce47b1a28abf1038e73a0/a4-xiaomeiguangzhou-brt-and-new-brt-in-china-ed.jpg)


