INTERNATIONAL CONVENTION AND EXHIBITION CENTRE FEASIBILITY STUDY Prepared for Auckland City Council July 2009 CONSULTANTS TO THE HOTEL, TOURISM & LEISURE INDUSTRIES A member of Horwath International prepared in conjunction with
Transcript
INTERNATIONAL CONVENTION AND EXHIBITION CENTRE
FEASIBILITY STUDY
Prepared for Auckland City Council
July 2009
CONSULTANTS TO THE HOTEL, TOURISM & LEISURE INDUSTRIES A member of Horwath International
prepared in conjunction with
International Convention and Exhibition Centre – Feasibility Study Page 2 Auckland City Council July 2009
CONTENTS
1. INTRODUCTION AND EXECUTIVE SUMMARY 3
2. HISTORICAL CONFERENCE ACTIVITY 18
3. CURRENT AND EXPECTED FUTURE MARKET TRENDS 40
4. NEW ZEALAND’S COMPETITIVE POSITION 50
5. SITE SELECTION CRITERIA AND LOCATION ANALYSIS 54
10. PUBLIC / PRIVATE OWNERSHIP, GOVERNANCE, OPERATIONS 91 APPENDICES
1A. BENEFIT-COST CALCULATIONS 96
1B. TECHNICAL DETAIL OF THE NZIER MODEL 102
2. INTERNATIONAL PCO SURVEY 107
3. FEEDBACK FROM THE CONFERENCE COMPANY CLIENTS 125
4. INTERNATIONAL BAR ASSOCIATION CONVENTION NOTES 127
5. NEW ZEALAND VENUE COMPARISON 131
6. ASIA PACIFIC INTERNATIONAL CONVENTION AND EXHIBITION CENTRES 134
7. INTERNATIONAL ASSOCIATION CONFERENCES WITH NZ CONTACT 135
8. INTERVIEWEES / INFORMATION SOURCES 136
International Convention and Exhibition Centre – Feasibility Study Page 3 Auckland City Council July 2009
1. INTRODUCTION AND EXECUTIVE SUMMARY
1.1 BACKGROUND A Reference Group has been formed to oversee this feasibility study. The Reference Group comprises:
� Auckland City Council (John Duthie, General Manager, City Development)
� Ministry of Tourism (Ray Salter, General Manager)
� Ministry of Economic Development (Louise Marra, Director, Government Urban and Economic Development Office)
� Conventions and Incentives New Zealand (John Duncan, Chair).
The project has been managed on behalf of the Reference Group by:
� Auckland City Council (Gareth Stiven, Group Manager Economic Development)
� Ministry of Economic Development (Jami Williams, Chief Advisor, and Tariq Ashraf, Senior Policy Analyst, Government Urban and Economic Development Office).
1.2 SCOPE OF WORK AND APPROACH The agreed scope of work and approach is documented in the engagement letter from Auckland City, dated 30 April 2009, which is based on the Request for Quotations letter dated 14 April 2009, our letter dated 20 April 2009 and e-mail dated 22 April 2009. The scope of work and approach is as follows:
� conducting a robust assessment of the market for the proposed international convention and exhibition centre. This has involved:
o an assessment of economic climate and market. This has included conducting discussions with CINZ, leading convention centres and PCOs in New Zealand and Australia on current trends in conference activity with specific focus on the Asia / Pacific region; and undertaking a review of the ICCA database of the international convention centre activity concerning past “shocks” and the recovery
o an environmental considerations assessment concerning convention activity, convention centre design and market assessment. This has included conducting discussions and securing relevant sustainability information from MCI and global organisations such as Green Meetings Industry Council, Convention Industry Council based in the US, Green Globe Standards. From within New Zealand we have obtained
International Convention and Exhibition Centre – Feasibility Study Page 4 Auckland City Council July 2009
information from CINZ’s “Sustainability Action Group”. This has also addressed the impact of the pressure to reduce ‘carbon miles’ and any subsequent demand impacts
o an assessment of the impact on the market of changing technology. This has included conducting discussions with CINZ, leading convention centres and PCOs in New Zealand and Australia regarding current trends in:
� impact of communications and marketing (eg: social networks) on buyer behaviour and convention delegate attendance numbers
� impact of immersive telepresence on conference content and convention centre infrastructure / technology requirements
� impact of conference-related trade exhibitions on conference economics and convention centre design and functionality requirements
� impact of Awards programmes on delegate / accompanying person attendance and convention centre design and functionality requirements
� impact of ever-changing AV requirements (and supply-led development of technology capability) on convention centre design and functionality requirements
� trends in delegate / conference organiser adaptability to (or lack of) technology / gimmicks
� completing an economic impact assessment on the Auckland and New Zealand economies including sensitivity analysis. This work has involved:
o a review of existing data prepared from earlier studies of the convention centre options; amending the data in light of changes in projected visitor numbers or expenditure; modifications resulting from the peer review (undertaken by Covec); and conceptual differences required for use in the next stage
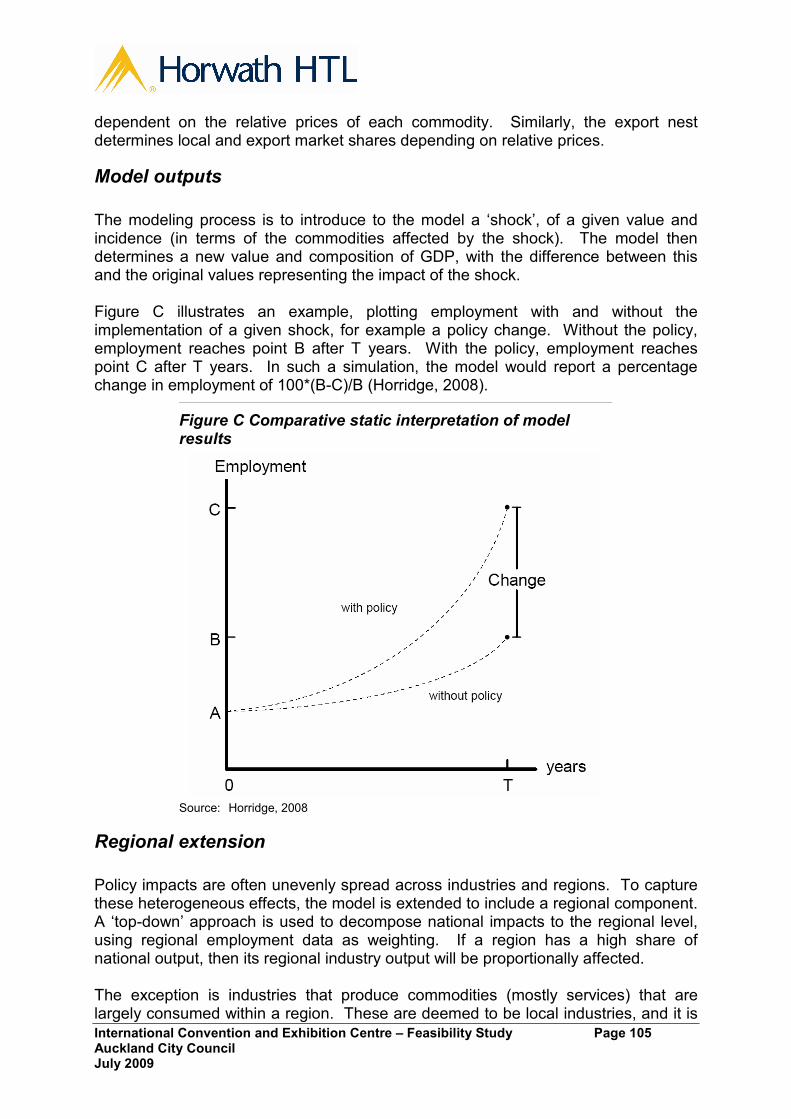
o putting the direct economic impacts into the NZIER CGE model as an external ‘shock’. The NZIER CGE model has a base run showing economic aggregates based on current economic forecasts. The resulting model outputs have been compared to the base run, with the differences representing the economy-wide impacts, in aggregate and by main component of economic activity
o modelling a number of scenarios based on medium, high and low visitation rates and up to three convention centre options. The estimates from the model are of the national impact and also estimate regional direct and indirect impacts within the outputs of the national model (ie: the distribution of impacts between Auckland and other regions, including direct impacts arising from pre- and post- conference touring and satellite conferences)
� completing a cost benefit analysis that addresses ‘non-economic’ factors:
International Convention and Exhibition Centre – Feasibility Study Page 5 Auckland City Council July 2009
o building on the economic impact analysis, applying a suitable discount rate to the time profile of costs of the convention centre (both investment and any other costs such as rates subsidies) and direct economic impacts (and total), to estimate the Net Present Value of a centre
o undertaking a review of the existing assessment of these, and any equivalent studies abroad, with a view to refining the assessment and if possible, forming a view as to the ‘order of magnitude’ importance of each of these
� identifying facility requirements and specifications including dimensions such as footprint and total gross floor area:
o undertaking a review of previous architectural work, IAPCO convention centre design / space criteria, updating criteria where required or justified and determining GFA requirements taking into account recent / emerging trends, New Zealand’s competitive position in the international market, critical success factors for competitive international convention centres, relationship with site and surrounding area / buildings / supporting infrastructure / services, etc
� confirming the criteria for site selection, and assessing the high-level viability of a few sites against these criteria. The approach has involved:
o working with members of the consulting team to review, update, modify and confirm the site selection criteria, including weightings of criteria
o obtaining approval from client on the selection criteria and weightings
o undertaking an independent assessment of scoring the different sites against each criterion with supporting rationale for scoring each criterion
o providing results of site assessment and conduct discussions with the client prior to including into the feasibility study
� identifying examples of successful ownership models that could be applicable for Auckland, including analysis of the governance arrangements, management and operational arrangements and upfront and ongoing finance and funding arrangements. This has included utilising our networks to identify:
o the most relevant “best practice” examples of convention centre developments and operations (to the New Zealand context) in Australia, UK, Europe, USA, South America and Asia
o relevant information in relation to the most relevant examples, from an owner operator perspective.
In the short time available we have undertaken the following key steps to achieving the scope of work:
� reviewed existing available research regarding conference demand in New Zealand and the need for / opportunity for new conference facilities, including a review of Committee for Auckland’s previous research
International Convention and Exhibition Centre – Feasibility Study Page 6 Auckland City Council July 2009
� interviewed key conference industry stakeholder representatives including:
o Conventions and Incentives New Zealand (“CINZ”)
o THE EDGE®
o SKYCITY Entertainment Group
o Tourism Auckland
o The Conference Company Ltd
� contacted a conference industry consultant in Australia to assist in information about trends in international conferences
� additional research as required to address the objectives outlined above, including:
o updated general trends in the global convention market, from the ICCA conventions database
o assessed the exhibition space requirements of international conventions
o reviewed the business case submissions made to the Christchurch City Council regarding the proposed significant expansion of the Christchurch Convention Centre.
1.3 DISCLAIMER This report and the projections included in it have been prepared on the specific instruction of the reference group. Neither the report nor its contents, nor any reference to our firm may be included or quoted in any document without the prior written consent of Horwath HTL Ltd. This report is based on estimates, assumptions and other information available to us, the sources of which are stated in the appropriate sections of the report. We did not carry out an audit or verification of the information supplied to us during the engagement, except to the extent stated in this report. We advise that the projections and forward looking statements presented in this report are based on estimates and assumptions which are inherently subject to uncertainty and variation depending upon certain evolving events. Accordingly, we do not present the projections as results which actually will be achieved. Actual results achieved may vary from the projections and the variation may be material. Horwath HTL Ltd assumes no responsibility whatsoever in respect or, or arising out of, or in connection with the contents of this report to parties other than the reference group. If any other parties choose to rely in any way on any advice provided by Horwath HTL Ltd to you, even with our approval, they do so entirely at their own risk.
International Convention and Exhibition Centre – Feasibility Study Page 7 Auckland City Council July 2009
1.4 EXECUTIVE SUMMARY
The primary rationale for developing a new international convention and exhibition centre for Auckland is to substantially improve New Zealand’s capability for hosting medium to large-scale international conferences and related exhibitions / tradeshows. This involves winning such conferences over competing countries (especially Australia) and hosting them with the minimum of compromises. New Zealand has some capability for hosting small to medium sized international conferences at present, and New Zealand has hosted some reasonably large international conferences in the past. However, we are facing increasingly significant constraints and competitive disadvantages when compared to international facilities and locations, especially when compared to our closest competitor, Australia. The key target conferences where New Zealand does not currently have good competitiveness is in international association (ie: non-corporate entity) conferences of over 1,000 delegates. Historical Conference Activity There has been substantial growth reported in the number of larger international association conferences held annually in the period 1999 – 2008, with the strongest growth being in meetings of 1,000 – 2,000 delegates (6.7% per annum Compound Annual Growth Rate (CAGR)), where New Zealand currently does not have strong capability. The rate of growth has also been strong in the largest conferences, although the total number of such conferences is smaller. There has been no trend of reduction in the number of conferences in any size category during the period. There has been stronger growth in international association conferences hosted in the Asia / Middle East / Pacific region during the period 1999 – 2008, only interrupted by the outbreak of SARS in the region in 2003. The data shows that New Zealand achieved a CAGR (between 1999 and 2008) of 6.3% (above Australia at 2.9%). Figure 1.1 summarises the performance of New Zealand in the context of Australasia, Asia / Middle East / Pacific region and the World. The 38 conferences held in New Zealand in 2008 represent a share of 0.5% of total conferences. These conferences had an average size of 467 delegates compared to the world average of 638 delegates.1
1 The average size of conferences reported has fallen mainly as a result of in increase in the number of smaller conferences reported by new / additional hotel venues.
International Convention and Exhibition Centre – Feasibility Study Page 8 Auckland City Council July 2009
Figure 1.1: New Zealand’s Share of International Association Conferences – 1999, 2008
The data indicates that New Zealand has “punched above its weight” in terms of winning international association conferences within the Australasian and world markets over the past decade, even with limitations of facilities. This can partly be attributed to the Christchurch Convention Centre (which opened in 1997) and SKYCITY Auckland Convention Centre (which opened in 2004) becoming established in the international market, and improved marketing and targeting of international conventions by Conventions and Incentives New Zealand in conjunction with the leading venues and regional convention beaureus. In addition to these regional and international conferences, New Zealand taps into the Australian ‘domestic’ market for association conferences – ie: those conferences normally hosted only in Australia but which come to New Zealand on occasion. These conferences do not meet the ICCA criteria of international association conferences. Australian corporate conferences (as well as corporate conferences from further afield, to a lesser extent) are also a target for the New Zealand conference industry.
The strong growth in international conference activity in the Asia / Middle East / Pacific region has partly been stimulated by the substantial growth in large-scale convention and exhibition centre developed in Asia and Australia during the past 10 – 15 years. The schedule identifies the date of opening, and (where applicable) expansion of the facilities. This confirms a significant expansion in convention centre supply, and an even greater expansion in exhibition space. Many of the Asian facilities have been developed as icons of national pride for hosting regional and international inter-governmental meetings and conferences. Hosting large-scale regular trade shows has also been a significant driver of the expansion of exhibition facilities.
New Zealand (not to scale)
Australasia (not to scale)
Asia / ME / Pacific (not to scale)
1999 2008 Number 22 38 % of Australasia 13.5% 17.3% Growth (10 yrs) +73% Average Size 269 467 (Refer to Table 2.1 for annual growth)
1999 2008 Number 857 1,612 % of World 19.4% 21.6% Growth (10 yrs) +88% Average Length 4.5 4.0 Average Size 659 599 (Refer to Table 2.1 for annual growth)
1999 2008 Number 163 220 % of Asia/ME/Pac 19.0% 13.6% Growth (10 yrs) +35% Average Size 665 521 (Refer to Table 2.1 for annual growth)
World
1999 2008 Number 4,424 7,475 Growth (10 yrs) +69% Average Length 4.4 3.9 Average Size 722 638
International Convention and Exhibition Centre – Feasibility Study Page 9 Auckland City Council July 2009
In the case of Australia, a significant factor in the development and expansion of facilities has been driving economic impact at a state level. Therefore, winning national conferences and exhibitions (which attract inter-state conference delegates) is important, as well as winning international conferences and exhibitions, for many of the Australian venues. Current and Expected Future Market Trends Sustainability has become a key focus in the international (and local) conference industry largely because of increased awareness and concern of consumers regarding the ‘carbon footprint’ of travel. This may become an increasingly significant factor in conference buyers considering the choice of destination for international conferences in the future, responding to the views and perceptions of conference delegates. This presents a risk to New Zealand (and Australia) in terms of marketing to and winning international conventions, assuming environmental concerns continue to be ‘top of mind’ to the consumer, although the risk is less in relation to domestic, Australasian and Asia / Pacific conferences. Australasian destinations may become proportionately less favourable over time than if there were no environmental concerns. It is unlikely, however, that distance will become the critical decision factor in the choice of location, even if it is still one factor, for most international conferences, although it may become a critical decision factor in the choice of location for international conferences2. There is no particular reason why convention delegate arrivals to New Zealand would be worse affected than leisure visits from international visitors. Arguably, leisure travel is more of a ‘luxury’ and discretionary nature and therefore less ‘justifiable’ than international conference attendance. For example, it will always be important for professional training and development for doctors to attend medical conferences, the largest international association conference segment.
Improved video conferencing technology provides both risks and benefits for the conference industry. The risks are around the potential for substitution of video conferencing for travel to meetings and conferences. To the extent that this risk is real, it is more significant in relation to corporate meetings of short duration (eg: part or full day meetings) rather than multi-day conferences, and generally in relation to smaller groups rather than larger groups. It is unlikely that video conferencing is a practical alternative to multi-day international association meetings and conferences. The benefits of improving communication and video conferencing relate to the increased ability to have expert input from a wider range of presenters (including
2 Alan Trotter, CEO, Conventions and Incentives New Zealand
International Convention and Exhibition Centre – Feasibility Study Page 10 Auckland City Council July 2009
keynote presenters) by video link as a substitute to their attendance in person. This allows greater flexibility, richness and depth in conference content, and greater cost efficiency.
Evolving communication technologies provide both risks and opportunities for the conference industry. The risks involve increasing use of the internet and other on-line forums for communicating and sharing information and ideas globally. There is the potential that increased sharing of information, ideas and thought leadership through increasingly effective and cost-effective technology solutions could reduce the degree of reliance of some organisations (both corporate entities and associations) on face-to-face meetings and conferences, and therefore result in fewer conferences than might otherwise be the case. Similarly, such communication channels may mean that conference delegates could be more challenging to attract, and delegate numbers be more difficult to achieve than previously. The benefits of evolving communication technology for international conferences relate to marketing opportunities. New Zealand’s Competitive Position New Zealand’s competitive position is currently compromised by the fact that three of our largest venues (THE EDGE®, Wellington Convention Centre and Christchurch Convention Centre) are all multi-purpose venues that rely on arts-focused spaces to provide them with the critical scale. Furthermore, for conferences of any significant size (eg: 600 delegates plus) that require exhibition space, it is necessary to have delegates moving between multiple buildings. These current arrangements mean that from a pure physical facility perspective, New Zealand is becoming an increasingly uncompetitive destination, particularly as cities in Australia and Asia continue to upgrade and expand their facilities. Despite this, New Zealand is continuing to attract a small number of international conferences. This can partly be attributed to the increased marketing effort that is being applied (eg: the Ministry of Tourism-funded Conference Assistance Programme operated by Conventions and Incentives New Zealand). In a general sense, therefore, New Zealand’s key current weaknesses relate to venue scale, quality, and functionality while the country’s key strengths relate to its destination appeal and support infrastructure. There are a number of specific opportunities that New Zealand can leverage in order to optimise the outcomes from developing an international standard convention centre. Key opportunities include:
International Convention and Exhibition Centre – Feasibility Study Page 11 Auckland City Council July 2009
� 100% Pure New Zealand marketing campaign and brand recognition
� targeting international conferences hosted in Australia
� development of a distinctive venue that showcases New Zealand In seeking to increase New Zealand’s share of the international conference market, it is important to acknowledge key challenges that New Zealand will need to overcome, including:
� New Zealand is a long-haul destination – “carbon miles” implications, “wash down” factor
� the emerging tendency for conference venues and / or destinations to “buy” conferences.
Site selection criteria and location analysis Proximity to a critical mass of appropriate standard hotel rooms is regarded as the single most important attribute due to the convenience this provides conference organisers and delegates. Based on the location attributes identified above, a CBD location is the most obvious and advantageous option for an international convention centre. This is primarily because the CBD is the only precinct that provides the critical mass of appropriate accommodation to support the centre’s operation. Furthermore, existing transport links and infrastructure have been designed to primarily service the CBD area, and the CBD has the greatest concentration of existing meetings infrastructure and entertainment facilities. Scale We have undertaken interviews with key “buyer” and “seller” representatives in New Zealand and the leading Auckland venues3 regarding the optimal scale of convention centre. The clear view is that the larger of three facility size scenarios (27,000 m2 GFA) should be regarded as the optimum on the basis that:
� it provides much clearer incremental capability to any existing or planned conference facilities in New Zealand
� it is more clearly competitive with the ever-expanding capacities and capabilities of the Australian and Asian venues
� it provides the highest degree of flexibility and convenient and effective ‘flow’ while minimising compromises
� it provides the highest degree of ‘future proofing’
3 Conventions & Incentives New Zealand (including IAEG-funded CAP programme); Tourism Auckland (including Business Events team); SkyCity Entertainment Group; THE EDGE
®
International Convention and Exhibition Centre – Feasibility Study Page 12 Auckland City Council July 2009
� it provides the greatest future potential for generating maximum venue operational cashflows through maximising event numbers and utilisation.
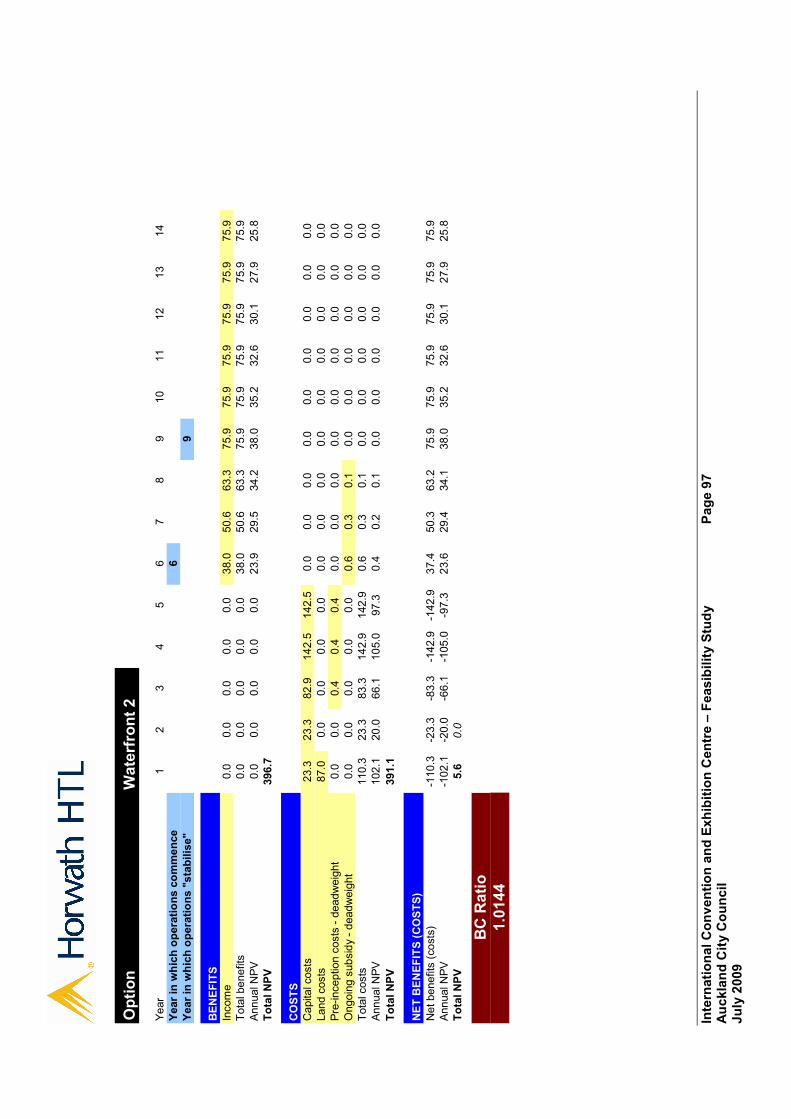
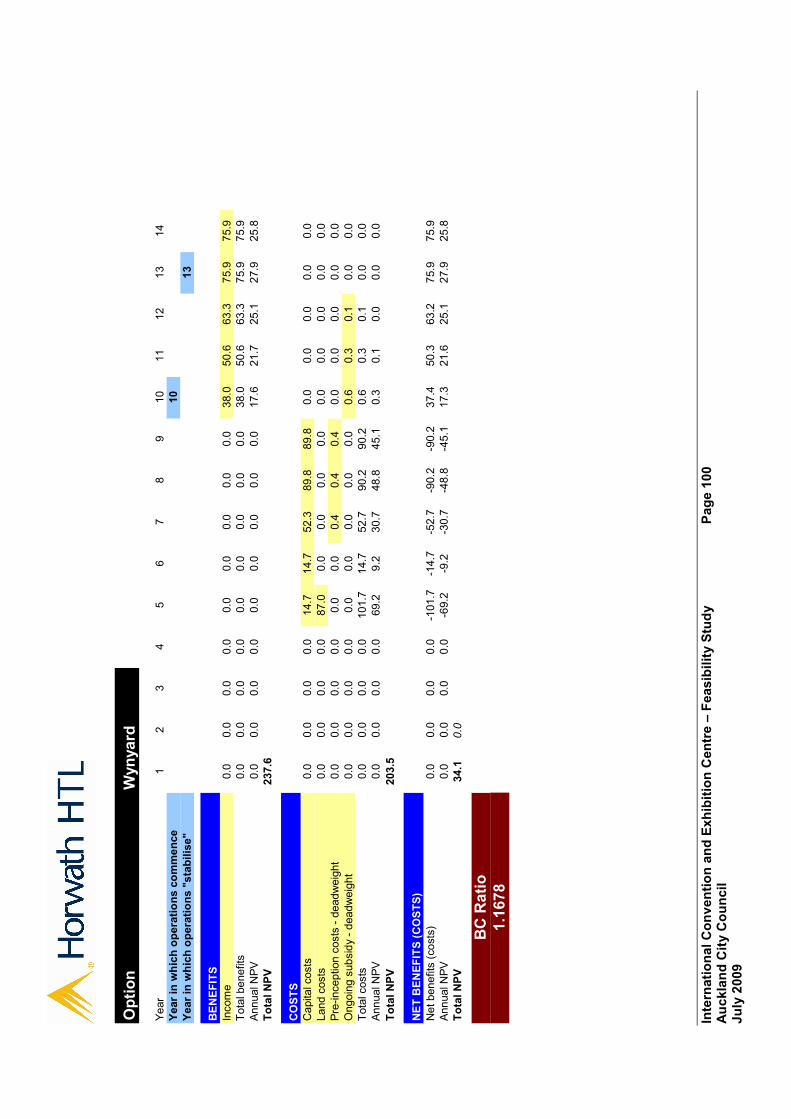
The rationale for developing an international convention centre for New Zealand is not predicated on developing an exhibition centre for stand-alone tradeshows and exhibitions, or replicating or competing with the ASB Auckland Showgrounds. Such an expansion could only be contemplated if it was planned to close down the recently expanded ASB Auckland Showgrounds. We have not assumed that the proposed convention and exhibition centre will win any exhibition business at the expense of the ASB Auckland Showgrounds. The substantial expansion of facilities in the Asia / Pacific region (especially in Asia, and in Australia) to cater for such shows and exhibitions is, in our view, not justified in New Zealand. Capital Expenditure Analysis WT Partnership have prepared capital cost estimates of alternative convention centre scenarios. Three scenarios assume a waterfront location, one a location at Wynyard Point and one a CBD location. Land purchase costs are excluded. A summary of the cost estimates follows:
Bledisloe
(Full)
($m)
Bledisloe
(Half)
($m)
Other
Wharf
($m)
Wynyard
Point
($m)
CBD
Site
($m)
Convention Centre (excl. land) 191,700 191,700 191,700 191,700 191,700
Fees, consents, other 43,612 53,219 62,827 33,548 33,548
Base cost (pre-escalation) 292,822 357,329 421,837 225,247 225,247
Escalation (4 years, except Wynyard option: 9 years)
37,178 44,671 53,163 82,753 28,753
Total cost (incl. escalation) 330,000 402,000 475,000 308,000 254,000
(Source: WT Partnership)
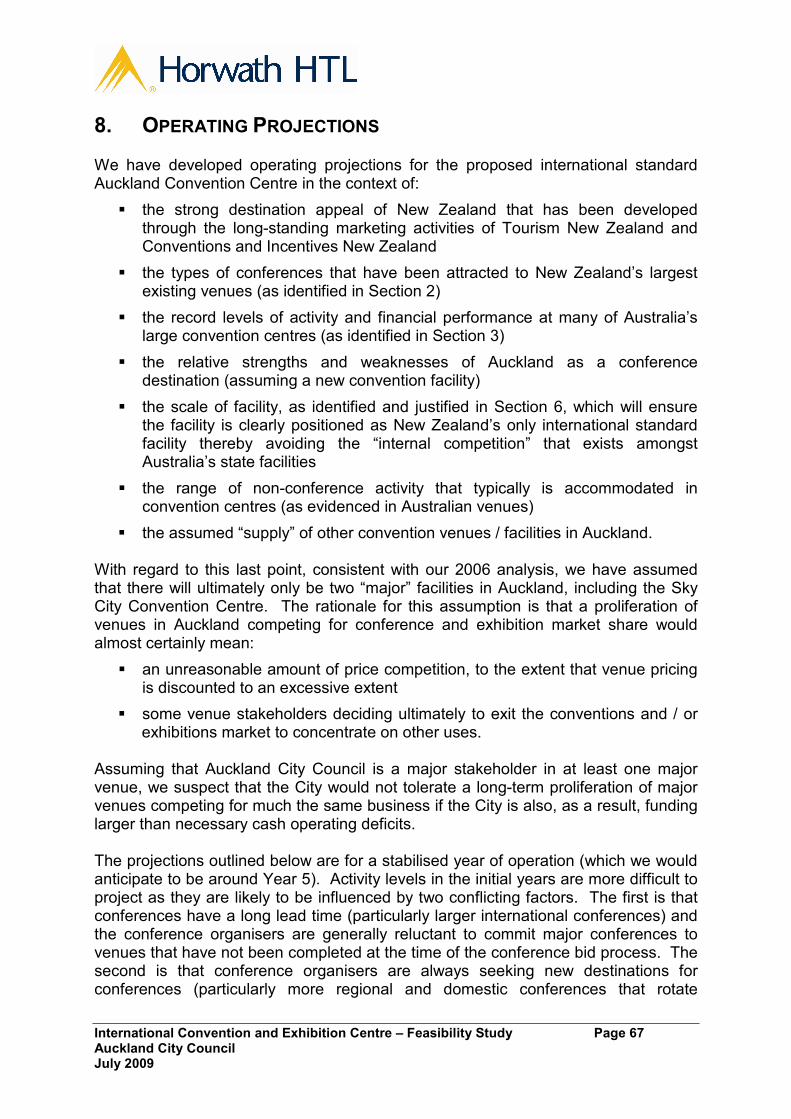
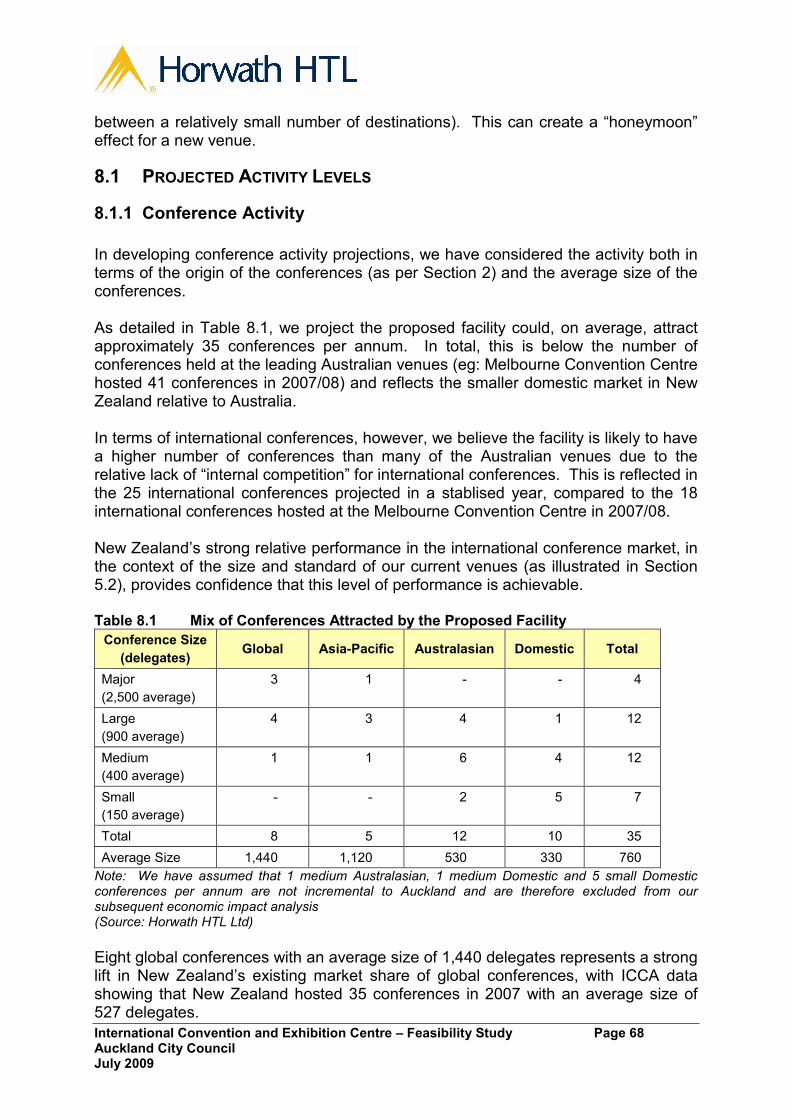
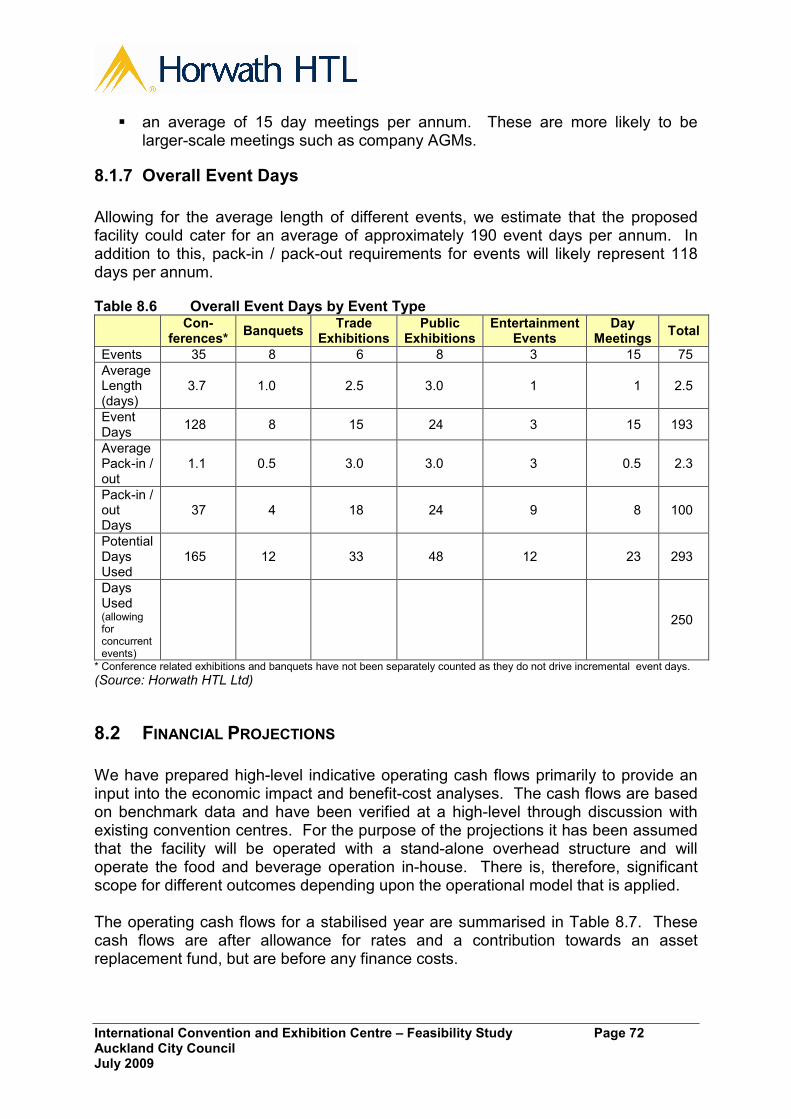
Operating Projections In developing conference activity projections, we have considered the activity both in terms of the origin of the conferences and the average size of the conferences. We project the proposed facility could, on average, attract approximately 35 conferences per annum. In total, this is below the number of conferences held at the leading Australian venues (eg: Melbourne Convention Centre hosted 41 conferences
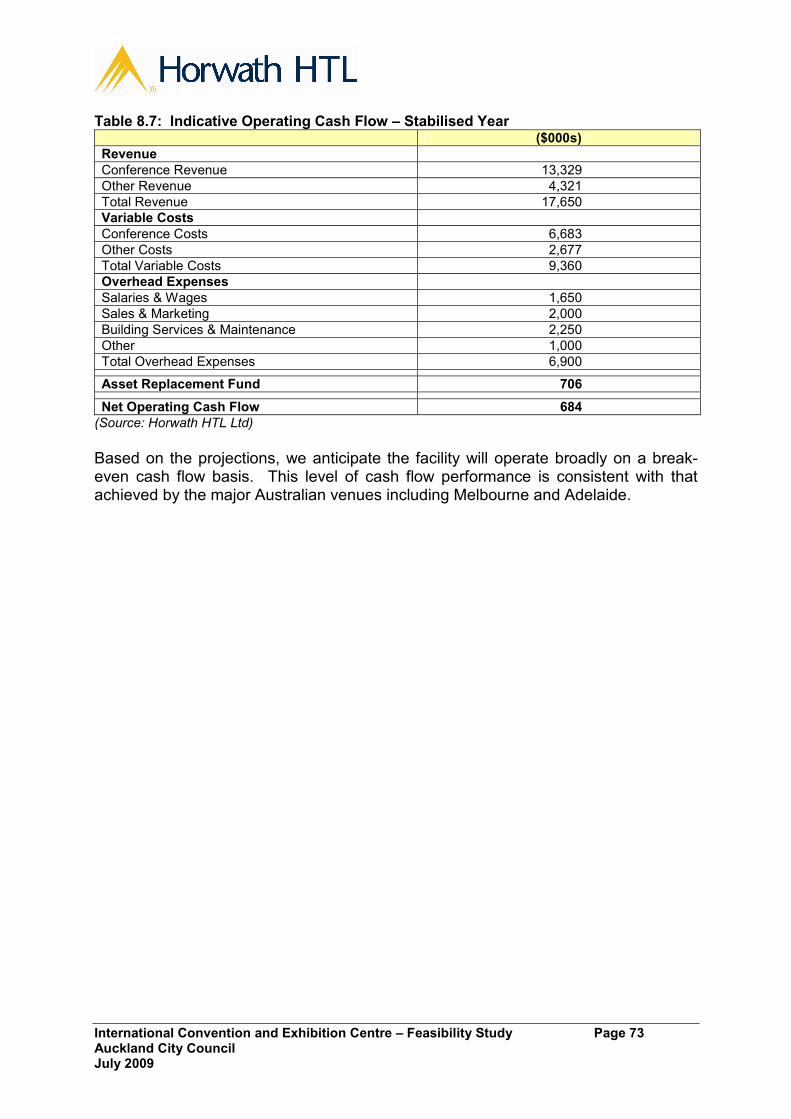
International Convention and Exhibition Centre – Feasibility Study Page 13 Auckland City Council July 2009
in 2007/08) and reflects the smaller domestic market in New Zealand relative to Australia.) In terms of international conferences, we believe the facility is likely to have a higher number of conferences than many of the Australian venues due to the relative lack of “internal competition” for international conferences such as exisits between the various Australian facilities. This is reflected in the 25 international conferences projected in a stablised year, compared to the 18 international conferences hosted at the Melbourne Convention Centre in 2007/08. The 25 conferences with an average size of 939 delegates represents a strong lift in New Zealand’s existing market share of international conferences, with ICCA data showing that New Zealand hosted 35 conferences in 2007 with an average size of 527 delegates. Based on our financial projections, we anticipate the facility will operate broadly on a break-even cash flow basis. This level of cash flow performance is consistent with that achieved by the major Australian venues including Melbourne and Adelaide. Economic Impact Analysis / Benefit-Cost Analysis It is estimated that, when fully operational, events at the proposed facility will generate and increase of $85.4 million in tourism-related expenditure per annum (almost 22,000 additional international visitors who would not otherwise visit New Zealand, and more than 200,000 extra visitor days). 84% of the incremental visitor expenditure is associated with people who participate in conferences. There is a significant spin-off from associated visitor activity which account for over half of the visitor days and 39% of visitor expenditure. Approximately 95% of the incremental expenditure is attributable to conferences. Assuming 80% of capital costs will be funded from the public sector, the estimated capital costs have been increased by 16% (a 20% increase on the public sector contribution) to recognise the effect of deadweight loss. Land costs have been included, on the basis that these represent an opportunity cost, at an assumed $75 million for each site option. The CBD option has the lowest total Net Present Value (NPV) of costs (except Wynyard) as its capital costs are purely for construction of the convention centre. The addition of an “iconic” structure for the waterfront options, and the varying costs of wharf strengthening, raises the NPV of their costs. The Wynyard option differes from the others primarily in terms of its timing, with no additional site costs or “iconic” enhancements. The NPV of benefits is $396.7 million for all site options (except Wynyard Point) as all options assume the same income stream. The CBD option has the highest Benefit Cost Ratio (BCR). The lowest-cost waterfront option and the Wynyard option have similar BCRs. The effect of additional costs of wharf strengtheneing is to reduce the BCRs of other waterfront options
International Convention and Exhibition Centre – Feasibility Study Page 14 Auckland City Council July 2009
further. In the case of the most expensive waterfront option, its NPV costs exceed NPV benefits. If the assumptions are considered realistic, a CBD option would be favoured as it delivers the benefits from increased tourism at the earliest date and the least capital costs. In comparison, the waterfront options incur additional capital costs but secure no additional benefits. They provide additional amenity values from “iconic” structures in a “signature” location. The Wynyard option assumes the same costs and benefits as the CBD option, but with a four year delay. Given the fact that the options generally deliver net benefits, the impact of deferring these is to reduce the value of this project option. The relativity of benefits to costs between the options could change if there were significant differences in land values between the options. The above results have been applied through the NZIER Computable General Equilibrium (CGE) model of the New Zealand economy to estimate the total effects from the initial impacts of capital and tourism expenditure. The effect of the additional $85.4 million per annum in tourism expenditure is an increase in national GDP value added of $40.3 million per annum. The CGE model assumes all tourism expenditure is generated equally throughout the year, and that there is limited surplus capacity in the economy throughout the year to absorb the incremental demand. However this assumption does not reflect the underlying reality of conference demand, which occurs generally during the shoulder and low season of the international and domestic visitor industry, therefore increasing demand at times when there is usually significant excess capacity. Therefore the GDP estimates produced by the CGE analysis are likely to be significantly understated. Other potential non-quantified and intangible effects of the convention centre include:
� savings of offshore expenditure: New Zealanders attending events at the home-based convention centre rather than travelling overseas to the conferences held elsewhere
� reputational effects: hosting major conventions reinforces the perception of Auckland and New Zealand as a destination of international standing, especially in fields in which New Zealand wishes to establish its international standing (eg: emerging technologies)
� learning and relationships effects: the personal contacts that New Zealand conference delagtes make at international conferences, and the subsequent exchange of information, collaborative activities, business venture, etc, contributes to New Zealand’s “global connectedness”
� local networking: local planning and preparation for major international conventions may provide a catalyst for local networking, including business, academia and / or the public sector, and may lead to ongoing collaboration.
These effects are potentially significant but are regarded as non-quantifiable.
International Convention and Exhibition Centre – Feasibility Study Page 15 Auckland City Council July 2009
Public / Private Ownership, Governance, Operations Convention and Exhibition (Convex) Centres are substantial real estate investments (in terms of capital cost) and are not generally run on a “commercial” basis. The key reasons for developing international standard convention centres revolve around their ability to generate substantial economic impact and facilitate the transfer of valuable knowledge and contacts to the benefit of the local economy. It is because of these “public good” aspects and the large capital costs that large convention centres tend to predominantly be funded by the public sector. In order to optimise private sector funding contributions it is likely that a range of funding mechanisms will need to be pursued. There are three broad ownership options available for an international standard convention centre:
� private ownership through a BOOT scheme
� direct ownership by the public sector
� the creation of special purpose entities that are accountable to the public sector. These entities take a diverse range of forms.
The benefit of these entities is that they are fully accountable to the public sector but are able to operate at arms length to ensure the public sector’s objectives are met in the most efficient and effective manner. We note that the Royal Commission on Auckland Governance has recommended the establishment of a Council Controlled Organisation to own all regionally significant event venues, which would logically include the proposed international convention centre. The on-going governance model for the proposed centre will be a product of the ownership model that is adopted. There may be merit in establishing an interim governance structure to oversee the development of the facility. This could be akin to the Redevelopment Board that has been established at Eden Park and have specific responsibility for ensuring key stakeholder requirements are met in the development of the physical building. The skill-sets of the representatives on this governance structure are likely to differ significantly from the skill-sets sought for those on the governance structure of the ownership entity although some continuity of representation would be highly desirable. In Australasia there is a reasonably even split between in-house venue management and out-sourced venue management. The primary advantages of contracting out venue management include realising “key money” in return for the commercial opportunity and the potential to obtain specialist operational expertise to improve performance levels, particularly during the establishment phase.
International Convention and Exhibition Centre – Feasibility Study Page 16 Auckland City Council July 2009
The key risks of contracting out the venue management is the potential for mis-alignment of objectives and the potential that revenue performance may not be improved to the extent necessary to off-set the associated management fees. Historically, there has been a tendency for venue managers to out-source food and beverage services to specialist caterers. However, in recent years there has been a trend towards venue managers bringing these services back in-house to assist their profitability and ensure greater control over service standards. Conclusion The rationale for development of an internationally competitive venue for hosting international and national conferences, exhibitions and other business events is centred on:
� generating incremental economic impact for the New Zealand economy as a result of hosting such events
� providing the opportunity to ‘showcase’ New Zealand to international delegates in an internationally competitive venue
� generating other tangible and intangible benefits which are not directly measurable in economic terms.
The Cost Benefit ratios of all but one scenario analysed in this study are positive. The economic impact analysis is based on a General Equilibrium model of the New Zealand economy and is conservative because it assumes that:
� demand will occur for the conference and exhibition centre evenly throughout the year – whereas international (and national) conference demand will tend to peak during the months March – October (nine months)
� New Zealand’s capacity to host such events will face capacity constraints throughout the year – whereas the period of peak demand will coincide with the shoulder and low season demand for the required infrastructure (most importantly hotel accommodation, but also other commercial accommodation, airline and airport infrastructure, coach and other public transport, etc) when capacity is generally available and under-utilised.
Because the demand and capacity constraint assumptions inherent with General Equilibrium modelling do not reflect the underlying reality of the shape of convention activity and the highly seasonal nature of international and domestic visitor activity demand on infrastructure in New Zealand, the actual incremental contribution to GDP is likely to be significantly higher than indicated in the analysis contained in this report. In addition to the conservative economic impact assumptions adopted in the analysis contained in this report, the employment and financial benefits to the visitor industry (especially in terms of the owners of tourism industry infrastructure) are likely to be incrementally substantial.
International Convention and Exhibition Centre – Feasibility Study Page 17 Auckland City Council July 2009
For example, incremental hotel room demand in Auckland (and elsewhere around New Zealand) as a result of incremental conference demand (including pre- and post-conference travel in New Zealand) will have a high ‘flow-through’ to net profit during a period of the year when profitability is under significant and increasing pressure as peak season visitor demand grows (ie: November – February). If, on an indicative basis, total revenue in a typical ‘conference’ hotel grew by 2 – 3 percent on an annual basis as a result of incremental conference industry demand, it is possible that net profit before tax could grow by 4 – 6 percent or even 8 – 12 percent on an annual basis. Incremental off-season demand combined with improved overall industry profitability will result in more sustainable businesses in the tourism industry, and increased full-time year-round employment for New Zealanders to replace seasonal / casual labour, much of which is provided by short-term migrants.
International Convention and Exhibition Centre – Feasibility Study Page 18 Auckland City Council July 2009
2. HISTORICAL CONFERENCE ACTIVITY The primary rationale for developing a new international convention and exhibition centre for Auckland is to substantially improve New Zealand’s capability for hosting medium to large-scale international conferences and related exhibitions / tradeshows. This involves winning such conferences over competing countries (especially Australia) and hosting them with the minimum of compromises. New Zealand has some capability for hosting small to medium sized international conferences at present, and New Zealand has hosted some reasonably large international conferences in the past. However, we are facing increasingly significant constraints and competitive disadvantages when compared to international facilities and locations, especially when compared to our closest competitor, Australia. The key target conferences where New Zealand does not currently have good competitiveness is in international association (ie: non-corporate entity) conferences of over 1,000 delegates.
2.1 INTERNATIONAL ASSOCIATION CONFERENCE ACTIVITY
The main data source relating to this conference activity is the International Congress and Convention Association (“ICCA”) database of conference activity.
The ICCA database does not cover governmental / ‘quango’ organisation conferences (eg: World Bank, United Nations, Commonwealth Heads of Government, etc).
(Source: ICCA: International Association Meeting Market Statistics Report 1999 to 2008)
According to ICCA, the association market covers a wide range of event types and categories: medical meetings (the largest segment); scientific; other academic; trade organisations; professional bodies; social groupings. In terms of size, budget, duration and complexity there are significant variations between and also within categories. However, some similarities can be identified:
���� almost every ‘specialty’ has an association which holds one or more meetings
���� most associations have meetings that are repeated at regular intervals; these can be annual, biennial, etc
International Convention and Exhibition Centre – Feasibility Study Page 19 Auckland City Council July 2009
���� the destinations rotate, and they rarely return to the same destination within a very short time-span
���� the initiative to host a meeting often comes from the local counterpart, eg: the national association; if that body is difficult to motivate to organise the meeting, the chances are high that the meeting will be scheduled elsewhere
���� Association meetings have a very long lead-time; it is not unusual to find lead times of 5 years or more.
���� it is estimated that a growing minority of about 25-30% of the decision-making processes no longer include an official bidding procedure, but have a “central initiator” who selects the location and venues based on pre-determined and strict criteria.
2.1.1 International Congress and Convention Association Database
The ICCA database is the primary source of published quantitative information regarding non-governmental international association conferences. It is estimated that there are approximately 15,000 such association meetings organised in the world on a regular basis.4 The ICCA Association Database has collected information on approximately 80% of them (approximately 12,000). The 15,000 association meetings include non-annual meetings, meetings which do not rotate between countries (including USA-based associations that rotate principally within the USA), and association meetings of less than 50 participants. In order to be included in the ICCA database, association meetings must meet the following criteria:
���� be attended by at least 50 participants
���� be organised on a regular basis (ie: one-off events are not included)
���� move between at least three different countries. In 2009, ICCA identified 7,475 international Association conferences that were reported as being held in 2008 which met these criteria5. The difference between the 13,000 association meetings in the ICCA database and the 7,475 meetings reported in 2008 relates to the proportion of Associations which do not hold annual meetings, non-reporting by ICCA members by the reporting deadline of 1 February 2009, conferences held at non-ICCA member venues, and meetings of less than 50 delegates in the 2008 year.
4 ICCA: International Association Meeting Market Statistics Report 1999 to 2008 5 Subsequent top-line ICCA data for 2008 indicates 7,475 conferences, an 11.9% increase on 2007
International Convention and Exhibition Centre – Feasibility Study Page 20 Auckland City Council July 2009
2.1.2 International Association Conference Market Trends – Global
Figure 2.1 illustrates the global growth in the association conference market by number of participants (over 500 delegates) between 1999 and 2008. This segmentation is based only on a subset of the ICCA database where participant numbers are stored. Reporting of delegate numbers appears to be more complete in the larger conferences (over 500 delegates); however it is probable that the data in Figure 2.1 understates that actual number of larger international association conferences. Figure 2.1: International Association Conferences (> 500 delegates) – Global (1999 – 2008)
0
100
200
300
400
500
600
700
800
500 to 999 1,000 to 1,999 2,000 to 2,999 >3,000
Number of Participants
Number of Association Conferences
1999 2008
CAGR = Compound Annual Growth Rate (Source: ICCA: International Association Meeting Market Statistics Report 1999 to 2008)
As shown in Figure 2.1, there has been substantial growth reported in the number of larger international association conferences. There has been strong in meetings of 1,000 delegates and over where New Zealand currently does not have strong capability. There has been no trend of reduction in the number of conferences in any size category during the period. Figure 2.2 shows the growth trend in the association conference market by number of participants (over 500 delegates) including in the intermediary years between 1999 and 2008.
CAGR – 4.5%
CAGR – 6.7%
CAGR – 6.2% CAGR – 5.1%
International Convention and Exhibition Centre – Feasibility Study Page 21 Auckland City Council July 2009
Figure 2.2: Global Growth Trend – International Association Conferences by Size
y = 25.794x + 387.53
y = 14.824x + 196.47
0
100
200
300
400
500
600
700
800
1999 2000 2001 2002 2003 2004 2005 2006 2007 2008
Year
Number of Conferences by Size
500 to 999 1000 to 1999 2000 to 2999
3000 to 4000 5000 to 10000 10000+
Linear (500 to 999) Linear (1000 to 1999)
(Source: ICCA: International Association Meeting Market Statistics Report 199-2008)
The international association conference market is highly seasonal, as illustrated in Figure 2.3. The number of international association conferences peaks in June and September, and bottoms out in December – February.
International Convention and Exhibition Centre – Feasibility Study Page 22 Auckland City Council July 2009
Figure 2.3: Seasonality of International Association Conferences – Global (1999 and 2008)
0
200
400
600
800
1000
1200
1400
Jan Feb Mar Apr May Jun Jul Aug Sep Oct Nov Dec
Number of Meetings
1999 2008
(Source: ICCA: International Association Meeting Market Statistics Report 1999 to 2008)
ICCA also compiles statistics (where the data is available) on the venues used by association conferences. As shown in Figure 2.4, the most popular conference venues, particularly for smaller conferences, are hotels with meeting facilities (42%), followed by dedicated conference / exhibition centres (30%) and universities (19%). Figure 2.4: Conference Venues Used – Global (2008)
Hotels
42%
Conference /
Exhibition Centres
30%
Universities
19%
Other Venues
9%
(Source: ICCA: International Association Meeting Market Statistics Report 1999 to 2008)
International Convention and Exhibition Centre – Feasibility Study Page 23 Auckland City Council July 2009
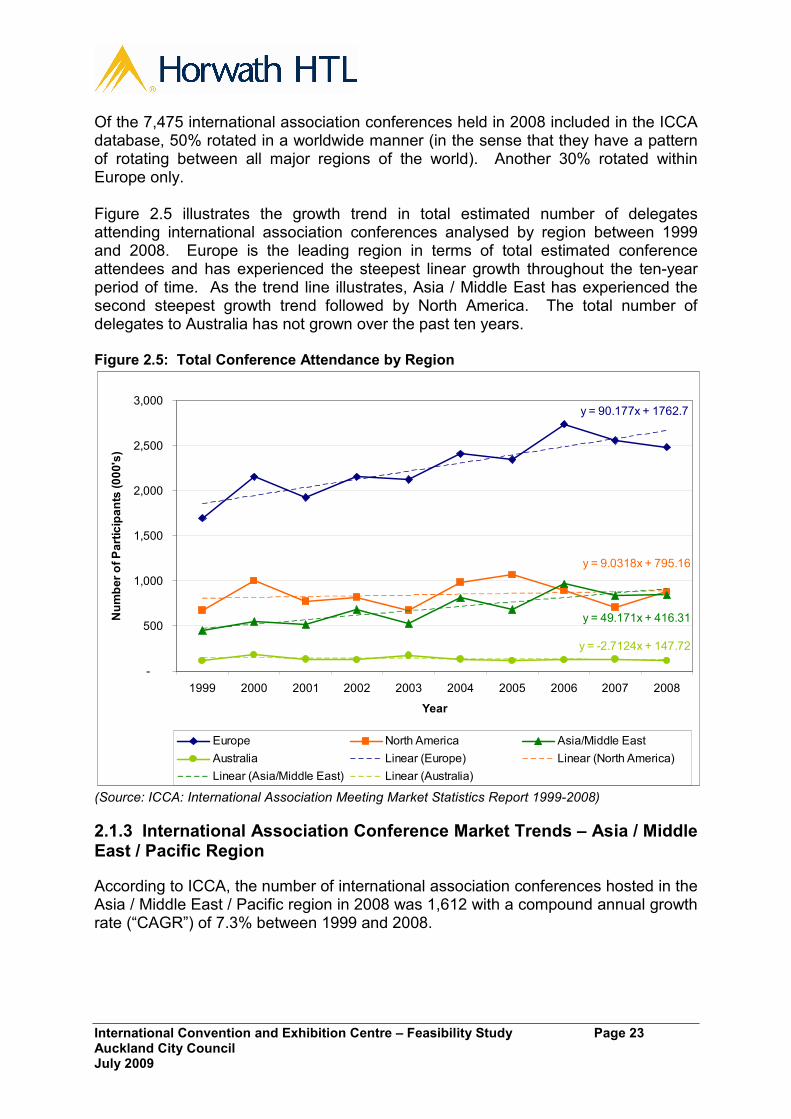
Of the 7,475 international association conferences held in 2008 included in the ICCA database, 50% rotated in a worldwide manner (in the sense that they have a pattern of rotating between all major regions of the world). Another 30% rotated within Europe only. Figure 2.5 illustrates the growth trend in total estimated number of delegates attending international association conferences analysed by region between 1999 and 2008. Europe is the leading region in terms of total estimated conference attendees and has experienced the steepest linear growth throughout the ten-year period of time. As the trend line illustrates, Asia / Middle East has experienced the second steepest growth trend followed by North America. The total number of delegates to Australia has not grown over the past ten years. Figure 2.5: Total Conference Attendance by Region
y = 90.177x + 1762.7
y = 9.0318x + 795.16
y = 49.171x + 416.31
y = -2.7124x + 147.72
-
500
1,000
1,500
2,000
2,500
3,000
1999 2000 2001 2002 2003 2004 2005 2006 2007 2008
Year
Number of Participants (000's)
Europe North America Asia/Middle East
Australia Linear (Europe) Linear (North America)
Linear (Asia/Middle East) Linear (Australia)
(Source: ICCA: International Association Meeting Market Statistics Report 1999-2008)
2.1.3 International Association Conference Market Trends – Asia / Middle East / Pacific Region
According to ICCA, the number of international association conferences hosted in the Asia / Middle East / Pacific region in 2008 was 1,612 with a compound annual growth rate (“CAGR”) of 7.3% between 1999 and 2008.
International Convention and Exhibition Centre – Feasibility Study Page 24 Auckland City Council July 2009
This rate of growth is 21% higher than the rate of growth reported for the world over the same period (with CAGR of 6.0%).6
The higher regional rate of growth reflects the number of major new convention centres which opened in Asia during the period.
Figure 2.6 demonstrates the consistent growth in international association conferences hosted in the Asia / Middle East / Pacific region during the period 1999 – 2008, only interrupted by the outbreak of SARS in the region in 2003.
Figure 2.6: Number of International Association Conferences – Asia / ME / Pacific (1999 - 2008)
0
200
400
600
800
1,000
1,200
1,400
1,600
1,800
1999 2000 2001 2002 2003 2004 2005 2006 2007 2008
Calendar Years
Number of Association Conferences
Other Asia / ME / Pacific Australia New Zealand
(Source: ICCA: International Association Meeting Market Statistics Report 1999 to 2008)
Table 2.1 shows a further analysis of the conferences held in the region in 1999 and 2008. This highlights the dramatic growth in conference activity within Asia, especially in China, Korea and Singapore, which countries have invested heavily in new and expanded convention and exhibition centres.
6 The ICCA database includes new venues reporting conference activity, as well as ‘actual’ growth in total conference activity, although it is not possible to identify what the underlying ‘actual’ growth is.
Impact of SARS: postponements followed by ‘bounce back’
International Convention and Exhibition Centre – Feasibility Study Page 25 Auckland City Council July 2009
Table 2.1: Number of Conferences Hosted within Asia / Middle East / Pacific Region
Number of International Association Conferences Held Country
1999 2008
Percentage Change
1999 - 2008
CAGR
Change
1999 - 2008
Japan 154 247 60.4% 5.4%
China 69 223 223.2% 13.9%
Korea 67 169 152.2% 10.8%
Singapore 46 118 156.5% 11.0%
Other Asia 277 539 94.6% 7.7%
Total Asia 613 1,296 111.4% 8.7%
Sydney 56 64 14.3% 1.5%
Melbourne 35 38 8.6% 0.9%
Brisbane 18 18 0.0% 0.0%
Other Australia 32 62 93.8% 7.6%
Total Australia 141 182 29.1% 2.9%
Auckland 8 17 112.5% 8.7%
Christchurch 1 8 700.0% 26.0%
Other New Zealand 13 13 0.0% 0.0%
Total New Zealand 22 38 72.7% 6.3%
Other ME / Pacific 81 96 18.5% 1.9%
Total Asia / ME / Pacific 857 1,612 88.1% 7.3%
(Source: ICCA: International Association Meeting Market Statistics Report 1999 to 2008)
The data shows that New Zealand achieved a CAGR (between 1999 and 2008) of 6.3% (above Australia). The New Zealand growth has been influenced by additional venues (including hotels and universities) reporting relatively smaller conferences other than in Auckland and Christchurch.
Other Asian countries that experienced high volume growth in the 1999 – 2008 period included China (CAGR of 13.9%), Korea (10.8%) and Singapore (11.0%).
The ICCA database shows that, of the 1,612 international conferences hosted in the region in 2008, 680 of these (42% of total) rotated only within the region (ie: not on a worldwide basis). This was up from 328 conferences (38% of total) in 1999.
The number of conferences in Australasia (ie: New Zealand and Australia combined) grew from 163 in 1999 to 220 in 2008, consistent with the overall world growth, but significantly less than the overall Asia / Middle East (“ME”) / Pacific region. This resulted in a reduction in market share of Australasia within the region, and reflects the rapid growth in conference activity in Asia, and particularly China, Korea and Singapore.
Table 2.2 summarises the relative rankings in terms of number of conferences hosted by country within the region. This highlights the low New Zealand share
International Convention and Exhibition Centre – Feasibility Study Page 26 Auckland City Council July 2009
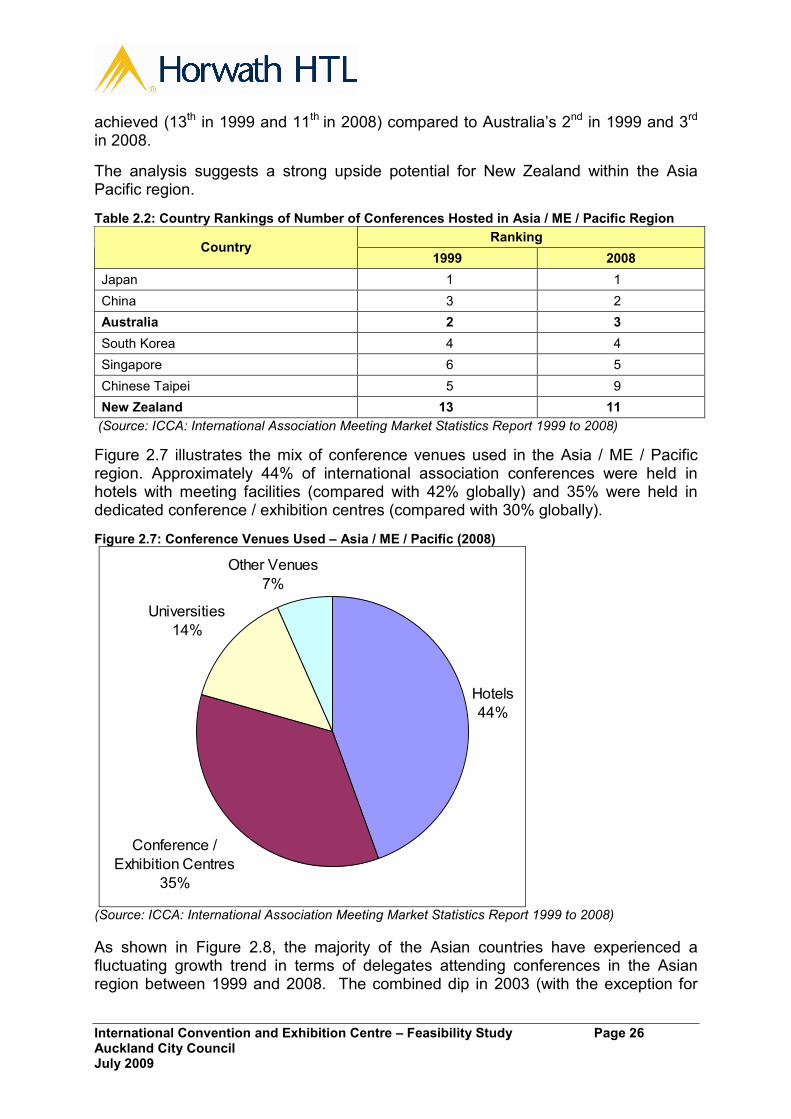
achieved (13th in 1999 and 11th in 2008) compared to Australia’s 2nd in 1999 and 3rd in 2008.
The analysis suggests a strong upside potential for New Zealand within the Asia Pacific region.
Table 2.2: Country Rankings of Number of Conferences Hosted in Asia / ME / Pacific Region
Ranking Country
1999 2008
Japan 1 1
China 3 2
Australia 2 3
South Korea 4 4
Singapore 6 5
Chinese Taipei 5 9
New Zealand 13 11
(Source: ICCA: International Association Meeting Market Statistics Report 1999 to 2008)
Figure 2.7 illustrates the mix of conference venues used in the Asia / ME / Pacific region. Approximately 44% of international association conferences were held in hotels with meeting facilities (compared with 42% globally) and 35% were held in dedicated conference / exhibition centres (compared with 30% globally).
Figure 2.7: Conference Venues Used – Asia / ME / Pacific (2008)
Hotels
44%
Conference /
Exhibition Centres
35%
Universities
14%
Other Venues
7%
(Source: ICCA: International Association Meeting Market Statistics Report 1999 to 2008)
As shown in Figure 2.8, the majority of the Asian countries have experienced a fluctuating growth trend in terms of delegates attending conferences in the Asian region between 1999 and 2008. The combined dip in 2003 (with the exception for
International Convention and Exhibition Centre – Feasibility Study Page 27 Auckland City Council July 2009
Singapore) may be related to the bird flu resulting in fewer participants willing to travel to conferences. Figure 2.8: Delegates per County in Asia
-
50
100
150
200
250
300
350
1999 2000 2001 2002 2003 2004 2005 2006 2007 2008
Year
Number of Participants per Country (000's)
Republic of Korea Japan China-P.R. Thailand Singapore Other Asia
2.1.4 International Association Conference Market Trends – New Zealand
Figure 2.6 summarises the performance of New Zealand in the context of Australasia, Asia / ME / Pacific region and the World. The 38 conferences held in New Zealand in 2008 represent a share of 0.5% of total conferences. These conferences had an average size of 467 delegates, compared to the world average of 638 delegates.7
7 The average size of conferences reported has fallen mainly as a result of in increase in the number of smaller conferences reported by new / additional hotel venues.
International Convention and Exhibition Centre – Feasibility Study Page 28 Auckland City Council July 2009
Figure 2.9: New Zealand’s Share of International Association Conferences – 1999, 2008
(Source: ICCA: International Association Meeting Market Statistics Report 1999 to 2008)
The data indicates that New Zealand has “punched above its weight” in terms of winning international association conferences within the Australasian and world markets over the past decade, even with limitations of facilities. This can partly be attributed to the Christchurch Convention Centre (which opened in 1997) and SKYCITY Auckland Convention Centre (which opened in 2004) becoming established in the international market, and improved marketing and targeting of international conventions by Conventions and Incentives New Zealand in conjunction with the leading venues and regional convention bureaus.
In addition to these regional and international conferences, New Zealand taps into the Australian ‘domestic’ market for association conferences – ie: those conferences normally hosted only in Australia but which come to New Zealand on occasion. These conferences do not meet the ICCA criteria of international association conferences.
Australian corporate conferences (as well as corporate conferences from further afield, to a lesser extent) are also a target for the New Zealand conference industry. Conventions and Incentives New Zealand is active in marketing New Zealand in the Australian market with full-time representation in Sydney, as are several of the Convention Bureaux and major venues in New Zealand.
Meetings, the annual New Zealand conference industry trade show, also heavily targets Australian buyers. As a result of these initiatives New Zealand has an increasingly high profile in Australia as a destination for conferences.
There are currently almost 670 conferences in the ICCA database that include within their organisation some connection to New Zealand (eg: a committee member of=n the international organisation). Figures 2.10 to 2.14 refer to this sub-set of the ICCA conference database.
New Zealand (not to scale)
Australasia (not to scale)
Asia / ME / Pacific (not to scale)
1999 2008 Number 22 38 % of Australasia 13.5% 17.3% Growth (10 yrs) +73% Average Size 269 467 (Refer to Table 2.1 for annual growth)
1999 2008 Number 857 1,612 % of World 19.4% 21.6% Growth (10 yrs) +88% Average Length 4.5 4.0 Average Size 659 599 (Refer to Table 2.1 for annual growth)
1999 2008 Number 163 220 % of Asia/ME/Pac 19.0% 13.6% Growth (10 yrs) +35% Average Size 665 521 (Refer to Table 2.1 for annual growth)
World
1999 2008 Number 4,424 7,475 Growth (10 yrs) +69% Average Length 4.4 3.9 Average Size 722 638
International Convention and Exhibition Centre – Feasibility Study Page 29 Auckland City Council July 2009
Figure 2.10 shows the proportion of the main country base of the organisation. The largest proportion of the organisations (57%) is Europe based followed by the Americas (22%). Asia-Pacific represents a combined 19% of the organisations.
Figure 2.10: Main Country Base of Organisation (with some NZ contact)
Main Country Base of Organisation
Not Identified
2%
Americas
22%
Oceania
5%
Asia
14%Europe
57%
(Source: ICCA: International Association Meeting Market Statistics Report 1999 to 2008)
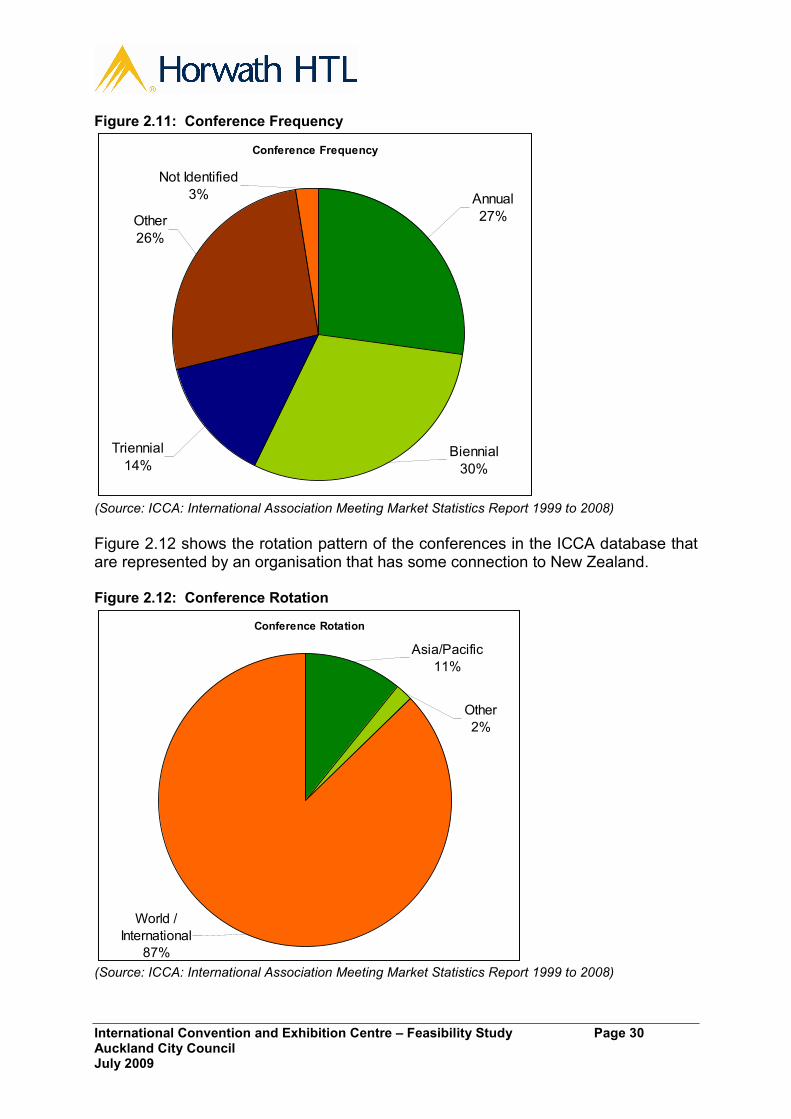
Figure 2.11 illustrates the frequency of the conferences (ie: how often they are held). The 25% of ‘other’ conferences represents conferences that have a different kind of frequency (eg: several times a year, only each tenth year, by no particular frequency schedule, etc).
International Convention and Exhibition Centre – Feasibility Study Page 30 Auckland City Council July 2009
Figure 2.11: Conference Frequency
Conference Frequency
Annual
27%
Not Identified
3%
Other
26%
Triennial
14%Biennial
30%
(Source: ICCA: International Association Meeting Market Statistics Report 1999 to 2008)
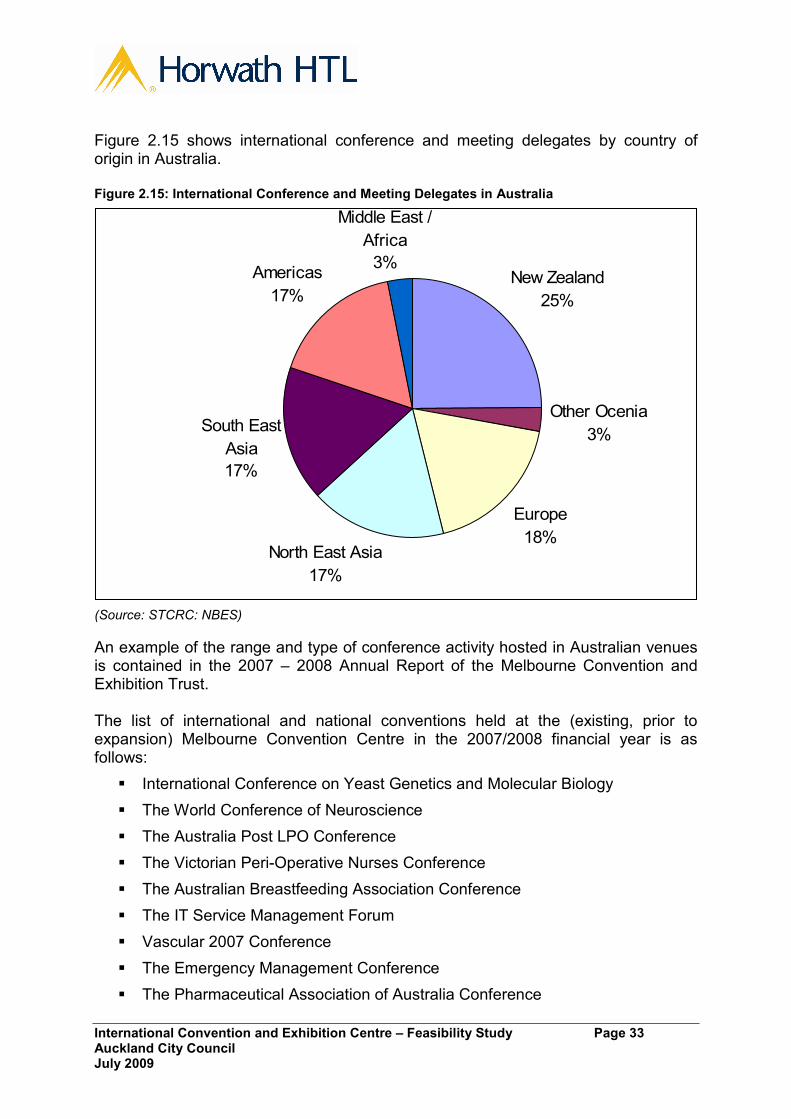
Figure 2.12 shows the rotation pattern of the conferences in the ICCA database that are represented by an organisation that has some connection to New Zealand. Figure 2.12: Conference Rotation
Conference Rotation
Asia/Pacific
11%
Other
2%
World /
International
87% (Source: ICCA: International Association Meeting Market Statistics Report 1999 to 2008)
International Convention and Exhibition Centre – Feasibility Study Page 31 Auckland City Council July 2009
Figure 2.13 illustrates the conference activity in terms of time of the year. 79% of the conferences (for which the timing is known) occur during the New Zealand winter and shoulder period of the year compared with only 21% that occur during the New Zealand summer. Figure 2.13: Conference Activity throughout the Year
Conference Activity throughout the Year
Not Identified
53%
April-
September
37%
October-
March
10%
(Source: ICCA: International Association Meeting Market Statistics Report 1999 to 2008)
As illustrated in Figure 2.14, for those conferences where the usual type of conference venue is identified, 76% of the conferences, are hosted either at a Congress Centre (or Conference Centre) only or a Congress Centre in conjunction with one or more venues.
International Convention and Exhibition Centre – Feasibility Study Page 32 Auckland City Council July 2009
Figure 2.14: Venue Type
Venue Type
Congress
Centre or
Shared
29%
Other
(Including
Hotel only,
University,
etc)
9%
Not Identified
62%
(Source: ICCA: International Association Meeting Market Statistics Report 1999 to 2008)
In addition to these 667 international association conferences where there is some New Zealand contact / representation in relation to the organisation responsible for the conference, approximately 20 of these organisations are either based in New Zealand or are led by a person based in New Zealand. A list of these conferences is attached as Appendix 7. These organisations and conferences potentially may have a higher probability of being hosted in New Zealand, and are a higher priority for targeting for conference bids by CINZ (where the expected conference size within New Zealand’s current capability to host.
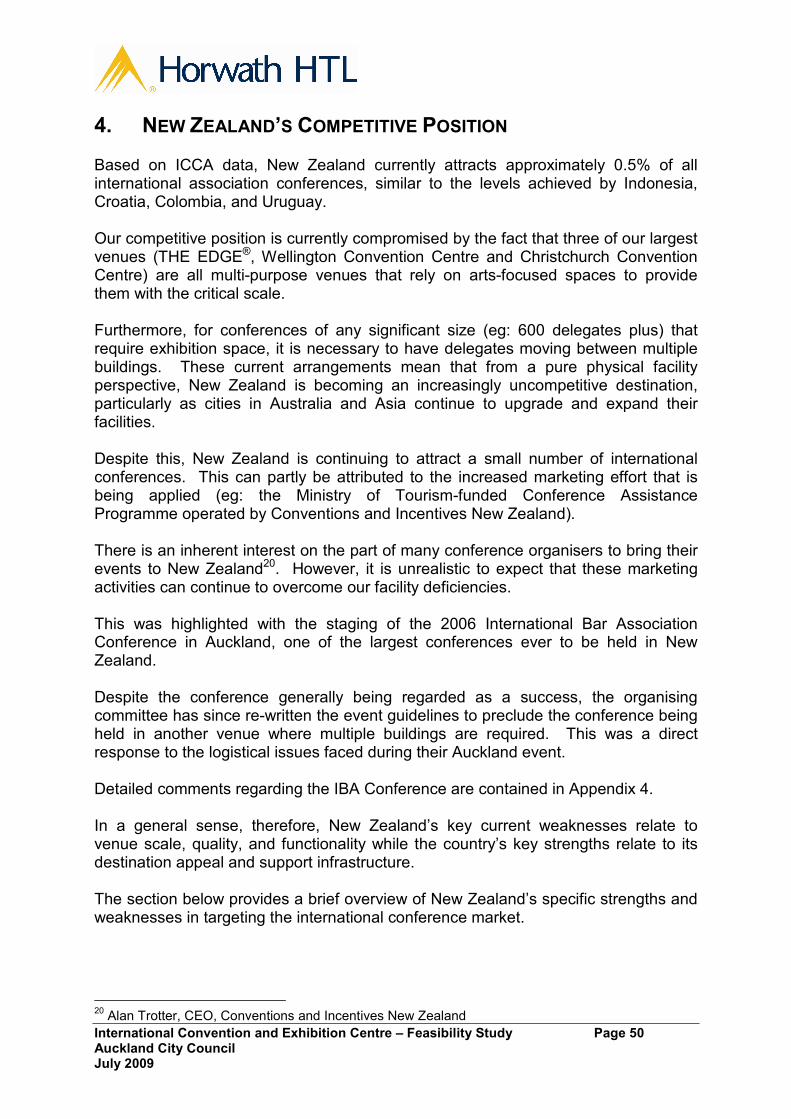
2.2 AUSTRALIAN CONVENTION ACTIVITY The National Business Events Study8 (“NBES”) produced by the Sustainable Tourism Cooperative Research Centre (“STCRC”) recorded a total of 20 million meeting and conference delegates in 2003, of which approximately 1% or approximately 200,000 visitors were of international origin9. According to the study, New Zealand was Australia’s largest international market representing nearly 25% of total international conference and meeting delegates. The next largest market was Europe, generating nearly 18% of total international conference and meeting delegates.
8 Latest version published in 2005 and based on 2003 data 9 According to Tourism Australia visitor arrival statistics, there were 280,300 international conference arrivals in 2004.
International Convention and Exhibition Centre – Feasibility Study Page 33 Auckland City Council July 2009
Figure 2.15 shows international conference and meeting delegates by country of origin in Australia. Figure 2.15: International Conference and Meeting Delegates in Australia
New Zealand
25%
Other Ocenia
3%
Europe
18%North East Asia
17%
South East
Asia
17%
Americas
17%
Middle East /
Africa
3%
(Source: STCRC: NBES)
An example of the range and type of conference activity hosted in Australian venues is contained in the 2007 – 2008 Annual Report of the Melbourne Convention and Exhibition Trust. The list of international and national conventions held at the (existing, prior to expansion) Melbourne Convention Centre in the 2007/2008 financial year is as follows:
� International Conference on Yeast Genetics and Molecular Biology
� The World Conference of Neuroscience
� The Australia Post LPO Conference
� The Victorian Peri-Operative Nurses Conference
� The Australian Breastfeeding Association Conference
� The IT Service Management Forum
� Vascular 2007 Conference
� The Emergency Management Conference
� The Pharmaceutical Association of Australia Conference
International Convention and Exhibition Centre – Feasibility Study Page 34 Auckland City Council July 2009
� The 9th Australian Palliative Care Conference
� The Australia and New Zealand Mental Health Services Conference
� Apimondia
� Aged Community Services Conference Australia
� The Australasian Association of Clinical Research Conference
� Australian Market and Social Research Society Conference
� Financial Planning Association National Conference
� Australian Health and Medical Research Conference
� Asia Pacific Congress of Heart Failure
� International Society of Aesthetic Plastic Surgery Conference
� Ottawa International Conference on Clinical Competence
� World Congress on Endometriosis
� Enviro 2008
� Irrigation Australia 2008
� Annual Meeting of Organisation of Human Brain Mapping
� World Mental Health Conference
� International Symposium on Forensic Science
� Australian Human Resource Institute Conference
� Scientific Meeting on Medical Imaging and Radiation Therapy.
2.3 GROWTH IN CONVENTION AND EXHIBITION CENTRES – ASIA PACIFIC The strong growth in international conference activity in the Asia / Middle East / Pacific region (refer Section 2.1) has partly been stimulated by the substantial growth in large-scale convention and exhibition centre developed in Asia and Australia during the past 10 – 15 years. Figure 2.16 illustrates the growth in conference / exhibition floor space capacity by country and venue in the Asia-Pacific Region over the past 12 years. Japan had the largest exhibition floor space until 2005 when Singapore Expo undertook a major expansion and Hong Kong opened Asia World-Expo. Australia has for this period of time dropped from third place to seventh in the Asia-Pacific Region in terms exhibition floor space capacity despite their expansions.
International Convention and Exhibition Centre – Feasibility Study
Page 35
Auckland City Council
July 2009
Figure 2.16: Exhibition Floor Space Capacity by Country and Venue in Asia / Pacific
1997
1998
1999
2000
2001
2002
2003
2004
2005
2006
2007
2008
2009
M LH
Singapore
Australia
China
Malaysia
Thailand
South Korea
Philippines
Hong Kong
Singapore Expo
Singapore Expo
MATRADE, Kuala Lumpur
Kuala Lumpur
Convention Centre
Putra, Kuala Lumpur
Indonesia
Shanghai
Bangkok
Queen Sirikit, Bangkok Japan
Tokyo
Philippine, Manilla
SMX, Manilla
Hong Kong
Asia W
orld-Expo, Hong Kong
Gold Coast
Perth
Sydney
Cairns
Brisbane
Melbourne
Jakarta
Suntec, Singapore
IntexOsaka
Pattaya
MakuhariMesse, Chiba
Adelaide
ICC Jeju, Siogwipo
COEX, Seoul
Nagoya
CNCC, Beijing
(Source: Venues web sites)
Note: 1. Left arrows illustrates venues that were built before 1997 and or venues that have been expanded since their original building year
2. Dashed lines illustrates venues of smaller exhibition floor space capacity than the venue with largest exhibition floor space capacity in the country
3. Solid lines illustrates the venue with the largest exhibition floor space capacity within the country
International Convention and Exhibition Centre – Feasibility Study Page 36 Auckland City Council July 2009
Appendix 6 contains a schedule of the major convention and exhibition centres in New Zealand, Australia and Asia.
The schedule identifies the date of opening, and (where applicable) expansion of the facilities. This confirms a significant expansion in convention centre supply, and an even greater expansion in exhibition space. Many of the Asian facilities have been developed as icons of national pride for hosting regional and international inter-governmental meetings and conferences. Hosting large-scale regular trade shows has also been a significant driver of the expansion of exhibition facilities. In the case of Australia, a significant factor in the development and expansion of facilities has been driving economic impact at a state level. Therefore, winning national conferences and exhibitions (which attract inter-state conference delegates) is important, as well as winning international conferences and exhibitions, for many of the Australian venues.
2.4 NEW ZEALAND INTERNATIONAL CONFERENCE ACTIVITY International visitor arrivals to New Zealand for the year ended December 2008 amounted to 2.46 million, of which 2.3% (or approximately 57,000 visitors) indicated their main reason to visit was to attend a conference in New Zealand.10 Figure 2.17 shows the growth in conference-related international visitor arrivals between YE December 2000 and 2008. Figure 2.17: Growth in Conference-related International Visitor Arrivals
0
10,000
20,000
30,000
40,000
50,000
60,000
70,000
2000 2001 2002 2003 2004 2005 2006 2007 2008
YE December
Conference Related Visitor Arrivals
(Source: International Visitor Arrival Statistics, Statistics New Zealand)
10 International Visitor Arrival Statistics, Statistics New Zealand
International Convention and Exhibition Centre – Feasibility Study Page 37 Auckland City Council July 2009
The international conference market has experienced a compound average growth rate (“CAGR”) between 2000 and 2008 of 6.6%, despite a plateauing of arrivals since 2005 at approximately 60,000 per annum. Factors contributing to the growth in international delegate arrivals include:
���� New Zealand’s reputation as a ‘safe’ country, building on the success of Tourism New Zealand’s 100% Pure marketing campaign
���� dedicated resourcing and focus of international conference marketing by Conventions and Incentives New Zealand and regional convention bureaus, especially in the Australian market
���� competitive airfares, especially on the trans-Tasman routes
���� new and refurbished convention facilities becoming established in the market (eg: Christchurch Convention Centre, SKYCITY Auckland Convention Centre, Auckland Convention Centre at THE EDGE®) thereby improving New Zealand’s competitiveness in the international conference market, and particularly in relation to Australian corporate and association conference markets.
As shown in Figure 2.18, New Zealand’s key source markets for conference-related visitors in 2008 were Australia (59%), Asia (15%) and the Americas (10%). Figure 2.18: Source Markets of Conference-related Visitors (2008)
Australia
59%Asia
15%
Americas
10%
Other
8%
Europe
8%
(Source: International Visitor Arrival Statistics, Statistics New Zealand)
As illustrated in Figure 2.19, between 2000 and 2008, the source markets with the highest CAGRs were Asia (9.9%) followed by Australia (7.1%).
International Convention and Exhibition Centre – Feasibility Study Page 38 Auckland City Council July 2009
Figure 2.19: Growth in Source Markets of Conference-related Visitors
0
5,000
10,000
15,000
20,000
25,000
30,000
35,000
40,000
2000 2001 2002 2003 2004 2005 2006 2007 2008
YE December
Conference-related Visitor Arrivals
Australia Asia Americas Europe Other
(Source: International Visitor Arrival Statistics, Statistics New Zealand)
2.4 CONFERENCE ACTIVITY IN NEW ZEALAND MAIN CENTRES
Based on the National Convention Activity Survey11, Auckland, Wellington and Canterbury (mainly Christchurch) hosted approximately 3,500 multi-day conferences between them in the year ended June 2008.
Auckland is dominant in terms of the numbers of conferences held in New Zealand. This reflects:
� the dominance of corporate meetings and conferences over association meetings12, supported by Auckland’s position as New Zealand’s leading commercial centre
� the dominance of major hotels, and hotel conference venues, in Auckland13 (eg: The Langham, Hyatt Regency, Stamford Plaza, Rendezvous and Hilton hotels)
� the opening of the new SKYCITY Auckland Convention Centre in 2003, and the expansion / refurbishment of conference facilities at THE EDGE® at the same time.
Figure 2.20 provides a summary of the number of multi-day conferences (both corporate and association) in the three main centres between YE June 2004 and 2008.
11 Convention Activity Survey, Angus & Associates
12 Approximately
2/3 of New Zealand conferences are corporate conferences
13 Approximately 40% of New Zealand’s major hotel room supply is in Auckland
International Convention and Exhibition Centre – Feasibility Study Page 39 Auckland City Council July 2009
Figure 2.20: Total Multi-day Conferences in New Zealand Main Centres
International Convention and Exhibition Centre – Feasibility Study Page 40 Auckland City Council July 2009
3. CURRENT AND EXPECTED FUTURE MARKET TRENDS
A number of current and expected future trends are addressed in this section including trends in convention centre design and capability and trends in international conference buyer demand.
Appendix 2 contains the results of a survey of leading international Professional Conference Organisers (“PCOs”).
3.1 SUSTAINABILITY Sustainability has become a key focus in the international (and local) conference industry largely because of increased awareness and concern of consumers regarding the ‘carbon footprint’ of travel. This may become an increasingly significant factor in conference buyers considering the choice of destination for international conferences in the future, responding to the views and perceptions of conference delegates. This presents a risk to New Zealand (and Australia) in terms of marketing to and winning international conventions, assuming environmental concerns continue to be ‘top of mind’ to the consumer, although the risk is less in relation to domestic, Australasian and Asia / Pacific conferences. Australasian destinations may become proportionately less favourable over time than if there were no environmental concerns. It is unlikely, however, that distance will become the critical decision factor in the choice of location, even if it is still one factor, for most international conferences, although it may become a critical decision factor in the choice of location for international conferences14. There is no particular reason why convention delegate arrivals to New Zealand would be worse affected than leisure visits from international visitors. Arguably, leisure travel is more of a ‘luxury’ and discretionary nature and therefore less ‘justifiable’ than international conference attendance. For example, it will always be important for professional training and development for doctors to attend medical conferences, the largest international association conference segment. Appendix 2(I) contains responses from international PCO’s to the following questions:
� If NZ was to demonstrate an outstanding commitment to sustainability in its approach to its convention centre facilities and marketing, what might that look like?
� Do you believe that the distances involved in travelling to NZ have a negative impact on NZ as a convention destination. If ‘yes’, please describe those impacts and how long-term you think they may be.
14 Alan Trotter, CEO, Conventions and Incentives New Zealand
International Convention and Exhibition Centre – Feasibility Study Page 41 Auckland City Council July 2009
The focus of the conference industry is on how to mitigate these potential impacts / risks. The industry response is still emerging, and is being pro-actively integrated into forward planning, and involves:
� new convention centres being developed to rigorous environmental standards (eg: the new ‘6 star’ Melbourne Convention and Exhibition Centre)
� accreditation / certification of existing and new venues, organisers, suppliers, etc.
There is an opportunity for the New Zealand conference industry to present a ‘leading edge’ industry-wide approach to environmental sustainability. Such an industry-wide approach should be led by the ‘flagship’ national convention centre. Other leading venues in New Zealand are already Green Globe certified15 or ISO accredited16. Green Globe is a worldwide Benchmarking, Certification and Performance Improvement programme developed specifically for industry. Green Globe assists organisations improve their economic, social and environmental sustainability while being rewarded and recognised for it. These achievements are underpinned by the Green Globe Company Standard, which sets out the guidelines, procedures and Self-Assessment Checklist organisations must follow to achieve sustainability. The Green Globe Company Standard provides organisations with a framework to conduct a comprehensive assessment of their environmental sustainability performance, through which they can monitor improvements and achieve certification. The focus is not just on ‘green’ venues but on wider ‘sustainability’ issues. This incorporates ‘green’ and Corporate Social Responsibility (“CSR”). The international event management company MCI17 has produced Sustainable Event Standards which includes the following extracts:
Driven by industry professionals seeking clear, uniform definitions of a sustainable event, two separate and unique voluntary processes are available to meeting planners, organisers and industry suppliers: BS 8901 (the specification for a sustainable event management system) and the Convention Industry Council’s APEX Green Meeting and Events Voluntary Standards.
15 Eg: Wellington Convention Centre (January 2009), Christchurch Convention Centre (applied for)
16 Eg: Wellington Convention Centre (ISO 14001, October 2007)
17 MCI Group is an independent, global association, communications and event management company. MCI provides strategy, creativity and execution in the field of association management (AMC), Congress and Exhibition (PCO), live communication, meetings, events and incentives and performance improvement programmes.
International Convention and Exhibition Centre – Feasibility Study Page 42 Auckland City Council July 2009
The current best example, and the first voluntary standard for a sustainable management system for events available to the meetings industry, is the BSI18 BS 8901:2007 Specification for a sustainable event management system with guidance for use. BS 8901 was developed by a BSI committee comprising of events industry experts. BSI has responsibility for its review and integrity. BS 8901 is a management system that provides requirements for planning and managing sustainable events of all sizes and types. The standard is applicable to the entire range of events, from large scale conferences and unique events such as the 2012 Olympics, to music festivals and air shows. It is applicable throughout the sector supply chain encompassing venues, organising companies and industry contracting firms and is aimed at the following groups:
� event organisers
� venues
� organisations and / or individuals in the supply chain. If these procedures are followed and documented in the planning, onsite and post event phases, the event can earn either self-certification designation, or be eligible to be certified by a 3rd party as a sustainable event. Although it was originally created for the UK events industry, BS 8901 is being used all around the world by organisations such as Microsoft, MPI, US Green Buildings Council and the 2012 London Olympics. Towards the end of 2009, The Convention Industry Council’s APEX / ASTM initiative will release green meeting standards for the meetings / events industry. The standards design team is comprised of the meeting industry standards body, APEX, and the United States Environmental Protection Agency’s endorsed standards organisation. These standards will be vetted through both the APEX and ASTM process. ASTM International is one of the largest voluntary standards development organisations in the world. The standards are being developed in a consensus basis and vetted throughout the international meetings / events community. The intention behind the standards is for them to complement existing, relevant certifications and criteria. The APEX / ASTM standards will be specific, measurable, performance based criteria. They will use a ticksheet and scoring level to gauge performance. They will cover the following 9 areas:
� accommodation
� audio / visual and production
18 The British Standards Institution (“BSI”) is a leading global provider of management systems assessment and certification solutions, with more than 60,000 certified locations and clients in over 100 locations worldwide.
International Convention and Exhibition Centre – Feasibility Study Page 43 Auckland City Council July 2009
� communication
� destinations
� exhibits
� food & beverage
� meeting venues
� on-site offices
� transportation.
According to BSI, BS 8901 will:
� help companies to improve sustainable performance within available budgets
� reduce carbon emissions and waste, improving the resource efficiency of the entire event supply chain
� present opportunities for more efficient planning and encourage the re-use of equipment and infrastructure.
� reduce environmental impacts such as carbon usage, waste management and effects on biodiversity
� improve social impacts such as community involvement and fair employment
� establish economic impacts such as local investment and long-term viability. The MCI Supplier Code of Conduct includes the following extracts: Introduction
As signatories of the UN Global Compact19, MCI Group is committed to promoting sustainable practices in the meetings industry. This Supplier Code of Conduct (SCC) sets the minimum performance standards for the purchases our suppliers make on behalf of our company or our clients.
Environmental Commitment MCI is taking action and making investments as an effort to begin to take responsibility for environmental impacts in areas under its control. We expect a strong environmental commitment and aggressive efforts to protect and restore the natural environment. We will favor partners who:
� have a management system demonstrating environmental commitment; publicly disclose
19 The UN Global Compact is a both a policy platform and a practical framework for companies that are committed to sustainability and responsible business practices. The Compact asks companies to embrace, support and enact, within their sphere of influence, a set of core values in the areas of human rights, labour standards, the environment, and anti-corruption. The environment principles (principles 7 to 9) are: � businesses are asked to support a precautionary approach to environmental challenges � undertake initiatives to promote greater environmental responsibility � encourage the development and diffusion of environmentally friendly technologies.
International Convention and Exhibition Centre – Feasibility Study Page 44 Auckland City Council July 2009
� environmental impacts and activities through regular reporting;
� eliminate toxic and hazardous substances from products and operations;
� increase efficiency and thereby minimize pollution and waste;
� reduce use of natural resources including raw materials, energy and water;
� take responsibility for proper waste management and any environmental problems
� associated with disposal of wastes;
� promote the use of renewable energy through support of innovation and integration in operations.
MCI seeks to work with business partners who have published commitments to environmental responsibility and encourages all suppliers to seek industry specific 3rd party environmental certification as a way to express their commitment. With proven scientific integrity, triple bottom line focus and ability to build stronger businesses, MCI has a clear preference for the following certification schemes: Green Globe, Swan and LEED. Other certifications will be considered though additional performance measures may be requested as evidence of an engaged commitment to Corporate Social Responsibility.
Partnership MCI understands that sustainability requires collaboration and engagement with all its suppliers. MCI invites suppliers who respect its SCC to join the effort to promote more responsible business practices and to actively do their utmost to achieve the standards outlined here.
3.2 INCREASING USE OF NEW TECHNOLOGY Improved video conferencing technology provides both risks and benefits for the conference industry. The risks are around the potential for substitution of video conferencing for travel to meetings and conferences. To the extent that this risk is real, it is more significant in relation to corporate meetings of short duration (eg: part or full day meetings) rather than multi-day conferences, and generally in relation to smaller groups rather than larger groups. It is unlikely that video conferencing is a practical alternative to multi-day international association meetings and conferences. The benefits of improving communication and video conferencing relate to the increased ability to have expert input from a wider range of presenters (including keynote presenters) by video link as a substitute to their attendance in person. This
International Convention and Exhibition Centre – Feasibility Study Page 45 Auckland City Council July 2009
allows greater flexibility, richness and depth in conference content, and greater cost efficiency. Appendix 2C contains responses from international PCO’s to the following questions:
� What should be the role of convention centres in delivering technology based services, eg: audience polling, live broadcasting, web casting, satellite links? Options might include (a) no role at all and everything outsourced, (b) basic services complemented by outsourcing or (c) full service which is always at the forefront of technological innovations
� If you consider that the convention centre needs to provide technology based services rather than outsourcing, how much will the venues equipment and technical skill influence your decision to book that venue?
� If you consider that the convention centre needs to provide technology based services rather than outsourcing, which services in particular would be required?
Improved technology continues to provide benefits for conferencing. Considerations for new conference centre design include the following:
� virtual 3D Videoconferencing requires large bandwidth, as with webcasting of Richmedia presentations that synchronise video, audio and graphics simultaneously to the internet in real time; both technologies require reliable Internet Protocol (“IP”) bandwidth; Videoconferencing equipment, by necessity, is capable of interfacing with ISDN and IP networks from standard definition to full HD
� integration with live video coverage, webcasting and Richmedia archiving has become standard practice with some international organisations such as UNESCO
� the brightness threshold for daylight viewing is now available (meaning conference rooms do not need to be darkened for video presentations) and the trend in the immediate future will be to high definition images
� HD 1980x1020 resolution is now in common use but this is just the beginning of the HD trend; Sony has recently introduced the 4K standard for digital cinema
� multi-lingual simultaneous translation systems are now available with digital information, speaker ID and wireless transmission
� wireless voting systems and hearing aid loops also need to be accommodated.
3.3 COMMUNICATIONS AND MARKETING TO POTENTIAL ATTENDEES
Evolving communication technologies provide both risks and opportunities for the conference industry.
International Convention and Exhibition Centre – Feasibility Study Page 46 Auckland City Council July 2009
The risks involve increasing use of the internet and other on-line forums for communicating and sharing information and ideas globally. There is the potential that increased sharing of information, ideas and thought leadership through increasingly effective and cost-effective technology solutions could reduce the degree of reliance of some organisations (both corporate entities and associations) on face-to-face meetings and conferences, and therefore result in fewer conferences than might otherwise be the case. Similarly, such communication channels may mean that conference delegates could be more challenging to attract, and delegate numbers be more difficult to achieve than previously. The benefits of evolving communication technology for international conferences relate to marketing opportunities. Only a limited amount of marketing to potential conference delegates is now done via print. A website is now the main repository for information about a conference. However, it is not enough to just ensure a website has a top place in the search engine listings. Marketing support is required to drive website hits. Different tools are needed depending on the target audiences, eg: well presented e-mail broadcast to Baby Boomers, SMS text to Gen X and YouTube clips or Twitter for Gen Y. Marketing tools continue to evolve. It is important to incorporate new tools into marketing as they become ‘mainstream’ for the particular target audiences for each conference.
3.4 COMMUNICATIONS AT CONFERENCES
Interactive learning is now an integral part of conferences. This has an impact on convention centre design and technical fitout. Examples include:
� pre-conference and onsite webinars on selected topics to simulate interest in the programme
� highly interactive satellite-linked sessions, eg: live broadcasts from operating theatres
� immersive telepresence (higher quality video-conferencing). Delegates are now being asked to turn their mobile phones ‘on’ rather than ‘off’ in sessions, as software provided at the conference enables them to be used as an audience response system.
International Convention and Exhibition Centre – Feasibility Study Page 47 Auckland City Council July 2009
Facilities which have been used for some time continue to be popular:
� badges with barcodes or magnetic strips
� internet cafes
� programme downloads to PDAs
� SMS to notify a change to the programme or remind speakers of their session time / venue.
Gadgets using RFID (radio frequency identification) facilitate networking amongst delegates and also give exhibitors information about interest in their stand, eg: which products delegates looked at and how long for. Electronic ‘scientific posters’ (read via computer) are becoming the norm rather than displaying them on panels. This does save space, but it is important that there are plenty of computers/work stations available to access the technology.
3.5 VIRTUAL CONFERENCES Aspects of virtual conferencing already feature in many conference sessions, eg: speakers presenting via satellite links, ‘webinars’, and live broadcasts. While virtual conferencing, in its truest form, may be a feature of corporate life within multinationals, it is not used often (at least at present) in the association convention environment. The adage that ‘you can’t have a virtual beer’, and all that means in terms of human connection and communication, seems to be prevailing.
3.6 SOCIAL FUNCTIONS
Presentation of Awards at a gala function is often a feature of a congress. However, there are few venues which are large enough or have the right ambience for these functions. Marquees are costly, difficult to light, not particularly comfortable and, when it is wet, very unpleasant spaces. There is a trend to more ‘post-session’ drinks rather than multiple dinners, but there is always at least one special dinner during a congress.
3.7 HIGH AMBIENT LIGHT VENUES
A discussion on AV solutions in high ambient light venues is interesting and raises many other issues that venue managers and designers need to consider at the concept stage.
International Convention and Exhibition Centre – Feasibility Study Page 48 Auckland City Council July 2009
Over the past 15 years projection equipment has become brighter and it is now possible to view video and data information in daylight. However there is a price to pay. From a venue perspective, it means heavier power requirements, higher running costs and having the ability to manage and pass on those costs. The AV supplier has a higher investment to make, maintenance and and running cost increases exponentially. And finally the client needs to have the budget to be able to pay for this brighter picture. 35mm slide projectors and 3 gun video projectors were in use in the mid 90s. Sony Superbright was rated with an output level of 350 ansi lumens. By comparison, 5000ansi lumen projectors are in common use today. During the Beijing Olympics 30,000ansi lumen projectors were used in the main arena. And LED ‘video walls’ are used for daylight applications. High brightness solutions are already available. However, bright screens usually dictate the need for a brighter stage, hence more lights and a higher load on the available power within the venue. More power consumption also means more heat generated and more noise from fan cooling of equipment. Air-conditioning has to work harder and acoustics treatment is even more important because of equipment noise. On top of all this, is the capacity to be able to support this equipment from the roof structure because we have now introduced some very heavy truss, motors, lights and projectors. And there are still set elements to think about that will add more weight.
3.8 OTHER AV / TECHNOLOGY TRENDS
� Rooms that allow for turnaround from conference to dinner setting within hours
� Truck access to room
� Lots of parking
� “Ceiling” height 12m minimum
� Full height walkway above “ceiling”
� Full scaffold grid to hang lights, sound, AV
� Grid to allow sufficient space to pinspot every dinner table, hang stage lights, set and audio system
� Ceiling able to support an additional “mother grid”
International Convention and Exhibition Centre – Feasibility Study Page 49 Auckland City Council July 2009
� Data and Power patches from ceiling to utilities room and conference floor; audio, video, power and data patch around the room.
� Cable trenches that are accessible
� All power on common technical earth
� 3 phase power in every sector of the venue
� Service corridor right around the room
� Store rooms available for empty boxes off service corridor
� Storage space for portable stage and sets
� Crew room near green room for performers with audio / video links to performance area.
� Fibre optics to venue and data bandwidth available on demand (user pays )
� Venue to be able go from daylight to full blackout at the touch of a button
� Acoustics suitable for musical performance
� Access to roof for install of temporary satellite dish and internal wiring from room to roof
� Direct dial telephone lines
� Network capacity for internet cafes and exhibition needs
� Parking outside for Outside Broadcast (“OB”) trucks, power and cable reticulation for OB facilities
� Velcro sensitive walls
� Allow perimeter grid to hang banners
� Sufficient number of Breakout Rooms
� Display / exhibition space
� Pre-function areas
� Theatre with full fly tower and seating that can accommodate a dinner setting (nice to have if money is no object)
International Convention and Exhibition Centre – Feasibility Study Page 50 Auckland City Council July 2009
4. NEW ZEALAND’S COMPETITIVE POSITION Based on ICCA data, New Zealand currently attracts approximately 0.5% of all international association conferences, similar to the levels achieved by Indonesia, Croatia, Colombia, and Uruguay. Our competitive position is currently compromised by the fact that three of our largest venues (THE EDGE®, Wellington Convention Centre and Christchurch Convention Centre) are all multi-purpose venues that rely on arts-focused spaces to provide them with the critical scale. Furthermore, for conferences of any significant size (eg: 600 delegates plus) that require exhibition space, it is necessary to have delegates moving between multiple buildings. These current arrangements mean that from a pure physical facility perspective, New Zealand is becoming an increasingly uncompetitive destination, particularly as cities in Australia and Asia continue to upgrade and expand their facilities. Despite this, New Zealand is continuing to attract a small number of international conferences. This can partly be attributed to the increased marketing effort that is being applied (eg: the Ministry of Tourism-funded Conference Assistance Programme operated by Conventions and Incentives New Zealand). There is an inherent interest on the part of many conference organisers to bring their events to New Zealand20. However, it is unrealistic to expect that these marketing activities can continue to overcome our facility deficiencies. This was highlighted with the staging of the 2006 International Bar Association Conference in Auckland, one of the largest conferences ever to be held in New Zealand. Despite the conference generally being regarded as a success, the organising committee has since re-written the event guidelines to preclude the conference being held in another venue where multiple buildings are required. This was a direct response to the logistical issues faced during their Auckland event. Detailed comments regarding the IBA Conference are contained in Appendix 4. In a general sense, therefore, New Zealand’s key current weaknesses relate to venue scale, quality, and functionality while the country’s key strengths relate to its destination appeal and support infrastructure. The section below provides a brief overview of New Zealand’s specific strengths and weaknesses in targeting the international conference market.
20 Alan Trotter, CEO, Conventions and Incentives New Zealand
International Convention and Exhibition Centre – Feasibility Study Page 51 Auckland City Council July 2009
4.1 CURRENT STRENGTHS AND WEAKNESSES OF NEW ZEALAND
New Zealand’s key strengths are as follows:
� based on our industry consultation, we are advised that New Zealand enjoys strong destination awareness and profile assisted by the international marketing of a variety of New Zealand agencies including Tourism New Zealand21
� New Zealand has a wide range of strong local host organisations22 that are well respected internationally and have representatives regularly attending international conferences throughout the world. Conventions and Incentives New Zealand is actively working with many of these host organisations through the conference assistance programme to develop conference business for New Zealand
� Auckland enjoys good international air connections to a wide variety of countries
� Auckland offers a good range of accommodation options from five star to three star hotels that suit the various needs of different conference delegates
� our existing venues are generally well located in relation to support infrastructure including hotels, bars, restaurants, etc
� we have good capability in relation to plenary capacity due to the large auditoriums at most of New Zealand’s major convention centres, which have allowed these venues to host large conferences that have been able to compromise other elements of the conference (eg: exhibition, banquet, break-out sessions).
These strengths are, however, not all exclusive to Auckland and New Zealand, and are countered by some significant weaknesses including:
� a general lack of flexibility within our major conference venues as the spaces typically have not been developed specifically for the needs of conferences and exhibitions
� a general inability to accommodate all conference requirements on site for larger conferences due to a lack of flat floor space, which particularly impacts on exhibitions, banquets, and break-out sessions
� generally poor circulation within the venues due to the fact that most venues are multi-purpose and have not specifically been designed to facilitate large flows of delegates
� need to work in “precincts” of venues for the larger conferences in Auckland Wellington and Christchurch – international buyers are becoming less
21 Alan Trotter, CEO, Conventions and Incentives New Zealand; Jan Tonkin, Managing Director, The Conference Company
22 Examples include medical and science associations, university departments, and leading industry (eg; dairy, forestry) organisations. Examples of local host associations and conferences held in New Zealand are included in Appendix 3.
International Convention and Exhibition Centre – Feasibility Study Page 52 Auckland City Council July 2009
prepared to accept this compromise, as demonstrated by the International Bar Association
� significant venue / precinct compromises are increasingly unacceptable for the organisers of major conferences (eg: international association conferences) who are becoming increasing selective in relation to their requirements and “spoilt for choice” in terms of dedicated international-standard facilities throughout the world
� relatively low resourcing of international marketing by comparison with overseas competitors, including Australia.
4.2 OPPORTUNITIES TO BE LEVERAGED
There are a number of specific opportunities that New Zealand can leverage in order to optimise the outcomes from developing an international standard convention centre. Key opportunities we have identified include:
1. 100% Pure New Zealand The convention industry, as with many elements of the travel industry, is becoming increasingly focused on environmental initiatives. New Zealand has chosen to market itself as 100% Pure and this positioning should be leveraged to offer conference organisers a conferencing option that is environmentally aware. The importance of environmental considerations is highlighted by the fact that all four of Australia’s largest conference venues feature environmental information on the home pages of their websites.
2. Targeting international conferences hosted in Australia ICCA data shows that in the ten years ending 2007, Australia has hosted over 1,700 international conferences. In effect these conferences have demonstrated a willingness to travel to this part of the world and represent a significant pool of potential conferences that should be targeted for the proposed convention centre. The rotational nature of international association conferences means that New Zealand would have a good opportunity to secure these conferences when they next look to travel to Australasia.
3. Development of a distinctive venue that showcases New Zealand A common criticism of international convention centres is that they “could be anywhere in the world” and that delegates fail to get a sense of the destination they are visiting. An opportunity exists for New Zealand to develop a distinctive conference venue that showcases the country and reflects our 100% Pure positioning.
4.3 CHALLENGES TO OVERCOME In seeking to pursue a larger piece of the international conference market, it is important to acknowledge key challenges that New Zealand will need to overcome.
International Convention and Exhibition Centre – Feasibility Study Page 53 Auckland City Council July 2009
The first is that New Zealand is a long-haul destination. This has implications in terms of the carbon miles associated with delegates’ travel and means the on-ground components of the conference will need to be very efficient to deliver an overall conference that is as sustainable as a short-haul competitor. The long-haul travel will also likely have implications in terms of “wash-down” in delegate numbers. As such, a conference in the northern hemisphere might attract 2,500 delegates but this might reduce to 2,000 delegates in a long-haul destination such as New Zealand. A second key challenge is the emerging tendency for conference venues to “buy” conferences. This trend has emerged as conference organisers have begun to recognise that their events are of value to destinations for the economic impact they bring. As a result, many organisers are seeking direct or indirect financial incentives to bring their events. This trend means it will be important that the venue has sufficient sales and marketing budget to develop appropriate strategies.
International Convention and Exhibition Centre – Feasibility Study Page 54 Auckland City Council July 2009
5. SITE SELECTION CRITERIA AND LOCATION ANALYSIS We have reviewed the previous reports regarding an international convention centre in Auckland and engaged with key stakeholders as part of this study to ascertain the key criteria that should be adopted in identifying the appropriate precinct location for the proposed convention centre. The criteria are based on consultation with conference industry representatives, including the important buyer perspective. The attributes are summarised in Table 5.1 in order of importance. Proximity to a critical mass of appropriate standard hotel rooms is regarded as the single most important attribute due to the convenience this provides conference organisers and delegates. The second most important attribute has been identified as the ability to accommodate the proposed venue (as specified in Section 6) within the precinct. The three following attributes all relate to components of transport and venue accessibility including ease of pack-in / out, car parking, and public transport. The other attributes relate to profile, synergy with existing meeting infrastructure, and proximity to entertainment precincts for delegates. Table 5.1: Location Selection Attributes (in order of importance) Attribute Proximity to necessary number of hotel rooms (widest range preferable; predominantly 4* - 5* rooms) Potential site size relative to proposed venue floor area requirements (cost / benefit issue) Site access / egress Proximity to car parking Proximity to public transport facilities Profile / icon potential (especially internal) Flexibility / synergy with existing / nearby meetings infrastructure Proximity to entertainment / retail / food and beverage (Source: Horwath HTL)
These attributes tend to mainly reflect, either directly or indirectly, the perspective of the conference ‘buyer’ / organiser or delegate. These are the factors that will, ultimately, determine the long-term success and competitive advantage of the convention centre, including its location. The location selection attributes do not specifically factor in other considerations, such as stakeholder views about the priority of location options, or the potential to maximise economic (or other) outcomes for financial stakeholders in the facility. These additional factors could become important, and relevant, decision factors.
5.1 CBD VERSUS NON-CBD Based on the location attributes identified above, a CBD location is the most obvious and advantageous option for an international convention centre.
International Convention and Exhibition Centre – Feasibility Study Page 55 Auckland City Council July 2009
This is primarily because the CBD is the only precinct that provides the critical mass of appropriate accommodation to support the centre’s operation. Furthermore, existing transport links and infrastructure have been designed to primarily service the CBD area, and the CBD has the greatest concentration of existing meetings infrastructure and entertainment facilities. All existing major Australian venues are, for these reasons, located in the CBD or CBD fringe, as opposed to non-CBD locations.
5.2 ALTERNATIVE CBD PRECINCTS As part of this study we have been asked to consider the relative potential of three CBD precincts being CBD Fringe, Core CBD, and Waterfront. We have undertaken this using the attributes identified above and drawing on our discussions with key stakeholders.
5.2.1 CBD Fringe
For the purpose of this study we have interpreted CBD Fringe to be the area extending west from Lighter Quay through to Wynyard Point. This precinct is an area identified for significant redevelopment and therefore has appeal in terms of the potential to create a site of appropriate size (including flexibility for future expansion). In addition, if located at the Lighter Quay end of the precinct there could be potential to leverage off the proposed Marine Events Centre. The key disadvantages of this precinct include the relative distance from most hotel accommodation (the Westin Hotel excepted) and the inferior transport links compared to the Core CBD and Waterfront locations. These precinct attributes may, of course, be remedied over time but will have implications regarding the timeframes for development of a convention centre.
5.2.2 Core CBD
The key advantages of the Core CBD precinct relate to the close proximity to the vast majority of Auckland’s hotel accommodation and the proximity to key public transport nodes and car parks. The developed nature of the Core CBD means it is highly likely that demolition of existing buildings will be required to create a site of sufficient size for the proposed facility. In creating a site of appropriate scale it will also be necessary to ensure the centre can be developed with its own “profile”.
5.2.3 Waterfront
In recent years a number of significant convention centres around the world have been developed on waterfront sites. Advocates for these facilities focus on their
International Convention and Exhibition Centre – Feasibility Study Page 56 Auckland City Council July 2009
iconic nature and contend that these attributes assist the venues in achieving higher levels of activity than they otherwise would. In the context of Auckland we have focused on the Waterfront precinct being the area east of Princes Wharf. A facility in this area would enable some leveraging of Auckland’s harbour location but would also likely add to the capital cost of the development due to:
� having to build at least some portion of the building over the water
� having to build a more iconic facility that is sympathetic to the high profile waterfront location (especially given the significant bulk of a convention centre and that most local residents would only observe the building from the outside).
Compared to the Core CBD, the Waterfront location would be at a relative disadvantage in terms of proximity to the majority of Auckland’s CBD hotel accommodation.
International Convention and Exhibition Centre – Feasibility Study Page 57 Auckland City Council July 2009
6. SCALE We have reviewed the three convention centre scale options contained in the February 2006 research report “New Zealand Convention Centre Business Case and Facility Recommendations” (Horwath Asia Pacific Ltd). These were described as:
� medium / base case facility option (20,700m2 Gross Floor Area (“GFA”))
� smaller facility option (15,350m2 GFA)
� larger facility option (26,950m2 GFA) The report found that “the medium facility and the larger facility deliver a similar benefit / cost ratio, significantly above that for the smaller facility”23. The Executive Summary24 included the following conclusions:
“Based on our market research, estimates of potential new market demand creation / stimulation and other analysis contained in this report, we conclude that:
� there is sufficient evidence to justify progressing further in the planning and advocacy for the development of an international standard convention and exhibition centre to be based in the Auckland CBD
� of the three scenarios we have analysed, the scale of the smaller option does not adequately meet current and emerging market expectations for such a facility over the period of the next 10 years (and beyond)
� the scale of the medium scenario meets current and emerging market expectations to a reasonable extent but has some limitations in terms of its ability to host larger scale conference-related exhibitions and allow full-scale banqueting concurrently, or to allow concurrent independent events to be hosted without compromises
� the scale of the larger scenario fully meets current and foreseeable market expectations including in relation to the hosting of larger scale conference-related exhibitions full-scale banqueting concurrently, and allowing concurrent independent events to be hosted without compromises
� while the Cost Benefit Ratio of the larger-scale scenario, based on our analysis, is slightly lower than for the medium scenario, the ratio does not take into account greater intangible benefits of the larger-scale scenario
� because none of the scenarios take into account land costs, location issues and therefore other potential location or operating cost synergies, it is not yet possible to be conclusive as to which option is either technically or financially feasible or optimal
23 Page 102, February 2006 research report “New Zealand Convention Centre Business Case and Facility Recommendations” (Horwath Asia Pacific Ltd)
24 Page 26, February 2006 research report “New Zealand Convention Centre Business Case and Facility Recommendations” (Horwath Asia Pacific Ltd)
International Convention and Exhibition Centre – Feasibility Study Page 58 Auckland City Council July 2009
� further detailed research and planning is justified into the development of an international standard convention and exhibition centre to be located in downtown CBD Auckland which meets (as a minimum) the criteria of the medium scenario contained in our analysis.”
We have undertaken limited interviews with key “buyer” and “seller” representatives in New Zealand and the leading Auckland venues25 to verify these conclusions and to obtain an updated view of which option should be regarded as the optimal scale for the current feasibility analysis. The clear view is that the larger facility (27,000 m2 GFA) should be regarded as the optimum on the basis that:
� it provides much clearer incremental capability to any existing or planned conference facilities in New Zealand
� it is more clearly competitive with the ever-expanding capacities and capabilities of the Australian and Asian venues
� it provides the highest degree of flexibility and convenient and effective ‘flow’ while minimising compromises
� it provides the highest degree of ‘future proofing’
� it provides the greatest future potential for generating maximum venue operational cashflows through maximising event numbers and utilisation.
Figure 6.1 below shows the ‘larger’ facility option contained in our February 2006 report. It should be noted that this was developed for the purposes of producing initial quantity survey estimates, and does not represent an indicative or recommended floorplan or layout. In our 2005 consultation with other major New Zealand convention centres (in Christchurch and Wellington) the key message was that their support for a national convention centre was conditional on the national facility being clearly differentiated in scale and capability from other New Zealand facilities, and not be compromised in terms of capability, thereby maximising the chances of the new facility ‘growing’ the overall market and increasing New Zealand’s overall capability, and minimising the risk that a new facility would ‘cannibalise’ existing business. This position appears to be fully reflected in the position of VBase, the Christchurch City Council-owned manager of the Christchurch Convention Centre, in their February 2009 LTCCP submission to Christchurch City Council regarding a proposed $82 million expansion of the existing convention centre facilities. The paper states, in the Executive Summary and Section 5.2:
“This paper further proposes the Convention Centre expansion be incorporated into a national strategy as stage one of a roll out of infrastructure investment that includes the building of a national convention centre in
25 Conventions & Incentives New Zealand (including IAEG-funded CAP programme); Tourism Auckland (including Business Events team); SkyCity Entertainment Group; THE EDGE
®
International Convention and Exhibition Centre – Feasibility Study Page 59 Auckland City Council July 2009
Auckland. The expanded Convention Centre can play a complimentary and supporting role in delivering a stronger overall position for New Zealand in the lucrative international conference market26.”
“An expanded Convention Centre could play a critical role in a national strategy for attracting more international conferences to New Zealand.
“The debate around the development of a national convention centre has been around for many years with a number of reports commissioned in support of the centre being based in Auckland. More recently there have been calls for public funding to support the building of a national convention centre. Convention and Incentives New Zealand (CINZ) released its International Strategic Plan in June 2008 and committed to supporting, through its lobbying role, a national centre being built. The Tourism Industry Association (TIA) 2008 election manifesto calls for the Government to support building a $200 million - $300 million national convention centre in Auckland. Industry insiders say the figure being spoken of is $400 million.
“Our proposal contemplates a national convention centre being built in Auckland. As part of a national strategy, the expansion of the Christchurch Convention Centre would be stage one of a two-staged infrastructure investment plan to deliver a stronger overall position for New Zealand in the lucrative conferencing market. Stage Two would be the development of the national convention centre.
“A further benefit of this approach is that if the development in Auckland proceeds in the Aotea Square precinct, as has been proposed, the existing Auckland facility would be out of action for many months, affecting New Zealand’s ability to maintain its profile in the competitive international market.
“The expanded Christchurch venue would provide a facility of substantial scale to protect New Zealand’s position while investment in Auckland was undertaken to support the roll out of the longer-term strategy.
“The proposed development of the Christchurch Convention Centre would therefore play a complimentary and supporting role to the proposed national convention centre in Auckland.
“The investment in both convention centres, as part of a government-driven strategic plan, would leverage New Zealand’s two international airport gateways as well as other tourism infrastructure in the international conferencing season. That season extends for a period of 8-9 months and is complimentary to the peak season for leisure tourism which is a comparatively narrow window of only 2-3 months27.”
26 Executive Summary, page 2
27 Section 5.2, pages 9 - 10
International Convention and Exhibition Centre – Feasibility Study Page 60
International Convention and Exhibition Centre – Feasibility Study Page 61 Auckland City Council July 2009
Based on our February 2006 report, the key features of the public space within this venue are:
� a dividable plenary auditorium seating for 3,000 delegates (although the facility has the potential to host more than 3,000 delegates if necessary)
� a “high-tech” flexible flat-floor space for exhibition / break-out space / banquet of 6,000m2
� a “medium-tech” flexible flat floor space for exhibitions of an additional 3,000m2 – this could subsequently be fitted out to the high-tech standard if required
� a “lower-tech” flexible flat floor space for exhibitions of an additional 3,000m2
� pre-function space of 3,500m2
� flexible and sizeable break-out space of varying sizes with [some] natural light, now assumed at 2,600m2 (up from 1,000m2 assumed in 2006, transferred from ‘back of house’ space)
� potential for a purpose-built dedicated lecture theatre in addition to the auditorium, or moveable raked seating built into an exhibition hall (not specifically costed)
� allowance for rooms and offices for speakers, preparation, media, interviews, secretariat, storage, etc (costed either as part of the 4,400m2 back of house space, or incremental break-out space).
Key strengths of this concept are:
� the plenary auditorium is of sufficient size to meet the needs of at least 95% of international conferences
� the flat floor space is of sufficient scale to meet the full conference requirements of at least a 3,000 delegate conference, including exhibition, break-out space, and banquet
� the flat floor exhibition space is of sufficient scale to meet the size requirements of all trade exhibitions currently held in New Zealand, including TRENZ
� the size of the various elements within the venue are of sufficient scale to allow the concurrent hosting of two conferences of up to approximately 1,500 delegates, or a conference and public tradeshow / exhibition concurrently
� the flat floor exhibition space is approximately the same as that currently available at the ASB Auckland Showgrounds and is of sufficient scale to host all of the public shows currently hosted in Auckland
� the flat floor exhibition space is 6.5 times larger than the main hall of the [existing] Christchurch Convention Centre (which is proposed to be replicated by a second hall of approximately the same size)
International Convention and Exhibition Centre – Feasibility Study Page 62 Auckland City Council July 2009
A potential weaknesses of this concept is:
� the flat floor exhibition capacity of the venue (excluding the flat floor auditorium of 4,500 m2) does not lift New Zealand’s capability above the level at the ASB Auckland Showgrounds.
However, the rationale for developing an international convention centre for New Zealand is not predicated on developing an exhibition centre for stand-alone tradeshows and exhibitions, or replicating or competing with the ASB Auckland Showgrounds. Such an expansion could only be contemplated if it was planned to close down the recently expanded ASB Auckland Showgrounds. We have not assumed that the proposed convention and exhibition centre will win any exhibition business at the expense of the ASB Auckland Showgrounds. The substantial expansion of facilities in the Asia / Pacific region (especially in Asia, and in Australia) to cater for such shows and exhibitions is, in our view, not justified in New Zealand.
International Convention and Exhibition Centre – Feasibility Study Page 63
Auckland City Council
July 2009
7.
CAPITAL EXPENDITURE ANALYSIS
A summary of capital cost estim
ates of alternative convention centre scenarios follows, as explained further in Section 7.
International Convention and Exhibition Centre – Feasibility Study Page 64 Auckland City Council July 2009
7.1 SCHEME COMPOSITION AND ASSUMPTIONS
7.1.1 Scheme composition
The convention centre costs have been based on and should be read in conjunction with the following information:
� Larger Facility Convention Centre plan indicating a total floor area of 27,000m2 of which only the 2,600m2 breakout rooms are at an upper level
� The scheme comprises the following accommodation assumptions:
High Tech Exhibition Hall 6,000m2
Subdividable Auditorium 4,500m2
Prefunction Foyer 3,500m2
Low Tech / Medium Tech Hall 6,000m2
BOH / Kitchen and Storage 4,400m2
Breakout Rooms 2,600m2
Total Accommodation 27,000m2
� Cost options include the assumed siting of the convention centre on:
Waterfront Options
� full convention Centre on Bledisloe Wharf
� half on and half off Bledisloe Wharf
� non specific wharf (not Bledisloe)
CBD Site
� non-specific location
Wynyard Point
� non-specific location.
7.1.2 Basis of costing
Convention Centre costs have been benchmarked against the Melbourne Convention and Exhibition Centre that achieved a 6 star Green Star Environmental rating and was completed in 2009.
We have obtained construction costs / m2 from Multiplex who were the Design and Construction main contractor. These costs have been adjusted to compensate for the scale of the development – the Melbourne Convention Centre comprised 70,100m2 of accommodation.
Escalation – the Melbourne Convention Centre was tendered in 2006.
International Convention and Exhibition Centre – Feasibility Study Page 65 Auckland City Council July 2009
7.1.3 Location specific costs
7.1.3.1 Waterfront
Waterfront costs options include an ‘iconic building’ cost premium. A median cost premium of 30% addition to the base construction costs has been included in each of the three cost scenarios. We understand that a number of locations for the siting of a convention centre at the waterfront are under consideration. A number of reports on the structural capacity of the various wharfs have been undertaken by consultants for both the Auckland City and Auckland Regional Councils. From the information we have reviewed, the Bledisloe Wharf is the only wharf with the structural capacity for a major building to be constructed without significant upgrade or rebuilding of the wharf. In this respect, we have considered three alternatives for the waterfront:
� convention centre on Bledisloe Wharf no wharf upgrade / rebuild
� half convention centre on Bledisloe Wharf 12,200m2 of wharf rebuild
� other wharf site full 24,400m2 of wharf rebuild.
Escalation Provisions of 4 years to the 3rd quarter 2013 included in the costs assessment. This allows for 2.5 years negotiation and implementation of the port relocation/ design to ensure wharf availability and 2.5 year construction.
7.1.3.2 Wynyard Point
No iconic cost premium included although this may apply depending on the final location on the point to be considered (ie: Point Park). Escalation Provisions of 9 years to the 3rd quarter 2018 included in the costs assessment. This allows for a protracted negotiation and site remediation programme with the various tenants on Wynyard Point prior to construction.
7.1.3.3 Core CBD
No iconic cost premium included although this may apply depending on the final location in the Central Business District (eg: Aotea precinct) Escalation Provisions of 4 years to the 3rd quarter 2013 included in the costs assessment. This allows for 2.5 years design and 2.5 years construction.
International Convention and Exhibition Centre – Feasibility Study Page 66 Auckland City Council July 2009
7.2 EXCLUSIONS
The following exclusions apply to all sites except where noted:
� GST
� finance charges
� land purchase costs including compensation payments or relocation costs of affected tenants
� site remediation costs including demolition / alteration of existing structures to accommodate the proposed convention centre and removal of contaminated ground.
� major service diversions / relocations – all costs assume the services for each option are readily available at the chosen site boundary
� construction of new buildings required to be demolished for the convention centre – ie: the Civic Admin Building in Aotea Square or new wharf and admin buildings for the Ports should Bledisloe Wharf be the preferred option.
� marketing costs
� dredging of sea bed / sea wall upgrades or reclamation of additional land (Wynyard Point / new wharf options only)
� public open space/ street works / landscaping outside of the footprint of the convention centre including pedestrian bridges / underpasses / additional wharf construction for pedestrian and vehicular access
� development contributions
� icons, artworks and feature sculptures
� pumping stations for drainage
� stand-by generator.
International Convention and Exhibition Centre – Feasibility Study Page 67 Auckland City Council July 2009
8. OPERATING PROJECTIONS We have developed operating projections for the proposed international standard Auckland Convention Centre in the context of:
� the strong destination appeal of New Zealand that has been developed through the long-standing marketing activities of Tourism New Zealand and Conventions and Incentives New Zealand
� the types of conferences that have been attracted to New Zealand’s largest existing venues (as identified in Section 2)
� the record levels of activity and financial performance at many of Australia’s large convention centres (as identified in Section 3)
� the relative strengths and weaknesses of Auckland as a conference destination (assuming a new convention facility)
� the scale of facility, as identified and justified in Section 6, which will ensure the facility is clearly positioned as New Zealand’s only international standard facility thereby avoiding the “internal competition” that exists amongst Australia’s state facilities
� the range of non-conference activity that typically is accommodated in convention centres (as evidenced in Australian venues)
� the assumed “supply” of other convention venues / facilities in Auckland. With regard to this last point, consistent with our 2006 analysis, we have assumed that there will ultimately only be two “major” facilities in Auckland, including the Sky City Convention Centre. The rationale for this assumption is that a proliferation of venues in Auckland competing for conference and exhibition market share would almost certainly mean:
� an unreasonable amount of price competition, to the extent that venue pricing is discounted to an excessive extent
� some venue stakeholders deciding ultimately to exit the conventions and / or exhibitions market to concentrate on other uses.
Assuming that Auckland City Council is a major stakeholder in at least one major venue, we suspect that the City would not tolerate a long-term proliferation of major venues competing for much the same business if the City is also, as a result, funding larger than necessary cash operating deficits. The projections outlined below are for a stabilised year of operation (which we would anticipate to be around Year 5). Activity levels in the initial years are more difficult to project as they are likely to be influenced by two conflicting factors. The first is that conferences have a long lead time (particularly larger international conferences) and the conference organisers are generally reluctant to commit major conferences to venues that have not been completed at the time of the conference bid process. The second is that conference organisers are always seeking new destinations for conferences (particularly more regional and domestic conferences that rotate
International Convention and Exhibition Centre – Feasibility Study Page 68 Auckland City Council July 2009
between a relatively small number of destinations). This can create a “honeymoon” effect for a new venue.
8.1 PROJECTED ACTIVITY LEVELS
8.1.1 Conference Activity
In developing conference activity projections, we have considered the activity both in terms of the origin of the conferences (as per Section 2) and the average size of the conferences. As detailed in Table 8.1, we project the proposed facility could, on average, attract approximately 35 conferences per annum. In total, this is below the number of conferences held at the leading Australian venues (eg: Melbourne Convention Centre hosted 41 conferences in 2007/08) and reflects the smaller domestic market in New Zealand relative to Australia. In terms of international conferences, however, we believe the facility is likely to have a higher number of conferences than many of the Australian venues due to the relative lack of “internal competition” for international conferences. This is reflected in the 25 international conferences projected in a stablised year, compared to the 18 international conferences hosted at the Melbourne Convention Centre in 2007/08. New Zealand’s strong relative performance in the international conference market, in the context of the size and standard of our current venues (as illustrated in Section 5.2), provides confidence that this level of performance is achievable. Table 8.1 Mix of Conferences Attracted by the Proposed Facility
Conference Size
(delegates) Global Asia-Pacific Australasian Domestic Total
Major
(2,500 average)
3 1 - - 4
Large
(900 average)
4 3 4 1 12
Medium
(400 average)
1 1 6 4 12
Small
(150 average)
- - 2 5 7
Total 8 5 12 10 35
Average Size 1,440 1,120 530 330 760
Note: We have assumed that 1 medium Australasian, 1 medium Domestic and 5 small Domestic conferences per annum are not incremental to Auckland and are therefore excluded from our subsequent economic impact analysis (Source: Horwath HTL Ltd)
Eight global conferences with an average size of 1,440 delegates represents a strong lift in New Zealand’s existing market share of global conferences, with ICCA data showing that New Zealand hosted 35 conferences in 2007 with an average size of 527 delegates.
International Convention and Exhibition Centre – Feasibility Study Page 69 Auckland City Council July 2009
The size profile of the global conferences broadly reflects the range of activity currently experienced by the major Australian venues and reflects the fact that only 6% of all international conferences have more than 2,000 delegates. We have made an allowance in our assumptions for an average of five Asia-Pacific conferences per annum. Our enquiries of existing New Zealand venues indicate that New Zealand is increasingly being successful in penetrating this market that has long been regarded as challenging because of the number of Asia-Pacific conferences that tend only to rotate mainly within Asia and also because of the greater number of venues that can now cater to the many smaller Asia-Pacific conferences. The Australasian conference market has been identified by many industry participants as having significant potential for a new New Zealand national convention centre as it has the ability to position itself as a new “domestic” conference option. This potential is further aided by what we understand is an increasing trend towards joint Australasian associations. We have allowed for an average of twelve Australasian conferences per annum with the new venue, focusing on the larger end of the market with exhibition requirements. Our projection of an average of ten domestic conferences per annum represents 29% of the projected annual number of conferences. This is relatively low compared to our understanding of the average for the major Australian venues, but reflects the smaller domestic market in New Zealand and the lower number of large domestic conferences that require facilities, such as those proposed in a new National Convention Centre in Auckland.
8.1.2 Conference Related Exhibitions
Conference related exhibitions are becoming an increasingly important component of the overall programme for many conferences as they are significant sources of revenue for conference organisers. Based on our enquiries of PCOs, we have made the following provisions for exhibitions at the different types of conferences:
1. Global: 100%
2. Asia-Pacific: 100%
3. Australasian: 75%
4. Domestic: 50% The number of conference-related exhibitions, categorised by the average amount of flat floor space required, is summarised in Table 8.2 below.
International Convention and Exhibition Centre – Feasibility Study Page 70 Auckland City Council July 2009
Table 8.2 Number of Conference-Related Exhibitions
Conference Size
(delegates) Global Asia-Pacific Australasian Domestic Total
Major
(4,000m2 average)
3 1 - - 4
Large
(2,000m2 average)
4 3 3 1 11
Medium
(1,000m2 average)
1 1 5 3 10
Small
(500m2 average)
- - 1 1 2
Total 8 5 9 5 27
(Source: Horwath HTL)
8.1.3 Conference Banquets
Based on industry norms, we have allowed for an average of one in-house banquet per conference. The average size of the banquet is projected to match the number of conference delegates on the basis that attendance by accompanying persons will off-set the number of non-attending conference delegates.
The number of conference banquets is summarised in Table 8.3 below. Table 8.3 Number of Conference Banquets
Conference Size (delegates)
Global Asia-Pacific
Australasian Domestic Total
Major (2,500 average)
3 1 - - 4
Large (900 average)
4 3 4 1 12
Medium (400 average)
1 1 6 4 12
Small (150 average)
- - 2 5 7
Total 8 5 12 10 35 (Source: Horwath HTL Ltd)
8.1.4 Other Banquets
Non conference-related banquets (eg: awards dinners, fundraising dinners, etc) are a significant component of the overall business mix for many major convention centres. It is reasonable to assume this will also be the case for the proposed facility although it will face strong competition from the larger Auckland hotel facilities, especially those at the Sky City Auckland Convention Centre and Langham Hotel. The extent of business that the venue receives from this segment is likely to be significantly influenced by the “icon” nature of the facility.
International Convention and Exhibition Centre – Feasibility Study Page 71 Auckland City Council July 2009
Table 8.4 Number of Other Banquets Banquet Size (attendees) Number Major (1,500 average) 1 Large (1,000 average) 3 Medium (500 average) 4 Total 8 (Source: Horwath HTL Ltd)
8.1.5 Trade & Public Exhibitions
The proposed facility will represent a high-end quality alternative to the redeveloped ASB Showgrounds for exhibitions requiring flat-floor space of up to 12,000 m2 plus ancillary facilities. Our previous market enquiries have indicated that there is a level of demand for high quality CBD exhibition space, particularly in relation to trade exhibitions. The venue is also likely to have appeal for certain higher-end public shows seeking higher quality exhibition than is available elsewhere. However, we have assumed that the Auckland Showgrounds will remain as the primary exhibition venue in Auckland given its scale and location, which is suitable for large scale public exhibitions. Furthermore, we have assumed that the proposed Marine Events Centre will capture the majority of CBD / harbour focused exhibition activity. As detailed in Table 8.5, we believe the base case facility could cater for an average of six trade and eight public shows per annum. Table 8.5 Exhibition Mix Per Annum
Trade Exhibitions Public Exhibitions Large (8,500m
2 average)
2 4
Medium (4,000m
2 average)
2 4
Small (2,000m
2 average)
2 -
Total 6 8 (Source: Horwath HTL)
8.1.6 Other Events
Once a venue is developed in Auckland, it is likely to host events other than conferences, exhibitions, and banquets. This will primarily be driven by a need to obtain additional business to fill gaps between major events. We have, therefore, allowed for the venue to host:
� an average of three entertainment events per annum. The venue’s ability to attract significant business of this type will be limited by the presence of the Vector Indoor Arena
International Convention and Exhibition Centre – Feasibility Study Page 72 Auckland City Council July 2009
� an average of 15 day meetings per annum. These are more likely to be larger-scale meetings such as company AGMs.
8.1.7 Overall Event Days
Allowing for the average length of different events, we estimate that the proposed facility could cater for an average of approximately 190 event days per annum. In addition to this, pack-in / pack-out requirements for events will likely represent 118 days per annum. Table 8.6 Overall Event Days by Event Type
Con-
ferences* Banquets
Trade Exhibitions
Public Exhibitions
Entertainment Events
Day Meetings
Total
Events 35 8 6 8 3 15 75 AverageLength (days)
3.7 1.0 2.5 3.0 1 1 2.5
Event Days
128 8 15 24 3 15 193
Average Pack-in / out
1.1 0.5 3.0 3.0 3 0.5 2.3
Pack-in / out Days
37 4 18 24 9 8 100
Potential Days Used
165 12 33 48 12 23 293
Days Used (allowing for concurrent events)
250
* Conference related exhibitions and banquets have not been separately counted as they do not drive incremental event days.
(Source: Horwath HTL Ltd)
8.2 FINANCIAL PROJECTIONS We have prepared high-level indicative operating cash flows primarily to provide an input into the economic impact and benefit-cost analyses. The cash flows are based on benchmark data and have been verified at a high-level through discussion with existing convention centres. For the purpose of the projections it has been assumed that the facility will be operated with a stand-alone overhead structure and will operate the food and beverage operation in-house. There is, therefore, significant scope for different outcomes depending upon the operational model that is applied. The operating cash flows for a stabilised year are summarised in Table 8.7. These cash flows are after allowance for rates and a contribution towards an asset replacement fund, but are before any finance costs.
International Convention and Exhibition Centre – Feasibility Study Page 73 Auckland City Council July 2009
Table 8.7: Indicative Operating Cash Flow – Stabilised Year ($000s)
Revenue Conference Revenue 13,329 Other Revenue 4,321 Total Revenue 17,650 Variable Costs Conference Costs 6,683 Other Costs 2,677 Total Variable Costs 9,360 Overhead Expenses Salaries & Wages 1,650 Sales & Marketing 2,000 Building Services & Maintenance 2,250 Other 1,000 Total Overhead Expenses 6,900
Asset Replacement Fund 706
Net Operating Cash Flow 684 (Source: Horwath HTL Ltd)
Based on the projections, we anticipate the facility will operate broadly on a break-even cash flow basis. This level of cash flow performance is consistent with that achieved by the major Australian venues including Melbourne and Adelaide.
International Convention and Exhibition Centre – Feasibility Study Page 74 Auckland City Council July 2009
9.1 INTRODUCTION This section provides NZIER’s estimates of the economic impact of a possible convention centre in Auckland, under two analytical frameworks:
� Benefit Cost Analysis
� General Equilibrium modelling. In undertaking this analysis, NZIER have relied upon data provided by Horwath HTL with regard to visitor numbers and expenditure, and facility capital and operating costs (see Tables 9.1 and 9.3). The analysis is undertaken from a national perspective, ie: in terms of the impact of the facility on the New Zealand economy.
9.2 INITIAL IMPACTS To estimate economic impacts, we need to consider broader effects from the facility, which arise from the additional spending it generates. Total spending results from expenditure:
� at events at the facility by participants - conference delegates, exhibitors and other attendees
� by persons accompanying participants (eg: spouses)
� from tourism before and after the events by participants and accompanying persons – in Auckland and in other parts of New Zealand.
From a national perspective, the relevant expenditure is that of international visitors. Expenditure by New Zealand residents is assumed to be a transfer between expenditure types: it represents a diversion of other spending to facility events and related activities (eg: tourism in Auckland from visitors from elsewhere in New Zealand), and is excluded from the analysis28. From an Auckland regional perspective, the relevant expenditure is by international visitors in the region (excluding tourism before and the events in other parts of New Zealand), and by visitors from elsewhere in New Zealand. The underlying assumptions are detailed in Appendix 1A. The results are shown in the following tables, with data provided by Horwath HTL.
28 Conceptually, it would be preferable to include this expenditure by both Auckland and other New Zealand residents; and offset this by reductions in other spending. There might be a net increase or decrease in national income, depending on differences in impacts of facility-related and other expenditure. Time did not permit us to do this. However, the net effects are not likely to be material, so we do not consider this imprecision is likely to alter our conclusions.
International Convention and Exhibition Centre – Feasibility Study Page 75 Auckland City Council July 2009
The Horwath HTL projections suggest that when fully operational, events at the facility will attract almost 22,000 additional international visitors, who would not otherwise visit New Zealand, and more than 200,000 extra visitor days. As a result of this, there will be an increase of $85.4 million in tourism-related expenditure. Table 9.1 shows total expenditure by international visitors according to the type of event at the facility – including expenditure at the event itself, by accompanying persons, and for tourist activities before and after the event.
Table 9.1 International visitors and expenditure by event type
Visitors Visitor days
Expenditure $m
Conferences 17,466 166,685 72.0
Conference Exhibitions 2,518 20,453 9.2
Banquets 95 285 0.1
Trade Exhibitions - Attendees 1,454 12,156 3.5
Trade Exhibitions - Exhibitors 14 113 0.0
Public Exhibitions - Attendees - - -
Public Exhibitions - Exhibitors 140 1,250 0.5
Total 21,686 200,941 85.4
Source: Horwath HTL
Table 9.2 shows expenditure according to the type of activity undertaken.
Table 9.2 International visitors and expenditure by activity
Visitors Visitor days
Expenditure $m
Event participation 20,201 81,420 52.0
Accompanying persons 1,485 6,260 1.2
Auckland Pre/post 16,822 33,644 9.0
Rest of NZ Pre/post 12,490 79,617 23.1
Total 200,941 85.4
Notes: (1) The total number of event participants and accompanying persons is the same as the total number of visitors associated with all event types in Table 1. The figures for visitors “Pre/post” represent the numbers of these people who engage in tourism activities before and after the event, in Auckland and the rest of New Zealand
Source: Horwath HTL
As can be seen from the above, conferences are by far the most important activity for increasing national income – 84% of visitor expenditure is associated with people who participate in conferences.
International Convention and Exhibition Centre – Feasibility Study Page 76 Auckland City Council July 2009
However, Table 2 illustrates the fact that while most of the visitor expenditure is at the events themselves, there is a significant spin off from associated activities. These account for over half of the visitor days, and 39% of visitor expenditure. The overall daily expenditure across all visitor types is $425. Approximately 95% of the incremental expenditure is attributable to conferences. The average daily expenditure figure for conferences is $424. This weighted average figure reflects a wide range of different daily expenditure levels for conference delegates, exhibitors, and accompanying persons. Different expenditure levels have also been adopted for each type of conference with global conferences assumed to have the highest delegate daily spend of $700. This reduces to $450 for international delegates attending domestic conferences. This reduction reflects the higher propensity for lower-yielding Australian delegates to attend domestic conferences. Average daily expenditure for accompanying persons is assumed to range between $160 - $200, while pre- and post-conference daily expenditure is assumed to range between $150 and $350. The daily spend figures adopted in this analysis are the same as those adopted in our 2006 economic impact analysis. They draw on the limited survey data available in relation to conferences held in New Zealand, as well as conference delegate spend from Australia. International Visitors Survey data has also been used as a basis for accompanying person expenditure and pre- and post-conference expenditure. These expenditure assumptions were reviewed by Covec as part of their 2008 review of Horwath Asia Pacific’s economic impact analysis for Auckland City Council. Based on their review of available data, Covec concluded that the expenditure assumptions were reasonable.
9.3 BENEFIT COST ANALYSIS
9.3.1 Inputs
This section follows the methodology outlined in Treasury (2005)29, with the following
assumptions:
� a twenty year time horizon
� all revenues and costs expressed in real, GST-exclusive prices30
� a real discount rate of 8% per annum – the default rate, which is also recommended for special purpose buildings (Treasury 2008)31 32
29 The Treasury (2005) Cost Benefit Analysis Primer, Wellington, December 2005
30 While Treasury ibid expresses a preference for expressing prices in GST-exclusive terms, it suggests that “Economic analysis on a GST-inclusive basis would be equally valid provided GST-inclusive figures are used consistently” (p17).
31 The Treasury (2008) Public Sector Discount Rates for Cost Benefit Analysis, Wellington, July 2008
International Convention and Exhibition Centre – Feasibility Study Page 77 Auckland City Council July 2009
� a weighting of 20% on all costs funded by public sector, to reflect deadweight losses.
Note that in this instance we do not need to formally establish and estimate a counterfactual from which to estimate the effects of the change. The counterfactual is, in effect, the economic status quo, i.e. the situation in the absence of the convention centre. The additional number of international visitors and their expenditures is on top of what would happen in the absence of this facility. The following costs and benefits are incorporated in the analysis.
9.3.1.1 Capital costs
Capital costs have been estimated (by WT Partnership) for the five options – three on a waterfront site, and one each at Wynyard Point and the CBD – as follows:
� for all options, construction of the convention centre is projected to cost $191.7 million
� for options on a waterfront site, there is an “iconic enhancement” of 30% of costs, $57.5 million
� for options on a waterfront site, there is are additional costs in improving wharf structures, ranging from zero to $54.9 million to $109.8 million
� for all options, there are additional costs of:
o 15% for professional fees
o 1.5% for securing consents
o 1.0% for insurances
� all figures are GST exclusive. With regard to timing, it is assumed that:
� the pre-construction phase will take 2.5 years, during which costs relating to professional fees and consents will be incurred
� the construction phase will take 2.5 years, with all other costs incurred
� the pre-construction phase will commence from year 1 of the analysis (from 1 April 2010) for all options; except for Wynyard, when it will commence from year 5.
This yields the following:
Table 9.3 Construction cost and time profile
Option Design Construction Design/constr'n Year of
32 As noted in Treasury (2008), there is a range of methodologies for estimating a suitable discount rate. Although that document does not engage in an extensive discussion of alternatives, there is a significant body of opinion among economists that different methodologies should be used, resulting a lower discount rate. Effect of lower rate
International Convention and Exhibition Centre – Feasibility Study Page 78 Auckland City Council July 2009
costs $m costs $m period (years) opening
Waterfront 1 41.1 251.7 1-5 6
Waterfront 2 50.2 307.1 1-5 6
Waterfront 3 59.2 362.6 1-5 6
Wynyard 31.6 193.6 5-9 10
CBD 31.6 193.6 1-5 6
Source: WT Partnership
Note: Design costs refer to professional fees plus consent costs. Insurance costs are included in the construction cost column.
It is further assumed that 80% of capital costs will be funded from the public sector. This means the above capital costs are increased by 16% – ie: a 20% increment on the public sector contribution – to recognise the effect of deadweight losses. In addition, land costs have been included, on the basis that these represent an opportunity cost, ie: the value of the land in its next-best use. The value considered can also be thought of as the present value of the rent lost – rent in the sense of the profits earned through ownership of the resource. Estimating land values for the different sites is problematic, as many of the potential sites have not been finalised, and there are no obvious market comparators (we understand that parcels of land in central Auckland large enough to accommodate a convention centre rarely come onto the market). Moreover, there may be additional pre-construction costs such as demolition and relocation of current occupiers that were excluded from the WP Partnership’s estimates.33 Given these uncertainties, we have used a common value of $75m for each site, with the cost incurred in the first year of construction (ie: when the land becomes unavailable for other uses). We acknowledge that the value is likely to vary significantly between sites.
9.3.1.2 Income
Per section 9.2 above, the annual income generated by the new convention centre is estimated at $85.4 million when the facility is fully operational. This is the net additional national income resulting from the facility, comprising all expenditures by international visitors coming to New Zealand for events associated with it. GST is removed from this figure, leaving an annual increment of national income of $75.9 million.
33 Alternatively, if we think in terms of the value of a bare plot of suitable land, a purchaser would reduce the purchase price by the costs of clearing the site ready for construction.
International Convention and Exhibition Centre – Feasibility Study Page 79 Auckland City Council July 2009
It is assumed that the facility will take four years from opening to reach its fully operational level of activity, at which point it will be generating the above increments to national income. In the preceding period, it will operate at:
� 50% of capacity in the first year, $38.0 million
� 70% in the second year, $53.1 million
� 80% in the third year, $60.9 million.
9.3.1.3 Operating Costs and Subsidies
We have not included the operating costs of the convention centre, on the assumption that these will be common between the options and covered by the facility’s revenues. The exception is where costs will not be covered by revenues, in the pre-opening phase, and the initial years of operation when the revenues are building up and will not be sufficient to fully cover costs. We understand that subsidies will be required over this period, as follows:
� $2.0 million per annum in each of the three years before opening, for setting up operations and initial marketing
� $2.9 million in the first year after opening
� $1.4 million in the second year after opening
� $0.5 million in the third year after opening
with no subsidy after this time, when the facility is fully operational. These subsidies represent a transfer rather than a use of resources from a national perspective, and as such should not be included in the BCA. However, 20% of the subsidies have been included to represent the effects of deadweight losses, which are a real cost to the national economy34.
9.3.2 Results
In the chart below we illustrate the profile of benefits and costs over the twenty year time horizon for the CBD option. Full results are included in Appendix 1.
34
Alternatively, the deadweight losses from these subsidies could reasonably be regarded as too small relative to the overall
size of the project to be material, and omitted.
International Convention and Exhibition Centre – Feasibility Study Page 80 Auckland City Council July 2009
Figure 9.1 Profile of benefits and costs – CBD option $ million
0
20
40
60
80
100
1 4 7 10 13 16 19
Years
Benefits
NPV benefits
Costs
NPV costs
Source: NZIER
Actual costs are high in the initial year when land value is included in the analysis; peak in years four and five during the construction phase; then decline to zero from year nine when the facility is fully operational. The track of the NPV of costs is a lower version of the actual cost track, reflecting the impact of discounting. Benefits commence from year six when the facility is opened, and rise to a steady level from year nine onwards when it is fully operational. The track of the NPV of benefits is lower over successive years, reflecting the effect of discounting at a progressively higher rate in later years. All of the other options show similar profiles albeit with the cost tracks at different levels. Table 9.4 shows the Net Present Value (NPV) of the benefits and costs of each option over a twenty year timeframe, after discounting the annual values by the 8% discount rate.
Table 9.4 Net Present Value of Auckland convention centre benefits and costs
Net Present Values $m
Option Benefits Costs BC Ratio
Waterfront 1 396.7 335.3 1.183
Waterfront 2 396.7 391.1 1.014
Waterfront 3 396.7 446.9 0.888
Wynyard 237.6 203.5 1.168
CBD 396.7 276.9 1.433
Source: NZIER
International Convention and Exhibition Centre – Feasibility Study Page 81 Auckland City Council July 2009
A Benefit-Cost Ratio (BCR) of greater than 1.0 indicates that the benefits of the individual project exceed its costs over this time horizon, on a NPV basis. The usefulness in calculating BCRs is not necessarily to assess whether or not individual projects are worth undertaking in their own right. Rather, they enable us to rank the projects, and highlight the circumstances and assumptions that give rise the differences in BCRs. The NPV of benefits is $396.7 million for all options (except Wynyard). This is to be expected, given all options assume the same income stream. The CBD option has the lowest total NPV of costs (except Wynyard), as its capital costs are purely for construction of the convention centre. The addition of an “iconic” structure for the waterfront options, and the varying costs of wharf strengthening, raises the NPV of their costs. The Wynyard option differs from the others primarily in terms of its timing, with no additional site costs or “iconic” enhancements. In fact, its annual benefits and costs are identical to those of the CBD option, but deferred by four years. Hence the numbers for Wynyard illustrate the impact of deferral, with the NPV of costs 26% lower than the CBD option, and benefits 40% lower. When we compare benefits and costs:
� the CBD option has the highest BCR, of 1.433
� the lowest-cost waterfront option and the Wynyard option have similar BCRs, of 1.183 and 1.168 respectively
� the effect of additional costs of wharf strengthening is to reduce the BCRs of other waterfront options further
� in the case of the most expensive waterfront option, its NPV costs exceed NPV benefits, resulting in a BCR of less than 1.0 (0.888).
9.3.3 Alternative scenarios
Given the potential uncertainties about these estimates, we have examined the effects of changes in the number of events – in particular, major global conventions – and land values. As is normal with scenario testing, we examine alternative assumptions individually to highlight the impact of different assumptions.
9.3.3.1 Alternative scenarios – income
The benefits and BCR could vary markedly if the number of events at the centre, and resulting visitor numbers and expenditure, proves to be different to those that have been projected.
International Convention and Exhibition Centre – Feasibility Study Page 82 Auckland City Council July 2009
To test this, we have examined different numbers of major global conferences. As theses are the largest events and have the greatest impact, any variation in these will have a mach larger effect on total benefits than variations in other types of event. The two scenarios we tested involved:
� two fewer major global conferences, resulting in 5,000 fewer attendees
� one more major global conferences, resulting in 2,500 extra attendees
with other assumptions – average daily spending, international / domestic visitor mix, accompanying persons and pre / post-conference tourism – unchanged. Under these two scenarios, total income when the facility is fully operational would be:
� $64.3m per annum with two fewer major global conferences (-$21.1m)
� $96.0m per annum with one more major global conference (+$10.6m).
Figure 9.2 Benefit Cost Ratios under different income assumptions Ratio of NPV Benefits to NPV costs
0.000
0.200
0.400
0.600
0.800
1.000
1.200
1.400
1.600
1.800
BASE LOW HIGH
Waterfront 1
Waterfront 2
Waterfront 3
Wynyard
CBD
Source: NZIER
International Convention and Exhibition Centre – Feasibility Study Page 83 Auckland City Council July 2009
Table 9.5 Net Present Value of Auckland convention centre benefits and costs – LOW scenario
Net Present Values $m
Option Benefits Costs
Benefit-Cost
Ratio
Change from Base scenario
BC Ratio
Waterfront 1 298.7 335.3 0.891 -0.292 1.183
Waterfront 2 298.7 391.1 0.764 -0.251 1.014
Waterfront 3 298.7 446.9 0.668 -0.219 0.888
Wynyard 178.9 203.5 0.879 -0.289 1.168
CBD 298.7 276.9 1.079 -0.354 1.433
Source: NZIER
With fewer major conferences, BCRs at all sites fall markedly (as would be expected). Only the CBD option has a BCR greater than 1.0.
Table 9.6 Net Present Value of Auckland convention centre benefits and costs – HIGH scenario
Net Present Values $m
Option Benefits Costs
Benefit-Cost
Ratio
Change from Base scenario
BC Ratio
Waterfront 1 445.7 335.3 1.329 0.146 1.183
Waterfront 2 445.7 391.1 1.140 0.125 1.014
Waterfront 3 445.7 446.9 0.997 0.110 0.888
Wynyard 267.0 203.5 1.312 0.144 1.168
CBD 445.7 276.9 1.610 0.177 1.433
Source: NZIER
The addition of an extra major global conference raises BCRs across the board, so that all options have a BCR greater than 1.0, except for the most expensive Waterfront option, which is virtually equal to 1.0.
9.3.3.2 Alternative scenarios – land values
As noted initially, there are potentially major variations in land values between different sites, and this may change the relativities of BCRs. Moreover, we do not have any robust information about what the costs might be of purchasing suitable sites and required preparatory work before construction of the convention centre could begin (excluded from WT Partnership’s estimates). To allow for this, we have estimated the value of land for each site that would make the project break-even in NPV terms, ie: that would result in a BCR of 1.0, with all other costs remaining the same. The results are shown in Figure 9.3 below (relative to the common $75 million land value used above).
International Convention and Exhibition Centre – Feasibility Study Page 84 Auckland City Council July 2009
This calculation shows that the CBD option would have a BCR of 1.0 even if the land values were more than doubled (increasing by over $110 million). Conversely, the most expensive waterfront option would need land costs more than 60% lower than the standard figure (ie: $47 million cheaper) to achieve a BCR of 1.0, and the intermediate waterfront option would be able to support only a small increase in land costs (+$5 million)before its BCR would fall below 1.0. The least expensive waterfront option could support an increase of almost $60 million (+76%) before its BCR would fall below 1.0, and the Wynyard option over $40 million (+58%).
9.3.4 Interpretation
Given the inputs, these results are not unexpected. In particular, if these assumptions are considered realistic, a CBD option would be favoured a priori, as it delivers the benefits from increased tourism at the earliest date and least capital costs. In comparison, the waterfront options incur additional capital costs but secure no additional benefits. They provide additional amenity values from “iconic” structures in a “signature” location. Hence we would need to ask whether the enhanced amenity values contribute to higher tourism expenditures; and / or whether the intangible benefits are sufficient to justify the higher costs. The Wynyard option assumes the same costs and benefits as the cheapest CBD option, but with a four year delay. Given the fact that the options generally deliver net benefits, the impact of deferring these is to reduce the value of the project. Though the estimated benefits exceed costs in all but one option, the BCR is low in most cases, in the sense that a relatively small variation in actual costs and / or
International Convention and Exhibition Centre – Feasibility Study Page 85 Auckland City Council July 2009
benefits may affect the economic viability of the project. The highest value is only 1.4:1. As mentioned earlier, a change in the value of land would change the benefit to cost ratio. However, if the assumption of the same land value for all options is appropriate, then the relativity between the BCRs would not change, ie: CBD would remain the best option, followed by Waterfront 1, Wynyard, Waterfront 2 and then Waterfront 3. The relativity would change if there were differences in land values between options which exceeded the differences in the break-even land values (shown in Figure 9.3), with all other costs and benefits remaining the same.
9.4 GENERAL EQUILIBRIUM MODELLING In this part of the analysis, we apply the above results through the NZIER Computable General Equilibrium (CGE) model of the New Zealand economy, to estimate the total effects from the initial impacts of capital and tourism expenditure.
9.4.1 About the model
NZIER developed a CGE model in conjunction with the Centre of Policy Studies (COPS), Monash University, Australia. The model is a New Zealand-specific version of COPS ORANI-G model (the ‘G’ stands for ‘generic’). The ORANI framework has been extensively used in policy analysis in Australia for nearly two decades, and has been adapted for countries all over the world, including China, Brazil, Ireland and Denmark (COPS, 2008). In Appendix 2 we provide a description of the key model features. Full documentation regarding the ORANI-G model is available at the COPS website (http://www.monash.edu.au/policy/oranig.htm). The model is a static CGE model, designed for comparative-static simulations, which estimate the comparative position of the economy after some shock, compared to what might have otherwise been. The modelling process is to introduce to the model a ‘shock’, of a given value and incidence (in terms of the commodities affected by the shock). The model then determines a new value and composition of GDP, with the difference between this and the original values representing the impact of the shock. It does this by estimating the second-round and subsequent effects as resources (labour, capital) are reallocated between the industries which are directly affected by the shock and the rest of the economy. Hence the economy-wide impact of the initial shock may be greater or lesser than its initial value, depending on how the model determines the reallocation of resources. Note that because this analysis uses a comparative static simulation, it gives a ‘before and after’ picture, and does not the capture the path as the economy adjusts
International Convention and Exhibition Centre – Feasibility Study Page 86 Auckland City Council July 2009
over time to the shock. Therefore it does not allow us to determine the time profile of the costs and benefits between the project’s inception and its conclusion.
9.4.2 Results
In this case, we model the effect of two “shocks” on the New Zealand economy associated with the convention centre:
� additional expenditure by international visitors, per Table 9.1
� additional capital spending, per Table 9.3 – using the lowest cost options, Wynyard and CBD, with total capital costs of $225.2 million.35
The results are shown in Table 9.7 below.
Table 9.7 Impact of additional tourism expenditure
Initial impact $85.4m
Increase in GDP $31.0m (+0.02%)
Increase in employment 418 FTEs (0.03)%
Notes: (1) Value added is the value of production after deduction of costs of goods and services used in production; and is made up of wages, profits and depreciation, plus indirect taxes less subsidies. The sum of value added across all businesses is Gross Domestic Product (GDP). (2) Employment is expressed in Full-Time Equivalents (FTEs), which is a measure of total labour input, calculated as the number of full-time jobs plus half the number of part-time jobs
Source: NZIER
The effect of the additional $85.4 million in tourism expenditure is an increase in national GDP value added of $31.0 million, which represents 0.02% of GDP. This increase is concentrated in tourism-related industries – accommodation, cafés & restaurants, retail trade and passenger transport. Note that the $85.4 million and $31.0 million figures are not directly comparable. The additional tourism expenditure – technically, a gross output measure - would result in multiple transactions across the economy. What we are measuring is the cumulative increase in value added from these transactions, comprising (mostly) additional wages and profits, after allowing for any reallocation of resources from other industries. We estimate that the above $85.4m equates to $40.3m in additional value added (47 cents in every dollar). Associated with this impact is an increase in employment of 418 FTEs, which represents 0.03% of total employment. 35
Note that, as in the Benefit-Cost Analysis, the value of subsidies is not included in the modelling, as they represent a transfer. The deadweight effects included in the BCA are not explicitly included as an input to the modelling, as they are picked up in the model’s resource reallocation. In any event, they are too small to be material from an economy-wide
perspective.
International Convention and Exhibition Centre – Feasibility Study Page 87 Auckland City Council July 2009
As these expenditures are recurrent, the above impacts are also recurrent – ie: the level of national GDP and employment will be permanently higher than would otherwise have been the case.
Table 9.8 Impact of additional construction expenditure
Initial impact $225.2m
Increase in GDP $46.1m
Increase in employment 751 FTEs
Source: NZIER
The effect of the additional $225.2 million in construction expenditure36 is an increase in value added of $46.1 million concentrated in construction and related industries. Associated with this is an increase in employment of 751 FTEs. These effects are spread over the five years of the design and construction phase – ie: the increase in GDP is $46.1m in total, not $46.1m per annum – and would be concentrated in the final two years when construction is underway. Similarly, the employment effect is of an additional 150 FTE jobs per annum, on average. The effects would not persist after construction is completed. Even allowing for the time spread, the differences between the impacts of tourism and construction are striking – although the value of construction shock is more than 160% higher that of the annual tourism increase, its effect on value added is only about 50% higher, and on employment about 70% higher. The reason for this difference is that construction is less labour intensive than tourism-related industries, and uses much more capital and materials. Hence the initial impact in terms of value added is proportionately lower; 16 cents of every dollar of construction expenditure is value added, versus 47 cents for tourism related industries.
9.4.3 Alternative scenarios – income
We have also tested the effect of different numbers of major global conferences in
the CGE modelling framework, per section 9.0 above, ie:
� two fewer major global conferences, resulting in $21.1m less tourism expenditure per annum
� one more major global conferences, resulting in $10.6m more tourism expenditure per annum.
The results are shown in Figure 9.4 below.
36 modelled as an increase in investment in Non-Residential Buildings
International Convention and Exhibition Centre – Feasibility Study Page 88 Auckland City Council July 2009
Figure 9.3 Economy-wide impacts of different scenarios $millions (right hand scale): Full-Time Equivalents (left hand scale)
0
20
40
60
80
100
120
BASE LOW HIGH
0
100
200
300
400
500
Initial impact (RHS)
Increase in GDP (RHS)
Increase in employment (LHS)
Source: NZIER
Table 9.7 Impact of additional tourism expenditure – LOW scenario
Change from Base scenario
Initial impact $64.3m -$21.1m
Increase in GDP $23.6m (+0.02%) -$7.4m
Increase in employment 318 FTES (+0.02%) -100 FTEs
Source: NZIER
Table 9.8 Impact of additional tourism expenditure – HIGH scenario
Change from Base scenario
Initial impact $96.0m $10.6m
Increase in GDP $35.6m (+0.02%) $4.6m
Increase in employment 479 FTES (+0.03%) 61 FTEs
Source: NZIER
International Convention and Exhibition Centre – Feasibility Study Page 89 Auckland City Council July 2009
9.5 OTHER EFFECTS
There are other potential effects which are not included in the above analysis.
9.5.1 Savings of offshore expenditure
Approximately 46,000 New Zealanders are projected to participate in events (other
than public exhibitions) at the convention centre every year when it is fully
operational. Their expenditure has been excluded from the analysis, on the basis
that this is a diversion of spending from other types of domestic activity (a normal
convention in this type of analysis).
However, all or nearly all of the events will occur at locations in other countries, and it
is likely that some New Zealanders would attend these events. Hence one potential
benefit from a convention centre in Auckland would be the savings in expenditure
that would have otherwise occur abroad.
This effect is quantifiable, albeit with some uncertainty about the numbers of “saved”
journeys abroad and associated expenditures.
We have not been able to derive robust estimates of savings and incorporate them in
the above BCA and GE modeling in the time available to prepare this report.
However we consider that if time were available to undertake a more comprehensive
analysis, these savings should be included.
9.5.2 Intangible effects
A second set of intangible benefits might result from the convention centre – or to be
more precise, from the events held at the centre. Other studies of convention centre
proposals have identified a number of these, which we would group into three
categories:
� reputational effects
� learning and relationship effects / "global connectedness"
� local networking.
Reputational effects arise as hosting major conventions with a global catchment
reinforces the perception of Auckland (and indirectly, New Zealand) as a centre of
international standing. Alternatively, the absence of such conventions undermines
Auckland’s reputation as a global city.
These effects are not universal – they are focused on people active in the fields in
which the events are organised – but these may include business and academic
leaders among whom we would most wish to enhance this country’s reputation.
International Convention and Exhibition Centre – Feasibility Study Page 90 Auckland City Council July 2009
Moreover, reputational effects will be most pronounced for conventions in fields in
which we wish to establish New Zealand’s standing (eg: emerging technologies).
One of the key benefits cited from conventions is the personal contacts that
participants make, and subsequent exchange of information, collaborative activities,
business ventures etc (KPMG 2005)37. Electronic communications have reduced the
‘tyranny of distance’, but have not eliminated it – face-to-face contacts remain critical
to developing and sustaining relationships in business and academia.
The availability of a suitable facility and the events held at it, can be expected to
contribute to cross-border exchange of information and relationship building, by
bringing global experts (speakers and delegates) to New Zealand, and providing their
local counterparts with increased opportunities to build global contacts.
As KPMG (2005) notes, major conventions may also provide a catalyst for local
networking in planning and presentations for conventions (rather than necessarily at
the conventions themselves). The local networking typically includes business,
academia and/or the public sector, and may lead to ongoing collaboration.
In keeping with Treasury (2005, S4.5) we would highlight these effects as potentially
significant but non-quantifiable.
37 KPMG (2005) Economic Impact of the Proposed London ICC Final Report to the London
International Convention and Exhibition Centre – Feasibility Study Page 91 Auckland City Council July 2009
10. PUBLIC / PRIVATE OWNERSHIP, GOVERNANCE, OPERATIONS
10.1 PUBLIC VERSUS PRIVATE SECTOR FUNDING Convention and Exhibition (Convex) Centres are substantial real estate investments (in terms of capital cost) and are not generally run on a “commercial” basis. The key reasons for developing international standard convention centres revolve around their ability to generate substantial economic impact and facilitate the transfer of valuable knowledge and contacts to the benefit of the local economy. It is because of these “public good” aspects and the large capital costs that large convention centres tend to predominantly be funded by the public sector. Having reviewed funding arrangements at other international centres, it is evident that the primary opportunities for private sector funding input relate to:
1. funding of ancillary services (eg: hotel, car park) on which the private sector can earn a commercial return and assist the overall development by providing synergistic infrastructure and contribute towards funding of associated land costs. The extent to which these opportunities can be pursued will depend upon the nature of the specific site that is chosen for the proposed facility
2. outsourcing of venue management and food and beverage services in return for “key money” contributions. These contributions are likely to be minimal in the context of the overall capital costs
3. structuring of the development as a Build, Own, Operate, Transfer (“BOOT”) scheme between the public and private sector. Locally this has been achieved with the development of the Vector Arena and in Australia the Perth Convention Centre has been developed under a BOOT scheme. The BOOT scheme results in the private sector contributing capital funding up to the level on which it believes it can earn a commercial return over the period of its operation prior to transferring the asset into public ownership. A key potential drawback of a BOOT scheme is that for the duration of the private sector’s ownership, it will operate the venue so as to maximise profit and return on investment. This could result in a mix of activity and events that does not maximise economic impact, which is normally the original reason for developing the facility. The experience with both Vector Arena and the Perth convention Centre suggests significant private sector funding could be difficult to achieve through a BOOT scheme.
In Perth the State government provided the developer with:
a. Cash of A$100 million, which is to be ratcheted over the development period by the rate of interest, and is estimated to finally be approximately A$125 million
b. The convention centre site rent free for 35 years before it reverts back to government
c. land worth approximately A$90 million surrounding the convention centre site for 99 years rent free. This enables the developer to
International Convention and Exhibition Centre – Feasibility Study Page 92 Auckland City Council July 2009
leverage an above average commercial return off the associated facilities to off-set the convention centre return.
4. the levying of a bed tax on commercial accommodation. It is common in the United States for bed taxes to be implemented to assist in the funding of tourism infrastructure such as convention centres. We are not aware of any precedent in Australia for implementing a bed tax to raise funds for a convention centre development. The NSW State government did, however, implement a temporary bed tax to assist in raising funds to off-set the cost of hosting the 2000 Sydney Olympics.
Bed taxes have previously been criticised on the basis that they are a “blunt instrument” that target a select group of service providers, rather than all industry participants who benefit from the presence of a convention centre. However, this “bluntness” can be mitigated by using a bed tax as one part of an overall funding package. The use of a bed tax as part of an overall funding package can be supported by the high proportion of conference delegate expenditure that accrues to hotels.
5. the imposition of a targeted rate. It would be possible to implement a targeted rate on all businesses within a certain geographic area as a means of collecting private sector contributions for a convention centre. The rationale for a targeted rate would be similar to that for a bed tax, in that the contributors would, in theory at least, benefit from the presence of the convention centre to a greater extent than the general ratepayer. This policy would have the benefit of spreading the funding impact more widely. Key issues with such a policy would be agreeing the appropriate geographic area and the fact that many businesses within the geographic area would likely receive no direct benefit from the presence of the convention centre.
In order to optimise private sector funding contributions it is likely that a range of funding mechanisms will need to be pursued.
10.2 OWNERSHIP MODELS From our review there are three broad ownership options available for an international standard convention centre. The first option is for private ownership through a BOOT scheme, as discussed in Section 10.1. The second option is for direct ownership by the public sector. The primary example of this model in Australasia is the Wellington Convention Centre. The most popular model is the creation of special purpose entities that are accountable to the public sector. These entities take a diverse range of forms and include:
International Convention and Exhibition Centre – Feasibility Study Page 93 Auckland City Council July 2009
� VBase in Christchurch, which is a Council Controlled Organisation that owns a diverse range of public assembly facilities including the Christchurch Convention Centre (excluding Town Hall), AMI Stadium, and Westpac Arena
� The Melbourne Convention and Exhibition Trust, which was established under the Melbourne Convention and Exhibition Trust Act 1996, that owns and operates the Convention and Exhibition Centres and is responsible to the Victorian Minister for Tourism and Major Events
� The Sydney Harbour Foreshore Authority, which was formed under The Sydney Harbour Foreshore Authority Act 1998, and owns a number of significant assets including Sydney’s heritage, cultural and entertainment precincts at The Rocks and Darling Harbour. The Authority has a broad portfolio of assets totalling A$1 billion including the Sydney Convention Centre and is responsible to NSW Minister for Planning
� South Bank Corporation, which owns the Brisbane Convention and Exhibition Centre, was established under the South Bank Corporation Act 1989 and has broad responsibilities for the development and management of the 42 hectare South Bank precinct
� The Adelaide Convention Centre Corporation, which is a subsidiary to the Minister for Tourism by regulations issued under the Public Corporations Act 1993.
The benefit of these entities is that they are fully accountable to the public sector but are able to operate at arms length to ensure the public sector’s objectives are met in the most efficient and effective manner. We note that the Royal Commission on Auckland Governance has recommended the establishment of a Council Controlled Organisation to own all regionally significant event venues, which would logically include the proposed international convention centre.
10.3 GOVERNANCE MODELS The on-going governance model for the proposed centre will be a product of the ownership model that is adopted. However, we do note that there may be merit in establishing an interim governance structure to oversee the development of the facility. This could be akin to the Redevelopment Board that has been established at Eden Park and have specific responsibility for ensuring key stakeholder requirements are met in the development of the physical building. The skill-sets of the representatives on this governance structure are likely to differ significantly from the skill-sets sought for those on the governance structure of the ownership entity although some continuity of representation would be highly desirable.
International Convention and Exhibition Centre – Feasibility Study Page 94 Auckland City Council July 2009
10.4 OPERATIONAL MODELS
In Australasia there is a reasonably even split between in-house venue management and out-sourced venue management. Examples of out-sourced management include:
1 AEG Ogden, which manages the Brisbane and Cairns Convention Centres on behalf of South Bank Corporation and the Queensland Government, respectively
2 Spotless Services, which manages the Perth Convention Centre on behalf of the Wyllie Group
3 Convention Centre Management Pty Ltd, which is a consortium jointly owned by hotel group Accor Asia Pacific and food services organisation Compass Group, that manages the Sydney Convention and Exhibition Centre.
By way of contrast, the Wellington Convention Centre, Christchurch Convention Centre, Melbourne convention and Exhibition Centre, and Adelaide Convention Centre are all managed in-house. The primary advantages of contracting out venue management include realising “key money” in return for the commercial opportunity and the potential to obtain specialist operational expertise to improve performance levels, particularly during the establishment phase. The key risks of contracting out the venue management is the potential for mis-alignment of objectives and the potential that revenue performance may not be improved to the extent necessary to off-set the associated management fees. Historically, there has been a tendency for venue managers to out-source food and beverage services to specialist caterers. However, in recent years there has been a trend towards venue managers bringing these services back in-house to assist their profitability and ensure greater control over service standards.
International Convention and Exhibition Centre – Feasibility Study Page 95 Auckland City Council July 2009
APPENDICES
International Convention and Exhibition Centre – Feasibility Study Page 96
Auckland City Council
July 2009
APPENDIX 1A: BENEFIT-C
OST CALCULATIONS
Option
Year
12
34
56
78
910
11
12
13
14
Year in which operations commence
00
00
06
00
00
00
00
Year in which operations "stabilise"
00
00
00
00
90
00
00
BENEFITS
Income
0.0
0.0
0.0
0.0
0.0
38.0
50.6
63.3
75.9
75.9
75.9
75.9
75.9
75.9
Total benefits
0.0
0.0
0.0
0.0
0.0
38.0
50.6
63.3
75.9
75.9
75.9
75.9
75.9
75.9
Annual N
PV
0.0
0.0
0.0
0.0
0.0
23.9
29.5
34.2
38.0
35.2
32.6
30.1
27.9
25.8
Total NPV
396.7
COSTS
Capital costs
19.1
19.1
67.9
116.8
116.8
0.0
0.0
0.0
0.0
0.0
0.0
0.0
0.0
0.0
Land costs
87.0
0.0
0.0
0.0
0.0
0.0
0.0
0.0
0.0
0.0
0.0
0.0
0.0
0.0
Pre-inception costs - deadweight
0.0
0.0
0.4
0.4
0.4
0.0
0.0
0.0
0.0
0.0
0.0
0.0
0.0
0.0
Ongoing subsidy - deadweight
0.0
0.0
0.0
0.0
0.0
0.6
0.3
0.1
0.0
0.0
0.0
0.0
0.0
0.0
Total costs
106.1
19.1
68.3
117.2
117.2
0.6
0.3
0.1
0.0
0.0
0.0
0.0
0.0
0.0
Annual N
PV
98.2
16.4
54.2
86.1
79.8
0.4
0.2
0.1
0.0
0.0
0.0
0.0
0.0
0.0
Total NPV
335.3
NET BENEFITS (COSTS)
Net benefits (costs)
-106.1
-19.1
-68.3
-117.2
-117.2
37.4
50.3
63.2
75.9
75.9
75.9
75.9
75.9
75.9
Annual N
PV
-98.2
-16.4
-54.2
-86.1
-79.8
23.6
29.4
34.1
38.0
35.2
32.6
30.1
27.9
25.8
Total NPV
61.4
0.0
BC Ratio
1.1832
Waterfront 1
International Convention and Exhibition Centre – Feasibility Study Page 97
Auckland City Council
July 2009
Option
Year
12
34
56
78
910
11
12
13
14
Year in which operations commence
00
00
06
00
00
00
00
Year in which operations "stabilise"
00
00
00
00
90
00
00
BENEFITS
Income
0.0
0.0
0.0
0.0
0.0
38.0
50.6
63.3
75.9
75.9
75.9
75.9
75.9
75.9
Total benefits
0.0
0.0
0.0
0.0
0.0
38.0
50.6
63.3
75.9
75.9
75.9
75.9
75.9
75.9
Annual N
PV
0.0
0.0
0.0
0.0
0.0
23.9
29.5
34.2
38.0
35.2
32.6
30.1
27.9
25.8
Total NPV
396.7
COSTS
Capital costs
23.3
23.3
82.9
142.5
142.5
0.0
0.0
0.0
0.0
0.0
0.0
0.0
0.0
0.0
Land costs
87.0
0.0
0.0
0.0
0.0
0.0
0.0
0.0
0.0
0.0
0.0
0.0
0.0
0.0
Pre-inception costs - deadweight
0.0
0.0
0.4
0.4
0.4
0.0
0.0
0.0
0.0
0.0
0.0
0.0
0.0
0.0
Ongoing subsidy - deadweight
0.0
0.0
0.0
0.0
0.0
0.6
0.3
0.1
0.0
0.0
0.0
0.0
0.0
0.0
Total costs
110.3
23.3
83.3
142.9
142.9
0.6
0.3
0.1
0.0
0.0
0.0
0.0
0.0
0.0
Annual N
PV
102.1
20.0
66.1
105.0
97.3
0.4
0.2
0.1
0.0
0.0
0.0
0.0
0.0
0.0
Total NPV
391.1
NET BENEFITS (COSTS)
Net benefits (costs)
-110.3
-23.3
-83.3
-142.9
-142.9
37.4
50.3
63.2
75.9
75.9
75.9
75.9
75.9
75.9
Annual N
PV
-102.1
-20.0
-66.1
-105.0
-97.3
23.6
29.4
34.1
38.0
35.2
32.6
30.1
27.9
25.8
Total NPV
5.6
0.0
BC Ratio
1.0144
Waterfront 2
International Convention and Exhibition Centre – Feasibility Study Page 98
Auckland City Council
July 2009
Option
Year
12
34
56
78
910
11
12
13
14
Year in which operations commence
00
00
06
00
00
00
00
Year in which operations "stabilise"
00
00
00
00
90
00
00
BENEFITS
Income
0.0
0.0
0.0
0.0
0.0
38.0
50.6
63.3
75.9
75.9
75.9
75.9
75.9
75.9
Total benefits
0.0
0.0
0.0
0.0
0.0
38.0
50.6
63.3
75.9
75.9
75.9
75.9
75.9
75.9
Annual N
PV
0.0
0.0
0.0
0.0
0.0
23.9
29.5
34.2
38.0
35.2
32.6
30.1
27.9
25.8
Total NPV
396.7
COSTS
Capital costs
23.3
23.3
82.9
142.5
142.5
0.0
0.0
0.0
0.0
0.0
0.0
0.0
0.0
0.0
Land costs
87.0
0.0
0.0
0.0
0.0
0.0
0.0
0.0
0.0
0.0
0.0
0.0
0.0
0.0
Pre-inception costs - deadweight
0.0
0.0
0.4
0.4
0.4
0.0
0.0
0.0
0.0
0.0
0.0
0.0
0.0
0.0
Ongoing subsidy - deadweight
0.0
0.0
0.0
0.0
0.0
0.6
0.3
0.1
0.0
0.0
0.0
0.0
0.0
0.0
Total costs
110.3
23.3
83.3
142.9
142.9
0.6
0.3
0.1
0.0
0.0
0.0
0.0
0.0
0.0
Annual N
PV
102.1
20.0
66.1
105.0
97.3
0.4
0.2
0.1
0.0
0.0
0.0
0.0
0.0
0.0
Total NPV
391.1
NET BENEFITS (COSTS)
Net benefits (costs)
-110.3
-23.3
-83.3
-142.9
-142.9
37.4
50.3
63.2
75.9
75.9
75.9
75.9
75.9
75.9
Annual N
PV
-102.1
-20.0
-66.1
-105.0
-97.3
23.6
29.4
34.1
38.0
35.2
32.6
30.1
27.9
25.8
Total NPV
5.6
0.0
BC Ratio
1.0144
Waterfront 2
International Convention and Exhibition Centre – Feasibility Study Page 99
Auckland City Council
July 2009
Option
Year
12
34
56
78
910
11
12
13
14
Year in which operations commence
00
00
06
00
00
00
00
Year in which operations "stabilise"
00
00
00
00
90
00
00
BENEFITS
Income
0.0
0.0
0.0
0.0
0.0
38.0
50.6
63.3
75.9
75.9
75.9
75.9
75.9
75.9
Total benefits
0.0
0.0
0.0
0.0
0.0
38.0
50.6
63.3
75.9
75.9
75.9
75.9
75.9
75.9
Annual N
PV
0.0
0.0
0.0
0.0
0.0
23.9
29.5
34.2
38.0
35.2
32.6
30.1
27.9
25.8
Total NPV
396.7
COSTS
Capital costs
27.5
27.5
97.9
168.2
168.2
0.0
0.0
0.0
0.0
0.0
0.0
0.0
0.0
0.0
Land costs
87.0
0.0
0.0
0.0
0.0
0.0
0.0
0.0
0.0
0.0
0.0
0.0
0.0
0.0
Pre-inception costs - deadweight
0.0
0.0
0.4
0.4
0.4
0.0
0.0
0.0
0.0
0.0
0.0
0.0
0.0
0.0
Ongoing subsidy - deadweight
0.0
0.0
0.0
0.0
0.0
0.6
0.3
0.1
0.0
0.0
0.0
0.0
0.0
0.0
Total costs
114.5
27.5
98.3
168.6
168.6
0.6
0.3
0.1
0.0
0.0
0.0
0.0
0.0
0.0
Annual N
PV
106.0
23.6
78.0
124.0
114.8
0.4
0.2
0.1
0.0
0.0
0.0
0.0
0.0
0.0
Total NPV
446.9
NET BENEFITS (COSTS)
Net benefits (costs)
-114.5
-27.5
-98.3
-168.6
-168.6
37.4
50.3
63.2
75.9
75.9
75.9
75.9
75.9
75.9
Annual N
PV
-106.0
-23.6
-78.0
-124.0
-114.8
23.6
29.4
34.1
38.0
35.2
32.6
30.1
27.9
25.8
Total NPV
-50.2
0.0
BC Ratio
0.8877
Waterfront 3
International Convention and Exhibition Centre – Feasibility Study Page 100
Auckland City Council
July 2009
Option
Year
12
34
56
78
910
11
12
13
14
Year in which operations commence
00
00
00
00
010
00
00
Year in which operations "stabilise"
00
00
00
00
00
00
13
0
BENEFITS
Income
0.0
0.0
0.0
0.0
0.0
0.0
0.0
0.0
0.0
38.0
50.6
63.3
75.9
75.9
Total benefits
0.0
0.0
0.0
0.0
0.0
0.0
0.0
0.0
0.0
38.0
50.6
63.3
75.9
75.9
Annual N
PV
0.0
0.0
0.0
0.0
0.0
0.0
0.0
0.0
0.0
17.6
21.7
25.1
27.9
25.8
Total NPV
237.6
COSTS
Capital costs
0.0
0.0
0.0
0.0
14.7
14.7
52.3
89.8
89.8
0.0
0.0
0.0
0.0
0.0
Land costs
0.0
0.0
0.0
0.0
87.0
0.0
0.0
0.0
0.0
0.0
0.0
0.0
0.0
0.0
Pre-inception costs - deadweight
0.0
0.0
0.0
0.0
0.0
0.0
0.4
0.4
0.4
0.0
0.0
0.0
0.0
0.0
Ongoing subsidy - deadweight
0.0
0.0
0.0
0.0
0.0
0.0
0.0
0.0
0.0
0.6
0.3
0.1
0.0
0.0
Total costs
0.0
0.0
0.0
0.0
101.7
14.7
52.7
90.2
90.2
0.6
0.3
0.1
0.0
0.0
Annual N
PV
0.0
0.0
0.0
0.0
69.2
9.2
30.7
48.8
45.1
0.3
0.1
0.0
0.0
0.0
Total NPV
203.5
NET BENEFITS (COSTS)
Net benefits (costs)
0.0
0.0
0.0
0.0
-101.7
-14.7
-52.7
-90.2
-90.2
37.4
50.3
63.2
75.9
75.9
Annual N
PV
0.0
0.0
0.0
0.0
-69.2
-9.2
-30.7
-48.8
-45.1
17.3
21.6
25.1
27.9
25.8
Total NPV
34.1
0.0
BC Ratio
1.1678
Wynyard
International Convention and Exhibition Centre – Feasibility Study Page 101
Auckland City Council
July 2009
Option
Year
12
34
56
78
910
11
12
13
14
Year in which operations commence
00
00
06
00
00
00
00
Year in which operations "stabilise"
00
00
00
00
90
00
00
BENEFITS
Income
0.0
0.0
0.0
0.0
0.0
38.0
50.6
63.3
75.9
75.9
75.9
75.9
75.9
75.9
Total benefits
0.0
0.0
0.0
0.0
0.0
38.0
50.6
63.3
75.9
75.9
75.9
75.9
75.9
75.9
Annual N
PV
0.0
0.0
0.0
0.0
0.0
23.9
29.5
34.2
38.0
35.2
32.6
30.1
27.9
25.8
Total NPV
396.7
COSTS
Capital costs
14.7
14.7
52.3
89.8
89.8
0.0
0.0
0.0
0.0
0.0
0.0
0.0
0.0
0.0
Land costs
87.0
0.0
0.0
0.0
0.0
0.0
0.0
0.0
0.0
0.0
0.0
0.0
0.0
0.0
Pre-inception costs - deadweight
0.0
0.0
0.4
0.4
0.4
0.0
0.0
0.0
0.0
0.0
0.0
0.0
0.0
0.0
Ongoing subsidy - deadweight
0.0
0.0
0.0
0.0
0.0
0.6
0.3
0.1
0.0
0.0
0.0
0.0
0.0
0.0
Total costs
101.7
14.7
52.7
90.2
90.2
0.6
0.3
0.1
0.0
0.0
0.0
0.0
0.0
0.0
Annual N
PV
94.1
12.6
41.8
66.3
61.4
0.4
0.2
0.1
0.0
0.0
0.0
0.0
0.0
0.0
Total NPV
276.9
NET BENEFITS (COSTS)
Net benefits (costs)
-101.7
-14.7
-52.7
-90.2
-90.2
37.4
50.3
63.2
75.9
75.9
75.9
75.9
75.9
75.9
Annual N
PV
-94.1
-12.6
-41.8
-66.3
-61.4
23.6
29.4
34.1
38.0
35.2
32.6
30.1
27.9
25.8
Total NPV
119.8
0.0
BC Ratio
1.4329
CBD
International Convention and Exhibition Centre – Feasibility Study Page 102 Auckland City Council July 2009
APPENDIX 1B: TECHNICAL DETAIL OF THE NZIER MODEL
ORANI-G
Our results were produced on a model of the New Zealand economy based on a tried and tested generic model (ORANI-G) that has been found effective for policy analysis in Australia and around the world. The model has been calibrated to the local setting and loaded with New Zealand data. The assumptions needed are based on consultation with industry specialists and reflect best practice. The model has been developed with considerable assistance from CGE modeling experts at the Centre for Policy Studies at Monash University in Melbourne, Australia.
Database structure
The ORANI-NZ model consists of:
� 131 industries
� 210 commodities
� 14 regions
� 1 household
� 24 occupations. The database has been sourced initially from Statistics NZ 1995/96 Inter-Industry tables, updated using the subsequently released 2003 Supply and Use Tables, and finally ‘up-scaled’ to 2007 levels using latest Statistics NZ macroeconomic data.
International Convention and Exhibition Centre – Feasibility Study Page 103 Auckland City Council July 2009
Figure A The ORANI-NZ database
Source: Horridge, 2008; NZIER
Production structure (Horridge, 2008)
The production structure of the model is presented in Figure B and follows Horridge (2008)38. Each industry can produce a number of different commodities. Production inputs are intermediate commodities, both domestic and imported, and primary factors - labour, land and capital. Working from bottom to top, we see constant elasticity of substitution (CES) production nests for occupations, primary factors and the choice between imported and domestic commodities. In this case, an increase in price moves sourcing towards another input, for example if the price of imports increases, more domestic commodities are demanded in the intermediate sourcing CES nest.
38 Horridge, M (2008) “ORANI-G: A generic single-country computable general equilibrium model.” Centre of Policy Studies and Impact Project, Monash Australia.
International Convention and Exhibition Centre – Feasibility Study Page 104 Auckland City Council July 2009
Figure B Production structure
Source: Horridge, 2008
At the activity level, intermediate goods, primary factors and other costs are combined using a Leontif production function. This means the proportion of production inputs does not change. On the output side, there are two further constant elasticity of transformation (CET)39 nests. The production mix of each industry is
39 A CET function is identical to a CES function except that the transformation parameter has the
opposite sign (ie: increasing price increases output in a CET; in a CES, increasing price reduces demand).
International Convention and Exhibition Centre – Feasibility Study Page 105 Auckland City Council July 2009
dependent on the relative prices of each commodity. Similarly, the export nest determines local and export market shares depending on relative prices.
Model outputs
The modeling process is to introduce to the model a ‘shock’, of a given value and incidence (in terms of the commodities affected by the shock). The model then determines a new value and composition of GDP, with the difference between this and the original values representing the impact of the shock. Figure C illustrates an example, plotting employment with and without the implementation of a given shock, for example a policy change. Without the policy, employment reaches point B after T years. With the policy, employment reaches point C after T years. In such a simulation, the model would report a percentage change in employment of 100*(B-C)/B (Horridge, 2008).
Figure C Comparative static interpretation of model results
Source: Horridge, 2008
Regional extension
Policy impacts are often unevenly spread across industries and regions. To capture these heterogeneous effects, the model is extended to include a regional component. A ‘top-down’ approach is used to decompose national impacts to the regional level, using regional employment data as weighting. If a region has a high share of national output, then its regional industry output will be proportionally affected. The exception is industries that produce commodities (mostly services) that are largely consumed within a region. These are deemed to be local industries, and it is
International Convention and Exhibition Centre – Feasibility Study Page 106 Auckland City Council July 2009
assumed that their output moves in line with the local demand for the corresponding commodity, rather than with the national industry output. Note that an inherent assumption in the ‘top-down’ approach is that industries uses the same production technology across all regions (Horridge, 2008).
Using models
There are some important caveats that need to be considered with CGE modeling in general:
� they are based on neoclassical microeconomics – this presumes all markets base decisions on relative prices
� they assume smooth responsiveness – the model does not capture step-wise industry and economy-wide adjustments but assumes smooth and continuous changes. In reality, industries with large capital resources face discrete production and investment decisions
� they are subject to aggregation bias – the model aggregates the economy into 131 industries and 210 commodities; this level of detail is normally sufficient to capture the key economic issues across the economy, but some effects may not be identified due to aggregation bias
� database dependency – the model status-quo structure is based on the snapshot of the economy provided by Statistics NZ in their latest 2003 Supply and Use Tables, which are in turn an update on previous, more comprehensive input-output tables from 1995/96. Structural changes to the economy over the last 5 years are therefore not captured in the model database. We acknowledge these issues, and highlight the need for more regular release of input-output tables to enhance policy analysis in NZ
� comparative static equilibrium analysis – the model reports the likely change in the economy at a given time; it does not capture the gradual implementation effects of a shock as the economy adjusts over time. In the long run, these restrictions aren’t important as we assume that the economy can adjust to the desired point.
International Convention and Exhibition Centre – Feasibility Study Page 107 Auckland City Council July 2009
APPENDIX 2: INTERNATIONAL PCO SURVEY Note: Still awaiting expected information from Spain and Australia A. CONVENTION CENTRE FACILITIES Below are the capacity specifications developed by an IAPCO working group in 2006 for a convention of 3,500 delegates.
Very flexible spaces for:Very flexible spaces for:
offices, small meeting rooms,offices, small meeting rooms,
posters (printed or electronic), etc.posters (printed or electronic), etc.
Please review these specifications and advise of any changes you think need to be made to this in light of (a) current requirements and (b) future requirements. In particular, please comment on the exhibition space – is the ratio of exhibition space to meeting space and the number of delegates correct?
UK I think the exhibition space maybe a little large for the average event/organiser. Personally I like the exhibition to house everything: registration, catering, posters, rest areas, lounges, cyber cafes, exhibitors lounge, offices etc. If you work on that basis you are looking at a ratio of probably 30% net space to gross. Potentially, 6-7,000 m
2 is probably sufficient with some ability to divide the hall up
sensibly for smaller exhibitions. Netherlands If the exhibition space can be divided into other catering and breakout space, then fine. 10,000 m
2 gross is a lot but is needed for
public exhibitions. Italy Even though there is a reduction in exhibition space requirements at present I would not change the numbers. Italy (No. 2) – also worked in Turkey & Netherlands The exhibition space could be bigger, as it would then be more attractive for small commercial fairs as well. The number of offices and small function rooms is also very important. Switzerland Exhibition space sounds right, but some additional “lost spaces” (for receptions, smaller exhibits, coffee breaks, etc) would be mandatory. Spacious corridors, open spaces that can be segmented off etc. are very useful. Don’t create boxes, be creative in size, dimensions, levels, views, etc. Expect to use AV in these spaces (as a whole, or segmented).
International Convention and Exhibition Centre – Feasibility Study Page 108 Auckland City Council July 2009
France Need more breakout rooms and lots of hospitality suites. Rest is OK. Greece The ratio depends more on the type of the meeting than on the number for delegates. For example I know of a conference of 3,000 delegates that requires 30,000 m
2 gross exhibition. On average,
5,000 m2 net for a 3,500 pax conference would be adequate.
Canada It appears to be a good ratio; perhaps even a bit small for the exhibit space should you want to develop the trade show market. Japan The exhibition floor should be at least 15,000 m
2. If all of the space
is not used for an exhibition during a congress, it can also be used for dinners and breakout sessions. Meetings and their associated exhibitions are becoming larger so targeting meetings of 3,500-4,000 may not be enough. NZ Agree with the specifications with the proviso that there is a large number of breakout/office spaces. Requirements for these spaces have increased considerably since the Powerpoint was prepared in 2006.
Other than room types / capacities, what are the top 3 features you currently look for in a convention centre capable of accommodating conventions of 3,500-4,000?
UK � Well located exhibition space which can form the central hub of
the congress � Easy and straightforward access between halls � Excellent audio-visual with good technicians Netherlands � Flexible space � Good parking � Knowledgeable staff Italy � Centrally located or good connections with the city centre � Enough space for the flow of participants � Centrally located exhibition compared to the rest of the congress
area Italy (No. 2) – also worked in Turkey & Netherlands � Accessibility (airport, buses, public transportation, trucks,
Switzerland � Nearby (connected?) accommodation � Easy / spacious access space for buses / transfers, etc � Multi-function spaces for registration, functions, poster / exhibits,
etc
International Convention and Exhibition Centre – Feasibility Study Page 109 Auckland City Council July 2009
France � Access � Room capacity � Exhibit space Greece � Accessibility (public transport, vicinity to hotels) � Know-how of the staff and flexibility in accommodating different
needs � Available equipment & infrastructure (audiovisual, air
conditioning, lighting, health & safety) Canada � Accessibility of space � Ergonomic of the space
NZ � Ease of access (to the centre, for both participants and suppliers
/ exhibitors and within it) � Flexibility of the space (and the ceiling height in meeting rooms) � Ambience (is it a comfortable, attractive space)
What do you think will be the key drivers in terms of assessing venues for conventions of 1,000-3,000 delegates in the future? Please list them in order of importance.
UK From a PCOs point of view: � Hotel accommodation and access. � Does it fit well? Good exhibition space. � Are the support services good? From an international association point of view: � Standard and how it looks (high quality finish) � Cost � Session halls and how they are fitted out Netherlands � Option to have everything on one site. � Flexible space which can accommodate different types of
meeting Italy � Cost � Flexibility � Efficiency of the staff � Professionalism Italy (No. 2) – also worked in Turkey & Netherlands � Price � Access � Service
Switzerland � Most important by far: how easily the conference centre can be
reached for the majority of the participants (ie: is it near an international airport?) especially if you do not necessarily count on national conferences for such a number
� Attractiveness / appropriateness of destination (is it in any way
International Convention and Exhibition Centre – Feasibility Study Page 110 Auckland City Council July 2009
linked to the conference? Is the local host a leading authority? Is the “national” segment important in the association?)
� Cost: competitive pricing is important (there are huge differences out there in the market)
France � Easy access � Modular space � Rates Greece � Accessibility (both in terms of time needed to get there and in
terms of cost of travel) � Cost effectiveness for the organisers and the participants (venue
fees, catering services, hotel rates, local support) � Safety (terrorism or natural disaster challenges) Canada � Rental costs � Space layout (conviviality) � General costs (electricity, handling, internet, networking, all in
B. EXHIBITIONS Are exhibitions growing or shrinking in size and, if so, by what percentage would you estimate over the past 2 years?
UK I would say they are shrinking in size in certain fields, probably by about 10-15%. Italy Exhibitions are shrinking in size now. I cannot estimate the last two years, better to forecast the next two years! Italy (No. 2) – also worked in Turkey & Netherlands Depends on what kind of exhibitions; those alongside some medical meetings are shrinking a bit in size, but I would estimate not more than 5%.
Switzerland I’m guessing: they grow, but not as fast as participation to congresses. Companies need to justify spending and are more and more selective. France Shrinking: however, there will still be exhibitions! Greece I cannot answer this with accuracy but I would indicate a 10-15% shrinking at least in medical events based on a limited number of examples.
International Convention and Exhibition Centre – Feasibility Study Page 111 Auckland City Council July 2009
Canada In my opinion, exhibitions are growing. In the past 2 years, I would estimate about 10%. NZ Not much shrinkage. In fact, recent exhibitions have been larger than expected.
Do you envisage conventions becoming more or less dependent on exhibition revenue to meet budget and why?
UK If the city works on the basis of the revenue the conference centre will bring to the city and country, and in order to achieve that, offers the conference centre and exhibition space at a very reduced or even free rate, then the congresses will be less dependent on exhibition revenue. However, exhibition sales and sponsorship always provide a subsidy for registration fees and I do not see this changing. Netherlands Sponsorship and exhibitions are crucial to the financial success of conventions. Italy At the moment always dependent in the exhibition. Italy (No. 2) – also worked in Turkey & Netherlands Conventions always depend on industrial sponsoring and exhibitions are one of the important communication tools for the industry partners. Importance depends on the sponsorship mix for each meeting.
Switzerland Less. Sponsors will look for other ways of interacting, and are working with tighter budgets. France Less dependent because other sources of revenues will be used. Greece I don’t see much change in the level of dependence of convention budgets on exhibition. Of course if exhibition revenues fall, organizers will have to focus more on alternative sources of funding. Canada More dependent on exhibition revenue. Mainly because it’s a good ROI and ROO for organisations. NZ Little change. Association congresses are very dependent on the revenue.
Do you envisage any significant changes in the nature of exhibition space in the future, ie: particularly different from what it is
UK In order to sell space, the exhibitors have got to have traffic – see the point about creating the exhibition as the congress hub or focal point of the event.
International Convention and Exhibition Centre – Feasibility Study Page 112 Auckland City Council July 2009
today?
Netherlands No. Italy Some congresses are asking more info points, lounges, small meeting rooms for practical demonstrations. Italy (No. 2) – also worked in Turkey & Netherlands More attention for sustainable practice (eg: waste and energy management).
Switzerland Exhibitors will require increasing needs for connectivity & speed (internet). Ease of access for exhibiting companies (goods, stands) and low-cost solutions will be popular. France Yes; more open to public. Greece No. Canada Yes, exhibitions are becoming more and more interactive, less traditional. Networking opportunities are getting more and more creative. NZ Yes, less well defined display areas. Rather than having a stand (panels supplied or design / build by a specialist company), companies will have a ‘space’ which they can populate as they wish.
Comments: UK The exhibition hall should be sited in such a way that registration can be within the exhibition, thus guaranteeing foot traffic throughout the event. Posters and catering all contribute. I prefer venues with no lounge areas other than those within the exhibition.
C. TECHNOLOGY IN A CONVENTION CENTRE What should be the role of convention centres in delivering technology based services, eg: audience polling, live broadcasting, web casting, satellite links? Options might include (a) no role at all and everything outsourced, (b) basic services complemented by outsourcing or (c) full service which is always at the forefront of technological innovations.
UK As long as the services provided are excellent and competitive, for association meetings it is often better to have them in-house. For corporates, they generally like to bring their own. I do not think international clients would consider a venue without all the services a ‘good sell’ even though a PCO would manage all this for them. Netherlands Specialised companies are the best solution. They have always the latest technology. Venue needs to provide the cable infrastructure. Italy Basic services complemented by outsourcing services.
International Convention and Exhibition Centre – Feasibility Study Page 113 Auckland City Council July 2009
Italy (No. 2) – also worked in Turkey & Netherlands A good centre should always be able to offer full services, whether it is in-house or (partly) outsourced. Key issue for clients is the freedom to use their own preferred suppliers. Therefore, in order to keep prices competitive and maintain state-of-the-art level of service and production, a model including outsourcing would seem most appropriate. Switzerland Connectivity between all rooms and halls should be excellent. Get the wiring right from the beginning. Be able to segment as well as connect whole areas. Connectivity with Internet also important. Mixed conferences (live & video conferencing) will increase. Provide infrastructure but don’t prescribe in-house suppliers. Possibly use a preferred supplier system but make sure pricing is competitive. France Just a role of enabling easy access to it but not providing it. Client should be able to choose its suppliers without being forced to go through the convention centre. Greece Option (c) (full service which is always at the forefront of technological innovations) would be good if it came in competitive rates (compared to outsourcing) and same level of quality and services. Canada I think convention centres should offer all types of services to convention organisers as long as prices are competitive and that the organiser has the final say on who they choose to work with. Therefore, the services offered by the convention centre should be optional. Japan New technology is constantly being developed so installing it into a centre may mean that it becomes obsolete quickly. I suggest limiting infrastructure to LAN and WiFi and outsource all other services. NZ Provide the infrastructure, ie: currently high speed broadband and power and outsource all other services.
If you consider that the convention centre needs to provide technology based services rather than outsourcing, how much will the venues equipment and technical skill influence your decision to book that venue?
UK From a PCO point of view: � Depends on how well I rate the in-house services and
whether they are competitive From an international client point of view: � I think it would influence them greatly. Netherlands It is a crucial component of a convention. Italy (No. 2) – also worked in Turkey & Netherlands
International Convention and Exhibition Centre – Feasibility Study Page 114 Auckland City Council July 2009
The technical services within a convention centre are crucial as they facilitate the communication in a very direct way. Switzerland Will play a role for sure. References from other conferences will be a decisive factor in yes/no going to the centre. Greece It will influence our decision significantly but always in combination with the cost effectiveness of such a solution. Canada All will depend on conditions ($), flexibility and good quality / price balance. NZ Outsourcing preferred.
If you consider that the convention centre needs to provide technology based services rather than outsourcing, which services in particular would be required?
Netherlands Sound and high speed broadband. Italy Live broadcasting satellite links. Italy (No. 2) – also worked in Turkey & Netherlands Full audiovisual services for (theatrical) performances and high speed communication (including broadcasting services)
Switzerland I’m not in favour of Convention Centres only offering in-house providers. If you go that way and exclude all external providers, then by definition you need to be able to provide all services that might be needed. Don’t exclude anything. Greece Basic AV (speakers, projectors, etc) and built it translation and voting systems would be appreciated. It is, however, important that all these are compatible with technologies that may have to be outsourced for the same event. Canada Mostly IT services. NZ Sound and high speed broadband.
Comments: France The role of a convention centre is to rent space, nothing else.
International Convention and Exhibition Centre – Feasibility Study Page 115 Auckland City Council July 2009
D. SITE OF A CONVENTION CENTRE Assuming that the site meets criteria such as central city location, easy access to a range of accommodation, close to shopping and restaurants and good public transport options, what would be key characteristics of an ideal site?
UK Looking good – park or water, a pleasant place to be and something that ‘hits’ the clients when they do their first site visit; something that local clients can be proud of. Netherlands Nice architecture in quiet surroundings. Italy Daylight Green outside area for participants during breaks Flexibility of the structure. Italy (No. 2) – also worked in Turkey & Netherlands Excellent facilities for delivery of people and goods (accessible for trucks, buses, good loading and parking facilities) and of course close to an international airport. For visitors the area should allow walks and plenty seating arrangements outside in a green environment.
Switzerland Good visitor flow. Segmentation of areas without giving anyone the impression they are in a “lost corner”. Harmony between meeting rooms and exhibition area (not too far separated). Space, air, light. France High ceilings for exhibit halls, meeting rooms with table-chairs, internet Wi-Fi access all over the place. Greece All these described cover the characteristics of an ideal site. Additionally, a nice location, ie: with a nice landscape view, would be welcome in order to be able (a) to organise social events on-site and (b) to offer a relaxing setting to participants. But this is not as important as the characteristics described in the left column. Canada Layout of space, warmth of venue. NZ � ‘Iconic space’, ie: the Centre is known world-wide for its
ambience � Sense of indoors merging with the outdoors � Comfortable and functional, not ‘showy’ � Reflective of Auckland’s and NZ’s personality
International Convention and Exhibition Centre – Feasibility Study Page 116 Auckland City Council July 2009
E. ECONOMIC TRANSFORMATION The NZ Government is very focused on the ability of conventions to drive economic transformation, ie: knowledge gained and collaborations established at conventions have a positive benefit to NZ’s economy. Are you aware of any studies done (either formally or informally) which demonstrate how a convention centre generates economic transformation?
Netherlands UFI and or IFES – possible studies. Also refer to ‘Serving healthcare convention education and marketing’ published by the Healthcare Convention & Exhibitors Association – www.hcea.org. Italy MPI has done one in 2007 I guess for the Canadian Market. Italy (No. 2) – also worked in Turkey & Netherlands An extensive study has been done in Vienna, but I believe also Barcelona and Glasgow have focused on establishing the economic value of conventions for their cities. The area of research is not confined to the convention centre alone, but should confirm the importance of good facilities in order to attract events that bring a huge economic benefit to a destination.
Switzerland No, but I have heard of several examples of conferences that apply this principle and this is very well received. France The power is meetings and exhibitions industry is enormous: ie: Studies made by ICCA, IAPCO, MPI, etc. Greece No.
Canada No.
NZ No, apart from informal collection of feedback from clients already supplied.
F. CONVENTION FUNDING What role, if any, do you think a Convention Centre should have in assisting with funding to attract conventions, eg: deferred deposit payment schedule, seed funds with no interest payable, seed funds with interest payable? Or is it not a Centre’s role?
UK It depends on who owns the Convention Centre. If it is government or city owned, the benefits to the local economy outweigh any rent charged by the centre. If it is privately owned, it has to be commercial, and this can sometimes be too costly.
With regard to attracting events this can only be of benefit to the centre.
Deferred deposits and seed funds with no interest would be attractive.
International Convention and Exhibition Centre – Feasibility Study Page 117 Auckland City Council July 2009
I think that any interest on seed funds would be so low that the revenue would be negligible and the benefits of offering free seed funds would far outweigh this. Italy I think that a conference centre can really help by providing attractive terms for payment and cancellations. Italy (No. 2) – also worked in Turkey & Netherlands A convention centre requires business as much as all other stakeholders in the meeting industry. Therefore, being an equal partner in bid procedures is crucial. What kind of benefits the centre would offer depends on the bidding team and the client. But certainly adjusting deposit schemes is much appreciated in general. Switzerland The local / national government should be CRYSTAL clear on the objectives of the conference centre: if they are to make a profit, then let the management run it as such. I have seen examples of conference centres where the government “imposed” certain local meetings which then do not run profitably and potentially block dates which could have been used by profitable meetings / exhibitions. If a Conference Centre has to play the competition game, they should have a certain leeway in approaching finances towards the clients (after all, how else can they be accountable for results?). So if they want to provide seed funds, defer interest etc. because business will be better, then let them do so. France It is not the centre’s role. However, payment conditions / schedule should be flexible enough to adapt to client. Greece Although it is not the Centre’s primary role, assistance in funding to attract conventions would be very important. Considering that cost is a very important criterion for the selection of a city by Conference owners, all local parties (PCO, CVB, convention centre, hotels, etc) should contribute to the funding in any way possible. Canada The Convention Centre should definitely have a role in facilitating and assisting with funding. Too often clients are left with no way to go to jump start their event. NZ Seed funds with no interest payable would be helpful for some clients.
International Convention and Exhibition Centre – Feasibility Study Page 118 Auckland City Council July 2009
G. GOVERNANCE Have you seen any examples of successful ownership, governance, management or operations models? If so, please give a brief description.
UK Harrogate charges by per capita actual attending – highly subsidised by the city.
Cardiff and Manchester I think are free.
Brighton is free over a certain sized event (I think it is around 500) for the session halls.
Glasgow offers a subvention or subsidy (highly negotiable but can be as high as 25%) which is repayable by the client if the event makes a profit.
London, Birmingham, Edinburgh you pay for everything and they are all privately owned (I think).
All these are for conference space only; you pay for exhibition space generally by the m
2 – sometimes by m
2 sold,
sometimes by m2 occupied, sometimes by m
2 gross.
Netherlands Helsinki Convention Bureau is the best in Europe. Italy In my opinion a good model is the Convention Centre of Vienna and the Convention Bureau of Vienna. Italy (No. 2) – also worked in Turkey & Netherlands Cities that have been able to attract a lot of business recently are the ones where the governmental and commercial partners take the meetings industry and each other seriously. A centre should be (partly) publicly funded, but run as a business.
Switzerland No details available, only anecdotal data. France No! Greece No specific examples to provide at this point.
H. BUYER BEHAVIOUR What factors influence delegate attendance now as opposed to say 3 years ago, eg: has programme become more important? What do you think the key factors will be over the next 5 years?
UK CME (continuing medical education) is important for medical events and will continue to grow.
Cost of travel will be a disincentive, but CSR and green will counteract this and be an incentive. Netherlands Programme content is now the key focus. Conventions are slightly shorter in duration and include fewer dinners.
International Convention and Exhibition Centre – Feasibility Study Page 119 Auckland City Council July 2009
Italy The programme, the length of the programme has become more important. Key factors: � Real training programmes, time devoted to interactive
exchange, reach out before and after the congress. � Involvement of the community. Italy (No. 2) – also worked in Turkey & Netherlands Return on investment, ie: educational value, networking opportunities
Funding, ie: sponsorship formats allowing delegates to attend
Security, ie: destinations should be safe for delegates
Switzerland Programme is very important, costs are still very important, and “secondary motivators” such as CSR and Green play an increasing role. These will continue to grow in importance. France Education, education, education! Greece Programme has definitely become more important. There is an abundance of conferences and meetings offered all over the world and participants are becoming more and more selective. Other key factors: � Cost / funding options � Easy & quick travel to the venue � Safety/ security � Networking / exchange opportunities provided by the event � Provision of CME credits for medical/ scientific events. Canada Costs and combination of business and pleasure. NZ Programme is now a key drawcard for delegates and, as a result, is an important part of a potential sponsor’s or exhibitor’s assessment of whether to participate. Other factors include interactive sessions, opportunities to ‘meet the experts’, opportunities to participate in pre-congress workshops on specific topics, dialogue with mentors, opportunities to meet those with whom they might collaborate in future.
I. SUSTAINABILITY If NZ was to demonstrate an outstanding commitment to sustainability in its approach to its convention centre facilities and marketing, what might that look like?
The Netherlands Sustainability is not such a key issue amongst medical convention organisers. Italy (No. 2) – also worked in Turkey & Netherlands Involving for example the green meeting council and other organisations in building the venue and subsequently committing to sustainable business practice as a standard.
International Convention and Exhibition Centre – Feasibility Study Page 120 Auckland City Council July 2009
Switzerland Don’t greenwash, hire a consultant and get it right (or the backlash will hurt you). France See what ACCOR is doing, or other big companies. Greece Indicative list: � Natural light in function areas (not meeting rooms) � 100% dependence on RES (solar, wind) for the needs of
the Convention centre � Full recycling programme for all meetings held there � Involvement of local community in the provision of services
(workers, additional staff to support an event, etc) � E-marketing instead of printing brochures, etc.
Do you believe that the distances involved in travelling to NZ have a negative impact on NZ as a convention destination. If ‘yes’, please describe those impacts and how long-term you think they may be.
UK Yes, from Europe, but probably not from elsewhere. Its desirability and environment make it attractive. Italy I do not think that the distance has a negative impact. Italy (No. 2) – also worked in Turkey & Netherlands Yes, of course the impact of long haul travel is an issue to address, since it is costly and environmentally unfriendly. NZ needs to work with travel partners (airlines) in order to offer special convention rates, as well as programmes for off-setting the CO2 emissions of a delegate (sponsored).
Switzerland Yes: increased costs, more time out of the office. In the longer term we may hope that travel costs will go down further (competition) and that video conferencing may provide a viable alternative for certain participants. France Yes – it’s far away. Travel restrictions (finance, sustainability, flu, terror) could mean people find new ways to meet. You should focus on your regional market (Australia, Asia) and market your destination as a ‘green, CSR oriented’ one. Greece Yes, at least for conventions with participation from Europe and the Americas. Although NZ is perceived as a very attractive destination, the cost and time involved in attending a meeting there is an important consideration. I guess that the time factor cannot change significantly in the short or long term but the overall cost factor (ie: balancing the high cost of an air-ticket with very competitive hotel rates and local service costs) can be changed. Canada Unfortunately, yes. The travelling time would discourage participants.
International Convention and Exhibition Centre – Feasibility Study Page 121 Auckland City Council July 2009
J. CREATIVE ENVIRONMENT If NZ’S National Convention Centre was praised for its wonderful creative environment which truly fostered communication and became a drawcard for convention business, what would be the reasons?
Italy (No. 2) – also worked in Turkey & Netherlands Complete integration of sustainable business practice, attractive spaces and facilities for delegates to communicate in small groups outside of the programme (including inexpensive good catering facilities and outside relaxing areas). France The answer is in the question. Greece � Excellent facilities & infrastructure � Dedicated & enthusiastic staff � Service oriented � Competitive rates � Innovative ideas
K MEETING SPACES Is an Auditorium an appropriate facility for future conventions and, if so, why? If not, what do you envisage replacing an Auditorium with for plenary sessions? Or will there be any plenary sessions in the future?
UK There will always be an opening and probably a keynote address. Potentially governmental meetings will use plenary sessions more than others.
The Edinburgh model of the ‘Micky Mouse’ is excellent. It is shaped as per Micky Mouse face. In plenary the two ears and the round face are all open; or you can revolve each ‘ear’ singly to create a plenary and one concurrent hall, or 3 smaller halls. It takes only 15 minutes to ‘revolve’ each hall, so it can be done in a coffee break. Italy I still believe that there will be plenary sessions but also more and more breakout sessions for small groups. Italy (No. 2) – also worked in Turkey & Netherlands Yes it is, as an auditorium adds a theatrical atmosphere – a special value – to a plenary session. An auditorium also allows for a business model that includes performances not related to a convention, thus adding to the centre’s profitability and place in the community.
Switzerland Auditorium = ok, now and in the future. But more and more break-outs will be organised in addition to the main sessions. France Not sure that an auditorium is the future. I’d rather say modular flat rooms are the future; but yes, there will still be plenary sessions. Greece It depends on the type of the meeting. I believe that in scientific meetings plenary and / or keynote lectures will continue to exist
International Convention and Exhibition Centre – Feasibility Study Page 122 Auckland City Council July 2009
even though at a smaller ratio compared to workshops, expert meetings and other similar types of sessions requiring school type or round table set up. However, a theatre-style auditorium will always be useful for ceremonies and other similar events which need to accommodate a big number of attendees all at once. Canada Yes, I think an auditorium is an appropriate facility. NZ Plenary spaces will still be required but they should be flexible enough to be converted into smaller spaces. Retractable tiered seating would be ideal.
L SATELLITE MEETINGS Do you predict an increase or decrease in satellite meetings associated with conventions? If any increase, what would be the duration of those meetings and what are your reasons for predicting an increase?
Italy I see at the moment a stable interest, ie: not increasing and not decreasing. Italy (No. 2) – also worked in Turkey & Netherlands A satellite session offers the opportunity for a sponsor to provide educational material and thus communicate directly with potential clients – it is the most interesting form of sponsorship during medical conventions and an increase is to be expected. Duration varies 1 – 1.5 hrs.
Switzerland More. Short sessions of up to 1.5 hours maximum. Typical design will change from “sit down & listen” to free-flow and interact. More use of technology, also to connect with “outside” while participating in sessions. France If we talk about medical or healthcare conventions, I don’t think there will be an increase. I don’t foresee a development of satellite meetings. New kinds of sponsorship will evolve. Greece It is possible that there will be an increase in satellite meetings (especially sponsored ones) since companies are more likely to fund educational events rather than leisure ones (as has been the case in past years) and satellite meetings provide a very good option for this. NZ Not increasing. Current preference is for workshops rather than fully-fledged satellite meetings.
International Convention and Exhibition Centre – Feasibility Study Page 123 Auckland City Council July 2009
M. ECONOMIC CLIMATE Do you think the current economic downturn is similar to past downturns in the convention industry or is it more deep-seated and likely to last longer? If longer, when do you think the upward swing will start again?
UK By time your convention centre is built, this downturn should be a thing of the past (we all hope!) But the convention industry is cyclical it just depends on how high are the highs and how low the lows. Italy As far as our data are concerned we are having a downturn in 2009 but our figures will again be good in 2010. Italy (No. 2) – also worked in Turkey & Netherlands I think the impact of the economic downturn on the meetings industry is similar to previous downturns. Business for 2010 is already picking up, as meetings are a very important communication tool and will always be around.
Switzerland There are differences, but after a downturn there will be an upturn for sure. Our industry evolves constantly and we shouldn’t fear this. There are already plenty of good signals. France Longer because more deep-seated and not only linked to economic downturn. Greece I am not in a position to compare this downturn with previous ones nor to predict its duration. Canada I think there will be a major shift on how people will do conventions but I do think meetings will continue to take place sooner than later. NZ A slight downturn in 2009 but a strong positive rebound in 2010.
International Convention and Exhibition Centre – Feasibility Study Page 124 Auckland City Council July 2009
N. BEST PRACTICE Please give 2 or 3 examples of outstanding convention centres and the reasons for your choices.
UK SECC (Glasgow) – wonderful exhibition space well located vis-à-vis the session halls; fabulous working relationship with the team; great parking, hotels onsite, good site by the Clyde River. Italy Vienna – size, marketing and flexibility. Paris for the same reasons and especially for its central location. Italy (No. 2) – also worked in Turkey & Netherlands ICM Munich, great service, high quality for reasonable prices, lots of natural light.
Switzerland Munich: versatility Paris (Palais des Congres): multiple room sizes & “compact” feeling France Palais des Congress, Paris (easy access to and inside). American Convention Centres (modular). Greece Washington Convention Centre – level of expertise for all related services New Orleans – flexibility Montreal – level of expertise for all related services. Australia Liverpool Vancouver Melbourne
O. OTHER POINTS If you wish to make any other points, please do so in the box on the right.
Italy (No. 2) – also worked in Turkey & Netherlands Security and emergency facilities should be an integral part of the complete structure and service model.
International Convention and Exhibition Centre – Feasibility Study Page 125 Auckland City Council July 2009
APPENDIX 3: FEEDBACK FROM CONFERENCE COMPANY’S CLIENTS April and May 2009 International Dairy Federation World Dairy Summit held in Auckland in 2001 and to be held there again in November 2010 The World Dairy Summit (WDS) in 2001 was invaluable in enabling a number of New Zealanders to gain a high profile within the International Dairy Federation (IDF) and, in so doing, position themselves to influence the agenda of this important Federation. We have to deal with dozens of new regulatory issues, standards, policies, guidelines and position statements produced by the IDF each year most of which have the potential to very significantly impact the dairy industry in NZ. By hosting the WDS in 2001 we have been able to strengthen our ability to steer IDF work to maximise its value to NZ and minimise any loss of value that could of resulted from the implementation of inappropriate standards etc. Without the WDS in 2001 I doubt I would have been elected onto the IDF Board from 2002-2008. I am sure there were literally hundreds of people who made new contacts at the WDS. Jeremy Hill, Fonterra Co-operative Group Summit Organising Committee International Society of Paediatric Oncology (SIOP) Congress to be held in Auckland in October 2011 I think the benefit over and above those already known about international congresses is the profile that NZ gains as a result of exposure. NZers are known to be "doers" and there are many who are well regarded scientists and others who have international respect. I think in some ways, those people are even more respected because they have arisen out of a small country with a very small population and are regarded almost as "overachievers". We are not well known as a nation with resources. We have a small research budget but have established a reputation as a desirable place for early phase drug trials because we do them well. It would add to the perception of NZ as a desirable centre for research and coordination of scientific effort if we hosted more events. (Much as we have seen an upsurge in visiting performers with the availability of Vector). Specifically, having Auckland as a conference destination for the SIOP Congress grows the number of NZers who achieve international exposure and increases the chances that these people will have influence over choices in the future. This applies both to health professionals and to the parents/survivors etc. who will have a high profile at our Congress. A good Auckland Congress will have NZ contesting hosting rights again in less than 10 years. Scott Macfarlane, Paediatric Oncologist, Starship Hospital Congress Convenor Institute of Brewing and Distilling Asia Pacific Section Convention held in Auckland in 2008 The most important aspect was the transfer of knowledge both at the convention and also as a result of delegates briefing colleagues who did not attend and making the proceedings available to them as well. Smaller brewers who do not usually interact with the Institute became aware of the Institute’s resources available to them and how to make best use of them. The exhibitors, particularly NZ based ones, gained great profile as all the catering and some functions were held in the exhibition area. For the NZ exhibitors this means future orders which may have not eventuated otherwise. Being a prominent player in the convention had positive benefits for Lion Nathan in terms of profile, networking and potential new business. David Meads, Lion Nathan Convention Convenor
International Convention and Exhibition Centre – Feasibility Study Page 126 Auckland City Council July 2009
AWH Phillips Symposium held in Wellington in 2008 Given that last year’s conference was an international conference with 14 keynote speakers of the highest calibre the knowledge transfer benefits were far superior to any previous conference. I am aware of at least several research collaborations that have/are developing out of personal contacts and discussions made at the conference. What is perhaps of more direct influence to us is that abstract submissions for this year’s annual conference (New Zealand Economists Association) are up by approximately 15%. This clearly enhances knowledge transfer and collaboration between New Zealand members as well. We also appear to have had more submissions than usual from overseas institutions. I cannot confirm that this is a direct link to last year’s major conference but the overseas institutions from which these registrations have come from are ones that we had representatives here last year. Later we will be able to provide statistics to back this up – bit early yet as registrations not closed. In arranging our keynotes we do find that New Zealand as a destination makes it relatively easy for us to get high calibre keynotes. The issue we have though is the availability of venues with sufficient breakout rooms (of reasonable size) to run multiple parallel sessions and also provide catering space. We managed this in Wellington last year but in New Zealand we are severely restricted in venue options of this type. Because most venues are not purpose built it leads to significant costs in retrofitting them for AV etc. as required. The only alternative is to use universities but these present their own challenges in that they generally cannot confirm forward bookings until far too late to get top international speakers (booking 2-3 years in advance). Mary Hedges, Business & Economics Faculty, University of Auckland Organising Committee International Symposium on the Biosecurity of Genetically Modified Organisms (10
th ISBGMO)
held in Wellington in 2008 For me these types of Conferences are vital for NZ. It is hard (time and $$) for us to travel to the Northern Hemisphere more than once a year or every other year. So, when International Conferences are held in NZ they provide unique opportunities to network with International specialists. When I lived in Europe and North America I was bumping into these types of people all the time at conferences and meetings. Face-to-face contact is vital to maintain good communication, good relationships and good understanding of issues. At ISBGMO the NZ and Australian regulators took the opportunity to bring together International regulators to discuss issues of common interest. This was a fantastic chance to have such a widely represented group in one place. I know that the Industry representatives at the conference also took the same opportunity. A National Convention Centre would provide a venue for these types of International Collaborations that is vital to the future of NZ’s research, regulatory and commercial interests. I have asked Geoff Ridley to give you feedback about a Workshop that he attended that was organised to coincide with ISBGMO on a specific topic that brought together an elite group of people to discuss a specific matter. The same group hopes to meet again around the 11
th ISBGMO.
Libby Harrison, ERMA New Zealand Organising Committee
International Convention and Exhibition Centre – Feasibility Study Page 127 Auckland City Council July 2009
APPENDIX 4: INTERNATIONAL BAR ASSOCIATION CONVENTION Edited comments from Judy Lane, PCO in England who organizes all IBA conventions around the world, and Bruce Slane, local representative who led NZ bid Since Auckland won the bid to host the IBA convention in 2004, the IBA manual has been rewritten to exclude locations which do not have a purpose built convention venue. Even Sydney, due to its lack of breakout rooms would not be considered suitable today. Summary:
� Overall very successful convention; very impressed with the food (used Austins and Relish and picked the best restaurants of the city for various functions).
� 2,400 delegates, 500 partners – spouse programme, with one business session for them (watched Whale rider, and had a presentation on Maori culture).
� Bruce Slane felt it was the best IBA convention thus far.
� People complementary about SkyCity – AV excellent, delighted delegates.
� Used the Aotea Centre for the auditorium, SkyCity for the breakout rooms and the Marquee for the welcome function and stand up lunches.
� Initially Mark Ellis, Executive Director of the IBA very anti about coming to Auckland, however felt the convention in Auckland was very successful.
� However cost was high (marquees had to be installed for welcome reception and lunches $200k, covered walkways $70k). Turned out to be an expensive convention due to the ‘work around’ costs. NZ usually moderate in price for conventions, but the exchange rate and the work around costs eroded benefits.
� Didn’t make enough money for local IBA so won’t host here again (due to high hosting costs). Usually use conventions as fund raising activities for the Associations – not enough surplus this time.
� Would only come back to NZ if had a convention centre, and perhaps in 20 years. Would probably visit Australia before NZ again.
� But great for NZ lawyers to hear and mix amongst the best lawyers in the world.
� Organisers pre-empted every problem – fabulous attention to detail.
� Taxis, Tourism Auckland, Auckland Airport, hotels and restaurants heavily briefed prior to event – performed well.
� Staff well trained, willing to be friendly and helpful, converted their understanding to action.
� Several people complained about the amount of walking to the various venues – lost lots of delegates during the event due to distances. Catered for 1,800
International Convention and Exhibition Centre – Feasibility Study Page 128 Auckland City Council July 2009
people at the lunch, except only 800 turned up because rest were at SkyCity and couldn’t be bothered walking back.
� No coach transport except for tours – 1,000 people took advantage of the entertainment programme. Impacted negatively on the exhibitor numbers – lower pedestrian counts past their displays. Had to ensure Happy Hours and Café were located in the exhibition area to drive people there.
� Large number of very high quality receptions held by Auckland law firms during the convention. Eg: Bell Gully hosted a reception at the Museum, catered by Dawsons
� Many people traveled round the country, Eg: Bay of Islands, Rotorua, etc. There was a very big interest in visiting the country before and after the conference, while down here.
� Next IBA conventions to be held in
o 2005 Prague
o 2006 Chicago
o 2007 Singapore
(generally keen on European and North American locations, as most members are from Europe).
Other comments from Bruce Slane:
� Situation changed a lot in the past 15 years in regard to convention locations (Commonwealth Law Conference – had to do elaborate bus work-arounds, different hotels, etc).
� Previously could tolerate multi venues, however won’t accept this any more. Everyone is more demanding of IT – Powerpoint presentations are the norm, as are internet connections (20 computers in a cyber café at the convention, always full).
� CBD location absolutely critical – has to be the hub of the action.
� Had to work hard to get the convention to NZ. Had to risk personal reputation to host the convention in NZ.
� CPO was very concerned about the logistics and support.
� Sold it on the basis that NZ is the place where everyone wants to go but nobody has an excuse to go there. But still difficult to attract IBA to southern hemisphere. If hosted in North America, get a lot more delegates.
� Had to compete with Hong Kong and Vienna during the bid process in 1998 – everyone had been there ‘14 times’ already. HK has two large hotels either side of the convention centre.
� Everyone voted for HK (although v expensive venue) – NZ was seen as a lovely place, BUT had a very poor set up. A lot of criticism that Auckland did not have a convention centre.
International Convention and Exhibition Centre – Feasibility Study Page 129 Auckland City Council July 2009
� Exotic NZ factor very strong, as was safety and security of the country after 9/11.
� Auckland is an easy city to sell – attractive, visual.
� Big English law firms did not want to go to NZ – not seen as a business centre, too far away.
� Bruce sold it on the fact that they could call into many business centres or the Pacific Islands on the way down.
� Many had family or contacts down here anyway, so wanted to come.
� In the end there was an ‘anti-committee’ vote – against HK, for NZ, simply due to the process the Committee had used.
� Had to persuade many people that Auckland could host the convention successfully.
� Many attempts to stop the event going to NZ. Comments re other IBA conventions (vis a vis Auckland)
� Amsterdam – amazing convention centre, but rude, unhelpful staff in a difficult location, 45 minutes tram ride from town, nothing around, bare and boring, people like to be able to wander around shops and cafes.
� Sydney – Darling Harbour – state of the art, but stark inside the building.
� Auckland – good service, good food, comfortable venue, interesting and attractive city, everything worked well, the infrastructure as excellent, but expensive, not undercover, time involved in building infrastructure was enormous.
� Cancun – one big hotel, boring, took 15 mins to walk from one end of the hotel to the other.
� Vienna – very expensive, olde worlde charm, very expensive accommodation or second grade.
� Hawaii – very big hotels.
� San Francisco – hosted at the Hilton, bad food, overcharging, poor service and the delgates felt very ripped off. Preceded Auckland convention, so had to work very had to make sure people went away with a better image of NZ.
� Vancouver – good convention, but centre too small.
Comments re hosting the IBA Convention in Auckland:
� Looked at using the Force Cinemas – however Executive didn’t want to go past the arcade area as it was tatty, and there were no stages for speakers in the theatres. Force also was not prepared to give all the theatres to the convention during the day in case there was a ‘blockbuster’ movie.
� Investigated using St James.
� Sky City was rebuilt – the saving grace. New facility across the road from the casino (otherwise wouldn’t have gone there).
International Convention and Exhibition Centre – Feasibility Study Page 130 Auckland City Council July 2009
� Sadly, Auckland has everything, except the purpose built centre – hotel infrastructure ok, sightseeing, other venues, transport all ok.
� If have to run a shuttle service connection people to venues and hotels, it adds $150k to the cost of the convention.
Comments re Auckland as the International Convention Centre location in NZ:
� Has to be in Auckland – logical choice.
� International plane connections.
� People from long haul flights don’t want to do another flight.
� Wellington is already full of government workers and business during the week.
� Better attractions in Auckland.
� Having it central is critical – freedom to walk is paramount, especially with the bad traffic snarlups. Associated events must also be close – museum and Westhaven nearly too far. Several wine and cheese events hosted at St Matthews church.
� Needs to be near hotels – for this reason, The Edge is quite attractive at present.
� Queens Wharf location would be excellent – good proximity to hotels and iconic location.
� Nice to look out over the sparkling sea in breaks.
� Ambiance is important.
� Flexibility.
� Naming and location of rooms sometimes difficult for people - especially Maori names.
Other comments re law conferences:
� Generally law firms send partners to conventions and cover their costs, but not employees.
� Conventions are tax deductible, claim cost on tax return (for self-employed barristers).
International Convention and Exhibition Centre – Feasibility Study Page 131
Auckland City Council
July 2009
APPENDIX 5:
NEW ZEALAND VENUE COMPARISON
Feature
New Centre
The Edge
Christchurch Convention Centre
Location
�
Mid or fringe CBD
�
Views of the harbour on at least 1
side (ideal, but not essential)
�
Road on 1 side only
�
No buildings close by to allow for
terraces and promenades on 3
sides
�
Mid CBD
Road on 1 side, buildings on 2
sides, Square (primarily concrete)
on 1 side
�
Fringe CBD
Road between Town Hall &
Convention Centre (connected by air
bridge)
�
Town Hall - park on 1 side, roads on
3 sides
�
Convention Centre – roads on 2
sides, buildings on 2 sides
Indoor Ambience
�
‘Iconic space’ ie: the Centre is
known world-wide for its ambience
�
Sense of indoors m
erging with
the outdoors
�
Comfortable and functional, not
‘showy’
�
Reflective of Auckland’s and
New Zealand’s personality
�
Maximum use of natural light
�
Maximum use of New Zealand’s
natural m
aterials
NZI Convention Centre:
�
Functional m
eeting space which
could be anyw
here in the world
�
Natural light on the Square side
is a plus
Foyers:
�
Designed to be foyers for an
auditorium rather than exhibition
space
�
Natural light from the Square and
the floor and height of the BNZ
Foyer are a plus
Convention Centre:
�
Functional m
eeting space which
could be anyw
here in the world
�
Foyer is particularly unappealing
Town Hall:
�
Feels like a perform
ing arts venue
Outdoor Ambience
�
Wide terraces with retractable
roofing and promenades for
functions, catering and working
groups
�
Harbour views on at least
�
Only terrace is narrow and, as a
result, not often used
�
View over the Square is not
very appealing
Convention Centre:
�
Nil
Town Hall:
�
Little sense of connection with the
International Convention and Exhibition Centre – Feasibility Study Page 132
Auckland City Council
July 2009
Feature
New Centre
The Edge
Christchurch Convention Centre
1 side (desirable, not essential)
�
Substantial planting to create the
indoor / outdoor feel
�
Water features
river and park other than in Boaters
�
Only one side door leads to the park
Architecture
�
Visually appealing, but not
necessarily iconic (the emphasis
needs to be on the interior space
and how it connects with the
outdoors)
�
In keeping with its setting
�
Doesn’t blend into its surroundings
�
Not particularly attractive
Convention Centre:
�
Function with little eye appeal
Town Hall:
�
Blends into its surroundings but not
particularly attractive
Entry
Convention Centre:
�
Obvious entry point with good
protection from bad weather
�
Iconic entry which ‘sets the scene’
for the rest of the space
�
Well planned taxi and coach
pick up and drop off point
Suppliers / Exhibitors:
�
Multiple loading bays with good
protection from bad weather
�
Excellent storage
Participants:
�
No obvious entry point
�
‘Main’ entrance is off Square by
foot
�
No obvious taxi pick up point
�
Coach pick up and drop off is on
busy road near bus stops which
are
also used by the public
Suppliers / Exhibitors:
�
Limited number of loading bays
so timetabling of deliveries
required
�
Difficult to access foyers to pack-in
Participants:
�
Good access from Kilm
ore St
�
Obvious taxi pick up points
�
Space for coaches is limited
Suppliers / Exhibitors:
�
Good street level access into
Convention Centre but very small
loading bay and no storage area
International Convention and Exhibition Centre – Feasibility Study Page 133
Auckland City Council
July 2009
Feature
New Centre
The Edge
Christchurch Convention Centre
Central ‘hub’ for exhibition,
catering,
lounge,
posters,
etc.
�
Space which has the indoor /
outdoor feel, adjustable lighting to
suit the tone / time of day, good
ceiling height, light and airy
�
3 foyer levels prohibit the creation
of a ‘hub’
�
Convention Centre Halls are the only
possible ‘hub’. The space is stark
and doesn’t lend itself to being a
comfortable, appealing ‘hub’
Circulation
�
High speed escalators
�
‘Hub’ referred to above is in
a central location
�
Easy access between spaces
�
Stairs between levels
�
Meeting rooms on 3 levels
�
4 flights of stairs between the
lower NZI rooms and an exhibition
in the Air NZ Foyer
�
Ground floor access between the
Convention Centre and the Town
Hall is across a busy road
�
First floor access between the
buildings is via a glassed-in airbridge
which can be very cold in winter
�
Access within both buildings is by
stairs or a small lift
Breakout rooms
�
Modular space which can be
changed in shape and size to
fit breakout requirements
�
Good ceiling height for ease of
viewing audio-visual and to create
a sense of space
�
Limited number of breakout rooms
(if none of them are combined
there are 7 but one would be
needed for speaker preparation
and one for the Committee)
�
Ceiling height is too low when
upper NZI rooms are combined
(2 or all 3 of them)
�
Limited number of breakout rooms (if
none of them are combined there
are 10 but one would be needed
for speaker preparation)
�
Ceiling height is too low when
Meeting Rooms are combined
Lighting
�
Intelligent lighting in all rooms to
create the required ambience
�
Limited built in lighting options
�
Limited built in lighting options
Sustainability
�
Sustainability integrated into every
step of the design, construction
and ongoing m
aintenance of the
centre
International Convention and Exhibition Centre – Feasibility Study Page 134
Auckland City Council
July 2009
APPENDIX 6:
ASIA PACIFIC INTERNATIONAL CONVENTION AND EXHIBITION CENTRES
International Convention and Exhibition Centre – Feasibility Study Page 135
Auckland City Council
July 2009
APPENDIX 7: INTERNATIONAL ASSOCIATION CONFERENCES W
ITH NZ CONTACT
International Convention and Exhibition Centre – Feasibility Study Page 136 Auckland City Council July 2009
APPENDIX 8: INTERVIEWEES / INFORMATION SOURCES PERSONS / ORGANISATIONS INTERVIEWED Most interviews were carried out within the time available between the commissioning of the engagement (22 April 2009) and the delivery of the draft report (13 May 2009).
Interviewee Position Organisation Date interviewed
Jan Tonkin Managing Director The Conference Company Ltd, Auckland
24 April, 1 May
Alan Trotter
Chief Executive Conventions and Incentives New Zealand, Auckland
1 May
Rebecca Nelson International Bids Manager
Conventions and Incentives New Zealand, Auckland
1 May
Greg Innes Chief Executive THE EDGE®,
Auckland 11 May
Mohamed Mansour Director, Convention & Business Event Sales & Operations
THE EDGE®,
Auckland 11 May
Kate Stevens Sales Team Leader THE EDGE®,
Auckland 2 June
Nigel Morrison Managing Director SKYCITY Entertainment Group, Auckland
7 May
Simon Jamieson General Manager SKYCITY Hotels Group, Auckland
7 May
Neville Brown General Manager Wellington Convention Centre
5 May (phone)
Alan Garner General Manager, Business Development
Vbase Ltd, Christchurch
8 May (phone)
Graeme Osborne Chief Executive Tourism Auckland 4 May
Anna Hayward General Manager 4 May
David Hall Managing Director David Hall & Associates, Adelaide, Australia
30 April, 11 May, 12 May (phone / e-mail)
In addition, written survey responses were received from international PCOs based in UK, Netherlands, Italy, Switzerland, France, Greece, Canada and Japan (See Appendix 2). A late PCO response was received from Australia.
International Convention and Exhibition Centre – Feasibility Study Page 137 Auckland City Council July 2009
Information / data sources reviewed / referenced
Document name Document source Date
New Zealand Convention Centre: Business Case & Facility Recommendations
Horwath Asia Pacific Ltd, Auckland
2006
ICCA Association Database (member-only online database)
International Congress and Convention Association (ICCA), Amsterdam
2009
Statistics Report International Association Meetings Market 1998 to 2007
International Congress and Convention Association (ICCA), Amsterdam
2008
Statistics Report International Association Meetings Market 2007
International Congress and Convention Association (ICCA), Amsterdam
2008
Statistics Report, Country and City Rankings
International Congress and Convention Association (ICCA), Amsterdam
2008
Annual Report 2007-2008 Melbourne Convention and Exhibition Trust, Melbourne
2008
Powerpoint presentation re 2007 – 2008 Statistical Report
Union of International Associations (UIA), Brussels