Usage Of NASA's Near Real-time Solar And Meteorological Data For Monitoring Building Energy Systems Using RETScreen International’s Performance Analysis Module 5/17/2012 1 Paul Stackhouse and Robert Charles NASA Langley Research Center (LaRC) Urban Ziegler and Gregory J. Leng RETScreen International CanmetENERGY/NRCan LaRC Team Members: William Chandler, David Westberg, James Hoell and Taiping Zhang, SSAI RETScreen Team Members: Nathalie Meloche, Kevin Bourque, Farah Sheriff, Tommy Anderson and Julien Poirier NASA LaRC Research and Applied Science
Transcript
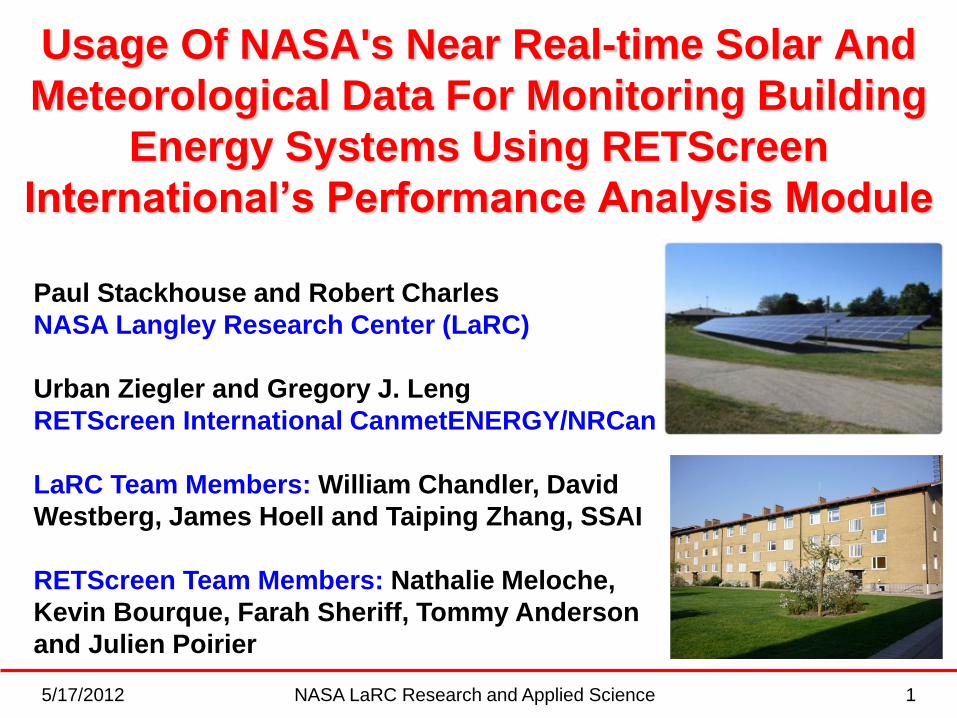
Usage Of NASA's Near Real-time Solar And
Meteorological Data For Monitoring Building
Energy Systems Using RETScreen
International’s Performance Analysis Module
5/17/2012 1
Paul Stackhouse and Robert Charles
NASA Langley Research Center (LaRC)
Urban Ziegler and Gregory J. Leng
RETScreen International CanmetENERGY/NRCan
LaRC Team Members: William Chandler, David
Westberg, James Hoell and Taiping Zhang, SSAI
RETScreen Team Members: Nathalie Meloche,
Kevin Bourque, Farah Sheriff, Tommy Anderson
and Julien Poirier
NASA LaRC Research and Applied Science
5/17/2012 2
NASA Applied Earth Science:
POWER Project
POWER = Prediction of Worldwide (renewable) Energy Resource
Objective: Improve the Nation’s public and private capability for integrating environmental data from NASA research to support energy production and increased energy efficiency.
Goals: Through partnerships derive/validate/provide
parameters relevant to industry needs; link to decision support, transition when possible.
Applied Sciences Goal: The Applied Sciences
program extends NASA Earth Science research and
observations for practical use in environmentally-
related decision and policy making.
• Emphasizes partnerships in variety of application
theme areas Climate & Energy
Key Theme
NASA LaRC Research and Applied Science
5/17/2012 NASA LaRC Research and Applied Science 3
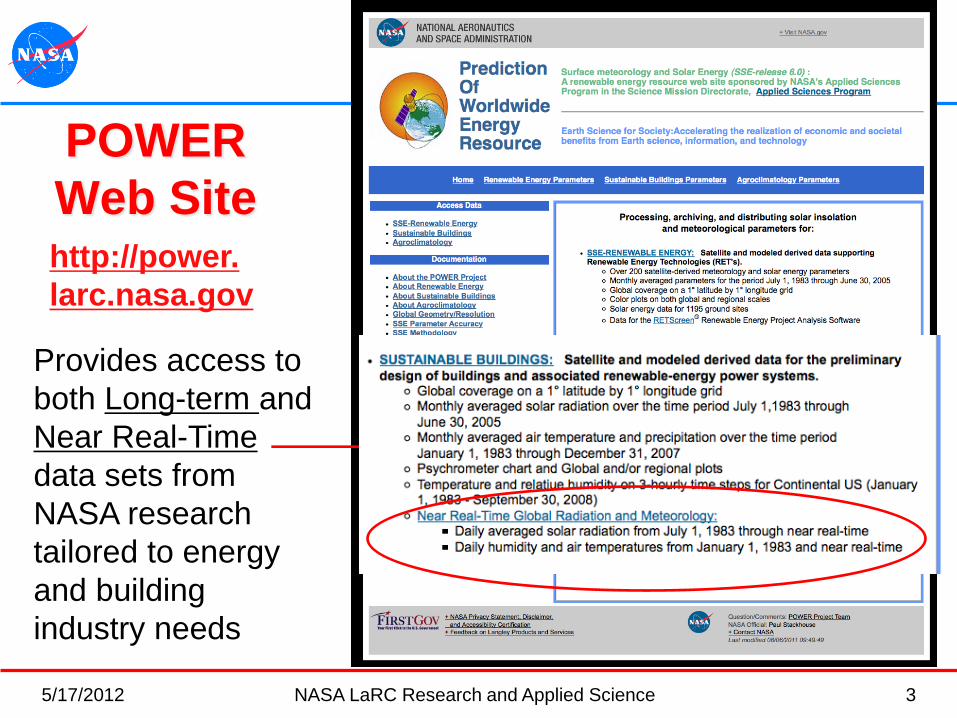
POWER
Web Site http://power.
larc.nasa.gov
Provides access to
both Long-term and
Near Real-Time
data sets from
NASA research
tailored to energy
and building
industry needs
5/17/2012 NASA LaRC Research and Applied Science 4
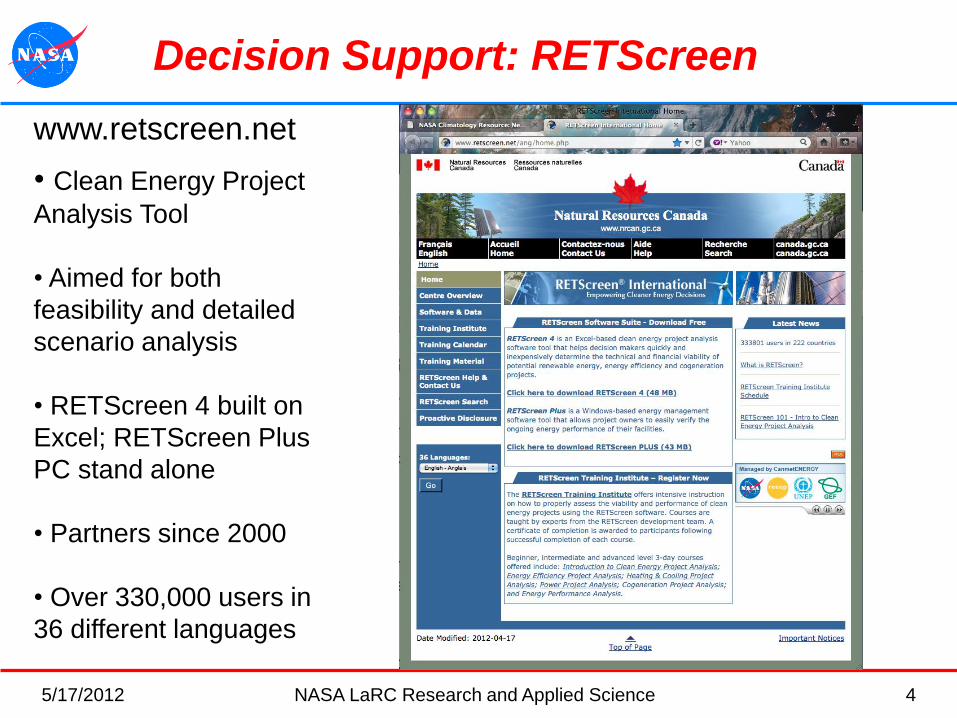
Decision Support: RETScreen
www.retscreen.net
• Clean Energy Project
Analysis Tool
• Aimed for both
feasibility and detailed
scenario analysis
• RETScreen 4 built on
Excel; RETScreen Plus
PC stand alone
• Partners since 2000
• Over 330,000 users in
36 different languages
5/17/2012 NASA LaRC Research and Applied Science 5
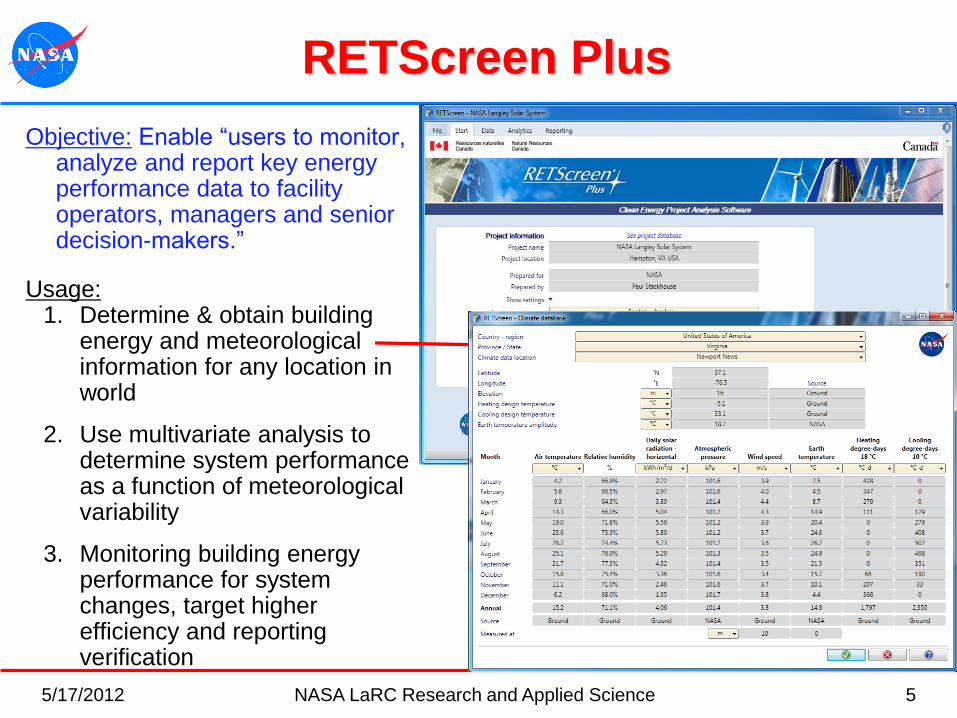
RETScreen Plus
Objective: Enable “users to monitor, analyze and report key energy performance data to facility operators, managers and senior decision-makers.”
Usage: 1. Determine & obtain building
energy and meteorological information for any location in world
2. Use multivariate analysis to determine system performance as a function of meteorological variability
3. Monitoring building energy performance for system changes, target higher efficiency and reporting verification
Average Insolation Incident On A
Horizontal Surface
SWV_
DWN
kWh m-2
day-1
CERES
FLASHFlux1
0.0
(0.1%)
0.69
(15.6%)
0.940
Average Atmospheric Pressure PS kPa GEOS 5.22 -- -- --
Average Air Temperature At 2 m T2M Co GEOS 5.22 -0.01 2.62 0.953
Minimum Air Temperature At 2 m T2MN Co GEOS 5.22 0.91 3.52 0.920
Maximum Air Temperature At 2 m T2MX Co GEOS 5.22 -0.93 3.37 0.936
Relative Humidity At 2 m RH2M % GEOS 5.22 -0.01 11.3 0.618
Average Earth Skin Temperature TSKIN Co GEOS 5.22 -- -- --
Wind Speed At 10 m WS10M m/s GEOS 5.22 0.37 1.81 0.446
NASA’s Near Real-time Daily Averaged
Data Time Series Parameter Variables Units Source Bias RMS
R2
1CERES FLASHFlux – NASA satellite based; validation using NOAA SURFRAD
measurements from 2008 – 2010 in US. 2GEOS 5.2: Assimilation model results; atmospheric model optimized by
observations; validation using NCDC surface weather observations worldwide
5/17/2012 6 NASA LaRC Research and Applied Science
Monitoring and Targeting Case 1:
NASA LaRC Badge and Pass Office
Example
Kiosk display
output
5/17/2012 7 NASA LaRC Research and Applied Science
Step 3: Cumulative differences in output relative to system function shows noise but performance steady.
Step 1: LaRC based CERES FLASHFlux project surface solar flux (blue) vs. Solar Panel Electrical Output (green) gives excellent correlation.
RETScreen Plus Tool
Step 2: Regression relationship defines the system as a function of available solar energy
Total Energy = 59,000 kWhr, 18% greater than specified
Monitoring and Targeting Case 1:
NASA LaRC Badge and Pass Office
8
Monitoring and Targeting Case 2:
Apartment Building Cluster, Höganäs, Sweden
• Apartment
building complex
in Sweden
• Use RETScreen
Plus & NASA
temperature data
to assess energy
usage before and
after energy
efficiency upgrade
5/17/2012 9 NASA LaRC Research and Applied Science
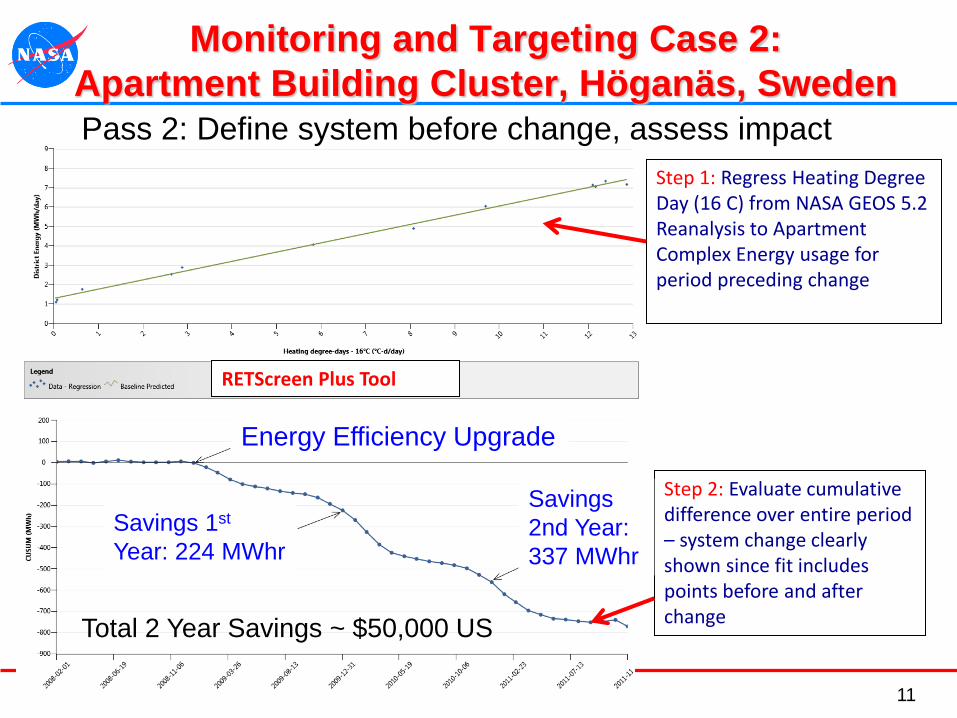
Step 2: Evaluate cumulative difference over entire period – system change clearly shown since fit includes points before and after change
Monitoring and Targeting Case 2:
Apartment Building Cluster, Höganäs, Sweden
RETScreen Plus Tool
Step 1: Regress Heating Degree Day (16 C) from NASA GEOS 5.2 Reanalysis to Apartment Complex Energy usage for entire period
Pass 1: Identified system upgrade point
10
Step 2: Evaluate cumulative difference over entire period – system change clearly shown since fit includes points before and after change
Monitoring and Targeting Case 2:
Apartment Building Cluster, Höganäs, Sweden
RETScreen Plus Tool
Step 1: Regress Heating Degree Day (16 C) from NASA GEOS 5.2 Reanalysis to Apartment Complex Energy usage for period preceding change
Pass 2: Define system before change, assess impact
Energy Efficiency Upgrade
Savings 1st
Year: 224 MWhr
Savings
2nd Year:
337 MWhr
Total 2 Year Savings ~ $50,000 US
11
5/17/2012 NASA LaRC Research and Applied Science 12
Conclusions
• NASA near-real time data sets and RETScreen Plus tool together provide a new capability to assess building energy system performance at any location in the world.
– Meteorological data sets from atmospheric reanalysis
– Solar energy flux inferred from satellite analysis
• The RETScreen Plus tool using NASA data was able to:
– Improve understanding and assess performance of a NASA solar power system in VA, USA.
– Provide an estimate of energy savings (and thus cost) for an apartment building complex in Sweden
• These examples show the usefulness of RETScreen Plus coupled with satellite analysis and modeling to contribute to energy efficient increases worldwide


![USAGE OF NASA'S NEAR REAL-TIME SOLAR AND … · 1/27/2012 · RETScreen International[1] is a division of Natural Resources Canada (NRCan), dedicated to developing and providing clean](https://static.documents.pub/doc/80x56/5ba4f1b909d3f235188c5152/usage-of-nasas-near-real-time-solar-and-1272012-retscreen-international1.jpg)