83
Internship Report On Financial Ratio Analysis of a 3 rd generation bank in Bangladesh. A Detailed Analysis of Jamuna Bank Limited

Internship Report
On
Financial Ratio Analysis of a 3rd generation bank in Bangladesh.
A Detailed Analysis of Jamuna Bank Limited

Internship Report on Financial Ratio Analysis of a 3rd
generation bank in
Bangladesh -A Detailed Analysis of Jamuna Bank Limited
Submitted To
Md. FazlaMohiuddin
Lecturer
BRAC Business School
BRAC University.
Submitted by
Sayan Das Mishu
Student ID: 11204076
BRAC Business School
BRAC University
Date of Submission: December 20, 2015

DECLARATION OF STUDENT
Myself, Sayan Das Mishu, ID-11204076, the student of BRAC Business School, BRAC University
(Major in Accounting). I have completed my Internship Program from Jamuna Bank Limited. I have
prepared this report on the Ratio Analysis of Jamuna Bank Limited Limited based on annual report
and other information. In this report I have included all the information, which I got during my
internship period. I have written this report on the basis of my work experience and observation
during the internship period.
So, I am declaring that, this report is original in nature and not copied from other sources.
Sayan Das Mishu
Student ID: 11204076
BRAC Business School
BRAC University

ACKNOWLEDGEMENT
I would like to express my deep gratitude to all those who have been helpful in the
preparation of this internship report. It certainly would not have been possible without the
help of many people and I would like to acknowledge my pleasure to all those who had
helped me during this entire process.
At the very beginning I would like to express my deepest gratitude to almighty for giving me
the strength and the composure to finish the task. Internship report is an essential part of the
BBA program and to complete the process I have worked in Jamuna Bank Limited,
Sonargaon Road Branch.
It is a great pleasure to prepare internship report on “Financial Performance Analysis of a 3rd
generation bank in Bangladesh.-A Detailed Analysis of Jamuna Bank”. On this manner I
would like to express my deepest gratitude to my honorable academic supervisor, Md.
FazlaMohiuddin, Lecturer, BRAC Business School, BRAC University for permitting and guiding
me to prepare the report.
I want to thank my organizational supervisor Mr. Mohammad MonirHossain, Executive
Officer for supervising and helping me in the work at Jamuna Bank Limited, Sonargaon Road
Branch.
I would like to express my thanks to Foreign Exchange Division especially, Ms.Sarmin
Sultana, Senior Executive Officer of Jamuna Bank Limited, Sonargaon Road Branch.
Above all I like to give thanks to every member of the branch for their helping hand
towards me. I really enjoyed this three month.

Executive Summary
Jamuna Bank Ltd. was incorporated as a public Limited company on the 3rd June 2001.under
Company Act 1994. This ia a 3rd
generation bank.. The Bank carries banking activities through its 97
branches in the country. The commercial banking activities of the bank encompasses a wide range of
services including mobilizing deposits, providing investment facilities, discounting bills, conducting
money transfer and foreign exchange transactions, and performing other related services such as safe
keeping, collections and issuing guarantees, acceptances and letter of credit.
Here I discussed about the “Financial Performance Analysis of Jamuna Bank Limited along with 2
branch financial performance comparison.” To discuss this I have also given information about the
vision, mission, goal, objectives, core values and all related information of Jamuna Bank Limited.” By
doing this report I am able to gain a vast knowledge hoe to calculate all financial retios and evaluate
the performance of a financial institution.
Customers of the bank are moderately satisfied to the service of the bank; employees of the
organization try their best to support the customer. Growth of JBL’s core is praiseworthy and we
complaint of all regulations throughout the years.

TABLE OF CONTENT
Topic Page No.
Letter of Transmittal i
Declaration ii
Acknowledgement iii
Executive Summery iv
(CHAPTER-01)
INTRODUCTION
1.1 Origin of the report 02
1.2 Objectives of the report 02-03
1.3 Methodology 03
1.4 Scope of the report 03
1.5 Significance of the report 04
1.6 Limitations of the report 04
(CHAPTER-02)
ORGANIZATIONAL PART
An overview of Jamuna Bank Limited 06-08
Corporate Vision 09
Corporate Mission 09
Values 09
Overall Strategic Objectives 10
Ownership Structure 10-11
Strategic Priority 11-12
Organogram of Jamuna Bank Ltd 12
Product and Services of Jamuna Bank Ltd. 13-17
(CHAPTER-03)
Job Responsibility& Observation
My Job Responsibility 19-20
My Observation 20-21
(CHAPTER-04)
Financial Performance Analysis
4.1 An Overview of Banking Industry of Bangladesh 23
4.2 Brief Discussion of Financial Analysis with Literature Review 24-25
(CHAPTER-05)
Ratio Analysis of Jamuna Bank Ltd.(2010-2014)
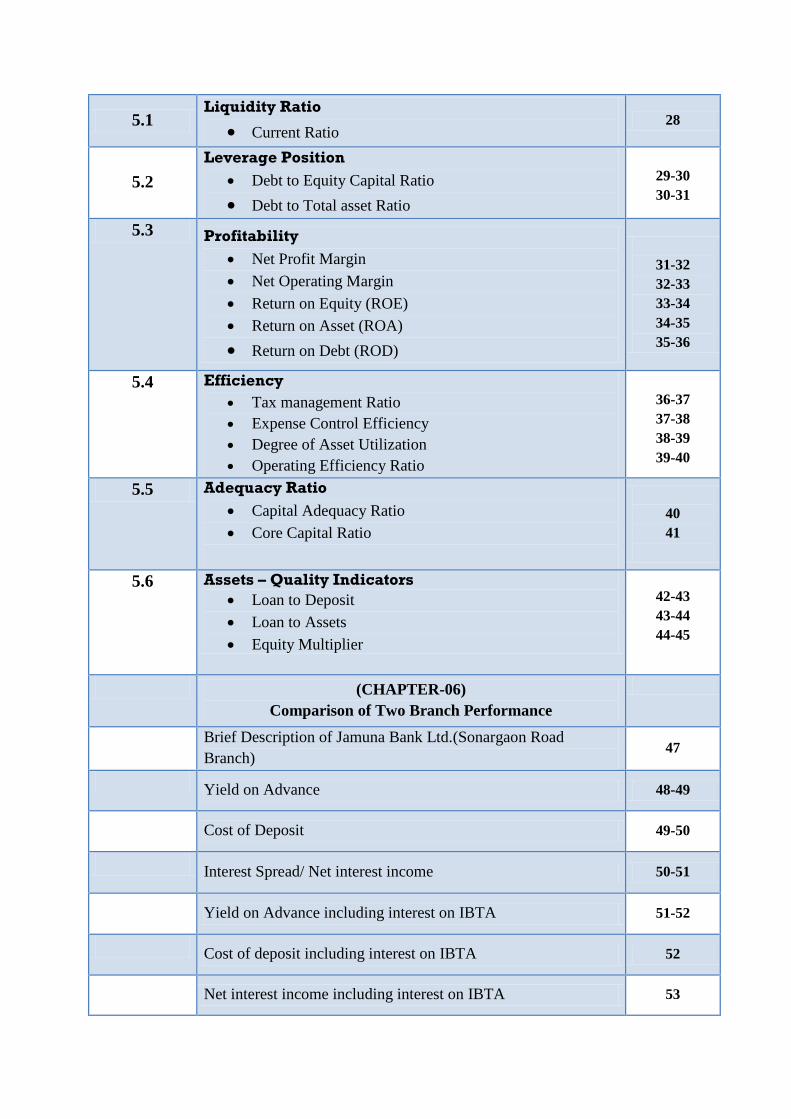
5.1 Liquidity Ratio
Current Ratio 28
5.2
Leverage Position
Debt to Equity Capital Ratio
Debt to Total asset Ratio
29-30
30-31
5.3 Profitability
Net Profit Margin
Net Operating Margin
Return on Equity (ROE)
Return on Asset (ROA)
Return on Debt (ROD)
31-32
32-33
33-34
34-35
35-36
5.4 Efficiency
Tax management Ratio
Expense Control Efficiency
Degree of Asset Utilization
Operating Efficiency Ratio
36-37
37-38
38-39
39-40
5.5 Adequacy Ratio
Capital Adequacy Ratio
Core Capital Ratio
40
41
5.6 Assets – Quality Indicators
Loan to Deposit
Loan to Assets
Equity Multiplier
42-43
43-44
44-45
(CHAPTER-06)
Comparison of Two Branch Performance
Brief Description of Jamuna Bank Ltd.(Sonargaon Road
Branch) 47
Yield on Advance 48-49
Cost of Deposit 49-50
Interest Spread/ Net interest income 50-51
Yield on Advance including interest on IBTA 51-52
Cost of deposit including interest on IBTA 52
Net interest income including interest on IBTA 53

Cost of Fund 54
Return on Assets 55
Deposit Mix
a) No Cost Deposit %
b) Low Cost Deposit %
c) High Cost Deposit %___
100
56
57
58
Operating Expenses to Average Assets 59
Non-Interest Income to Total Income 60
Deposit Advance Ratio 61
Income Expenditure (Ratio) 62
Employees Expenditure to Total Income Ratio 63
Per Employee Deposit 64
Per Employee Advance 65
Per Employee Revenue 66
Per Employee Profit/Loss 67
(CHAPTER-07)
Findings , Recommendations & Conclusion
Findings 69-70
Recommendations 70-71
Conclusion 71-72
Reference 73
Appendix

Chapter-01
INTRODUCTION OF
THE report

Description Of The project
1.1 Origin of the Report Internship program is the most important period for a BBA student. The duration of
internship program is 3 months, which carries a best learning process to know about the
organization and cope up the environment in such a way like professional employees. The
experience that got by an intern during the internship period will make them more smart and
professional in their future job sector. I was started my internship at Jamuna Bank Limited,
Sonargaon Road Branch from September 3, 2015 and ended in December 3, 2015
1.2 Objective of the Report
I have worked in various Department of Jamuna Bank Ltd, Sonargaon Road Branch. In this
report, I will try to make an overall analysis on all activities of Jamuna Bank Ltd specially
focuses on Financial prospect of the branch as well as whole bank.
Broad Objective
The objective of the Internship is to involve the students with the organizational
working environment and this report is a result of such organizational involvement. In
Bangladeshi context less number of researches was done on financial prospect of any 3rd
generation bank as well as less work done on financial performance of their branches. The
primary objective of this report is to provide critical evaluation on the Financial
Performance of A 3rd
generation Bank of Bangladesh over five years along with analyzing
two important branch financial position of that bank.
Specific Objective
For evaluating a 3rd
generation bank I chose Jamuna Bank Limited and evaluate its
financial performance from 2010 to 2014 using several ratios.
Two most important braches of Jamuna Bank Limited is Sonargaon Road Branch and
Mohakhali Branch. I evaluate these braches financial performance and finding their
competitive position
To find out the reason behind JBL’s enhancements or pitfalls of performance over years

Trying to find out the present performance of the bank and predate the near future
To gather knowledge about the profitability of the bank through Profitability Ratios
Trying to evaluate the operational efficiency of the bank
Lastly my observation from both practical working experience and financial performance
analysis and recommendation where they need improvement
1.3 Methodology The report is descriptive in nature. To prepare a report gathering data is very important. The
information was collected from both primary and secondary sources of data. Regarding the
information required was collected within the organization from the Corporate Division of
Jamuna Bank Limited
Primary data
• Practical desk work.
• Face to face conversation with the respective officers and clients.
• Questionnaire survey of Bank clients and employees.
• Collect ratios from Audit department
• Collect ratio of Mahakhali Branch and Sonargaon Road Branch
Secondary data
Study on Annual Reports of Jamuna Bank Limited.
Online data from JBL website.
Analysis several article related on financial analysis importance through internet
1.4 Scope of the Report
Banks have been playing an important role in economic development and contributing
immensely to build the country. Banking sector is fast expanding in our country because of
globalization and reform of private sector. To survive as a key player in this highly
competitive and complex business environment a bank should develop its business focusing
the customer’s satisfaction.
1.5 Significance ofthe report
As a student, I have learned about a bank; I also have learned the report writing, as a great
deal of theory is included in this report. It will be also benefited for the people who are
interested to know about JBL. The uniqueness of this report is the comparison of any
branch of this bank. Here I try to evaluate the two most important branch of JBL which
help user of this report to evaluate the performance of these two most important branch
financial prospects as well as predict other 95 branches financial performance.
1.6 Limitations of the study
Due to some legal obligation and business secrecy the bank was reluctant to provide some
sensitive data. Thus, this study limits only on the available published data and certain degree
of formal and informal interview and limited survey. Although the particular study is
extensive in nature, hard effort was given to make the study worthwhile and meaningful even
then there exists some limitation. Altogether the internship period in the bank was not free
from limitations. I faced some problems during the study, which I am mentioning below:
Lack of time
I was in the bank for three months so within this short span of time it is very difficult to be
familiar with all the activities of the bank.
Lack of Supervision by the bank officers
As the officers were busy with their daily working activities, they were not able to give me
much time apart from their daily working activities.
Restricted Information There were various types of information’s that the bank officers cannot disclose due to the
security and other corporate obligations.
Other limitation: As I was a newcomer and had no previous experiences in the banking sector and many
practical matters in the bank were in written form so my own observations may vary
from person to person.

Overview of Jamuna Bank Limited
Jamuna Bank Ltd. is a third generation bank in Bangladesh. It provides commercial banking
services in the Bangladesh. It is playing an important role to develop the business sector. The
growth of this bank is very good. Its motto is to provide a prompt and quick service to the
clients. Jamuna Bank Ltd. has implemented well-structured online banking systems that make
it easier to provide prompt services to the customer. The bank primarily engages in corporate
banking, trade finance, project finance, retail banking, small enterprise finance, consumer
finance, and syndication. Its range of service offerings include cash management services,
payments and clearings, safe deposit locker services, employee benefits, collection services,
treasury services, asset management, services and SWIFT for foreign trade.
Like the mighty river Jamuna, Jamuna Bank represents integrity, transparency prosperity of
one hand: resilience, enthusiasm, vastness and flourishing attitude on the other hand the way
the great river Jamuna incessantly and selflessly flows ahead holding all the resources within
it.Jamuna Bank also continues to enrich people’s lives with its multipurpose, countless
beneficial products and services which will change their destination towards a better future.
Being a 3rd
generation bank of Banglades, Jamuna Bank Limited is focused on-
Developing Human Capital
Provide best service to Clients
Remaining with time
Modernized product and services
Jamuna Bank Limited has so far been highly successful in keeping its clients satisfied with its
high quality service, while continuing its expansion to reach more people around the country.
It conducts all types of commercial banking activities. The core business of the bank
comprises of trade finance, term finance, working capital finance and corporate finance.
Jamuna Bank Limited is a highly capitalized new generation Bank with an Authorized
CAPITAL POSITION (December 31, 2014)
Authorized Capital: Tk.10000 million
Paid-up capital: Tk.4488 million (raised up around Tk.840 million from 2013)
Reserve & Retained Surplus: Tk.5650 million

Capital and Paid-up Capital of Tk.10000 million and Tk.4488 million respectively. The Paid-
up capital has been raised to 840 million and the total equity of the bank stands at 8325
JBL undertakes all types of banking transactions to support the development of trade and
commerce of the country. JBL's services are also available for the entrepreneurs to set up new
ventures and BMRE of industrial units. Jamuna Bank Ltd. the only Bengali named new
generation private commercial bank was established by a group of winning local
entrepreneurs conceiving an idea of creating a model banking institution with different
outlook to offer the valued customers, a comprehensive range of financial services and
innovative products for sustainable mutual growth and prosperity. The sponsors are reputed
personalities in the field of trade, commerce and industries. The Bank is being managed and
operated by a group of highly educated and professional team with diversified experience in
finance and banking. The Management of the bank constantly focuses on understanding and
anticipating customer’s needs. The scenario of banking business is changing day by day, so
the bank's responsibility is to device strategy and new products to cope with the changing
environment. Jamuna Bank Ltd. has already achieved tremendous progress within only
twelve years. The bank has already ranked at top of the quality service providers & is known
for its reputation.
The Bank offers both conventional and Islamic banking through designated branches. The
Bank is being managed and operated by a group of highly educated and professional team
with diversified experience in finance and banking. The Management of the bank constantly
focuses on understanding and anticipating customers' needs. Since the need of customers is
changing day by day with the changes of time, the bank endeavors its best to device strategies
and introduce new products to cope with the change. Jamuna Bank Ltd. has already achieved
tremendous progress within its past 10 years of operation. The bank has already built up
reputation as one of quality service providers of the country.
At present the Bank has real-time Online banking branches (of both Urban and Rural areas)
network throughout the country having smart IT-backbone. Besides traditional delivery
points, the bank has ATMs of its own, sharing with other partner banks and consortium
throughout the country.
Jamuna Bank Ltd. offers different types of Corporate and Personal Banking Services
involving all segments of the society within the purview of rules and regulations laid down
by the Central Bank and other regulatory authorities. As per the provisions of Bangladesh

Bank license, the Bank has offered initially its shares to public by Pre – IPO and
subsequently sold shares to the public through IPO in the year 2004. The shares of the Bank
are listed with both Dhaka Stock Exchange Ltd. & Chittagong Stock Exchange Ltd.
Jamuna Bank Limited (JBL) is a Banking Company registered under the Companies Act,
1994 with its Head Office at Hadi Mansion,02 Dilkusha C/A, Dhaka-1000. The Bank started
its operation from 3rd June 2001
JAMUNA BANK LIMITED (JBL) AT A GLIMPSE
Organization Name Jamuna Bank Limited
Short Form JBL
Logo
Corporate Slogan Your Partner For Growth
Operation Started 3rd June, 2001
Chairman Mr. Md. Sirajul Islam Varosha
Managing Director Mr.ShafiqulAlam
Operating profit (2014) Tk. 3021 million
Profit Before Tax (2014) Tk. 1847 million
Profit After Tax (2014) Tk. 1347 million
Number of Branches (2014) 97
Swift Code JAMUBDDH
Web Page www.jamunabankbd.com
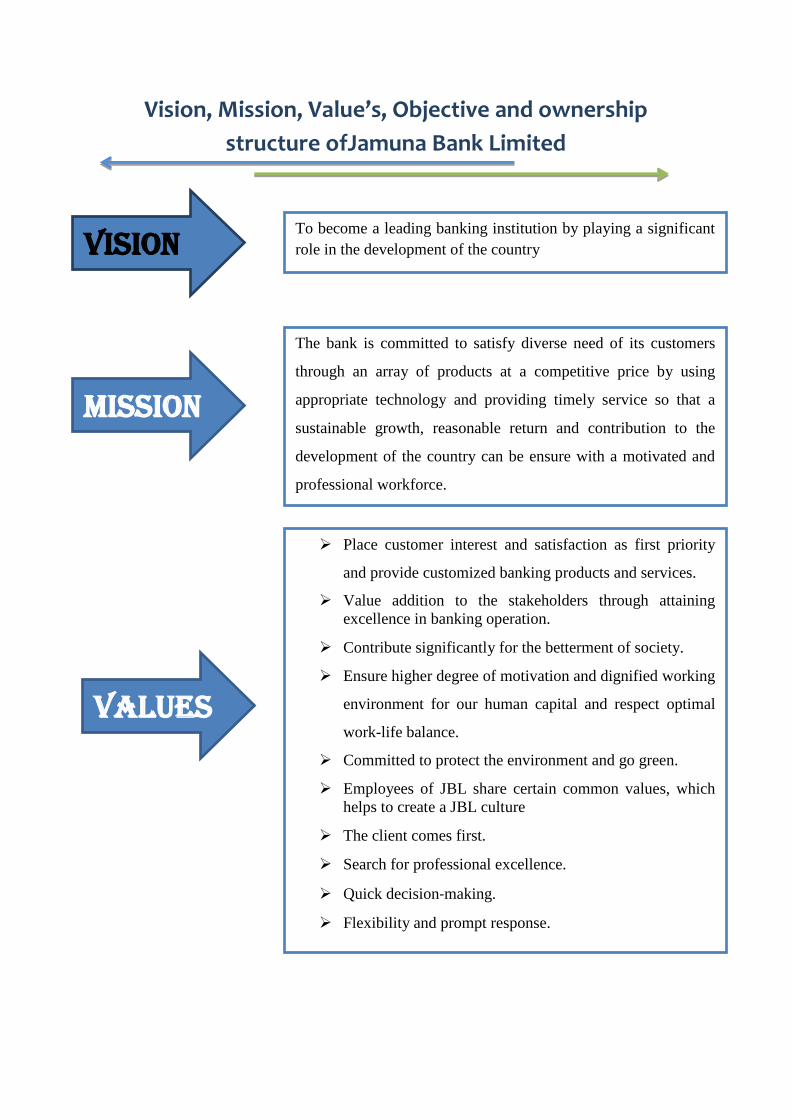
Vision, Mission, Value’s, Objective and ownership
structure ofJamuna Bank Limited
Vision To become a leading banking institution by playing a significant
role in the development of the country
Mission The bank is committed to satisfy diverse need of its customers
through an array of products at a competitive price by using
appropriate technology and providing timely service so that a
sustainable growth, reasonable return and contribution to the
development of the country can be ensure with a motivated and
professional workforce.
VALUES
Place customer interest and satisfaction as first priority
and provide customized banking products and services. Value addition to the stakeholders through attaining
excellence in banking operation. Contribute significantly for the betterment of society.
Ensure higher degree of motivation and dignified working
environment for our human capital and respect optimal
work-life balance. Committed to protect the environment and go green.
Employees of JBL share certain common values, which
helps to create a JBL culture The client comes first.
Search for professional excellence.
Quick decision‐making.
Flexibility and prompt response.
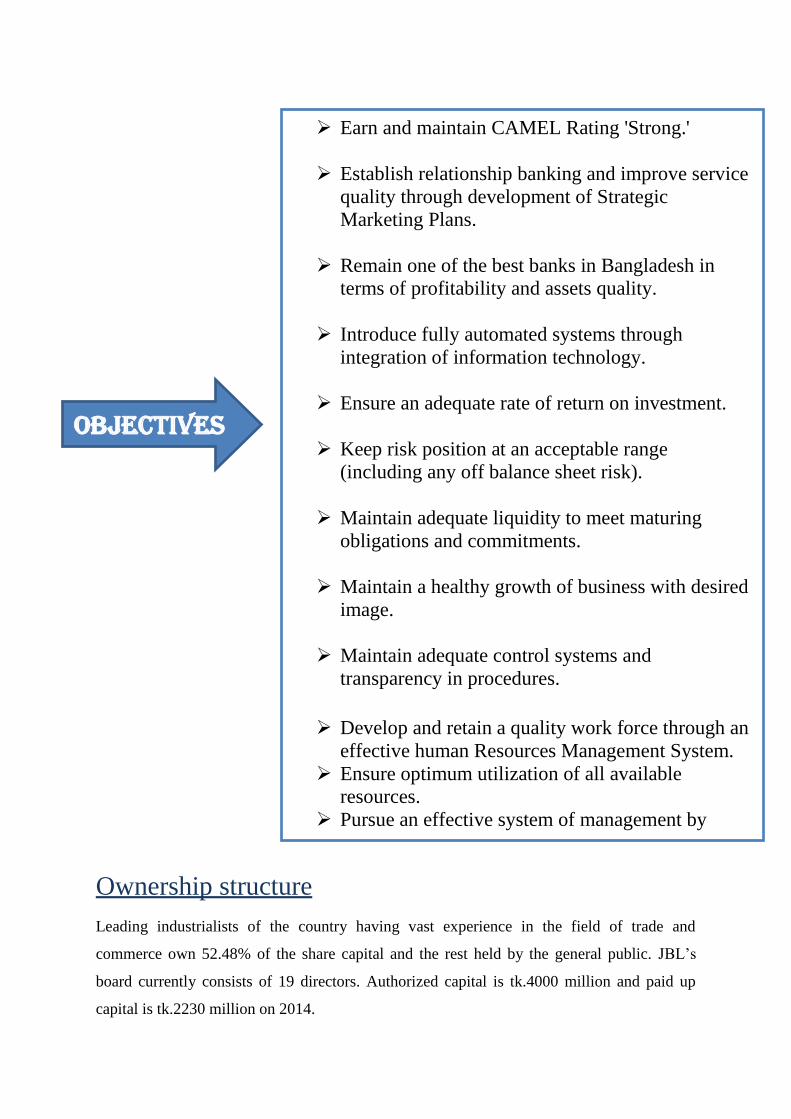
Ownership structure
Leading industrialists of the country having vast experience in the field of trade and
commerce own 52.48% of the share capital and the rest held by the general public. JBL’s
board currently consists of 19 directors. Authorized capital is tk.4000 million and paid up
capital is tk.2230 million on 2014.
ObjectIVES
Earn and maintain CAMEL Rating 'Strong.'
Establish relationship banking and improve service
quality through development of Strategic
Marketing Plans.
Remain one of the best banks in Bangladesh in
terms of profitability and assets quality.
Introduce fully automated systems through
integration of information technology.
Ensure an adequate rate of return on investment.
Keep risk position at an acceptable range
(including any off balance sheet risk).
Maintain adequate liquidity to meet maturing
obligations and commitments.
Maintain a healthy growth of business with desired
image.
Maintain adequate control systems and
transparency in procedures.
Develop and retain a quality work force through an
effective human Resources Management System.
Ensure optimum utilization of all available
resources.
Pursue an effective system of management by
ensuring compliance to ethical norms, transparency
and accountability at all levels.

Strategic Priority ofJamuna Bank Limited
Delivering customer’ desired products and services to create true customers’ value.
Focusing on export of both traditional and non-traditional items and remittance to
ensure a comfortable position of foreign exchange all the time.
Doing businesses that have higher risk adjusted return.
Focusing on maintenance of assets quality rather than its aggressive expansion.
Changing the deposit mix thereby reduce the cost of deposits.
Ensuring all modern alternative delivery channels for easy access to our services by
customers.
Taking banking to the doorstep of our target group.
Restructuring existing products and introducing new products to meet the demand of
time and the target group.
Entering into new avenues of business to increase profitability.
Bringing unbanked people into our delivery channels.
Increasing fee based service/activities where costly capital is not changed.
Ensuring organizational efficiency by continuous improvement of human capital and
motivation level, dissemination of information and thereby ensuring a sustainable
growth of the organization.
Maximizing shareholders’ value at all times alongside ensuring a sustainable growth
of the organization.
Pursuing CSR activities for our continued support to future generation, distressed
people and for advancement of underprivileged people of the country.
Establishing the brand image as a growth supportive and pro-customers’ bank.
Strengthening risk management techniques and ensuring compliance culture.
Remaining cautious about environment and supporting for maintaining a green and
clean soil.

Operational Network Organogram
Products/Service Offerings
The Bank has a collection of mode that prepared financial products and services. Such
products are based on Monthly Savings Schemes, Consumer Credit Schemes, Lease Finance
Chairman
Managing Director
Deputy Managing Director
Senior Executive Vice President
Executive Vice President
Senior Vice President
Vice President
Senior Assistant Vice President
Assistant Vice President
Junior Assistant Vice President
Senior Executive Officer
Senior Executive
First Executive Officer
Officer

and Personal Loan for Women and Shop Finance Scheme and so on. Jamuna Bank Ltd, also
familiar with Q-cash ATM cards for its valued customers providing 24 hours banking
services through Debit Cards. JBL offers the following services to valued customer. The
Bank is providing different types of services. Some of them are mentioned in below:
Islami Banking Branch In the year 2004, Jamuna Bank Limited opened another Islamic banking branch at Jubilee
Road, Chittagong on November 27, 2004. The already existing Nayabazar Islamic Banking
Branch started its operations from October 25, 2003, the total Islamic banking branches
stands at 02 (Two). The operational performance of the branches as on 31-12-2008 is shown
through the Balance Sheet, Profit & Loss Account of the Islam! Banking Branches below
:JBL’sShariah Council consists of 06 (Six) members, among them 02 (two) are Khatib, 01
(one) is Ex-Economic Advisor, 01 (One) is Vice chancellor, Islami University, 01 (One) is
Principal and other one is Banker. During the year 2009, the Shariah council of JBL
conducted 03 meetings to discuss all aspects of Islamic Branches operation.
Portfolio Management Service

Since inception, we have achieved an unparalleled reputation as a leading Merchant Banker
through providing portfolio management services by maintaining a high level of professional
expertise and integrity in client relationships. Keeping customer preferences as an investor in
mind, Jamuna Bank Ltd. has designed Investors’ Discretionary Account (IDA) and Bank’s
Discretionary Account (BDA). In these accounts the customers may enjoy loan facilities at a
ratio 1:1 for investments in private placement, IPO, and secondary market operations.
JBL Special Banking Services: Special Banking services of Jamuna Bank are considering the Personal services. The bank is
offering wide-ranging products and services. These services and products are matching with
the customer’s requirements. Transactions of accounts, savings schemes or loan facilities
from Jamuna Bank Ltd make available for every customer in a unique and uniform mixture
of easy and expert service superiority.
JBL offers the Special Banking Services like Current Deposit Account, Savings Deposit
Account, Short Term Deposit Account, and Fixed Deposit Accounts. It also offers attractive
rates on various deposit schemes.
JBL Corporate Banking Services Jamuna Bank Ltd. offers a complete range of advisory, financing and operational services to
its corporate client groups combining trade, treasury, investment and transactional banking
activities in one package. The corporate Banking specialists will render high class service for
speedy approvals and efficient processing to satisfy customer needs.Corporate Banking
business envelops a broad range of businesses and industries. You can leverage on the know-
how in the following sectors mainly:
Agro processing industry
Industry (Import Substitute / Export oriented)
Textile, Spinning, Dyeing/Printing
Export Oriented Garments, Sweater.
Engineering, Steel Mills
Chemical and chemical products etc.

Online Banking Jamuna Bank Limited has introduced real-time any branch banking on December 31, 2010.
Now, customers can withdraw and deposit money from any of its 65 branches located at
Dhaka, Chittagong, Sylhet, Gazipur, Bogra, Naogaon, Narayanganj, Dinajpur,
Kushtia,Rajshahi, Bashurhat, Sirajganj and Munshigonj. The valued customers can also enjoy
24 hours banking service through ATM card from any of Q-cash ATMs located at Dhaka,
Chittagong, Khulna, Sylhet and Bogra.
Types of Deposit account There are several types of deposit accounts. Each account has different characteristics and
every account has some specific purpose to serve.JBL offers the following key Personal
Banking Services. According to their uniqueness they are described as follows:
i. Savings Account:
It is the general account of the JBL (Mirpur Branch) individual or more than two persons can
open a savings account on JBL. The officers and authorize persons are issuing cheque book,
deposit slips and statement of account to the holder of savings. The officer justifies the
information that is submitted by the account holder for opening of the account. The officers

of the bank process account-opening formalities.
ii. Current Deposit Account: JBL is one of the newly established well-reputed third generation private commercial bank in
Bangladesh. It operates very diverse current account operation. They serve various types of
customers, like current account for private limited company, current account for public
limited company, current account for partnership business, etc.
iii. Foreign Currency Account:
The JBL also operate Foreign Currency Account for Bangladeshi Wage Earners or for
Foreign Nationals/Company/Firms etc. to send their valued earned foreign currency into the
country.
iv. Short Term Deposit Account (STD): JBL also offers Short Term Deposit to its valued customers. Short Term Deposit is a deposit
account where the payment of interest is paid on month basis. These items include the
deposits for a period ranging from 7 (seven) days to 89 (eighty-nine) days. These types of
liabilities are payable on special notice or after a specified period other than the fixed
deposits. Some of these types of deposits are of the nature of time deposits. The rate of
interest on STD account is 4.5% per annum. There are some rules and regulations that must
be maintained by the STD account holder. If the STD account holder wants to withdraw the
money from the account they have to inform the bank before, otherwise the account holder
may not get the interest in full amount.
Schemes: Schemes are the most important sources of enhancing banks deposit. Mainly bank is the
lender of money, which is deposited by various types of depositor. These schemes are
different in nature and types and also in interest rates. These deposits give the customers to
deposit the idle money in profit earning schemes and also provide the security. Jamuna Bank
limited as third profit earning to the depositors and generation modern and technology based
modern commercial bank offers various types of customer’s friendly deposit schemes to its
valued customers. These schemes are highly also unique in security.
Marriage Deposit Scheme

Marriage of children, especially daughter is a matter of great concern to the parents.
Marriage of children involves expense of considerable amount. Prudent parents make effort
for gradual building of fund as per their capacity to meet the matrimonial expense of their
children specially daughters. Parents get relief and can have peace of mind if they can arrange
the necessary fund for marriage of their children.
Loan (General)
House Building Loan (General
House Building Loan (Staff)
Other Loans to Staff
Cash Credit (Hypo.)
Cash Credit (Pledge)
Corporate Social Responsibilities of the Jamuna Bank Limited
Hire Purchase
Lease Financing
Time Loan
SOD (Export)
Cons SOD (General)
SOD (Others)
PAD
LlM
LTR
IBP
Export Cash Credit (ECC)
Packing Credit (PC)
F D B P
IDBP

JOB RESPONSIBILITIES
AND OBSERVATION
I was assigned at the Sonargaon Road Branch of Jamuna Bank Limited to complete my
internship program. During my three (3) months internship program I enjoyed the work at the
bank but most importantly I learned how to work under pressure with great responsibilities.
Throughout this time I have got the opportunity to work with different department of Jamun
Bank Limited. There are 3 different departments in Sonargaon Road Branch and they are:

1. General Banking (GB)
2. Foreign Exchange Department
3. Accounting Department (AD)
I was rotated across all 3 different departments in the past 3 months. However, my main
Concentration was Credit department and thereby, I allocated maximum time to work at
credit department section.
The Nature of the jobs and my Specific Responsibilities
The first week I was in the Cash Department. Banks don’t usually put interns in this
department but I was lucky to see firsthand what happens behind the counter. I did not have
much responsibility in that department as I was not to mess with their hectic and hasty
transactions, but they eventually did give me some work. My responsibilities in this
department were just to assist them in any small way possible. I learned the following from
this department:
1. Counting money in various ways
2. Use the counting machine
3. Use the photocopy machine
4. Counting the vouchers
5. Checking the individual EOD (End of day Journal report) of each cashier
Although these activities were small, they helped me understand the nature of the work.
At General Banking Division, I was assigned to GB (General Banking). I spent the next two
(2) weeks here. It was very arduous, but very fruitful. I had a wide variety of responsibilities
at GB:
• Bringing out the cheque books for the customers and verifying them,
• Counting the voucher of GB
• Finding the FD, DPS and old account opening forms
• Opening account for new customers and aiding them in the process
• Opening FD and DPS for new customers
• Putting 5 different types of seals for clearing
• Numbering shares and putting seals on them during IPOs
• Preparing the bill for the branch’s expenditure for that day
• Making solvency certificates
• Keeping things in order and at arm’s length
The work was really hard at GB. I also had to hear a lot of complaints from the customers. At
first I was demoralized. But later on I learned how to deal with it.
At Accounting Department, the last 4 weeks I was posted in the accounting department. The
routine daily tasks of the accounts departments areSuch as:
Arranging the supplementary and voucher
Input the employee salaries
File different document
Write several expenditure vouchers
Solve some ratios which was given my audit department to the branch accounts
department.
I also spend few weeks in Foreign Exchange Department under the supervision of Ms.Sarmin
Sultana (SEO). In that department main task is to fill up the Letter of Credit form and keep
record of all LCs in register book.
Observation
Working at JBL, Sonargaon Road Branch was a great experience for me. I have learnt many
things from them. From my little knowledge what I have observed and some
recommendations are as follows:
It was very interesting working at Jamuna Bank. The people there are really nice and
talented. The things that I have noticed and observed are:
• Work environment is very friendly and employees are co-operative
• Employees are active and sincere to their assigned job responsibilities
• Work is never left pending for the next day unless it is absolutely necessary

• The work process could be made faster with better computers and operating systems.
• There is always a rush of customers so there is no standard on what the employees do
throughout the day. The work activities of an employee is set, but what to do when varies
along the day
• The work activities are always set and divided for each of the employees. This is the way
it should be, but when I saw it firsthand it was remarkable. Each and every employee has
a certain set of responsibilities. He/she carries out those responsibilities throughout the
day. It is also easy to assign duties that way. Even though this is the case, I often saw
other staff members helping each other out.
• There is less coordination between casual staffs like tea boy, peon and cleaner.

Project Description
Description Of The project
Origin of the Report Internship program is the most important period for a BBA student. The duration of

internship program is 3 months, which carries a best learning process to know about the
organization and cope up the environment in such a way like professional employees. The
experience that got by an intern during the internship period will make them more smart and
professional in their future job sector. I was started my internship at Jamuna Bank Limited,
Sonargaon Road Branch from September 3, 2015 and ended in December 3, 2015
Background of the Report
I have worked in various Department of Jamuna Bank Ltd, Sonargaon Road Branch. In this
report, I will try to make an overall analysis on all activities of Jamuna Bank Ltd specially
focuses on Financial prospect of the branch as well as whole bank.
Broad Objective
The objective of the Internship is to involve the students with the organizational
working environment and this report is a result of such organizational involvement. In
Bangladeshi context less number of researches was done on financial prospect of any 3rd
generation bank as well as less work done on financial performance of their branches. The
primary objective of this report is to provide critical evaluation on the Financial
Performance of A 3rd
generation Bank of Bangladesh over five years along with analyzing
two important branch financial position of that bank.
Specific Objective:
For evaluating a 3rd
generation bank I chose Jamuna Bank Limited and evaluate its
financial performance from 2010 to 2014 using several ratios.
Two most important braches of Jamuna Bank Limited is Sonargaon Road Branch and
Mohakhali Branch. I evaluate these braches financial performance and finding their
competitive position
To find out the reason behind JBL’s enhancements or pitfalls of performance over years
Trying to find out the present performance of the bank and predate the near future
To gather knowledge about the profitability of the bank through Profitability Ratios
Trying to evaluate the operational efficiency of the bank

Lastly my observation from both practical working experience and financial performance
analysis and recommendation where they need improvement
Methodology The report is descriptive in nature. To prepare a report gathering data is very important. The
information was collected from both primary and secondary sources of data. Regarding the
information required was collected within the organization from the Corporate Division of
Jamuna Bank Limited
Primary data
• Practical desk work.
• Face to face conversation with the respective officers and clients.
• Questionnaire survey of Bank clients and employees.
• Collect ratios from Audit department
• Collect ratio of Mahakhali Branch and Sonargaon Road Branch
Secondary data
Study on Annual Reports of Jamuna Bank Limited.
Online data from JBL website.
Analysis several article related on financial analysis importance through internet
Scope of the Report
Banks have been playing an important role in economic development and contributing
immensely to build the country. Banking sector is fast expanding in our country because of
globalization and reform of private sector. To survive as a key player in this highly
competitive and complex business environment a bank should develop its business focusing
the customer’s satisfaction.
Significance ofthe report
As a student, I have learned about a bank; I also have learned the report writing, as a great
deal of theory is included in this report. It will be also benefited for the people who are
interested to know about JBL. The uniqueness of this report is the comparison of any
branch of this bank. Here I try to evaluate the two most important branch of JBL which
help user of this report to evaluate the performance of these two most important branch
financial prospects as well as predict other 95 branches financial performance.
Limitations of the study
Due to some legal obligation and business secrecy the bank was reluctant to provide some
sensitive data. Thus, this study limits only on the available published data and certain degree
of formal and informal interview and limited survey. Although the particular study is
extensive in nature, hard effort was given to make the study worthwhile and meaningful even
then there exists some limitation. Altogether the internship period in the bank was not free
from limitations. I faced some problems during the study, which I am mentioning below:
Lack of time
I was in the bank for three months so within this short span of time it is very difficult to be
familiar with all the activities of the bank.
Lack of Supervision by the bank officers
As the officers were busy with their daily working activities, they were not able to give me
much time apart from their daily working activities.
Restricted Information There were various types of information’s that the bank officers cannot disclose due to the
security and other corporate obligations.
Other limitation: As I was a newcomer and had no previous experiences in the banking sector and many
practical matters in the bank were in written form so my own observations may vary
from person to person.

Financial statement
analysis
Banking industry of Bangladesh
Banking sector plays an important role in the economic development of a country especially
Business and Economic Research for Bangladesh, a sound and efficient banking
system is one of the most important preconditions to achieve economic development.
The banking industry of Bangladesh is a mixed one comprising nationalized, private
andforeign commercial banks. Many efforts have been made to explain the performance of
these banks. Understanding the performance of bank requires knowledge about the
profitability and the relationships between variables like market size, bank‟s risk and bank‟s
market size with profitability. Indeed, the performance evaluation of commercial banks is
especially important today because of the fierce competition. The banking industry is
experiencing major transition for the last two decades. It is becoming an imperative for banks
to endure the pressure coming from both domestic and external factors and prove to be
profitable. Until the early 1985, Bangladesh had a highly repressed financial sector. Banks
and other financial institutions were fully owned by the government. In the early of 1980,
Bangladesh entered into the IMF/ World Bank adjustment programs and the process of
privatization and liberalization gained momentum under the influence of the World
Bank and The IMF. Since then the banking industry of Bangladesh has become an
attractive ground for both domestic and foreign investors to take part in the game. It
is of the utmost important of these players to prove themselves profitable and work on
those pillars of the same.
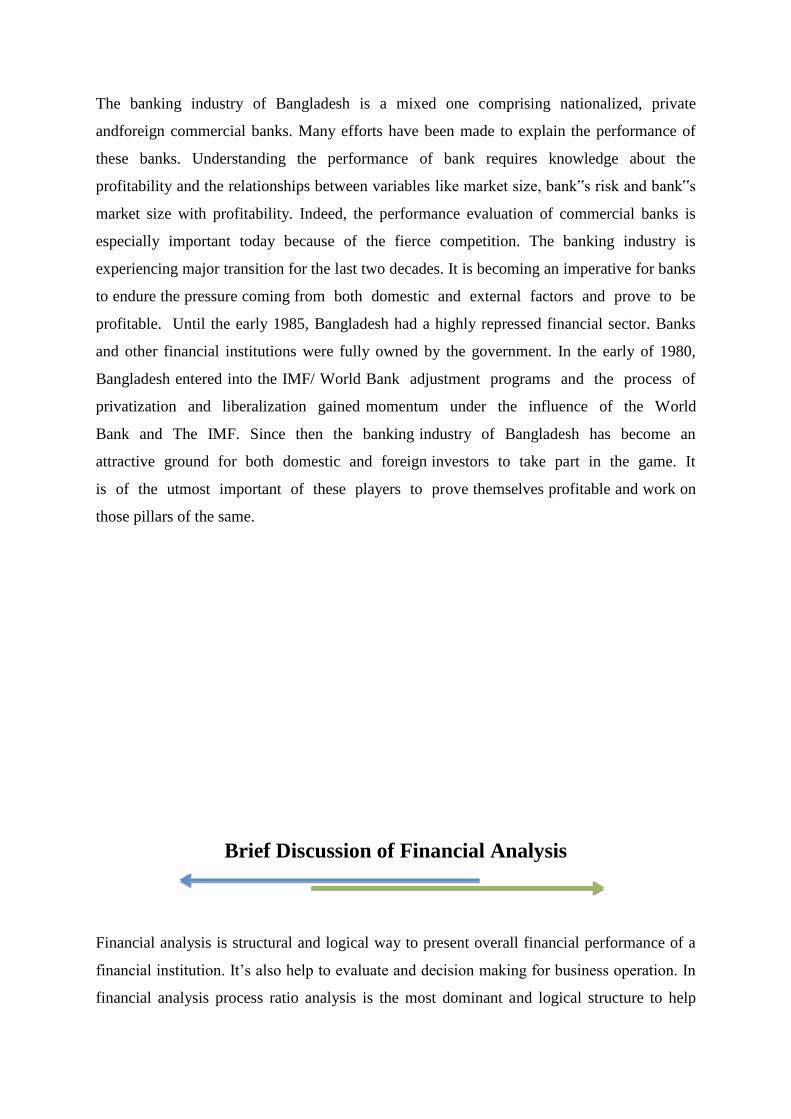
Brief Discussion of Financial Analysis
Financial analysis is structural and logical way to present overall financial performance of a
financial institution. It’s also help to evaluate and decision making for business operation. In
financial analysis process ratio analysis is the most dominant and logical structure to help

business related stakeholder. Under the financial ratio analysis process there are few
categories to identical area of financial institution. So business stakeholders try to concentrate
to get overall business overview from profitability, liquidity, assets management and
solvency ratio analysis. These ratios not only help to decision making process also
emphasized on risk avoiding and profit raising related factors. To calculate this ratio need to
take quantitative data from bank trading activity and other sources.
Financial statement Analysis involves a comparison of a firm’s performance with that of
other firms in the same line of business, which usually is identified by the firm’s
industry Classification. Generally speaking the analysis is used to determine the firm’s
financial position so as to identify its current strengths and weakness and to suggest action
the firm might pursue to take advantage of the strength and correct any weakness.
Literature Review
With respect to the Performances of Bangladeshi Banking sector, foreign and national experts
undertook number of studies. All this studies provide me a great insight to evaluate bank
financial performance by using one of the main indicators which is ratio analysis
The easiest way to evaluate the performance of a firm is to compare its present ratio with the
past ratio. It gives an indicator of the direction of change and reflects whether the firm’s
financial performance has improved, deteriorated or remained constant over time.(Pandey,
2004)
James pointed out that financial ratios are used by bankers, creditors, shareholders and
accountants to evaluate data presented on an entity financial statement. Depending on the
results of the evaluations, bankers and creditors may choose to extend or retract financing and
potential shareholders may adjust the level of commitment in a company. Financial ratios are
important tools that judge the profitability, efficiency, liquidity and solvency of an entity.
Van Horne & Wachowicz Jr(2005)stated that to evaluate a firm’s financial condition and
performance the financial analyst need to perform “checkups” on various aspects of a firm’s
financial health. A tool frequently used these checkup is a financial ratio.
One can employ financial ratios to determine a firm’s liquidity, profitability, solvency, and
adequacy used financial ratios to show the financial position and performance analysis of
Bank.(Qamruzzaman, 2014)

Chowdhury & Ahmed (2009) observed that all the selected private commercial banks are
able to achieve a stable growth of branches, employee, deposit, loans and advances, net
income, earning per share during the period of 2002-2006. They indicate that the prospect of
private commercial banks in Bangladesh is very bright.
With this increase of competition in banking industry, every bank is trying to provide
their customers better services as much as possible to ensure maximum satisfaction (Uppal,
2010).
Evaluation of bank’s performance from time to time helps them to know how well
they are actually satisfying their customers and becoming successful. The performance
evaluation of banks has thus taken high priority in the context of Bangladesh
(Siddique& Islam, 2001).
If efficiency is gained in the banking sector, it will make the country domestically and
internationally more competitive and capable of generating more income and
employment opportunities. An appropriate evaluation of performance of selected banks
requires a range of financial, operational and economic indicators to be applied
(Chowdhury, 2002).
Ratio analysis
Ratio analysis is a diagnostic tool that helps to identify problem areas and opportunities
within a company.Ratio analysis is very important for every business, because by calculating
ratio analysis we can understand the business position, business strength and weakness. By
knowing this information, management can takes its necessary steps to organize their goal.

Ratio analysis
of
Jamuna Bank Limited (jbl)
Year-(2010-2014)
Performance (Ratio) Analysis
In the report I analyzed the performance of EXIM Bank Ltd. in terms of –

Liquidity Ratio
Leverage Position
Profitability
Activity (Efficiency)
Adequacy Ratio
Liquidity Ratio
Current Ratio
Leverage Position:
Debt to Equity Capital Ratio
Debt to Total Assets Ratio
Profitability
Net Profit Margin
Net Operating Margin
Return on Equity (ROE)
Return on Asset (ROA)
Return on Deposit (ROD)
Efficiency
Tax management ratio
Expense Control Efficiency
Degree of Asset Utilization
Operating Efficiency Ratio
Adequacy Ratio
Capital Adequacy Ratio
Core Capital Ratio
Loan to Deposit
5.1 Liquidity Ratio
Current Ratio
Current Ratio=𝐜𝐮𝐫𝐫𝐞𝐧𝐭 𝐚𝐬𝐬𝐞𝐭𝐬
𝐜𝐮𝐫𝐫𝐞𝐧𝐭 𝐥𝐢𝐚𝐛𝐢𝐥𝐢𝐭𝐢𝐞𝐬
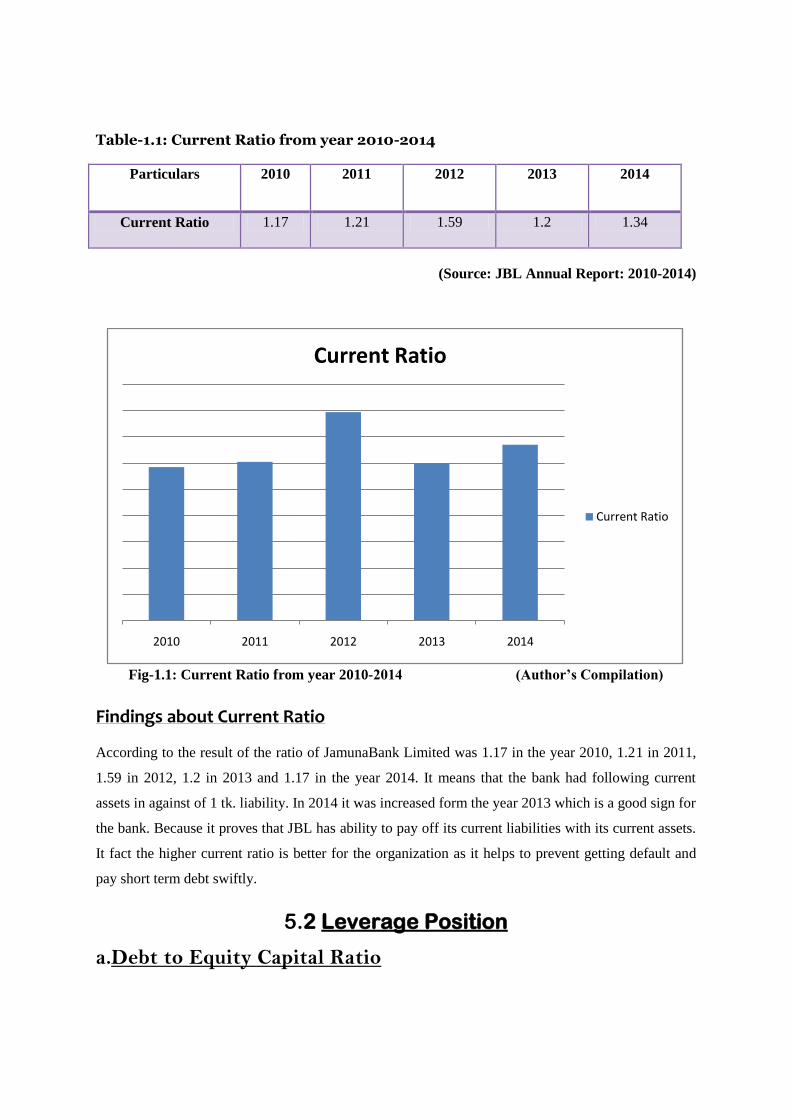
Table-1.1: Current Ratio from year 2010-2014
Particulars 2010 2011 2012 2013 2014
Current Ratio 1.17 1.21 1.59 1.2 1.34
(Source: JBL Annual Report: 2010-2014)
Fig-1.1: Current Ratio from year 2010-2014 (Author’s Compilation)
Findings about Current Ratio
According to the result of the ratio of JamunaBank Limited was 1.17 in the year 2010, 1.21 in 2011,
1.59 in 2012, 1.2 in 2013 and 1.17 in the year 2014. It means that the bank had following current
assets in against of 1 tk. liability. In 2014 it was increased form the year 2013 which is a good sign for
the bank. Because it proves that JBL has ability to pay off its current liabilities with its current assets.
It fact the higher current ratio is better for the organization as it helps to prevent getting default and
pay short term debt swiftly.
5.2 Leverage Position
a.Debt to Equity Capital Ratio
2010 2011 2012 2013 2014
Current Ratio
Current Ratio

Debt to Equity Capital Ratio = total debt
total equite
Table-2.1: Debt to Equity Capital Ratio
(Source: JBL Annual Report: 2010-2014)
Fig- 2.1: Debt to Equity Capital Ratio (Author’s Compilation)
Findings about Debt to Equity Capital Ratio
There is an unstable trend in the debt to equity capital ratio of Jamuna Bank Ltd. from 2010 to 2014.
The debt to equity capital ratio ofJamuna Bank has decreased from 10.56 in 2010 to 9.43 in 2014 over
5 years period of time. It means that their liability is increasing at a higher rate than their equity
capital from 2010 to 2014. But it increases form year 2013 to 2014. This higher outcome over years
not only increases the risk but also increases the profit.Overall this implies that their leverage and
overall risk is decreasing. Additionally, it also means that their expected earnings might increase due
to escalating leverage.
b.Total debt to Total Asset ratio
Total debt to Total Asset ratio=𝐭𝐨𝐭𝐚𝐥 𝐝𝐞𝐛𝐭
𝐭𝐨𝐭𝐚𝐥 𝐚𝐬𝐬𝐞𝐭𝐬
8
8.5
9
9.5
10
10.5
11
2010 2011 2012 2013 2014
Year 2010 2011 2012 2013 2014
Debt to Equity
Capital Ratio
10.56 10.33 10.46 9.11 9.43

Table-2.2:Total Debt toTotal Assets Ratio In million
Particulars 2010 2011 2012 2013 2014
Total Liabilities 63608.71 79783.82 101,353.68 106,800.71 128,683.91
Total Assets 70,013.90 87,065.13 109678.51 115,681.64 139,494.58
Total Debt toTotal
Assets Ratio 0.9085
0.9134
0.9241
0.9232
0.9225
(Source: JBL Annual Report: 2010-2014)
Fig- 2.2: Total Debt toTotal Assets Ratio (Author’s Compilation)
Findings about Total Debt to Total Assets Ratio
Though there are slight fluctuations, JamunaBank has been able to maintain an average debt ratio of
0.92 from 2010 to 2014. Their total asset and their liabilities are increasing mostly in same range. But
it has slightly decreased from 0.9232 to 0.9225 in 2014. This is good from a risk perspective, because
higher leverage means higher earnings. Higher leverage also implies that the bank is exposed to
higher risk. During good times when earnings are high, financial leverage is beneficial for a bank.
5.3Profitability Ratio
a.Net Profit Margin
Net Profit Margin =Net Income After Tax
Total Operating Revenue
Table-3.1:Net Profit Margin In million
0.9085
0.9134
0.92410.9232 0.9225
2010 2011 2012 2013 2014
Particulars 2010 2011 2012 2013 2014
Net Profit After Tax 1,066.01 1,330.19 1,017.66 1,135.19 1,347.11

(Source: JBL Annual Report: 2010-2014)
Fig- 3.1: Net Profit Margin (Author’s Compilation)
Findings about Net Profit Margin
The Net Profit Margin ratio ofJamuna Bank is showing adeclining trend. From 2010 to 2012 the Net
Profit Margin has decreased incredibly. But from 2013 it is increasing but not like the profit margin of
2010 or 2011.. It decreased because the increase in their total operating revenue is higher than the
increase in net income after tax. It indicates that bank performance outcome is not that much up to the
mark.
b. Net Operating Margin
Net Operating Margin=Operating revenue – Operating Expense
Total Asset
0.00%
5.00%
10.00%
15.00%
20.00%
25.00%
30.00%
2010 2011 2012 2013 2014
Net Profit Margin
Net Profit Margin
Total Operating Income 3,746.25 4,863.90 5,285.20 5,635.66 6,090.62
Net Profit Margin 28.46% 27.35% 19.25% 20.14% 22.12%
Particulars 2010 2011 2012 2013 2014
Total Operating Income 3746.25 4863.9 5285.2 5635.66 6090.62
Total Operating Expenses 1335.61 2046.89 2078.22 2666.75 3021.83
Operating Income- Operating
Expenses
2410.64 2817.01 3206.98 2968.91 3068.79
Total Assets 70013.9 87065.13 109678.5 115163 139494.6

Table-3.2:Net Operating Margin In million
(Source: JBL Annual Report: 2010-20
Fig- 3.2: Net Operating Margin(Author’s Compilation)
Findings about Net Operating Margin
From the year 2009 to 2014, the performance of Jamuna bank was decreasing in terms of net
operating margin. It has decreased significantly from 3.44% in 2010 to 2.20% in 2014.This occur as
their operating income was not increased less than their operating expenses. This is not a very good
sign for the bank.
c. Return on Equity (ROE)
Return on Equity= Net Income After Tax
Total Equity Capital
Table-3.3:Return on Equity In million
(Source: JBL Annual Report: 2010-2014)
0.00%
0.50%
1.00%
1.50%
2.00%
2.50%
3.00%
3.50%
4.00%
2010 2011 2012 2013 2014
Net Operating Margin
Net Operating Margin 3.44% 3.24% 2.92% 2.58% 2.20%
Particulars 2010 2011 2012 2013 2014
Net Profit After Tax 1066.01 1330.19 1017.66 1135.19 1347.11
Total Equity Capital 6408.19 7281.51 8324.83 8880.94 10810.67
Return on Equity 16.64% 18.27% 12.22% 12.78% 12.46%
Net Operating Margin
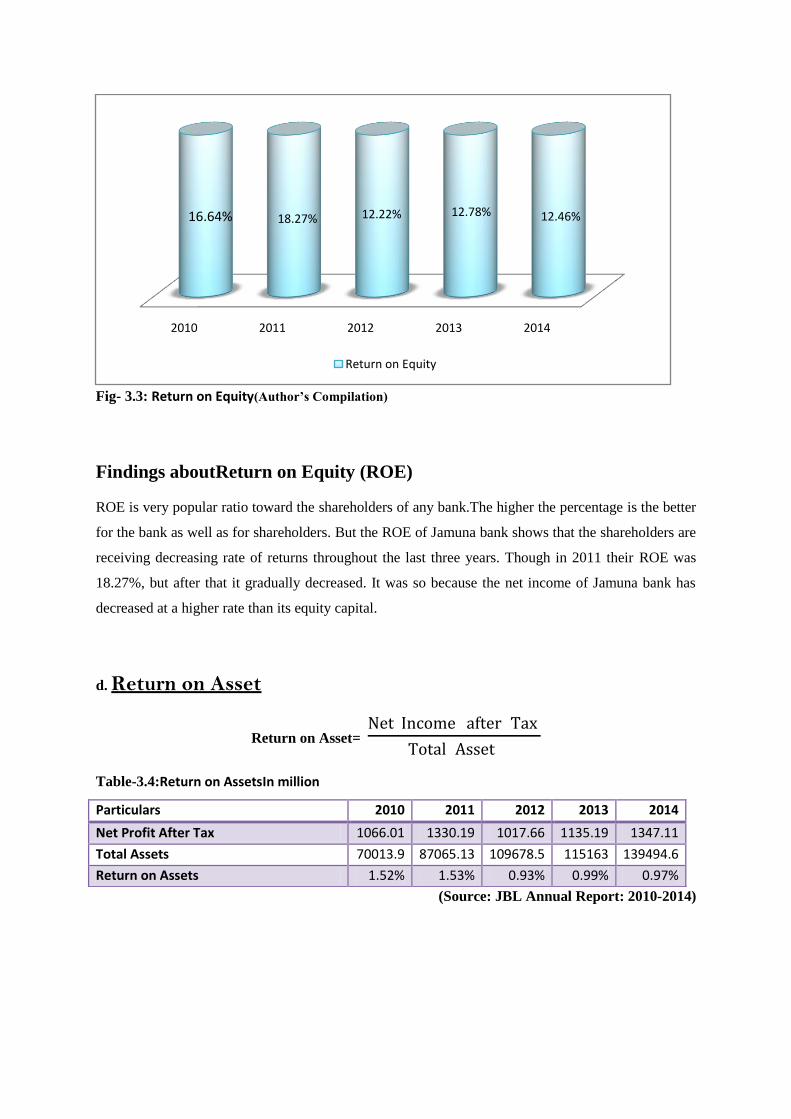
Fig- 3.3: Return on Equity(Author’s Compilation)
Findings aboutReturn on Equity (ROE)
ROE is very popular ratio toward the shareholders of any bank.The higher the percentage is the better
for the bank as well as for shareholders. But the ROE of Jamuna bank shows that the shareholders are
receiving decreasing rate of returns throughout the last three years. Though in 2011 their ROE was
18.27%, but after that it gradually decreased. It was so because the net income of Jamuna bank has
decreased at a higher rate than its equity capital.
d. Return on Asset
Return on Asset= Net Income after Tax
Total Asset
Table-3.4:Return on AssetsIn million
(Source: JBL Annual Report: 2010-2014)
2010 2011 2012 2013 2014
16.64% 18.27% 12.22% 12.78% 12.46%
Return on Equity
Particulars 2010 2011 2012 2013 2014
Net Profit After Tax 1066.01 1330.19 1017.66 1135.19 1347.11
Total Assets 70013.9 87065.13 109678.5 115163 139494.6
Return on Assets 1.52% 1.53% 0.93% 0.99% 0.97%

Fig- 3.4: Return on Assets(Author’s Compilation)
Findings aboutReturn on Assets
ROA is the most used profitability ratio. As JBL was a part of banking industry and its most of the
assets come from the debt which was the reasons for its low net profit as well as poor ROA. As a
result the JBL had low ROA in the year of 2014 which were .97%. In the year 2014 the net profit of
the bank had not increased that much.
e.Return on Deposits (ROD)
Return on Deposits (ROD)=𝐍𝐞𝐭 𝐈𝐧𝐜𝐨𝐦𝐞
𝐓𝐨𝐭𝐚𝐥 𝐃𝐞𝐩𝐨𝐬𝐢𝐭𝐞
Table-3.5: Return on Deposits In million
Particulars 2010 2011 2012 2013 2014
Net Income 1066.01 1330.19 1017.66 1135.19 1347.11
Total Deposit 60673.56 70508.05 79623.13 97485.61 114653.1
Return on Deposits 1.76% 1.89% 1.28% 1.16% 1.17%
(Source: JBL Annual Report: 2010-2014)
2010 2011 2012 2013 2014
1.52% 1.53%
0.93% 0.99% 0.97%
Return on Assets
Return on Assets
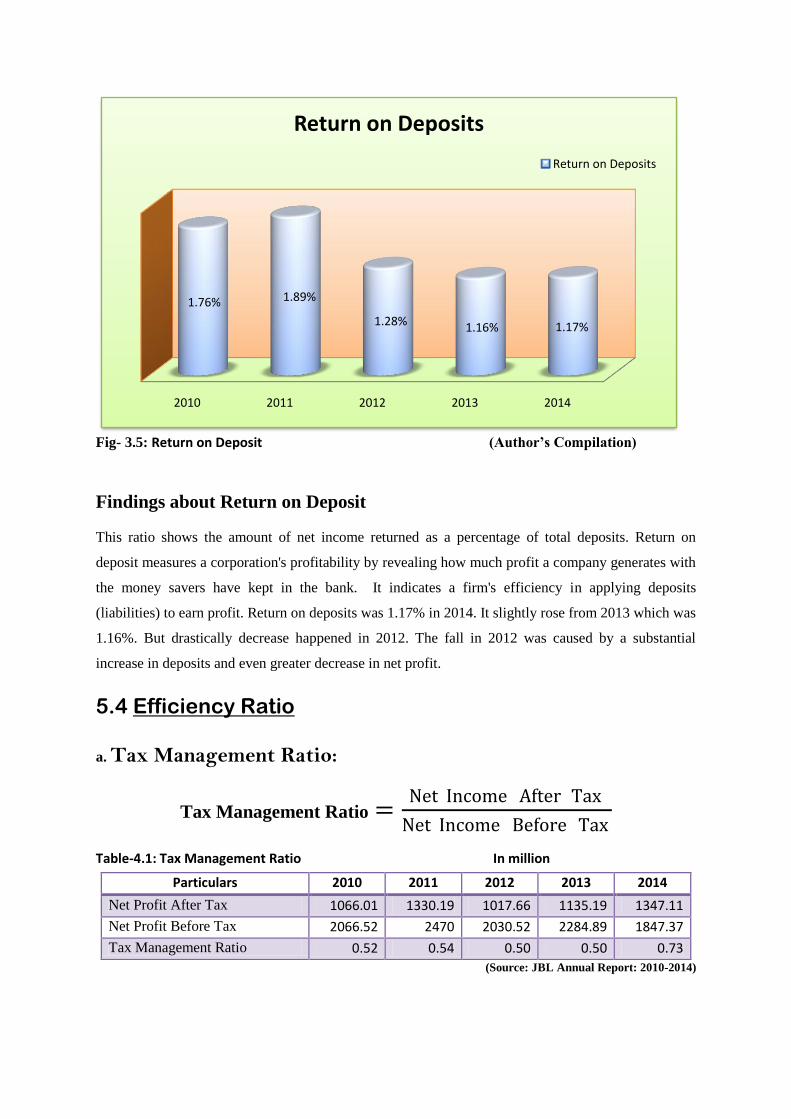
Fig- 3.5: Return on Deposit (Author’s Compilation)
Findings about Return on Deposit
This ratio shows the amount of net income returned as a percentage of total deposits. Return on
deposit measures a corporation's profitability by revealing how much profit a company generates with
the money savers have kept in the bank. It indicates a firm's efficiency in applying deposits
(liabilities) to earn profit. Return on deposits was 1.17% in 2014. It slightly rose from 2013 which was
1.16%. But drastically decrease happened in 2012. The fall in 2012 was caused by a substantial
increase in deposits and even greater decrease in net profit.
5.4 Efficiency Ratio
a. Tax Management Ratio:
Tax Management Ratio =Net Income After Tax
Net Income Before Tax
Table-4.1: Tax Management Ratio In million
(Source: JBL Annual Report: 2010-2014)
2010 2011 2012 2013 2014
1.76% 1.89%
1.28% 1.16% 1.17%
Return on Deposits
Return on Deposits
Particulars 2010 2011 2012 2013 2014
Net Profit After Tax 1066.01 1330.19 1017.66 1135.19 1347.11
Net Profit Before Tax 2066.52 2470 2030.52 2284.89 1847.37
Tax Management Ratio 0.52 0.54 0.50 0.50 0.73
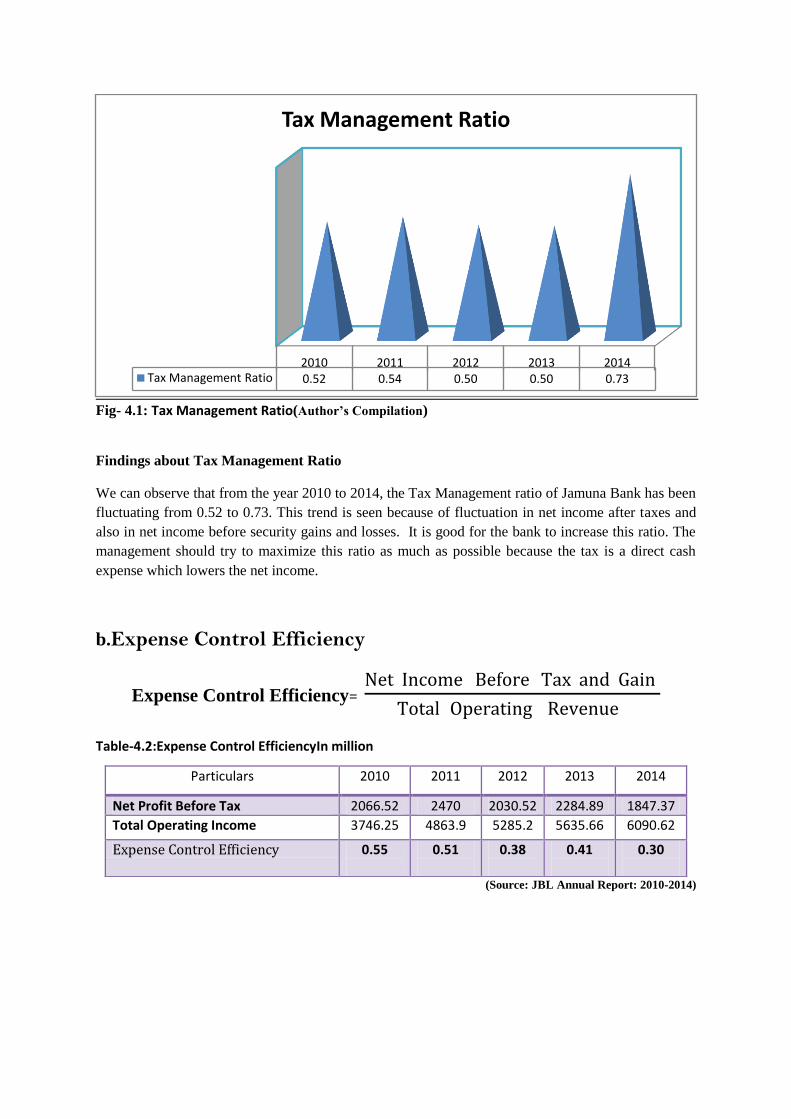
Fig- 4.1: Tax Management Ratio(Author’s Compilation)
Findings about Tax Management Ratio
We can observe that from the year 2010 to 2014, the Tax Management ratio of Jamuna Bank has been
fluctuating from 0.52 to 0.73. This trend is seen because of fluctuation in net income after taxes and
also in net income before security gains and losses. It is good for the bank to increase this ratio. The
management should try to maximize this ratio as much as possible because the tax is a direct cash
expense which lowers the net income.
b.Expense Control Efficiency
Expense Control Efficiency= Net Income Before Tax and Gain
Total Operating Revenue
Table-4.2:Expense Control EfficiencyIn million
(Source: JBL Annual Report: 2010-2014)
2010 2011 2012 2013 2014Tax Management Ratio 0.52 0.54 0.50 0.50 0.73
Tax Management Ratio
Particulars 2010 2011 2012 2013 2014
Net Profit Before Tax 2066.52 2470 2030.52 2284.89 1847.37
Total Operating Income 3746.25 4863.9 5285.2 5635.66 6090.62
Expense Control Efficiency 0.55
0.51
0.38
0.41
0.30

Fig- 4.2: Expense Control Efficiency(Author’s Compilation)
Findings about Expense Control Efficiency
For Jamuna Bank, we are observing very inconsistent trend in their Expense Control Efficiency ratio
from 2010 to 2014. There is less improvement in their expense control efficiency ratio. It has
decreased from 2013 to 2014. But in 2012, it has fallen down to 0.38. The reason behind this
inconsistency is the proportionate change in the net income before tax & gains (Losses) and total
operating revenue. This implies that Jamuna bank is efficiently controlling its expenses.
c. Degree of Asset Utilization
Degree of Asset Utilization = Total Operating Revenue
Total Asset
Table-4.3:Degree of Asset Utilization In million
(Source: JBL Annual Report: 2010-2014)
0.00
0.10
0.20
0.30
0.40
0.50
0.60
2010 2011 2012 2013 2014
Expense Control Efficiency
Expense Control Efficiency
Particulars 2010 2011 2012 2013 2014
Total Operating Income 3746.25 4863.9 5285.2 5635.66 6090.62
Total Assets 70013.9 87065.13 109678.5 115163 139494.6
Degree of Asset Utilization 0.054 0.056 0.048 0.049 0.044

Fig- 4.3: Degree of Asset Utilization (Author’s Compilation)
Findings about Degree of Asset Utilization
There is a slight increase in the asset utilization ratio of Jamuna bank from 2012 to 2013. The ratio
was decreasing from 2013 to 2014. It increases considerably because their total asset increased at a
higher rate compared to their operating income. This rise in Asset Utilization indicates that more and
more assets are becoming exploited which is a good sign for the bank.
d. Operating Efficiency Ratio
Operating Efficiency Ratio =Total Operating Expense
Total Operating Revenue
Table-4.4: Operating Efficiency Ratio In million Particulars 2010 2011 2012 2013 2014
Total Operating Income 3746.25 4863.9 5285.2 5635.66 6090.62
Total Operating Expenses 1335.61 2046.89 2078.22 2666.75 3021.83
Operating Efficiency Ratio 2.80 times 2.38 times 2.54 times 2.11 times 2.02 times
(Source: JBL Annual Report: 2010-2014)

Fig- 4.4: Operating Efficiency Ratio (Author’s Compilation)
Findings about Operating Efficiency Ratio
There is a decline in the operating efficiency ratio of Jamuna bank from 2013 to 2014. It has
decreased from 2.11 times to 2.02 times in 2014. On the other hand, it increased to 2.54 in 2013. It
implies that the bank has not been able to efficiently utilize its revenues to cover the operating
expense for the last two years. This decreasing trend reflects that the operating revenue is increasing
at a lower rate than the operating expense. The declining of this ratio was because of a significant
increase in their total operating expense.
5.5 Adequacy Ratio
a. Capital Adequacy Ratio
Capital Adequacy Ratio = 𝑪𝒂𝒑𝒊𝒕𝒂𝒍 𝑩𝒂𝒔𝒆 𝑻𝒊𝒆𝒓 𝑰+ 𝑻𝒊𝒆𝒓 𝑰𝑰
𝑹𝒊𝒔𝒌−𝑾𝒆𝒊𝒈𝒉𝒕𝒆𝒅 𝑨𝒔𝒔𝒆𝒕𝒔
Table-5.1 Capital Adequacy RatioIn million
Particulars 2010 2011 2012 2013 2014
Tier I 4855.51 6214.34 7256.39 7763.33 9110.44
Tier II 1494.51 1338.45 1348.89 1496.47 1947.8
Capital Base (Tier I +Tier II) 6350.02 7552.79 8605.28 9259.8 11058.24
Risk-Weighted Assets 66839 67041.4 70448.6 83421.38 98298.68
Capital Adequacy Ratio 9.50% 11.27% 12.21% 11.10% 11.25%
(Source: JBL Annual Report: 2010-2014)
0
0.5
1
1.5
2
2.5
3
2010 2011 2012 2013 2014
Operating Efficiency Ratio
Operating Efficiency Ratio
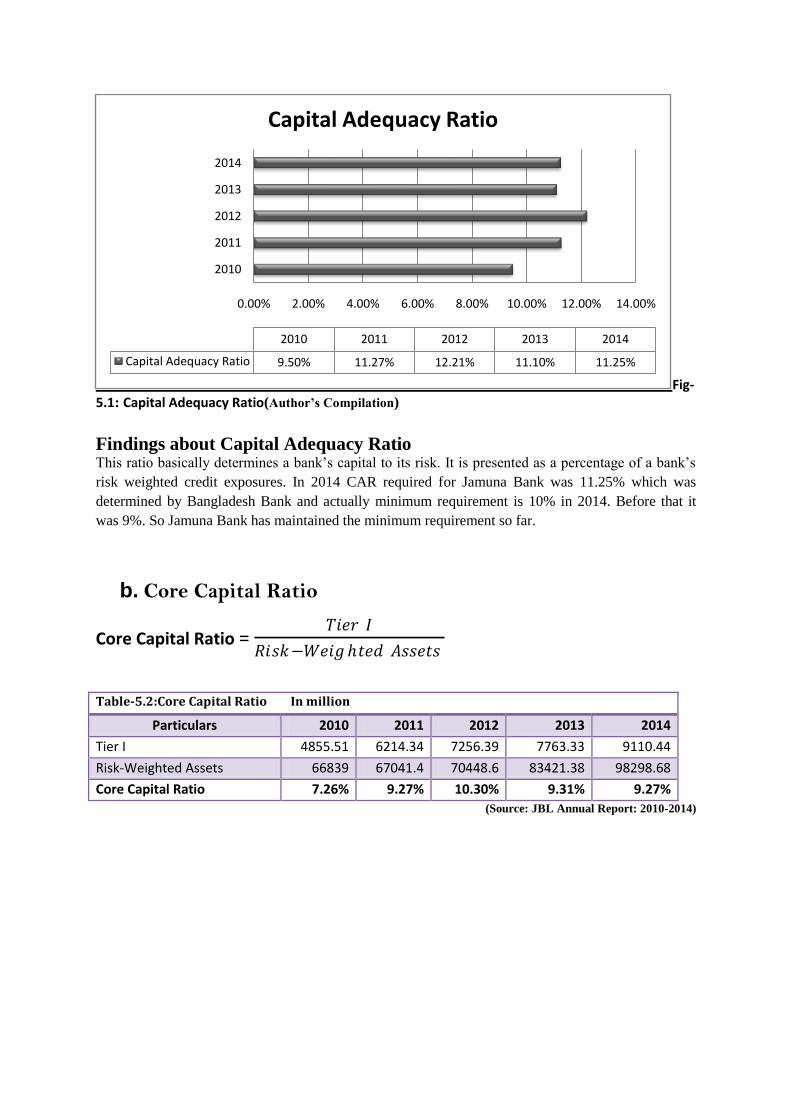
Fig- 5.1: Capital Adequacy Ratio(Author’s Compilation)
Findings about Capital Adequacy Ratio This ratio basically determines a bank’s capital to its risk. It is presented as a percentage of a bank’s
risk weighted credit exposures. In 2014 CAR required for Jamuna Bank was 11.25% which was
determined by Bangladesh Bank and actually minimum requirement is 10% in 2014. Before that it
was 9%. So Jamuna Bank has maintained the minimum requirement so far.
b. Core Capital Ratio
Core Capital Ratio = 𝑇𝑖𝑒𝑟 𝐼
𝑅𝑖𝑠𝑘−𝑊𝑒𝑖𝑔ℎ𝑡𝑒𝑑 𝐴𝑠𝑠𝑒𝑡𝑠
Table-5.2:Core Capital Ratio In million
Particulars 2010 2011 2012 2013 2014
Tier I 4855.51 6214.34 7256.39 7763.33 9110.44
Risk-Weighted Assets 66839 67041.4 70448.6 83421.38 98298.68
Core Capital Ratio 7.26% 9.27% 10.30% 9.31% 9.27%
(Source: JBL Annual Report: 2010-2014)
0.00% 2.00% 4.00% 6.00% 8.00% 10.00% 12.00% 14.00%
2010
2011
2012
2013
2014
2010 2011 2012 2013 2014
Capital Adequacy Ratio 9.50% 11.27% 12.21% 11.10% 11.25%
Capital Adequacy Ratio

Fig-
5.2: Core Capital Ratio (Author’s Compilation)
Findings about Core Capital Ratio
Core capital is the minimum amount of capital that a bank has to ensure to protect consumers. It is
also expressed as a percentage of a bank’s risk weighted credit exposures. It was slightly decreased
from 2013 to 2013 around 9.31% to 9.27%. The highest was in 2012.
ASSETS-QUALITY INDECATOR
5.6Loan to Deposit
Loan to Deposit = 𝑻𝒐𝒕𝒂𝒍 𝒍𝒐𝒂𝒏𝒔
𝑻𝒐𝒕𝒂𝒍 𝑫𝒆𝒑𝒐𝒔𝒊𝒕𝒆
Table-6.1: Loan to Deposit In million
Particulars 2010 2011 2012 2013 2014
Total Loans 49734.8 56611.79 54887.03 67669.38 77899.79
Total Deposit 60673.56 70508.05 79623.13 97485.61 114635.1
Loan to Deposit 81.97% 80.29% 68.93% 69.41% 67.95%
(Source: JBL Annual Report: 2010-2014)
0.00%
2.00%
4.00%
6.00%
8.00%
10.00%
12.00%
20102011
20122013
2014
Rat
io
Year
Core Capital Ratio
Core Capital Ratio
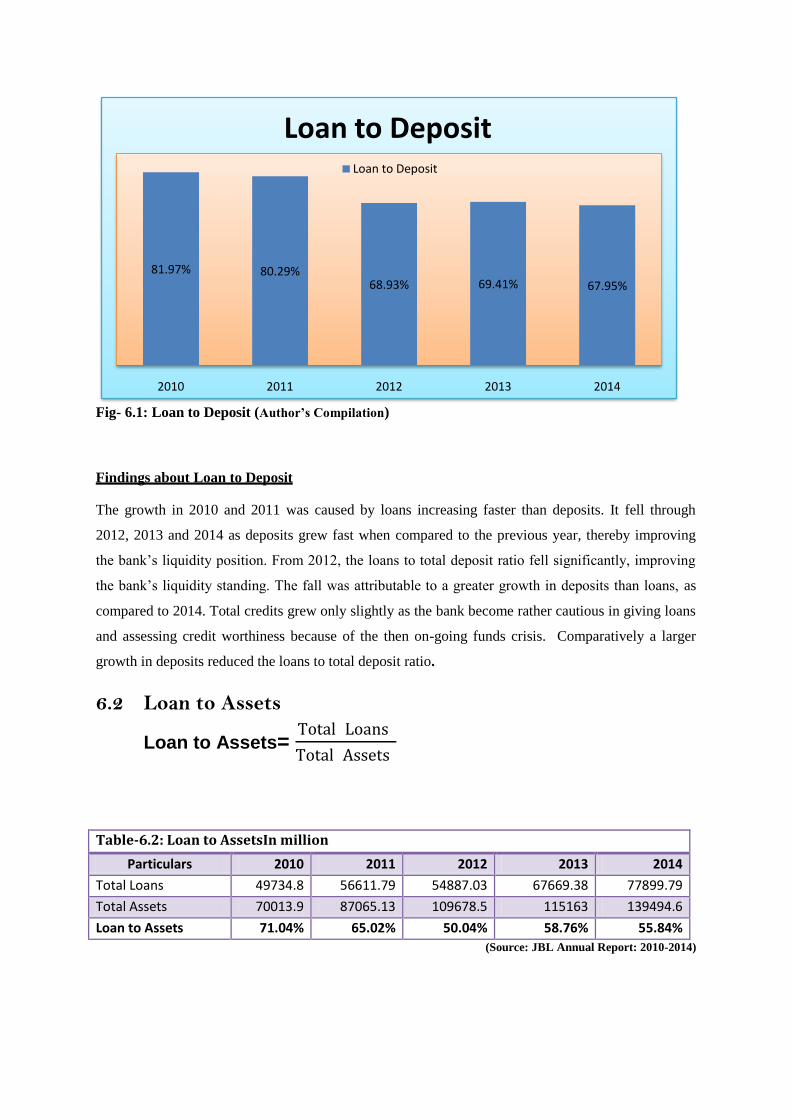
Fig- 6.1: Loan to Deposit (Author’s Compilation)
Findings about Loan to Deposit
The growth in 2010 and 2011 was caused by loans increasing faster than deposits. It fell through
2012, 2013 and 2014 as deposits grew fast when compared to the previous year, thereby improving
the bank’s liquidity position. From 2012, the loans to total deposit ratio fell significantly, improving
the bank’s liquidity standing. The fall was attributable to a greater growth in deposits than loans, as
compared to 2014. Total credits grew only slightly as the bank become rather cautious in giving loans
and assessing credit worthiness because of the then on-going funds crisis. Comparatively a larger
growth in deposits reduced the loans to total deposit ratio.
6.2 Loan to Assets
Loan to Assets= Total Loans
Total Assets
Table-6.2: Loan to AssetsIn million
Particulars 2010 2011 2012 2013 2014
Total Loans 49734.8 56611.79 54887.03 67669.38 77899.79
Total Assets 70013.9 87065.13 109678.5 115163 139494.6
Loan to Assets 71.04% 65.02% 50.04% 58.76% 55.84%
(Source: JBL Annual Report: 2010-2014)
81.97% 80.29%68.93% 69.41% 67.95%
2010 2011 2012 2013 2014
Loan to Deposit Loan to Deposit

Fig- 6.2: Loan to Assets(Author’s Compilation)
Findings about Loan to Assets
Assets as well as loans increased as percentage comparing to 2010. This gave an upward trend of the
loans to total asset ratio and therefore a downward trend for liquidity. The ratio fell in 2012. A big gap
was visible between asset and loan comparing to previous years. Despite a growth in total credits as
compared to 2013, loans as a percentage of total assets fell as a result. The percentage was decreased
about around 3% from 2013 to 2014.
6.3 Equity Multiplier
Equity Multiplier=Total Assets
Total Equity Capital
Table-6.3: Equity MultiplierIn million
Particulars 2010 2011 2012 2013 2014
Total Assets 70013.9 87065.13 109678.5 115163 139494.6
Total Equity Capital 6408.19 7281.51 8324.83 8880.94 10810.67
Equity Multiplier 10.92569 11.95702 13.17486 12.96743 12.90342
(Source: JBL Annual Report: 2010-2014)
71.04%65.02%
50.04%58.76% 55.84%
2010 2011 2012 2013 2014
Loan to AssetsLoan to Assets
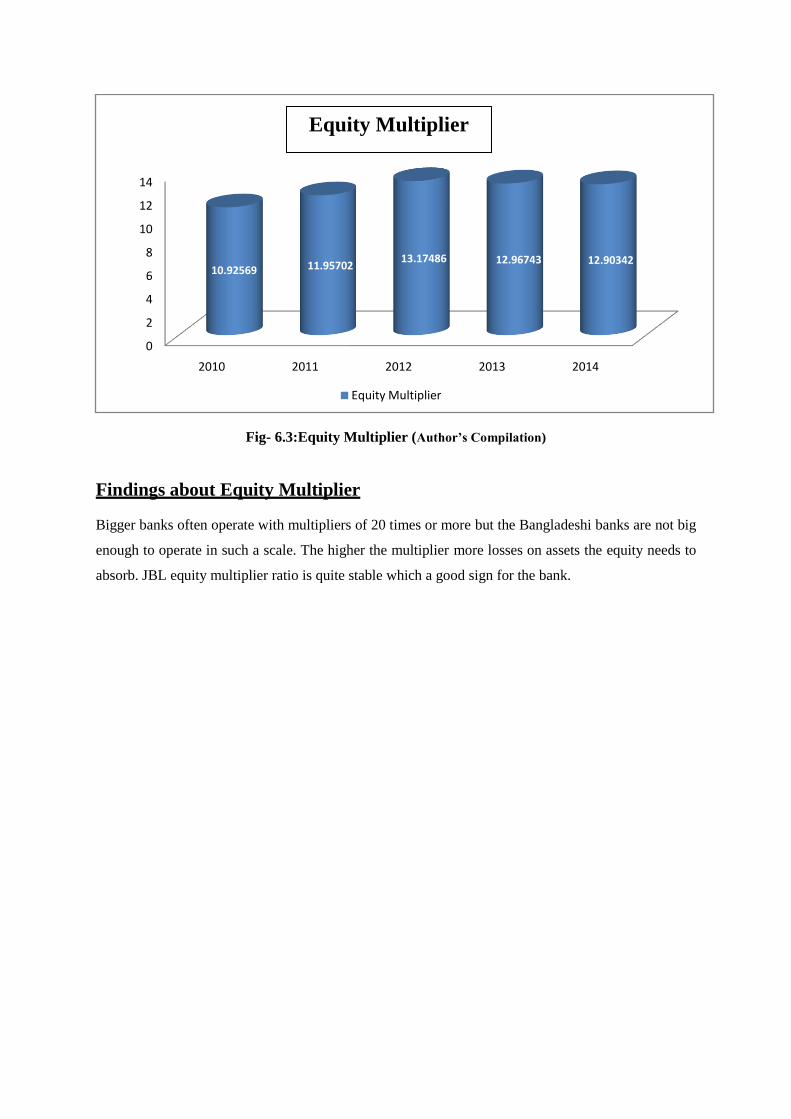
Fig- 6.3:Equity Multiplier (Author’s Compilation)
Findings about Equity Multiplier
Bigger banks often operate with multipliers of 20 times or more but the Bangladeshi banks are not big
enough to operate in such a scale. The higher the multiplier more losses on assets the equity needs to
absorb. JBL equity multiplier ratio is quite stable which a good sign for the bank.
0
2
4
6
8
10
12
14
2010 2011 2012 2013 2014
10.92569 11.9570213.17486 12.96743 12.90342
Equity Multiplier
Equity Multiplier

Chapter-06
Comparison of Two Branches
Financial Performance
Chapter-06
JAMUNA BANK LIMITED: SONARGAON ROAD BRANCH
Overview of JAMUNA BANK LIMITED, SONARGAON ROAD BRANCH
Sonargaon Road Branch is the 2nd
branch of Jamuna Bank Limited. It started its journey from
6th
June, 2001. At present the branch has 28 employees and A senior Vice Presedient is in
charge of the branch.
Sonargaon Road Branch has 3 different divisions. They are:
1. Genera Banking Division

Cash
Clearing
Accounts
Accounting
2. Foreign Exchange Division(Export and Import)
3. Credit Division
Achievement of the Branch deposit, advance & profit target (2014)
Figure in lac
Sl No.
Description Target as on
31.12.2014
Target as on
30.09.2014
Achievement as on
30.09.2014
1 Deposit 47,500.00 45,383.26 45,266.20
2 Advance 50,000.00 42,862.84 41,302.00
3 Profit 3,200.00 2,160.00 1,744.92
4 Import 27,500.00 18,975.00 15,364.03
5 Export 25,000.00 17,250.00 2,212.91
6 Bank Guarantee 20,000.00 13,800.00 3,220.30
Comparison Of Two Branches Financial Performance
For doing comparison of branch I took most important branches of Jamuna Bank Limited.
The branches are Sonargaon Road Branch and Mohakhali Branch. For doing this analysis I
use around 20 ratios. At the time of my internship audit came to Sonargaon Road Branch and
they assign all these rations to branch Accounts Department. As I work in that department I
am also take part doing this. According to the audit team all these ratios are quite important
for evaluating a branch financial performance and I include this in my report to find out
financial prospect of these two important branches
Yield on Advance
Table-1: Yield on Advance
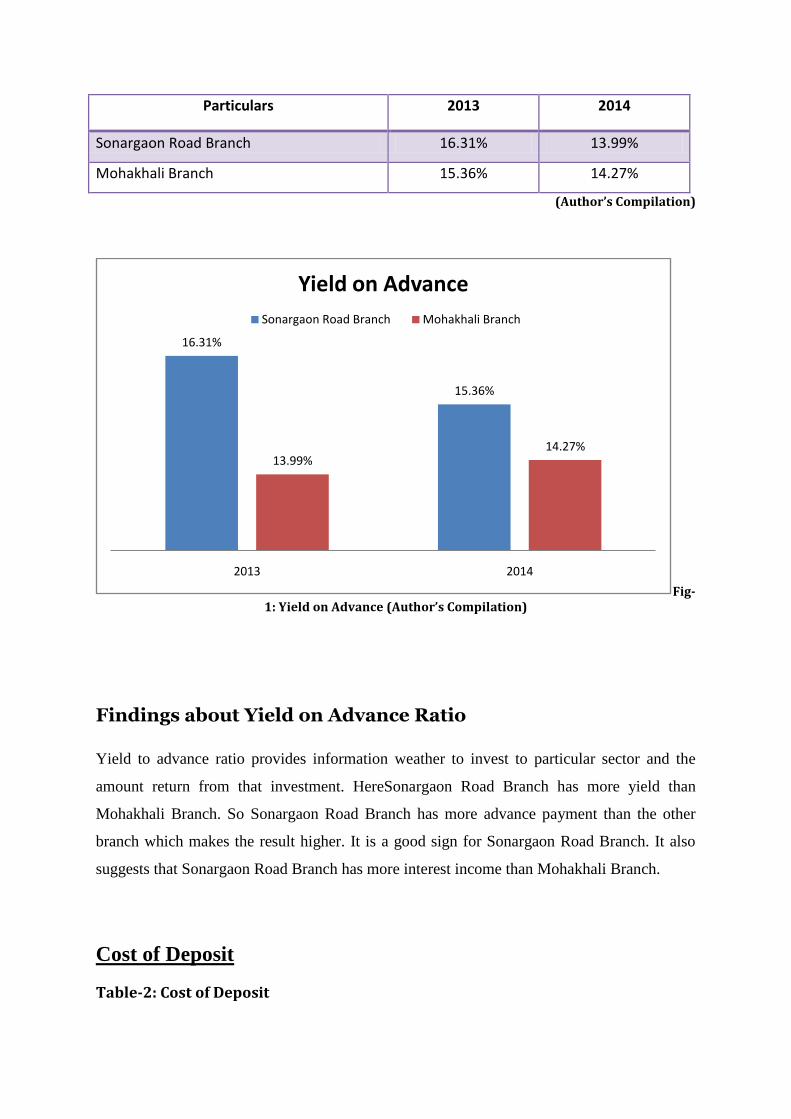
Particulars 2013 2014
Sonargaon Road Branch 16.31% 13.99%
Mohakhali Branch 15.36% 14.27%
(Author’s Compilation)
Fig-1: Yield on Advance (Author’s Compilation)
Findings about Yield on Advance Ratio
Yield to advance ratio provides information weather to invest to particular sector and the
amount return from that investment. HereSonargaon Road Branch has more yield than
Mohakhali Branch. So Sonargaon Road Branch has more advance payment than the other
branch which makes the result higher. It is a good sign for Sonargaon Road Branch. It also
suggests that Sonargaon Road Branch has more interest income than Mohakhali Branch.
Cost of Deposit
Table-2: Cost of Deposit
16.31%
15.36%
13.99%14.27%
2013 2014
Yield on Advance
Sonargaon Road Branch Mohakhali Branch

Particulars 2013 2014
Sonargaon Road Branch 8.76% 7.50%
Mohakhali Branch 8.23% 7.66%
(Author’s Compilation)
Fig-2: Cost of Deposit (Author’s Compilation)
Findings about Cost of Deposit Ratio
In 2013 Sonargaon Road Branch has around 8.76 tk. cost of their 100 tk. deposit in contrast
in 2014 it had been decreased at 7.5 tk. At the same year of 2013 Mohakhali Branch has
about 8.23 tk. costs on their 100 tk. deposit and their cost was also declined in 2014. So both
branches have a satisfactory position as their cost is declined in 2014. But if we compare two
branches Sonargaon Road Branch has slightly ahead in this measurement.
Interest Spread
Table-3: Interest Spread
Particulars 2013 2014
2013 2014
8.76%
7.50%
8.23%
7.66%
Cost of deposit
Sonargaon Road Branch Mohakhali Branch
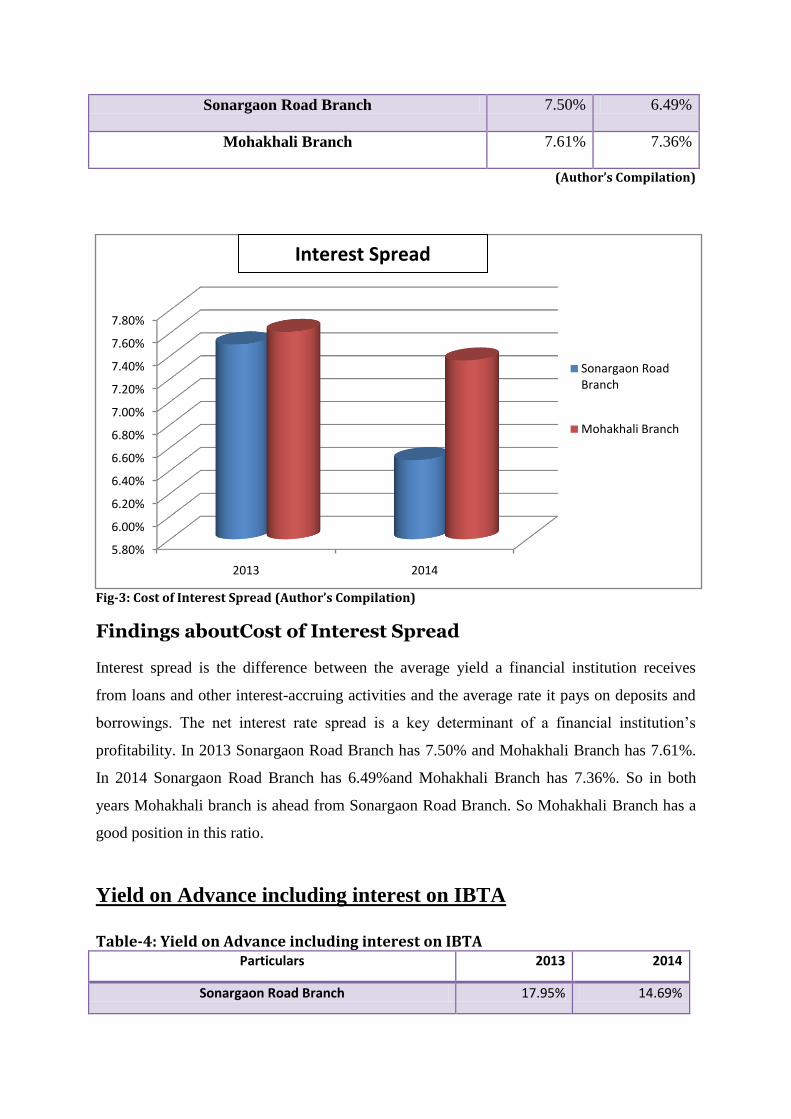
Sonargaon Road Branch 7.50% 6.49%
Mohakhali Branch 7.61% 7.36%
(Author’s Compilation)
Fig-3: Cost of Interest Spread (Author’s Compilation)
Findings aboutCost of Interest Spread
Interest spread is the difference between the average yield a financial institution receives
from loans and other interest-accruing activities and the average rate it pays on deposits and
borrowings. The net interest rate spread is a key determinant of a financial institution’s
profitability. In 2013 Sonargaon Road Branch has 7.50% and Mohakhali Branch has 7.61%.
In 2014 Sonargaon Road Branch has 6.49%and Mohakhali Branch has 7.36%. So in both
years Mohakhali branch is ahead from Sonargaon Road Branch. So Mohakhali Branch has a
good position in this ratio.
Yield on Advance including interest on IBTA
Table-4: Yield on Advance including interest on IBTA
Particulars 2013 2014
Sonargaon Road Branch 17.95% 14.69%
5.80%
6.00%
6.20%
6.40%
6.60%
6.80%
7.00%
7.20%
7.40%
7.60%
7.80%
2013 2014
Sonargaon Road Branch
Mohakhali Branch
Interest Spread

Mohakhali Branch 19.48% 20.01%
(Author’s Compilation)
Fig-4: Yield on Advance including interest on IBTA (Author’s Compilation)
Findings aboutYield on Advance including interest on IBTA
Yield to advance ratioAdvance including interest on IBTA provides information weather to
invest to particular sector and the amount return from that investment along with IBTA
interest. HereSonargaon Road Branch has fewer yields than Mohakhali Branch. So
Sonargaon Road Branch has less interest coming on IBTA than the other branch which makes
the result higher for Mohakhali Branch. It is not good sign for Sonargaon Road Branch.
Cost of deposit including interest on IBTA
Table-5: Cost of deposit including interest on IBTA Particulars 2013 2014
Sonargaon Road Branch 10.60% 7.50%
Mohakhali Branch 9.14% 8.18%
(Author’s Compilation)
2013 2014
17.95%
19.48%19.48%
20.01%
Yield on Advance including interest on IBTA
Sonargaon Road Branch Mohakhali Branch

Fig-2.5: Cost of deposit including interest on IBTA (Author’s Compilation)
Findings aboutCost of deposit including interest on IBTA
Interest spread is the difference between the average yield a financial institution receives
from loans and other interest-accruing activities and the average rate it pays on deposits and
borrowings including interest on IBTA. It is another key determinant of a financial
institution’s profitability. In 2013 Sonargaon Road Branch has 10.60% and Mohakhali
Branch has 9.14%. In 2014 Sonargaon Road Branch has 7.50%and Mohakhali Branch has
8.18%. So the cost is decreasing as IBTA interest cost is reduce for both branches.
Net interest income including interest on IBTA
Table-6: Net interest income including interest on IBTA Particulars 2013 2014
Sonargaon Road Branch 7.35% 7.19%
Mohakhali Branch 6.95% 6.55%
(Author’s Compilation)
2013 2014
10.60%
7.50%
9.14%8.18%
Cost of deposit including interest on IBTA
Sonargaon Road Branch Mohakhali Branch

Fig-6: Net interest income including interest on IBTA (Author’s Compilation)
Findings aboutNet interest income including interest on IBTA
Interest spreadincome including interest on IBTA is the difference between the average yield
a financial institution receives from loans and other interest-accruing activities and the
average rate it pays on deposits and borrowings including total interest received including
interest on IBTA and total interest paid including interest on IBTA. In In 2013 Sonargaon
Road Branch has 7.35% and Mohakhali Branch has 6.95%. In 2014 Sonargaon Road Branch
has 7.19%and Mohakhali Branch has 6.55%. So both braches ration was decreased from the
previous year. It occurs because of fallen of total interest received including interest on IBTA
and total interest paid including interest on IBTA.
Cost of Fund
Table-7Cost of Fund Particulars 2013 2014
Sonargaon Road Branch 9.54% 8.34%
Mohakhali Branch 9.05% 8.85%
(Author’s Compilation)
6.00% 6.20% 6.40% 6.60% 6.80% 7.00% 7.20% 7.40%
2013
2014
2013 2014
Net interest income including interest on IBTA

Fig-7: Cost of Fund (Author’s Compilation)
Findings aboutCost of Fund
Cost of funds is the interest rate paid by financial institutions for the funds that they deploy in
their business. The cost of funds is one of the most important input costs for a financial
institution, since a lower cost will generate better returns when the funds are deployed in the
form of short-term and long-term loans to borrowers. The spread between the cost of funds
and the interest rate charged to borrowers represents one of the main sources of profit for
most financial institutions.
According to the analysis it is found that the cost is decreased from 2013 to 2014. It is good
indicator for both branches as the cost reduce.
Return on Assets
Table-8Return on Assets
Particulars 2013 2014
Sonargaon Road Branch 0.35% 0.59%
Mohakhali Branch 0.19% 0.35%
(Author’s Compilation)
2013 2014
9.54%
8.34%
9.05% 8.85%
Sonargaon Road Branch Mohakhali Branch
Cost of Fund

Fig-8: Return on Assets (Author’s Compilation)
Findings aboutReturn on Assets
It is known as a profitability or productivity ratio, because it provides information about the
management's performance in using the assets of the small business to generate income. ROA
can be used as a valuable tool to measure progress against predetermined internal goals, a
certain competitor, or the overall industry. ROA is also used by bankers, investors, and
business analysts to assess a company's use of resources and financial strength.
Asset turnover was 0.35% in 2013 for Sonargaon Road Branch. In 2014, it had increased to
0.59%. For Mohakhali Branch Asset turnover was 0.19% in 2013 and 0.35% in 2014. So
Sonargaon Road Branch has far ahead in this ratio. But important think is both branches
ration is increased form 2013.
Deposit Mix
3 types of deposit mix-
a) No Cost Deposit
Table: 9(a) No Cost Deposit
Particulars 2013 2014
Sonargaon Road Branch 20.05% 21.92%
2013
2014
0.35%
0.59%
0.19%
0.35%
Return on Assets
Sonargaon Road Branch Mohakhali Branch

Mohakhali Branch 23.30% 24.40%
(Author’s Compilation)
Fig-9(a): No Cost Deposit (Author’s Compilation)
Findings aboutNo Cost Deposit
No cost deposit basically means for any deposits bank do not have to incur any cost. Such as
Current Account or Saving Accounting. Here Sonargaon Road Branch has less no cost
deposit in both 2013 and 2014.But little amount increased in 2014. On the other hand
Mohakhali branch has a good amount of no cost deposit. So Sonargaon Road Branch needs to
put concern to bring more no cost deposit.
b. Low Cost Deposit
Table: 9(b) Low Cost Deposit
Particulars 2013 2014
Sonargaon Road Branch 18.90% 16.03%
Mohakhali Branch 17.14% 9.50%
(Author’s Compilation)
0.00%
5.00%
10.00%
15.00%
20.00%
25.00%
2013
2014
20.05%21.92%
23.30% 24.40%
Sonargaon Road Branch Mohakhali Branch
No Cost Deposit

Fig-9(b):Low Cost Deposit (Author’s Compilation)
Findings about Low Cost Deposit
The cost of deposit, which is calculated based on the interest rate paid by the banks divided
by the deposit amount, has a direct impact on banks’ profitability. With cheaper funds, banks
can lend at a profit. Sonargaon Road Branch has high cost than Mohakhali Branch. But in
year 2014 Mohakhali Branch cost was gone more higher but Sonargano Road Branch cost did
not get higher in that way.
c. High Cost Deposit
Table: 9(c)High Cost Deposit
Particulars 2013 2014
Sonargaon Road Branch 74.59% 76.05%
Mohakhali Branch 59.56% 66.10%
(Author’s Compilation)
2013
2014
18.90%
16.03%
17.14%
9.50%
Low Cost Deposit
Sonargaon Road Branch Mohakhali Branch
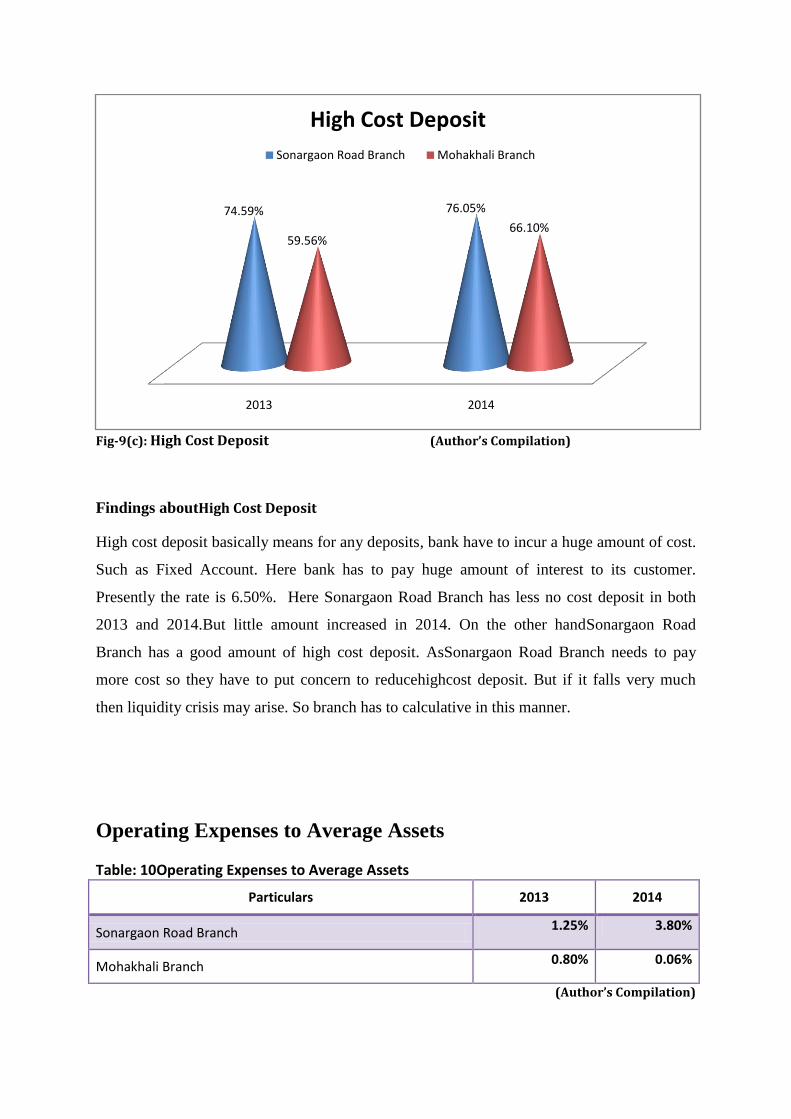
Fig-9(c): High Cost Deposit (Author’s Compilation)
Findings aboutHigh Cost Deposit
High cost deposit basically means for any deposits, bank have to incur a huge amount of cost.
Such as Fixed Account. Here bank has to pay huge amount of interest to its customer.
Presently the rate is 6.50%. Here Sonargaon Road Branch has less no cost deposit in both
2013 and 2014.But little amount increased in 2014. On the other handSonargaon Road
Branch has a good amount of high cost deposit. AsSonargaon Road Branch needs to pay
more cost so they have to put concern to reducehighcost deposit. But if it falls very much
then liquidity crisis may arise. So branch has to calculative in this manner.
Operating Expenses to Average Assets
Table: 10Operating Expenses to Average Assets
Particulars 2013 2014
Sonargaon Road Branch 1.25% 3.80%
Mohakhali Branch 0.80% 0.06%
(Author’s Compilation)
2013 2014
74.59% 76.05%
59.56%66.10%
High Cost Deposit
Sonargaon Road Branch Mohakhali Branch

Fig-10: Operating Expenses to Average Assets (Author’s Compilation)
Findings aboutOperating Expenses to Average Assets
The graph shows that Sonargaon Road Brach has high operating expense in terms of their
assets in both 2013 and 2014. But the main fact is its operating cost is getting higher in 2014.
So somehow they need to reduce their cost. Mohakhali Branch Ratio is quite satisfactory in
this indicator.
Non-Interest Income to Total Income
Table: 11Non-Interest Incomes to Total Income
Particulars 2013 2014
Sonargaon Road Branch 31.97% 43.00%
Mohakhali Branch 45.51% 50.52%
(Author’s Compilation)
2013 2014
1.25%
3.80%
0.80%
0.06%
Operating Expenses to Average Assets
Sonargaon Road Branch Mohakhali Branch

Fig-11: Non-Interest Incomes to Total Income (Author’s Compilation)
Findings aboutNon-Interest Incomes to Total Income
The graph shows that Sonargaon Road Branch has 31.97%non-interest income among total
income in 2013 and in 2014 it was increased to 43.00%.Mohakhali Branch has 45.51%non-
interest income among total income in 2013 and in 2014 it was increased to 50.52%. It
indicates that Mohakhali Branch has higher non-interest income than Sonargaon Road
Branch.
Deposit Advance Ratio
Table: 12-Deposit Advance Ratio
Particulars 2013 2014
Sonargaon Road Branch 80.08% 97.76%
Mohakhali Branch 82.48% 88.59%
0.00%
10.00%
20.00%
30.00%
40.00%
50.00%
60.00%
2013 2014
Non-Interest Incomes to Total Income
Sonargaon Road Branch Mohakhali Branch

Fig-12: Deposit Advance Ratio(Author’s Compilation)
Findings aboutDeposit Advance Ratio
The ratios of advances and investments to deposits showed over-all advances and investments
position. The standard of this ratio is 81%-85%. In 2013 both the branches are in standard
level. But both the branches ratio has been increase in 2014. So they need to focus on it and
try to come between the standard by reducing advance or increasing deposit.
Income Expenditure Ratio
Table: 13- Income Expenditure Ratio
Particulars 2013 2014
Sonargaon Road Branch 3.04:1 1.5:1
Mohakhali Branch 1.80:1 2.06:1
(Author’s Compilation)
81.08%
97.76%
82.48%88.59%
2013 2014
Deposit Advance RatioSonargaon Road Branch Mohakhali Branch

Fig-13: Income Expenditure Ratio(Author’s Compilation)
Findings aboutIncome Expenditure Ratio
From the graph the Income Expenditure Ratio of Sonargaon Road Branch is 3.04:1 in 2013
and 1.5:1 in 2014. It means it is reducing so it is a good sign as expenditure decreases. But on
the other hand Mohakhali Branch expense is increased according to the graph. So Mohakhali
Branch need to more concern on this issue.
Employees Expenses to Total Income Ratio
Table: 14- Employees Expenses to Total Income Ratio
Particulars 2013 2014
Sonargaon Road Branch 0.03:1 0.04:1
Mohakhali Branch 0.04:1 0.08:1
(Author’s Compilation)
0
0.5
1
1.5
2
2.5
3
3.5
2013 2014
Sonargaon Road Branch
Mohakhali Branch
Income Expenditure Ratio

Fig-14: Employees Expenses to Total Income Ratio (Author’s Compilation)
Findings aboutEmployees Expenses to Total Income Ratio
From the graph the Income Expenditure Ratio of Sonargaon Road Branch is 0.03:1 in 2013
and 0.04:1 in 2014. It means it is increasing but not that much so it is a satisfactory sign as
expenditure decreases. But on the other hand Mohakhali Branch expense in terms of
employee is increased according to the graph as they have more employees. So Mohakhali
Branch need to more concern on this issue.
Per Employee Deposit
Table: 15- Per Employee Deposit
Particulars 2013 2014
Sonargaon Road Branch Tk.1162.96 Tk.1450.74
Mohakhali Branch Tk.1020.43 Tk.988
(Author’s Compilation)
0 0.02 0.04 0.06 0.08
2013
2014
Mohakhali Branch
Sonargaon Road Branch

Fig-15: Per Employee Deposit (Author’s Compilation)
Findings aboutPer Employee Deposit
It clearly shows that Sonargaon Road Branch deposit is increased from the year 2013 to 2014.
But the deposit of MohakhaliBranch employee was not increased rather it decreased in 2014.
So Mohakhali Branch needs to be concerned on this issue.
Per Employee Advance
Table: 16-Per Employee Advance
Particulars 2013 2014
Sonargaon Road Branch Tk. 800.55 Tk. 1168.88
Mohakhali Branch Tk.607.33 Tk.675.00
(Author’s Compilation)
0
200
400
600
800
1000
1200
1400
1600
2013 2014
Per Employee Deposit
Sonargaon Road Branch Mohakhali Branch

Fig-16: Per Employee Advance(Author’s Compilation)
Findings aboutPer Employee Advance
It clearly shows that Sonargaon Road Branch advance is increased from the year 2013 to
2014. But the deposit of MohakhaliBranch employee was decreased in 2014. So Mohakhali
Branch needs to be concerned on this issue. As their employee increased but the advance did
not increased.
Per Employee Revenue
Table: 17-Per Employee Revenue
Particulars 2013 2014
Sonargaon Road Branch Tk. 84.07 Tk. 179.19
Mohakhali Branch Tk.165.38 Tk.182.25
(Author’s Compilation)
0
200
400
600
800
1000
1200
1400
2013 2014
Sonargaon Road Branch
Mohakhali Branch

Fig-17: Per Employee Revenue (Author’s Compilation)
Findings aboutPer Employee Revenue
The graph evidently shows that Sonargaon Road Branch and MohakhaliBranch both revenue
based on employee is increased from 2013 to 2014.
Per Employee Profit/Loss
Table: 18- Per Employee Profit/Loss
(Author’s Compilation)
2013
2014
85
179
166 182
Per Employee Revenue
Sonargaon Road Branch Mohakhali Branch
Particulars 2013 2014
Sonargaon Road Branch Tk.80.00 Tk. 64.48
Mohakhali Branch Tk.87.55 Tk.79.08

Fig-18: Per EmployeeProfit/Loss(Author’s Compilation)
It clearly shows that Sonargaon Road Branchper employee is increased from the year 2013 to
2014. But the deposit of MohakhaliBranch employee was decreased in 2014. So Mohakhali
Branch needs to be concerned on this issue. As their employee increased but profit did not
increased in this modus.
0 10 20 30 40 50 60 70 80 90
2013
2014
Per Employee Profit/Loss
Mohakhali Branch Sonargaon Road Branch

CHAPTER-08
FINDINGS, RECOMMANDATIONS
AND
CONCLUSION
Finding about the performance of Jamuna Bank Limited
After analysing the performance of Jamuna Bank Limited, I have found some important
things regarding the bank as well as Sonargaon Road Branch. These are given below:

In the year 2014 the bank attain around 22% growth of assets which is a good sign for
the bank.
In 2014 JBL’s liabilities is amplified from the previous year. It increased around
21%.
The bank keeps prevision against non-performing loans and advance.
Total deposit of JBL in the year 2013 was Tk. 97485.61 million but it has increased in
2014 and it was Tk. 114635.13 million. So the growth rate is around 18% in 2014.
Profit before tax was decreased of the bank. (Tk. 2284.89 million in 2013 but Tk.
1847.38 million in 2014).
Profit after tax was increased of the bank. (Tk. 1135.19 million in 2013 but Tk.
1347.12 million in 2014).
In the past JBL’s credit rating was A-1, now it is AA-3. So it indicates the bank is
performing well in terms of credit.
There are no significant deviations in 2012 operating result. The performance of that
year is mainly caused by political crisis and economical instability of the country.
The investment of the bank was increased in 2014. (Tk. 39963.50 million in 2014 but
Tk. 31392.20 million in 2014). So Jamuna Bank has maintained the minimum
requirement.
Sonargaon Road Branch is one of the major branches of JBL. The causes are:
The branch is located in one of the major business area of Dhaka City.
According to the branch employee, the branch has around 1000 Deposite account at
the same time around 350 Loan account as per Oct, 2015
The branch has always goes near to the target and every year they made profit on the
other hand some branches made loss almost every year. So this is important issue for
JBL.
The Branch deposit has increased from year 2013 to 2014. (Tk. 39943.61 lac in 2013
but Tk. 47936.92 lac in 2014).
The Branch Loans & Advance has increased from year 2013 to 2014. (Tk. 26599.47
lac in 2013 but Tk. 37603.44 lac in 2014).
Some big companies maintain account with this branch. So almost all their
transactions are done through his branch. The Companies are- Rangs Group,

IfadAutos, Bio-Trade, Abdul Monem Ltd and so on. Some partnership firms,
cooperative firms have also maintained account with the bank.
Recommendations
Through this study I myself gained some practical knowledge. I want to put some
suggestion here which I think if followed would definitely help Jamuna Bank Ltd. to
Imporove their performance and there-by its contribution in the whole economy.
Suggestions are-
To attract more clients Jamuna Bank Ltd. should sought new marketing strategy, which
will increase the bank performance.
Introduction of various incentives to increase remittance.
Effective and efficient initiative is necessary to recover the default loans.
They should invent other type of deposit to attract more customers which is
different from other banks.
JBL should maintain more cash and deposit balances with other banks. Because it
is desirable that banks keep their cash and balance with other bank to such extent so that
it can minimize the chance of liquidity crunch.
JBL need to put some special look on some ratios which fluctuates more.
JBL had fair leverage ratios in where it uses the debt most to increase revenue
rather than the equity. It may increase the risk of the bank. So, to minimize the risk I
think JBL should finance more equity.
Should increase the number of ATMs and ensure their smooth operations.
In Sonargaon Road Branch there is less accountability which may mislead the branch.
So good chain of command need to be maintained.
In Sonargaon Road Branch casual staffs are not that much proactive and they have less
co-ordination among them.
Another most interesting thing I found most of the employee of this branch is recruited
through lobbing. Some of them did not have much knowledge what to do. So JBL

should recruit more capable & experiences employees to spread the products all
over the country.
As per customer response, JBLSonargaon Road Branch is taking long time to process
any banking work. More easy way should find to minimize the duration of service.
JBL is needed to reach the brand value to the customers for building up ideal
relationship to create loyal customer
Conclusion
In this age of modern civilization bank is playing its splendid role to keep to the
economic development wheel moving. We can see lot of new commercial banks has been
established in last few years and these banks have made this banking sector very competitive.
The major task for banks, to survive in this competitive environment is by managing its assets
and liabilities in an efficient way. JBL has a strong financial base and huge assets to meet up
its liabilities which make this organization financially sound and solvent.Jamuna Bank Ltd.
started with a vision to be the most efficient financial intermediary in the country and it
believes that the day is not far off when it will reach its desired goal. JBL looks forward to a
new horizon with a distinctive mission to become a highly competitive modern and
transparent institution comparable to any of its kind at home and abroad.
Jamuna Bank Limited has been working with great confidence and competing tremendously
with Government oriented bank, local commercial banks along with the multinational banks
also. Jamuna Bank Limited always tried its level best to perform financially well. In spite of
trying to do well in some aspects Jamuna Bank Limited faced some financial problems from
time to time. Some of the problems were-excessive bad loans, shortage of loans and
advances, scarcity of cash in hands due to vault limit etc. These problems arouse time to time
due to economic slowdown, interest rate fluctuation, emerging capital market, inflation in the
money market and so on. Fighting with all these problems and competing with other banks
every moment the bank is trying to do better to best. If this thing continues we hope that
Jamuna Bank Limited will develop even more in the future.

It was an honour for me that I have worked as an intern in a reputed organization like Jamuna
Bank Limited. The JBL is a bank that confirms the best service to the customers Jamuna bank
Limited is the fastest growing Bank in Bangladesh. By working in several division of
Sonargaon Road Branch,Jamuna Bank Limited, the practical knowledge I got will be
helpful enough to sustain with the real organizational environment.
Bibliography
Chowdhury, T. A., & Ahmed, K. (2009). Performance Evaluation of
Selected Commercial Banks in Bangladesh. International Journal of
Business and Management, , 86-97.
James, K. (n.d.). types-financial-ratios-used-analyze-financial-
performance-3969. Retrieved November 20, 2015, from
http://smallbusiness.chron.com: http://smallbusiness.chron.com/types-
financial-ratios-used-analyze-financial-performance-3969.html
Pandey, I. M. (2004). “Financial statement analysis (9th edition ed.).
New Delhi, India: Vikas.
Qamruzzaman, M. (2014). Analysis of Performance and Financial
soundness of financial. Research Journal of Finance and Accounting ,
169-186.
Van Horne, J. C., & Wachowicz Jr., J. M. (2005). “Financial statement
analysis (11th edition ed.).
A, Chowdhury. “Politics, Society and Financial Sector Reform in
Bangladesh,” International Journal of Social Economies, vol. 4, pp. 963 –
988, 2002
S.H. Siddique and A.F.M.M. Islam. “Banking Sector in Bangladesh: Its
Contribution and Performance,” Journal of Business Research,
Jahangirnagar University, vol. 3, pp. 16-33, 2001
R.K. Uppal. “Stability in Bank Income through Free-Based Activities,”
Journal of Information Management and Business Review, vol. 1, pp. 1-
8, 2010.
JBL Annual Report 2010-2014

Financial Information on JBL Sonargaon Road Branch and Mohakhali
Branch


