27

Interpreting Human Biomonitoring Data in a Public
Health Risk Context Using Biomonitoring Equivalents
ICCA/EPA Symposium: Public Health Applications of Human Biomonitoring
24 September 2007 Durham, NC
Sean M. HaysLesa L. Aylward
Reasons for Conducting Large Scale Population Based (Environmental)
Biomonitoring Studies -- CDC
• Determine which chemicals get into members of the general population and at what concentrations
• Determine if exposure levels are higher in some groups than in others
• Track temporal trends in levels of exposure• Assess the effectiveness of public health efforts to
reduce exposure• Establish reference ranges• Determine the prevalence of people with levels above
known toxicity levels• Set priorities for research on human health effects Source: (CDC, 2005)
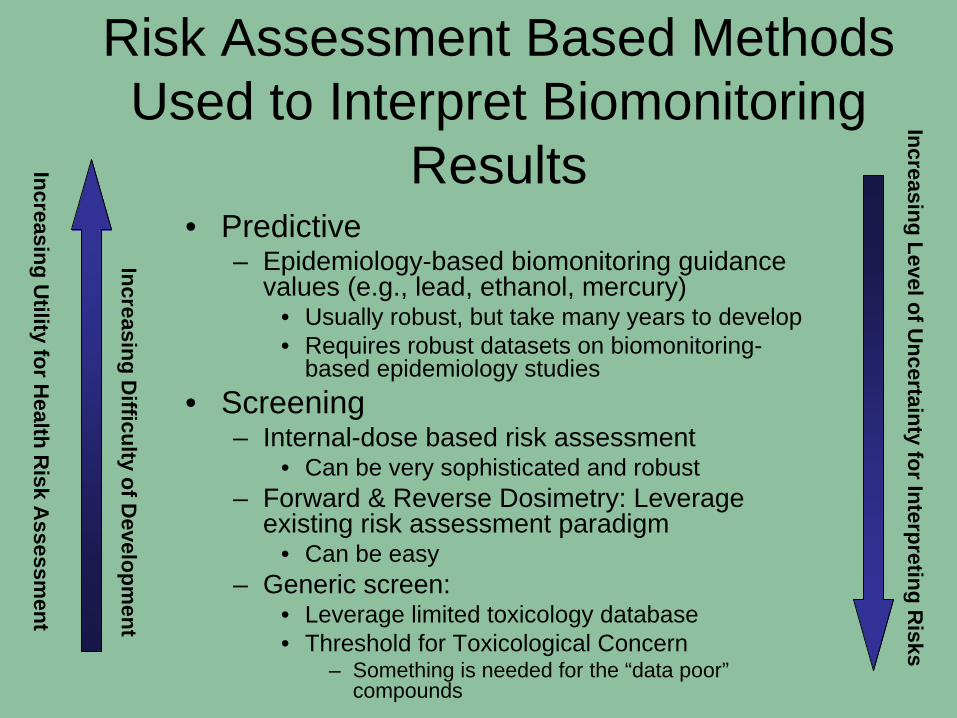
Risk Assessment Based Methods Used to Interpret Biomonitoring
Results• Predictive
– Epidemiology-based biomonitoring guidance values (e.g., lead, ethanol, mercury)
• Usually robust, but take many years to develop• Requires robust datasets on biomonitoring-
based epidemiology studies • Screening
– Internal-dose based risk assessment• Can be very sophisticated and robust
– Forward & Reverse Dosimetry: Leverage existing risk assessment paradigm
• Can be easy– Generic screen:
• Leverage limited toxicology database• Threshold for Toxicological Concern
– Something is needed for the “data poor” compounds
Increasing Utility for H
ealth Risk A
ssessment
Increasing Difficulty of D
evelopment
Increasing Level of Uncertainty for Interpreting R
isks
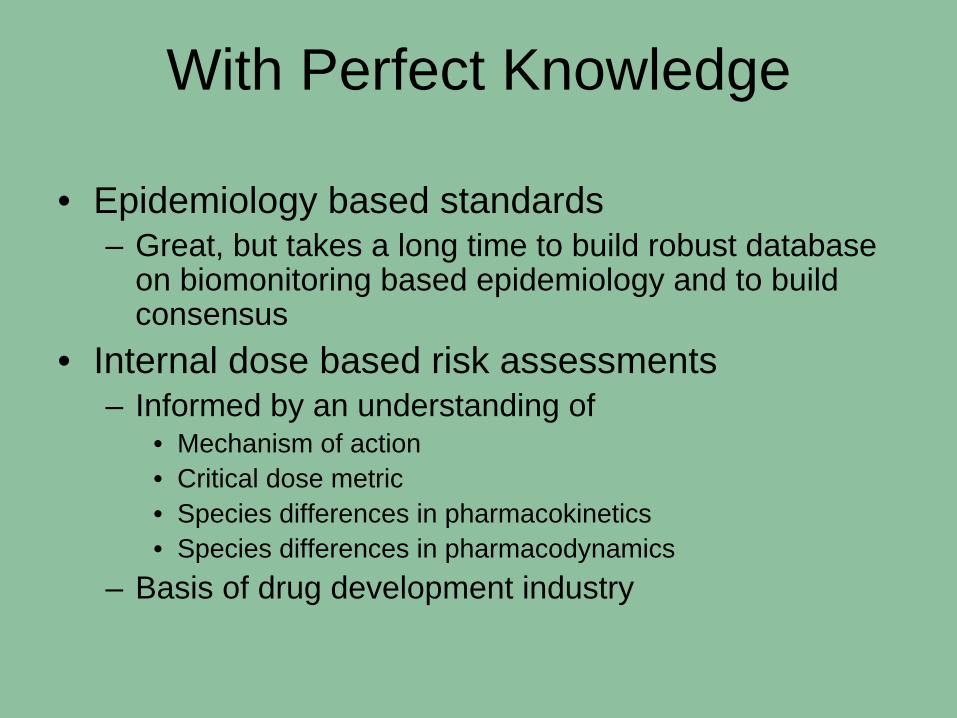
With Perfect Knowledge
• Epidemiology based standards– Great, but takes a long time to build robust database
on biomonitoring based epidemiology and to build consensus
• Internal dose based risk assessments– Informed by an understanding of
• Mechanism of action• Critical dose metric• Species differences in pharmacokinetics• Species differences in pharmacodynamics
– Basis of drug development industry
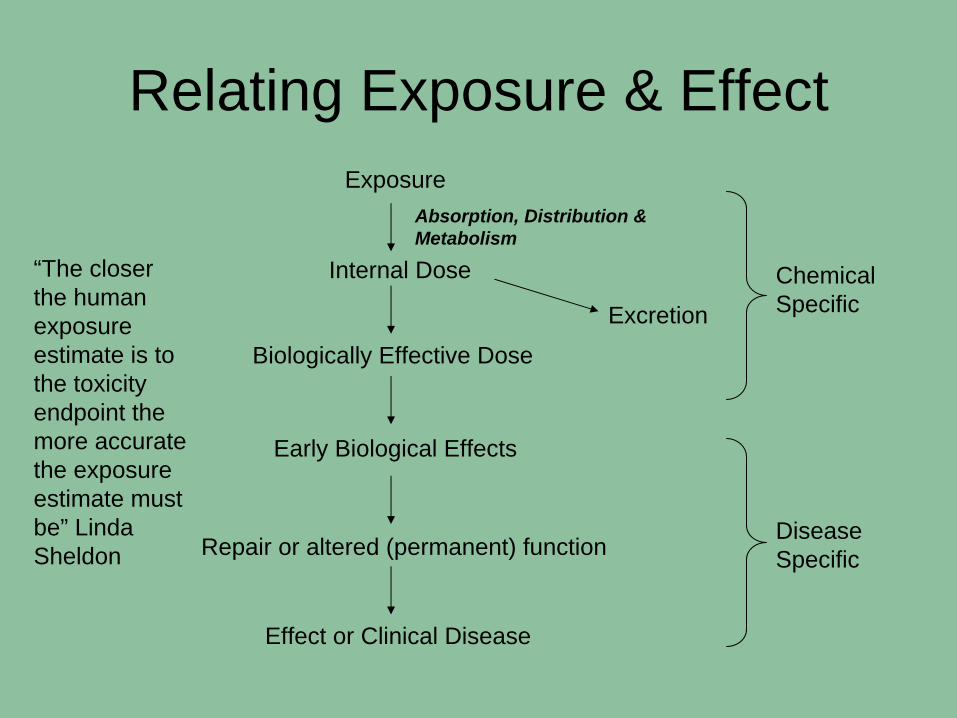
Relating Exposure & EffectExposure
Internal Dose
Biologically Effective Dose
Early Biological Effects
Repair or altered (permanent) function
Effect or Clinical Disease
Excretion
Chemical Specific
Disease Specific
Absorption, Distribution & Metabolism
“The closer the human exposure estimate is to the toxicity endpoint the more accurate the exposure estimate must be” Linda Sheldon
Recent Publication
“Biomonitoring Equivalents: A Screening Approach for Interpreting Biomonitoring Results from a Public Health Risk Perspective” - Hays et al., 2007, Reg. Tox. Pharm. Vol. 47, pp. 96-109.
• Presents rationale, background, and methods for development of biomonitoring equivalents (BEs):
• The concentration of a chemical in a (human) biological medium consistent with exposure at an exposure guidance value (e.g., RfC, RfD, UCR, MRL, TDI, etc.)
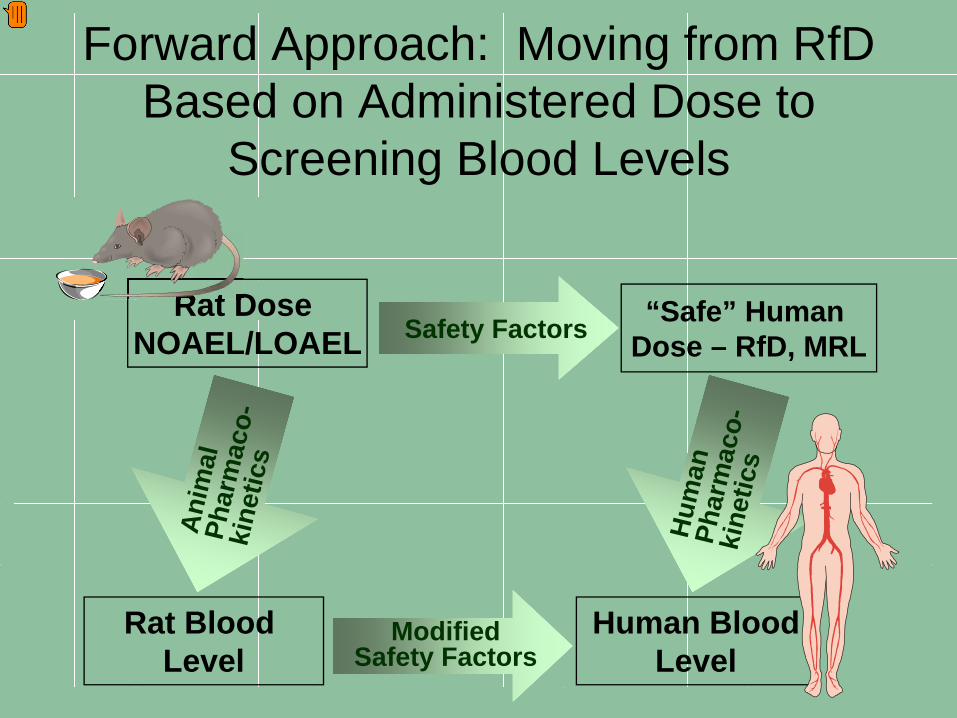
Forward Approach: Moving from RfD Based on Administered Dose to
Screening Blood Levels
Safety FactorsRat Dose
NOAEL/LOAELRat Dose Rat Dose
Human BloodLevel
“Safe” Human Dose – RfD, MRL
Hum
anPh
arm
aco-
kine
tics
Ani
mal
Phar
mac
o-ki
netic
s
Rat Blood Level
ModifiedSafety Factors
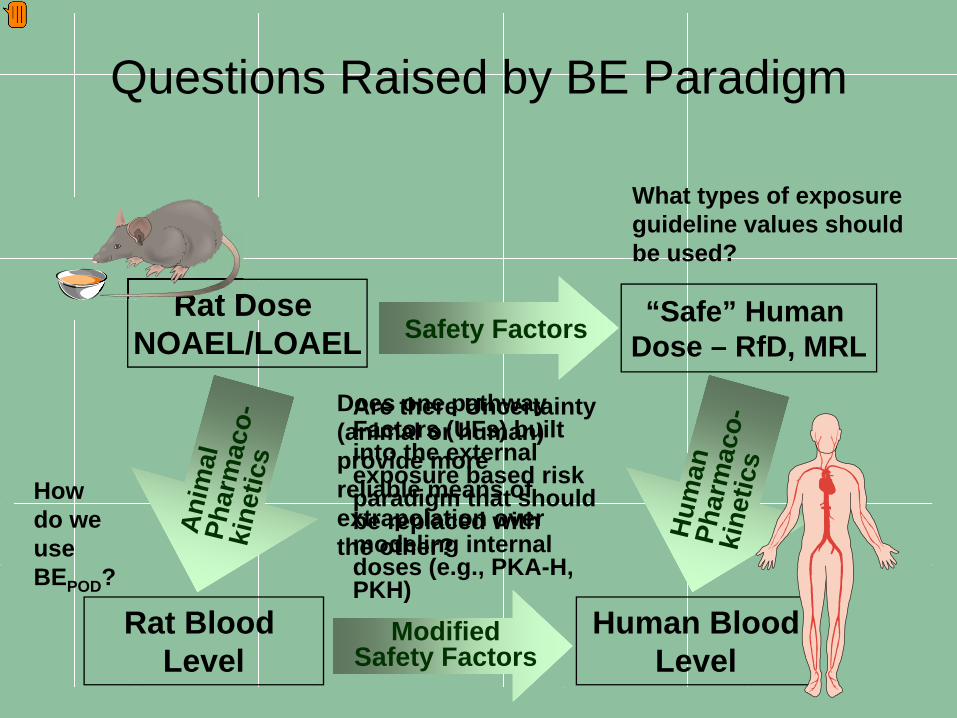
Questions Raised by BE Paradigm
Safety FactorsRat Dose
NOAEL/LOAELRat Dose Rat Dose
Human BloodLevel
“Safe” Human Dose – RfD, MRL
Hum
anPh
arm
aco-
kine
tics
Ani
mal
Phar
mac
o-ki
netic
s
Rat Blood Level
ModifiedSafety Factors
What types of exposure guideline values should be used?
Howdo we useBEPOD?
Does one pathway (animal or human) provide more reliable means of extrapolation over the other?
Are there Uncertainty Factors (UFs) built into the external exposure based risk paradigm that should be replaced with modeling internal doses (e.g., PKA-H, PKH)
Additional Questions Raised by Original BE Paradigm
• Does the cancer slope factor approach pose unique challenges?
• How should BEs for short-lived compounds be derived?
• How should these BEs be communicated to the various audiences?– What is a BE?– What does it mean if biomonitoring
levels exceed the BE?
BE Pilot Project• Sponsoring partners
– EPA, Health Canada, ACC, CropLife America, RISE, API, Soap and Detergent Association
• Develop guidelines for derivation and communication of BEs
• Expert workshop held June, 2007– Participants from government, academia, industry,
NGOs– Addressed charge questions– Informed by draft BEs for four case study compounds:
2,4-D, acrylamide, cadmium, and toluene– Develop guidelines for BE derivation and
communication
BE Pilot Project - Publications
• Dedicated issue of Regulatory Toxicology and Pharmacology, early 2008
• Guidelines Manuscripts– Technical derivation guidelines– Communication guidelines
• Case Studies– Toluene– Cadmium– Acrylamide– 2,4-D
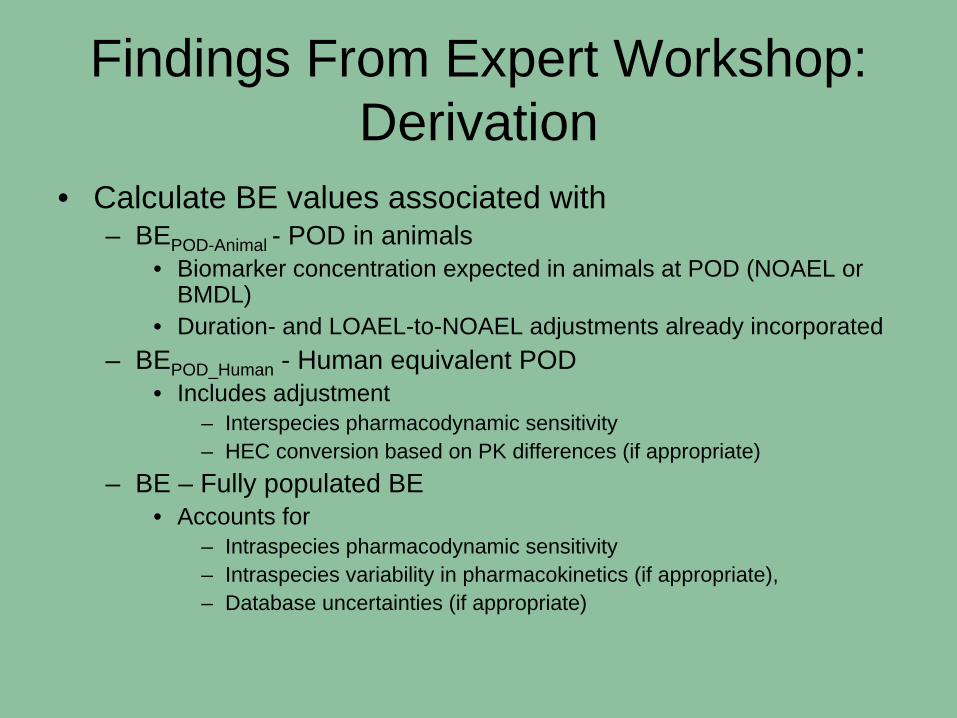
Findings From Expert Workshop: Derivation
• Calculate BE values associated with– BEPOD-Animal - POD in animals
• Biomarker concentration expected in animals at POD (NOAEL or BMDL)
• Duration- and LOAEL-to-NOAEL adjustments already incorporated– BEPOD_Human - Human equivalent POD
• Includes adjustment– Interspecies pharmacodynamic sensitivity– HEC conversion based on PK differences (if appropriate)
– BE – Fully populated BE• Accounts for
– Intraspecies pharmacodynamic sensitivity – Intraspecies variability in pharmacokinetics (if appropriate), – Database uncertainties (if appropriate)
Key Considerations for Derivation
• Availability of animal and/or human PK data/model
• Understanding of MOA and critical dose metric
• Understanding of relationship between biomarker and critical dose metric
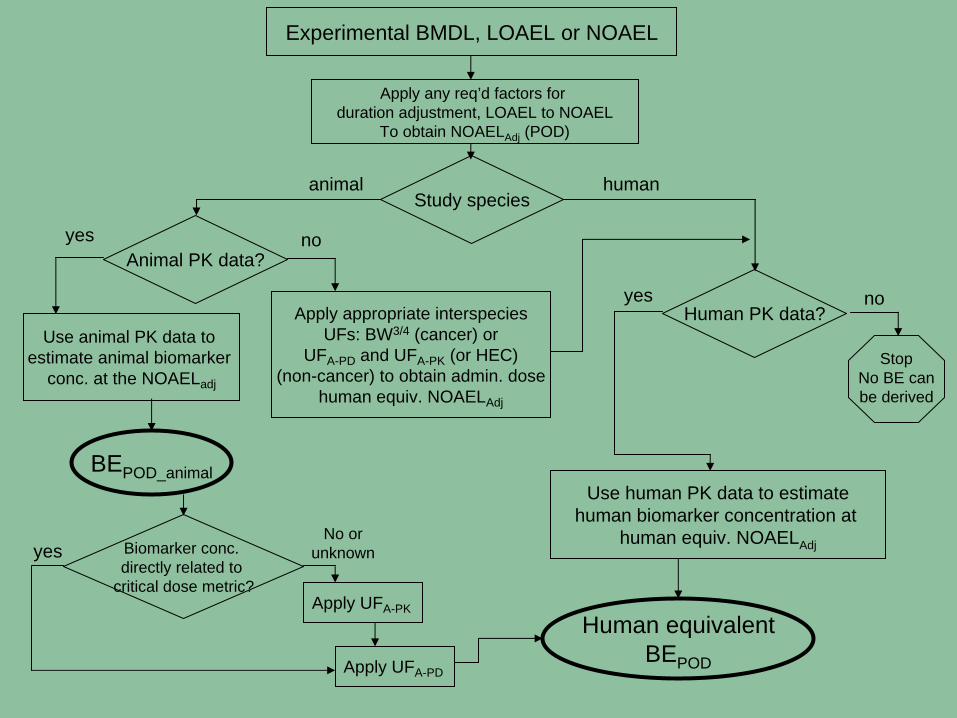
Experimental BMDL, LOAEL or NOAEL
Apply any req’d factors for duration adjustment, LOAEL to NOAEL
To obtain NOAELAdj (POD)
Study speciesanimal human
Human PK data?
Animal PK data?yes no
no
StopNo BE canbe derived
yesApply appropriate interspecies
UFs: BW3/4 (cancer) orUFA-PD and UFA-PK (or HEC)
(non-cancer) to obtain admin. dosehuman equiv. NOAELAdj
Use human PK data to estimatehuman biomarker concentration at
human equiv. NOAELAdj
Use animal PK data to estimate animal biomarker
conc. at the NOAELadj
Biomarker conc. directly related to
critical dose metric?
yesNo or
unknown
Apply UFA-PK
Apply UFA-PD
Human equivalentBEPOD
BEPOD_animal
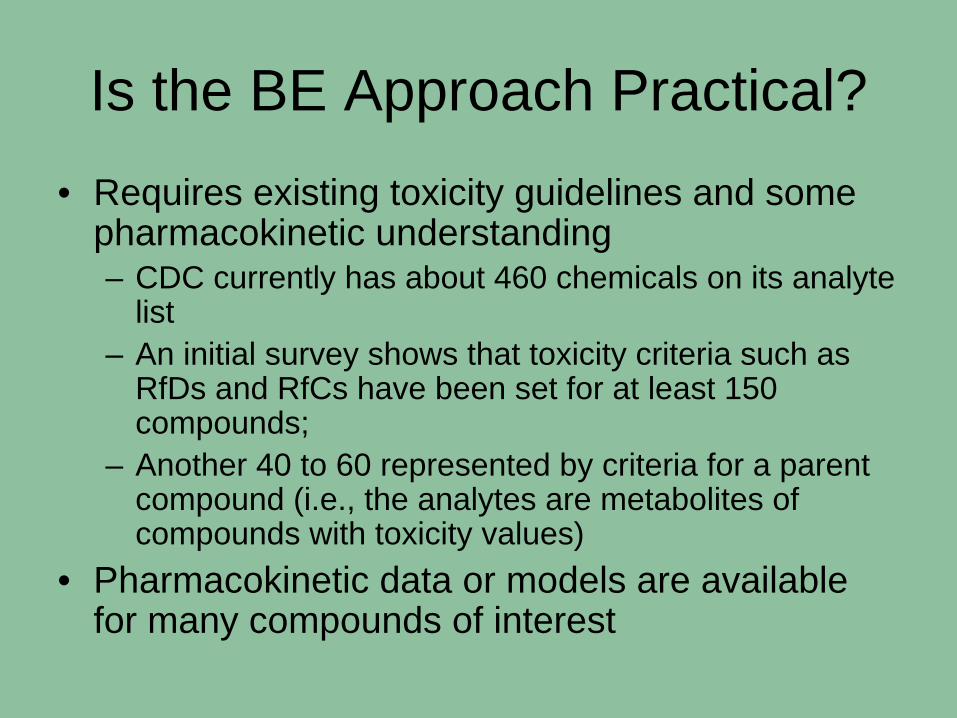
Is the BE Approach Practical?• Requires existing toxicity guidelines and some
pharmacokinetic understanding– CDC currently has about 460 chemicals on its analyte
list– An initial survey shows that toxicity criteria such as
RfDs and RfCs have been set for at least 150 compounds;
– Another 40 to 60 represented by criteria for a parent compound (i.e., the analytes are metabolites of compounds with toxicity values)
• Pharmacokinetic data or models are available for many compounds of interest
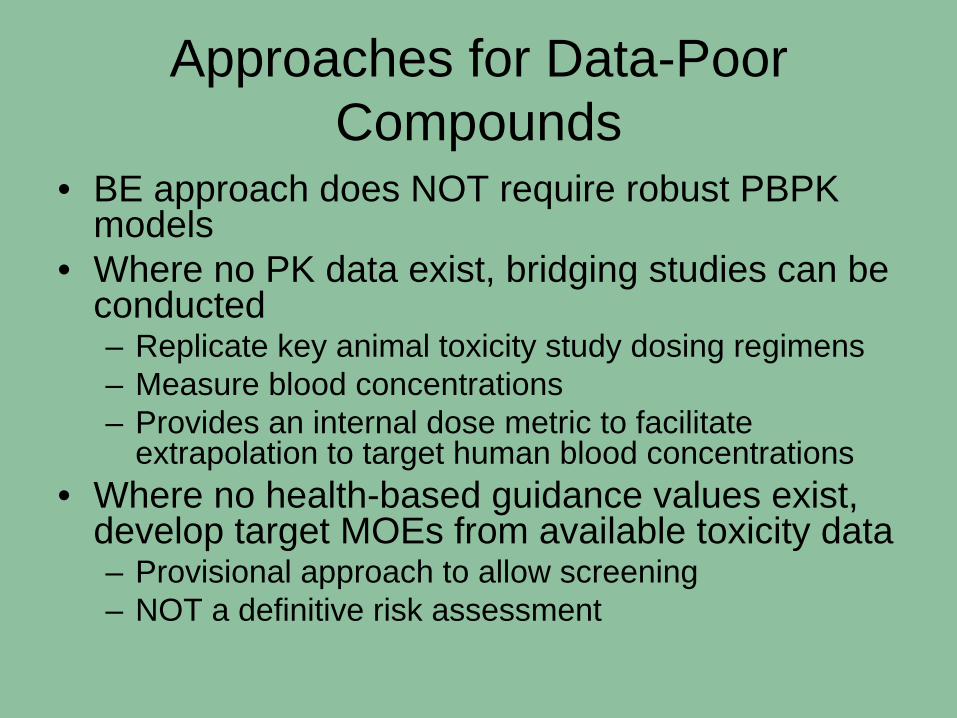
Approaches for Data-Poor Compounds
• BE approach does NOT require robust PBPK models
• Where no PK data exist, bridging studies can be conducted– Replicate key animal toxicity study dosing regimens– Measure blood concentrations– Provides an internal dose metric to facilitate
extrapolation to target human blood concentrations• Where no health-based guidance values exist,
develop target MOEs from available toxicity data– Provisional approach to allow screening– NOT a definitive risk assessment
Findings From Expert Workshop: Communication
• BEs are not bright lines between safe and unsafe levels
• Should not be used for interpreting biomonitoring data from individuals
• Interpretation focuses on low to high priority for “risk assessment follow-up”
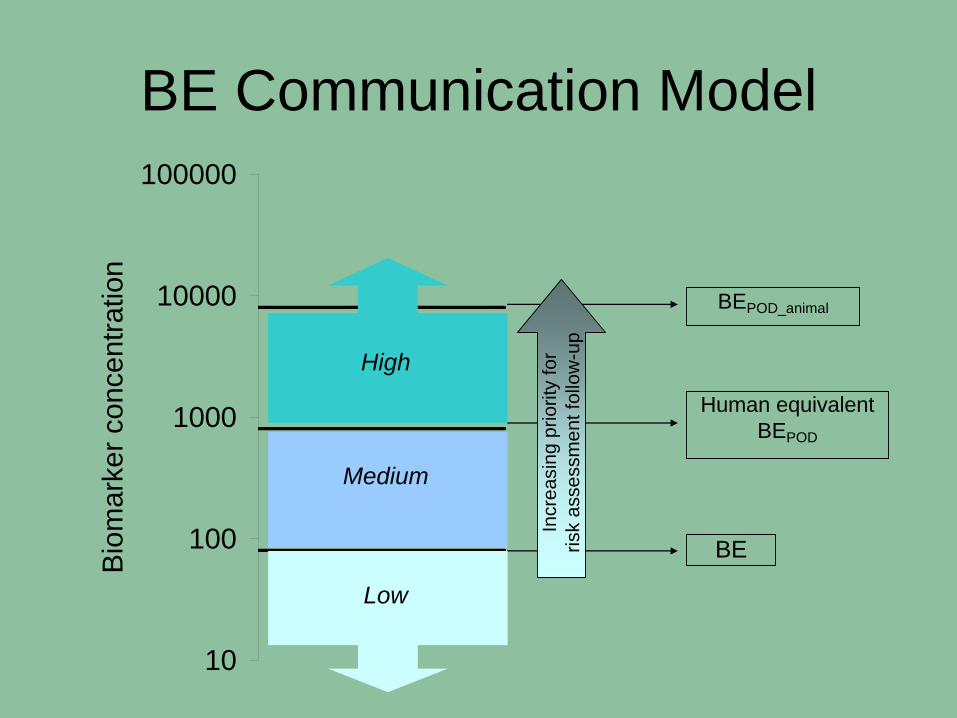
10
100
1000
10000
100000
Bio
mar
ker c
once
ntra
tion
BEPOD_animal
Human equivalentBEPOD
BE
Medium
Incr
easi
ng p
riorit
y fo
r ris
k as
sess
men
t fol
low
-up
High
Low
BE Communication Model

Case Study
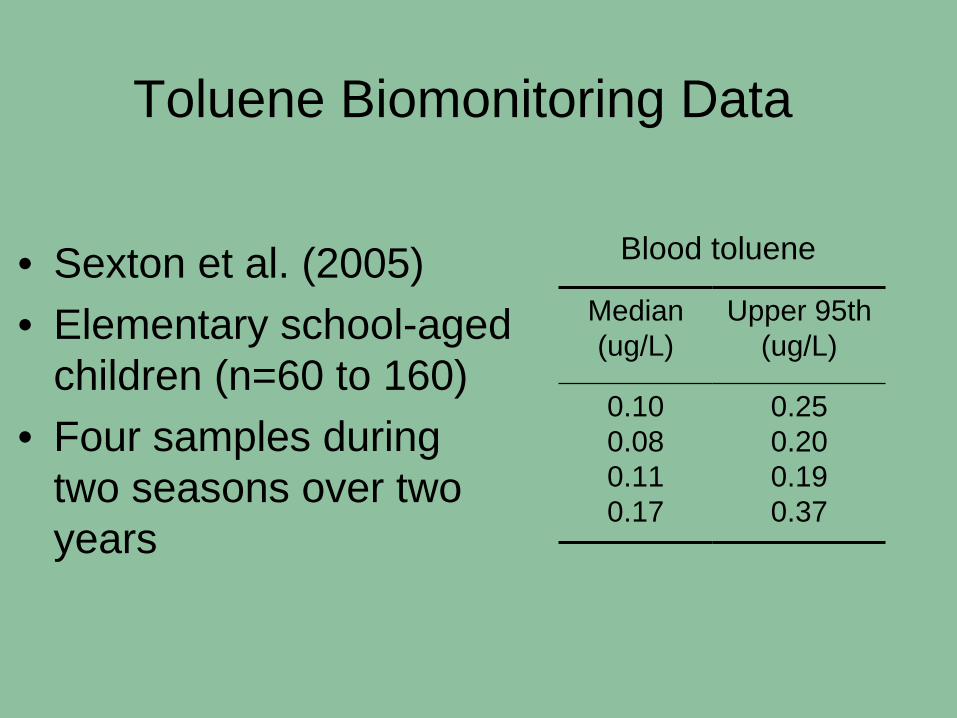
Toluene Biomonitoring Data
• Sexton et al. (2005)• Elementary school-aged
children (n=60 to 160)• Four samples during
two seasons over two years
Median(ug/L)
Upper 95th (ug/L)
0.100.080.110.17
0.250.200.190.37
Blood toluene
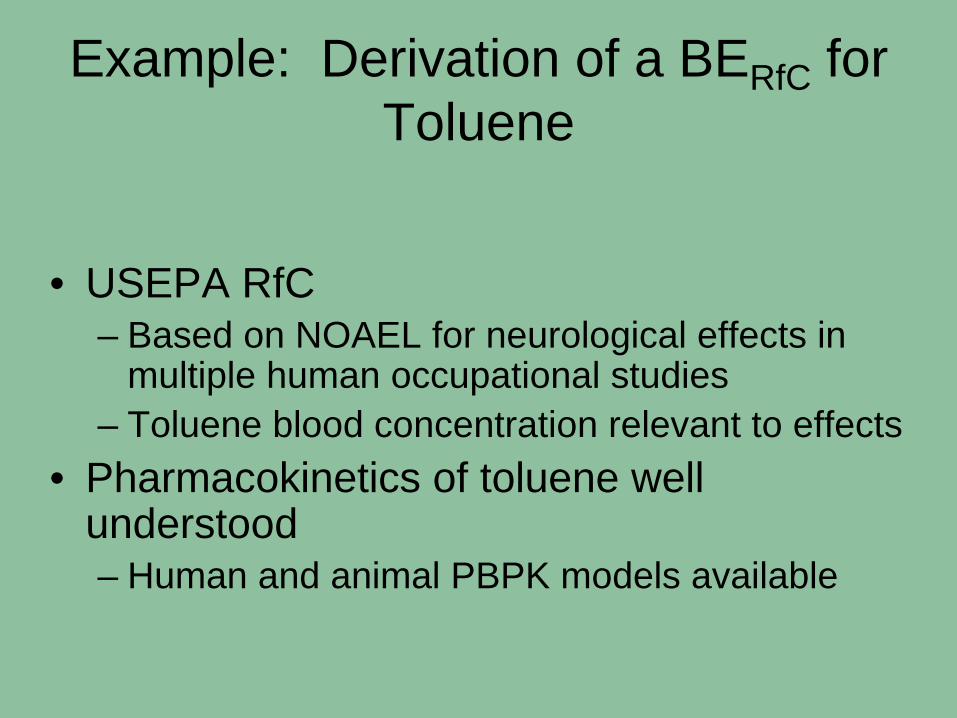
Example: Derivation of a BERfC for Toluene
• USEPA RfC– Based on NOAEL for neurological effects in
multiple human occupational studies– Toluene blood concentration relevant to effects
• Pharmacokinetics of toluene well understood – Human and animal PBPK models available
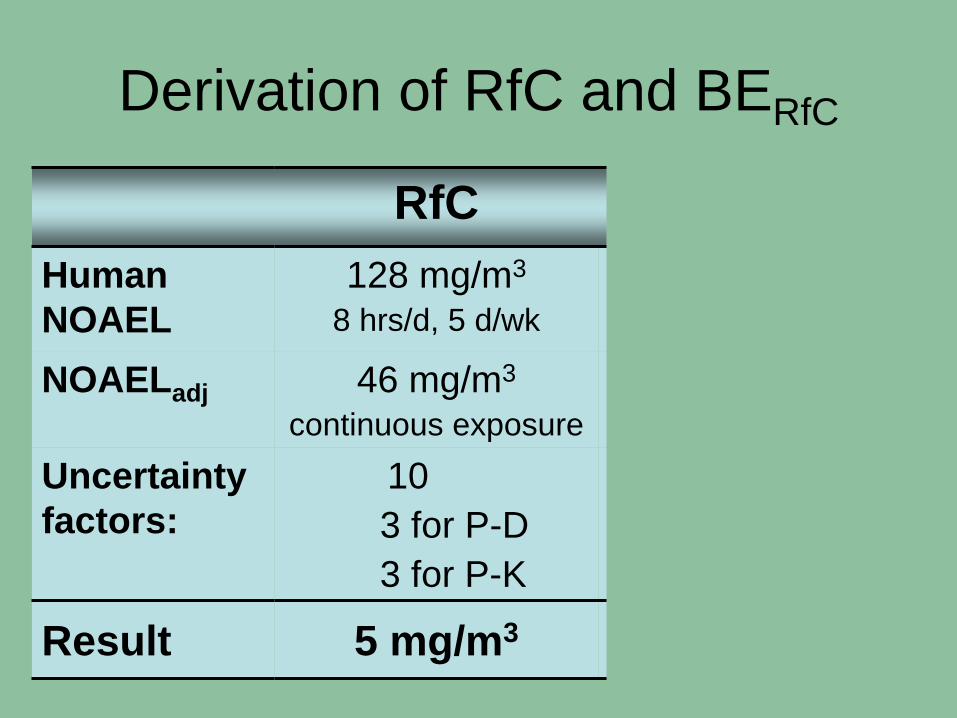
Derivation of RfC and BERfC
RfC BERfC
Human NOAEL
128 mg/m3
8 hrs/d, 5 d/wk400 ug/L
peak blood conc.
NOAELadj 46 mg/m3
continuous exposure180 ug/L
avg. blood conc.Uncertainty factors:
103 for P-D3 for P-K
33 for P-D1 for P-K
Result 5 mg/m3 60 ug/L
0
100
200
300
400
500
0 20 40 60 80Time (hrs)
Tolu
ene
in B
lood
, ug/
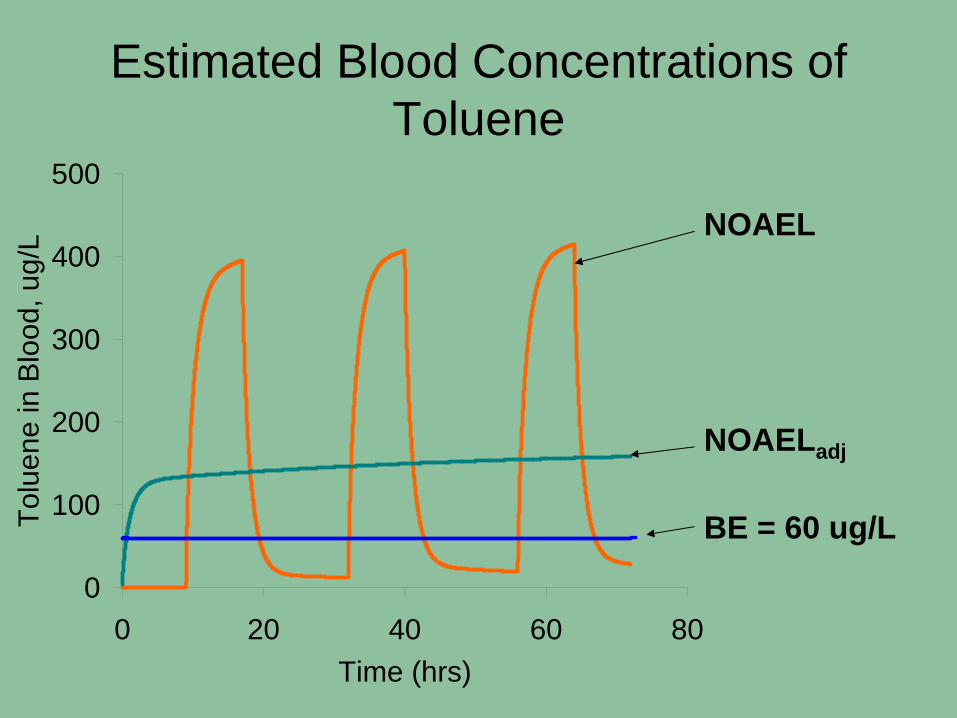
LEstimated Blood Concentrations of
Toluene
NOAEL
NOAELadj
BE = 60 ug/L
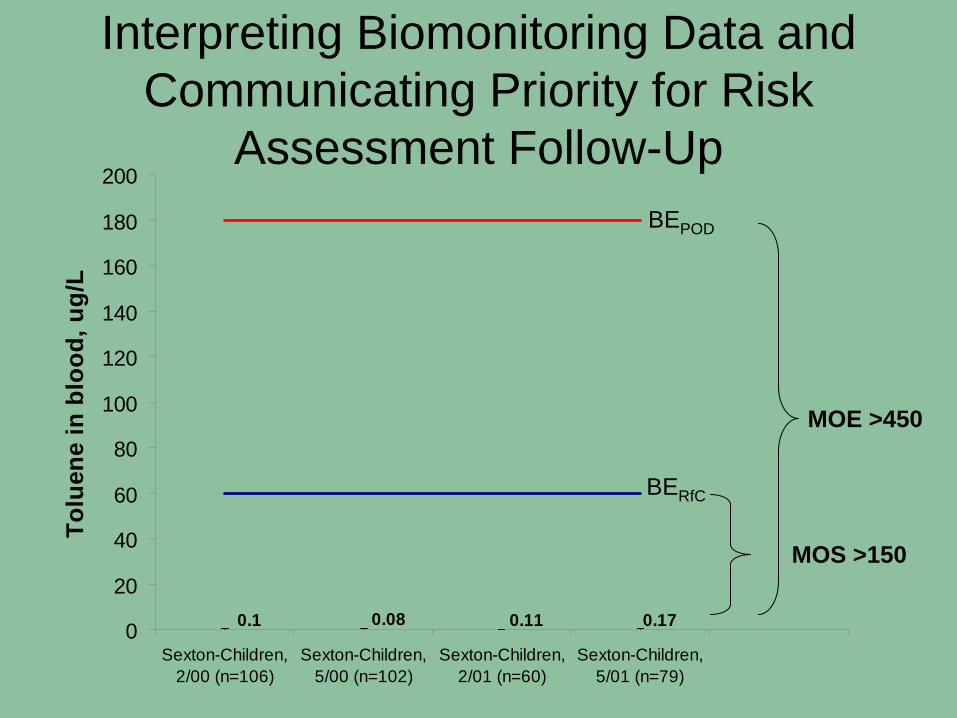
Interpreting Biomonitoring Data and Communicating Priority for Risk
Assessment Follow-Up
0.170.110.080.10
20
40
60
80
100
120
140
160
180
200
Sexton-Children,2/00 (n=106)
Sexton-Children,5/00 (n=102)
Sexton-Children,2/01 (n=60)
Sexton-Children,5/01 (n=79)
Tolu
ene
in b
lood
, ug/
L
BERfC
BEPOD
MOS >150
MOE >450
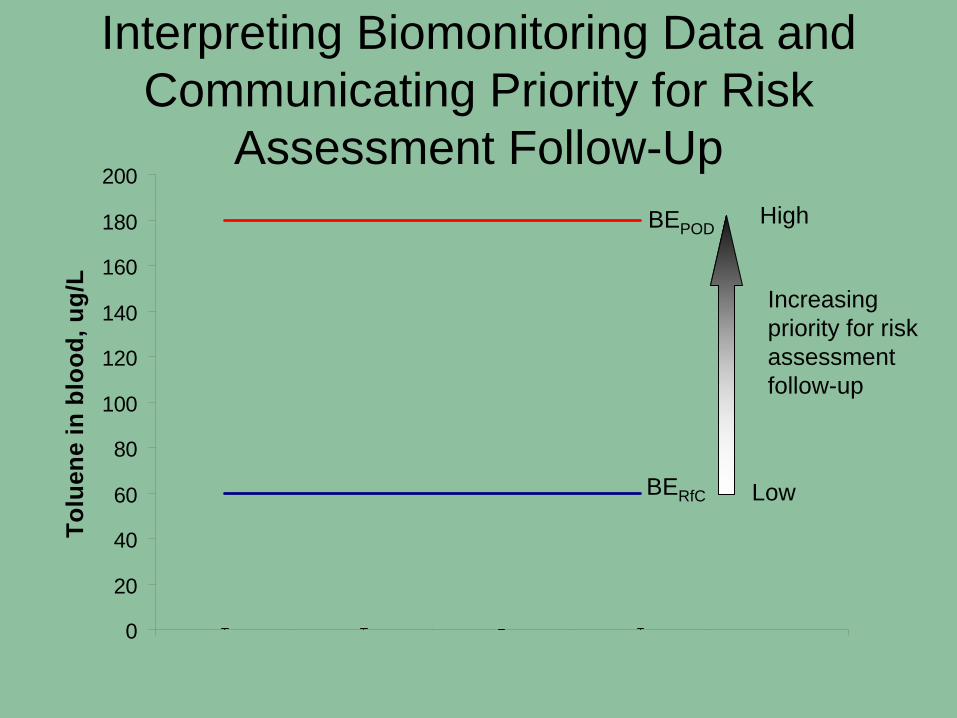
Interpreting Biomonitoring Data and Communicating Priority for Risk
Assessment Follow-Up
0.170.110.080.10
20
40
60
80
100
120
140
160
180
200
Sexton-Children,2/00 (n=106)
Sexton-Children,5/00 (n=102)
Sexton-Children,2/01 (n=60)
Sexton-Children,5/01 (n=79)
Tolu
ene
in b
lood
, ug/
L
Low
High
Increasing priority for risk assessment follow-up
BERfC
BEPOD
The Value of the BE as a Screening Tool
• Risk Assessment– Identify areas of potential improvement for risk assessments
• Biomonitoring Studies– Identify preferred biomarker(s)– Identify concentrations of interest (LOD)
• Risk Communication and Context– Provide context for biomonitoring study results
• Risk Management– Prioritize risk assessment and research efforts
• Compounds with low margin of safety – potentially invest in risk assessment follow-up (exposure and epi studies)
• Compounds with large margin of safety – move to lower priority list• Identify types of studies/data that will reduce uncertainties


