36
EARTH RESOURCES REGULATION 2016-17 STATISTICAL REPORT
| Date post: | 04-Apr-2019 |
| Category: |
Documents |
| Upload: | nguyenhuong |
| View: | 212 times |
| Download: | 0 times |
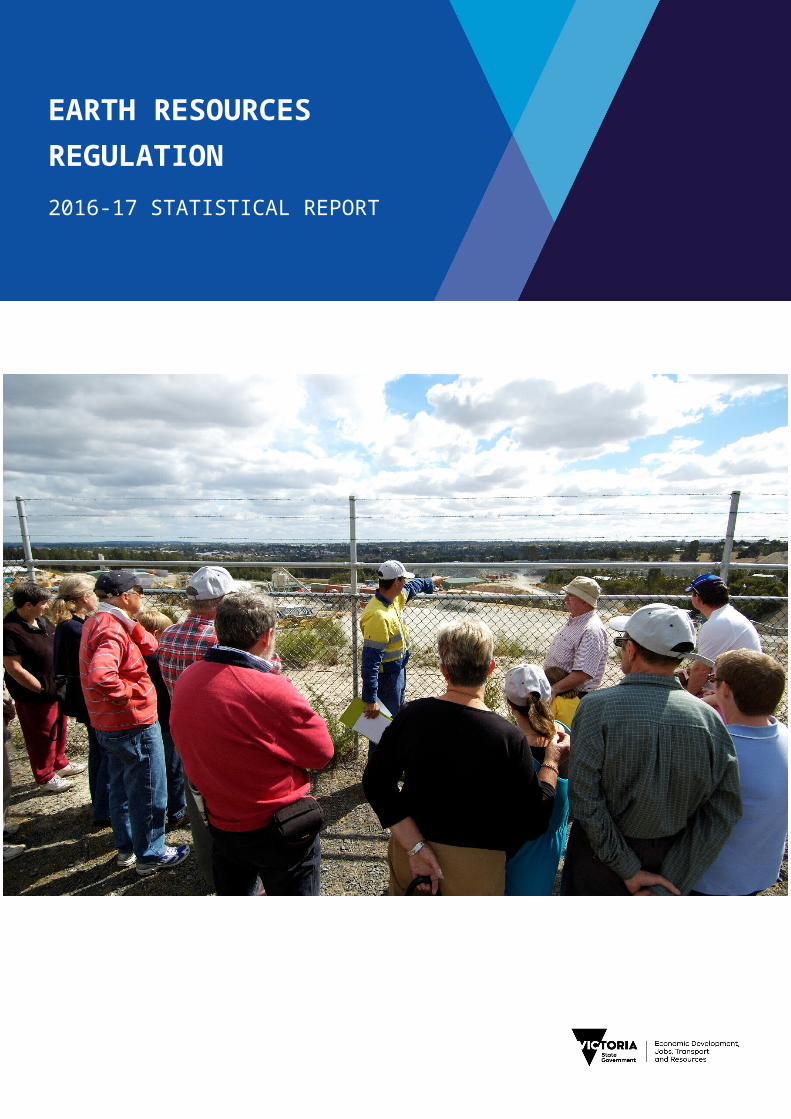
EARTH RESOURCES REGULATION2016-17 STATISTICAL REPORT
Acknowledgement of Victoria’s Traditional Owners
The Victorian Government proudly acknowledges Victorian Traditional Owners as Victoria’s first peoples and pays its respects to their Elders past and present.
We recognise the intrinsic connection of the first peoples to their Country for countless generations and their inherent obligation to maintain and strengthen their distinct cultural rights and responsibilities to care for their Country.
We value Traditional Owners’ role in the management of land, water and biodiversity and acknowledge the ongoing contribution this makes to our earth resources.
We have distinct legislative obligations to Traditional Owner groups that are paramount in our responsibilities in managing Victoria’s resources.
We support the need for genuine and lasting partnerships with Aboriginal people and communities to understand culture and connections to Country in the way we plan for and regulate our earth resources.
Disclaimer
The information contained in this report is provided for general guidance and assistance only and is not intended as advice. You should make your own enquiries as to the appropriateness and suitability of the information provided. While every effort has been made to ensure the currency, accuracy or completeness of the content we endeavour to keep the content relevant and up to date and reserve the right to make changes as required. The Victorian Government, authors and presenters do not accept any liability to any person for the information (or the use of the information) which is provided or referred to in the report.
Authorised by the Victorian GovernmentDepartment of Economic Development, Jobs, Transport and Resources1 Spring Street Melbourne Victoria 3000Telephone (03) 9651 9999
ISBN 978-1-925629-21-7 (pdf/online)
© Copyright State of Victoria 2018
Except for any logos, emblems, trademarks, artwork and photography this document is made available under the terms of the Creative Commons Attribution 3.0 Australia licence.
For more information see the Earth Resources Regulation website www.earthresources.vic.gov.au/earth-resources-regulation
This document is also available in PDF and accessible Word format at http://earthresources.efirst.com.au/categories.asp?cID=46&c=4307
Earth Resources Regulation 2016-17 Statistical Report 2 of 26
Version Amendments
v1.01 FY 2014-15 Expenditure on minerals exploration and mining correctionAmendments made to Table 2.5 (page 14):
MRSDA Exploration expenditure amended from $32.3M to $47.5M MRSDA Mining expenditure $622.3M to $607.8M
v1.01 FY 2016-17 Gold production and Sale Value correctionAmendments made to Introduction (page4) and Table 2.7 (page 16):
Gold Production from 329,452 ounces to 312,229 ounces Gold Sales Value from $547.8M to $519.8M
V1.02 Table 2.2.2.3 Gas ProductionUpdated the table to 2016-17 data.
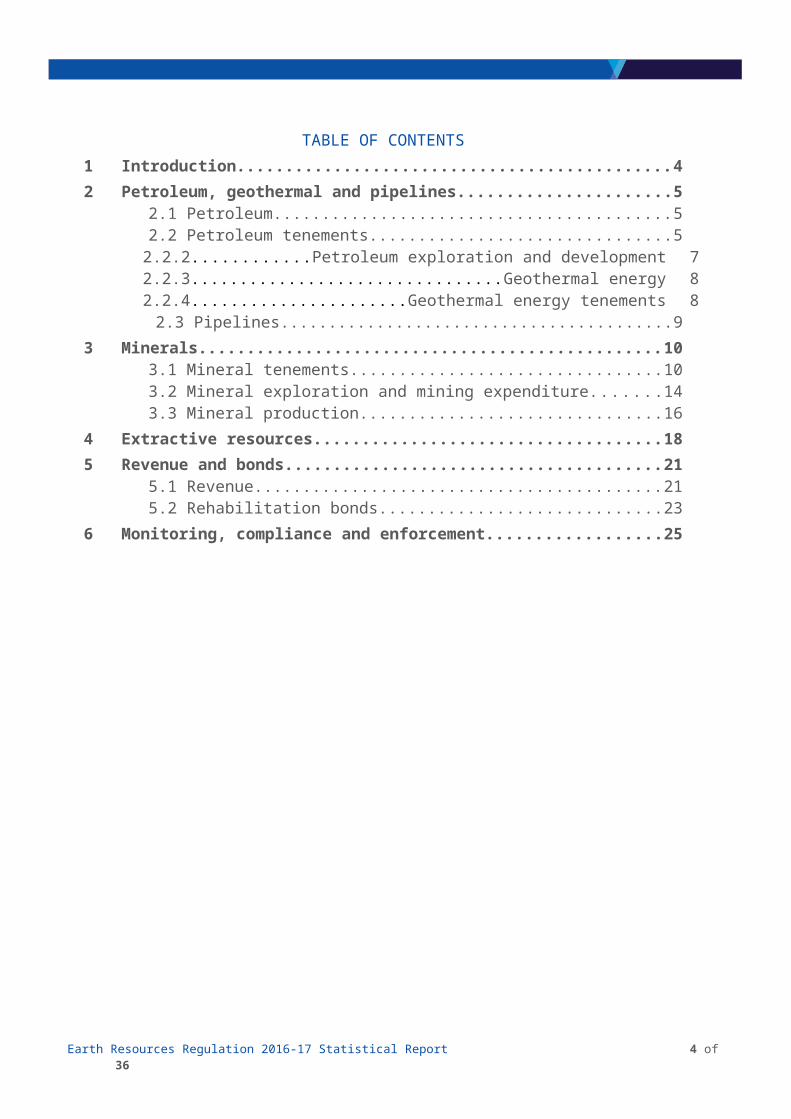
TABLE OF CONTENTS1 Introduction.......................................................................................................42 Petroleum, geothermal and pipelines.............................................................5
2.1 Petroleum.....................................................................................................5 2.2 Petroleum tenements....................................................................................5
2.2.2Petroleum exploration and development...........................................72.2.3Geothermal energy............................................................................82.2.4Geothermal energy tenements..........................................................8
2.3 Pipelines......................................................................................................93 Minerals...........................................................................................................10
3.1 Mineral tenements......................................................................................10 3.2 Mineral exploration and mining expenditure...............................................14 3.3 Mineral production......................................................................................16
4 Extractive resources......................................................................................185 Revenue and bonds.......................................................................................21
5.1 Revenue.....................................................................................................21 5.2 Rehabilitation bonds...................................................................................23
6 Monitoring, compliance and enforcement...................................................25
Earth Resources Regulation 2016-17 Statistical Report 3 of 26
1 Introduction
The Earth Resources Regulation Branch (ERR) in the Department of Economic Development, Jobs, Transport and Resources (DEDJTR) is responsible for the regulation of minerals, extractives, petroleum, pipelines, geothermal and carbon storage activities in Victoria and offshore (Victorian) waters. The Earth Resources Regulation administers a consistent and transparent tenement management regime and conducts monitoring and compliance operations to ensure that authority holders comply with their statutory obligations.
Earth Resources Regulation administered the following Acts.
Mineral Resources (Sustainable Development) Act 1990 (MRSDA) (mineral exploration, mining and quarrying);
Offshore Petroleum and Greenhouse Gas Storage Act 2010 (OPGGSA) (petroleum exploration and development, greenhouse gas storage and pipelines in the Victorian offshore waters);
Petroleum Act 1998 (petroleum exploration and development onshore); Pipelines Act 2005 (licensing and regulation of high pressure pipelines onshore); Geothermal Energy Resources Act 2005 (geothermal energy exploration and development); and Greenhouse Gas Geological Sequestration Act 2008 (greenhouse gas storage onshore).
The 2016-17 Statistical Report presents a compilation of data as reported by Victoria’s earth resources authority holders to Earth Resources Regulation. The report includes data on exploration, production, expenditure, licensing, revenues and regulatory actions.
All production and expenditure figures are certified by authority holders and submitted to Earth Resources Regulation.
Key observations and statistics for 2016-17 include:
There were 411 licences as at 30 June 2017, which was a decline of 6.4 per cent compared to 2015-16.
The number of new licences granted and renewed increased to 68 from 57 in 2015-16.
In the petroleum sector, production from three new development wells came on stream in September 2016. H-2 well from Halladale field, S-1 and S-2ST1 wells from Speculant field were located within Offshore Petro-leum Production Licence VIC/L1(V) located within three nautical mile zone.
In the extractive sector, 529 quarries produced a total of 57.4 million tonnes of rock at a reported value of $849 million dollars, an increase of 4.5 per cent ($33.5 million) year on year.
The minerals sector continued to reflect the general trend of a fluctuating commodity market over the past five years. The production of gold remained high with a further increase of 21.6 per cent to 312,229 ounces, while the production of brown coal decreased by 6.1 per cent. The amount spent on exploration increased from $38.0 million to $43.5 million (14.5 per cent increase).
State revenue (rent, royalty and administrative fees) derived from the earth resources sector totalled $87.9 million, an increase of 69 per cent ($36 million). This increase was mostly attributable to an adjustment in the royalty rate for brown coal, which came into effect on 1 January 2017.
Earth Resources Regulation 2016-17 Statistical Report 4 of 26
2 Petroleum, geothermal and pipelines
2.1 PetroleumExploration for petroleum within Victoria’s jurisdiction occurred in the Otway and Gippsland geological basins. Production activity occurred in the Otway Basin.
Offshore activities occur within three nautical miles off the coast, as covered by Victorian legislation. Waters greater than three nautical miles offshore from the coast are covered by Commonwealth legislation and reported separately by Commonwealth Government agencies.
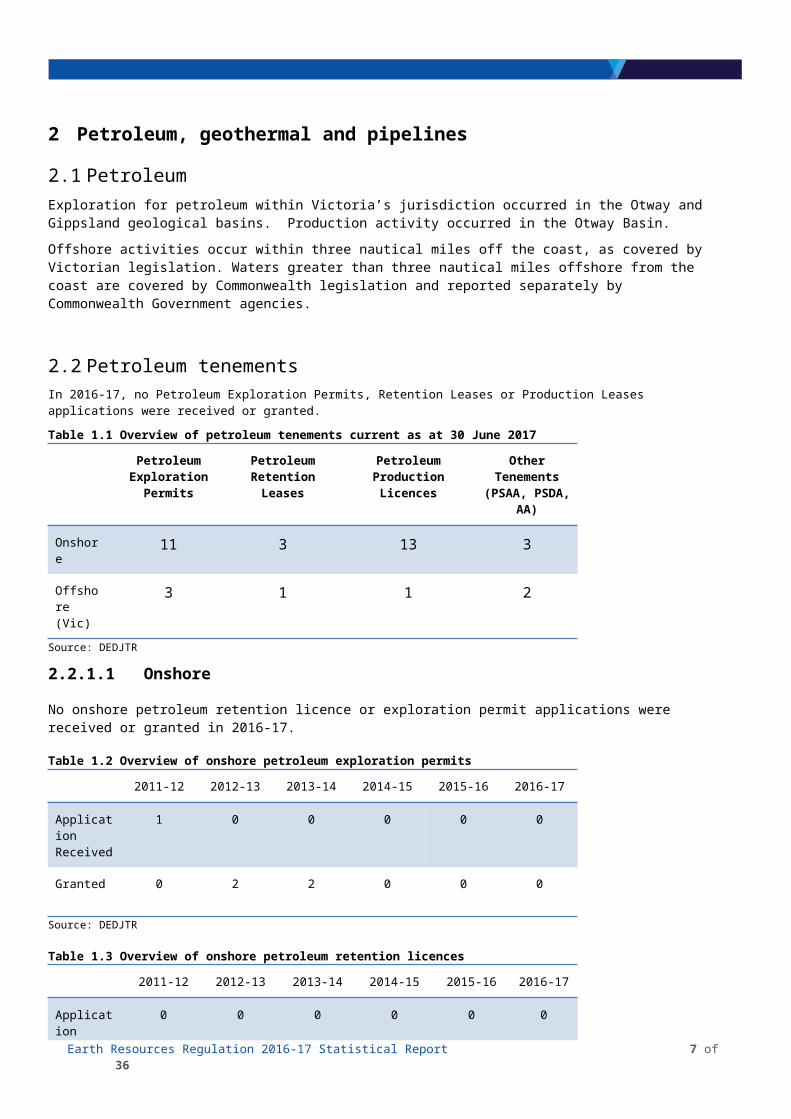
2.2 Petroleum tenementsIn 2016-17, no Petroleum Exploration Permits, Retention Leases or Production Leases applications were received or granted.
Table 1.1 Overview of petroleum tenements current as at 30 June 2017
Petroleum Exploration
Permits
Petroleum Retention Leases
Petroleum Production Licences
Other Tenements
(PSAA, PSDA, AA)
Onshore 11 3 13 3
Offshore (Vic)
3 1 1 2
Source: DEDJTR
2.2.1.1 Onshore
No onshore petroleum retention licence or exploration permit applications were received or granted in 2016-17.
Table 1.2 Overview of onshore petroleum exploration permits
2011-12 2012-13 2013-14 2014-15 2015-16 2016-17
Application Received
1 0 0 0 0 0
Granted 0 2 2 0 0 0
Source: DEDJTR
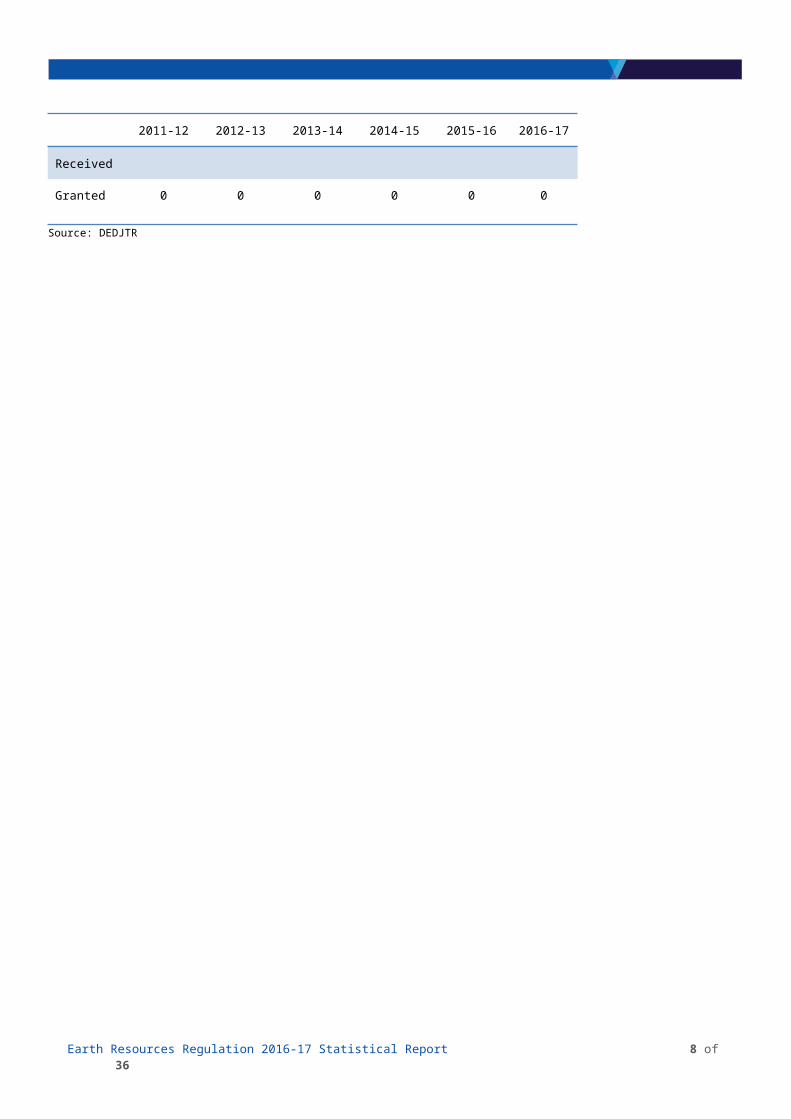
Table 1.3 Overview of onshore petroleum retention licences
2011-12 2012-13 2013-14 2014-15 2015-16 2016-17
Application Received
0 0 0 0 0 0
Granted 0 0 0 0 0 0
Source: DEDJTR
Earth Resources Regulation 2016-17 Statistical Report 5 of 26
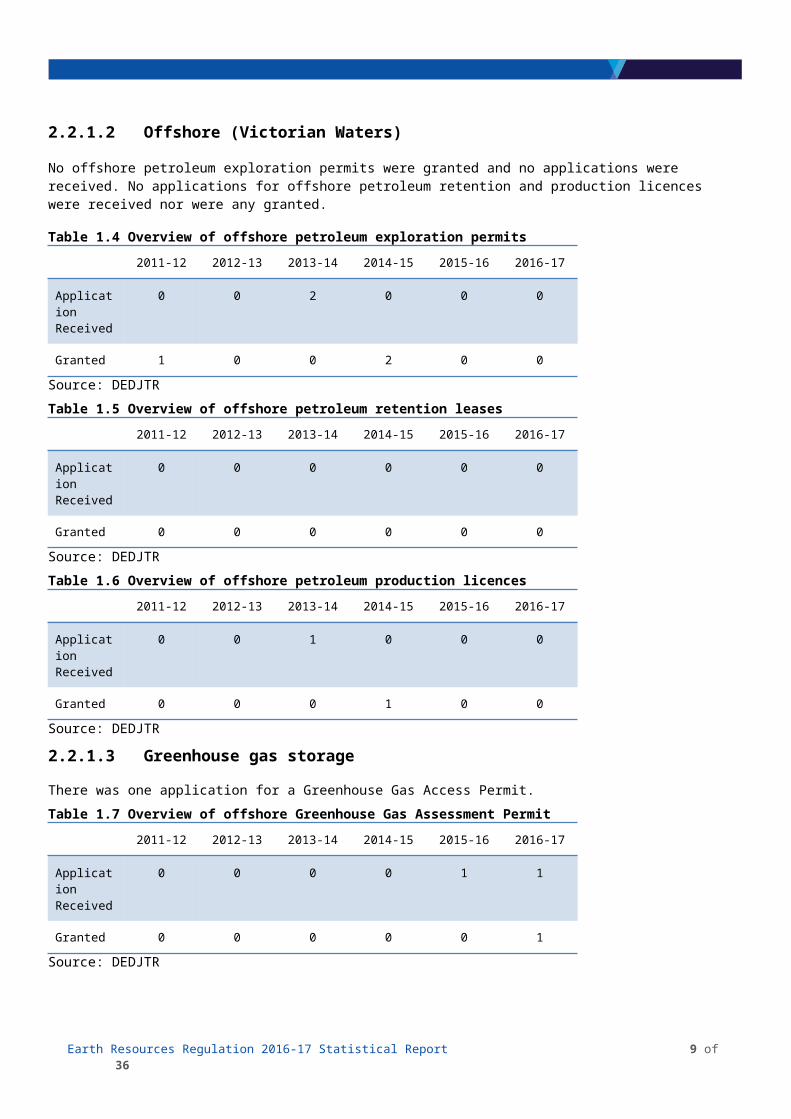
2.2.1.2 Offshore (Victorian Waters)
No offshore petroleum exploration permits were granted and no applications were received. No applications for offshore petroleum retention and production licences were received nor were any granted.
Table 1.4 Overview of offshore petroleum exploration permits
2011-12 2012-13 2013-14 2014-15 2015-16 2016-17
Application Received
0 0 2 0 0 0
Granted 1 0 0 2 0 0
Source: DEDJTR
Table 1.5 Overview of offshore petroleum retention leases
2011-12 2012-13 2013-14 2014-15 2015-16 2016-17
Application Received
0 0 0 0 0 0
Granted 0 0 0 0 0 0
Source: DEDJTR
Table 1.6 Overview of offshore petroleum production licences
2011-12 2012-13 2013-14 2014-15 2015-16 2016-17
Application Received
0 0 1 0 0 0
Granted 0 0 0 1 0 0
Source: DEDJTR
2.2.1.3 Greenhouse gas storage
There was one application for a Greenhouse Gas Access Permit.
Table 1.7 Overview of offshore Greenhouse Gas Assessment Permit
2011-12 2012-13 2013-14 2014-15 2015-16 2016-17
Application Received
0 0 0 0 1 1
Granted 0 0 0 0 0 1
Source: DEDJTR
Earth Resources Regulation 2016-17 Statistical Report 6 of 26
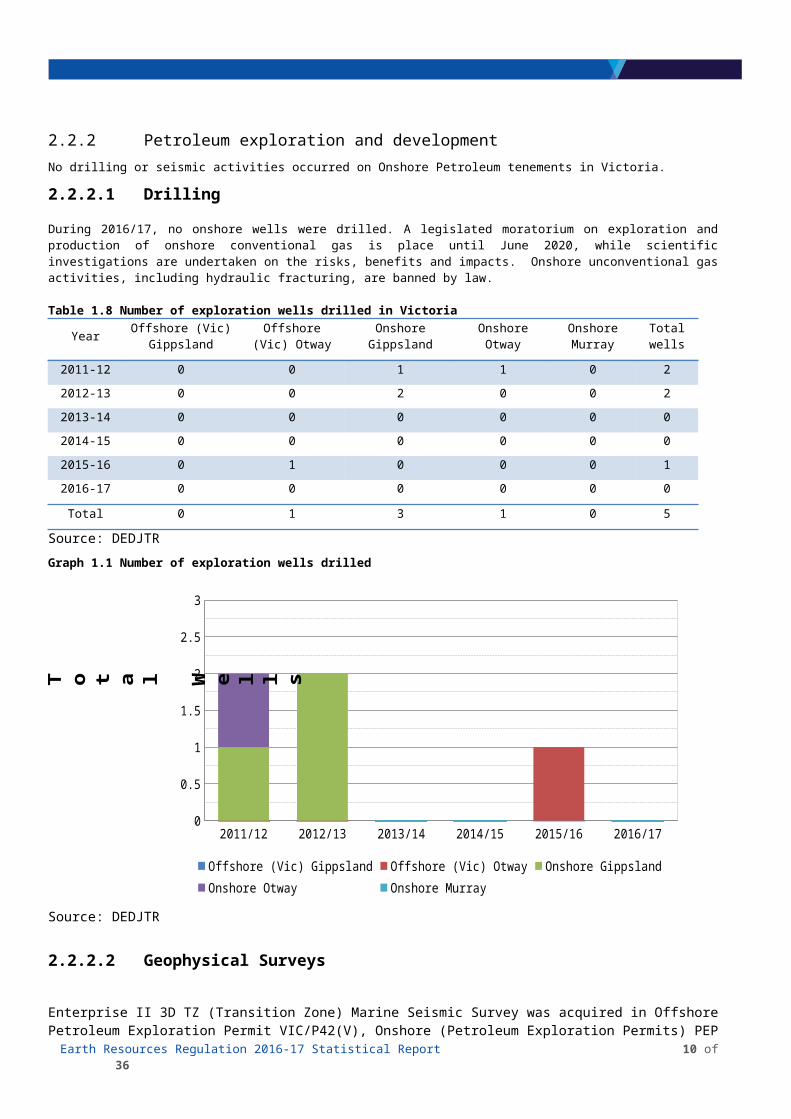
2.2.2 Petroleum exploration and developmentNo drilling or seismic activities occurred on Onshore Petroleum tenements in Victoria.
2.2.2.1 Drilling
During 2016/17, no onshore wells were drilled. A legislated moratorium on exploration and production of onshore conventional gas is place until June 2020, while scientific investigations are undertaken on the risks, benefits and impacts. Onshore unconventional gas activities, including hydraulic fracturing, are banned by law.
Table 1.8 Number of exploration wells drilled in Victoria
Year Offshore (Vic) Gippsland
Offshore (Vic) Otway
Onshore Gippsland
Onshore Otway
Onshore Murray
Total wells
2011-12 0 0 1 1 0 2
2012-13 0 0 2 0 0 2
2013-14 0 0 0 0 0 0
2014-15 0 0 0 0 0 0
2015-16 0 1 0 0 0 1
2016-17 0 0 0 0 0 0
Total 0 1 3 1 0 5
Source: DEDJTR
Graph 1.1 Number of exploration wells drilled
2011/12 2012/13 2013/14 2014/15 2015/16 2016/170
0.5
1
1.5
2
2.5
3
Offshore (Vic) Gippsland Offshore (Vic) Otway Onshore GippslandOnshore Otway Onshore Murray
T o t a l W e l l s
Source: DEDJTR
2.2.2.2 Geophysical Surveys
Enterprise II 3D TZ (Transition Zone) Marine Seismic Survey was acquired in Offshore Petroleum Exploration Permit VIC/P42(V), Onshore (Petroleum Exploration Permits) PEP 168, PEP169 and (Petroleum Production Licence) PPL8. The survey was initiated in January and completed in April 2017.
Earth Resources Regulation 2016-17 Statistical Report 7 of 26
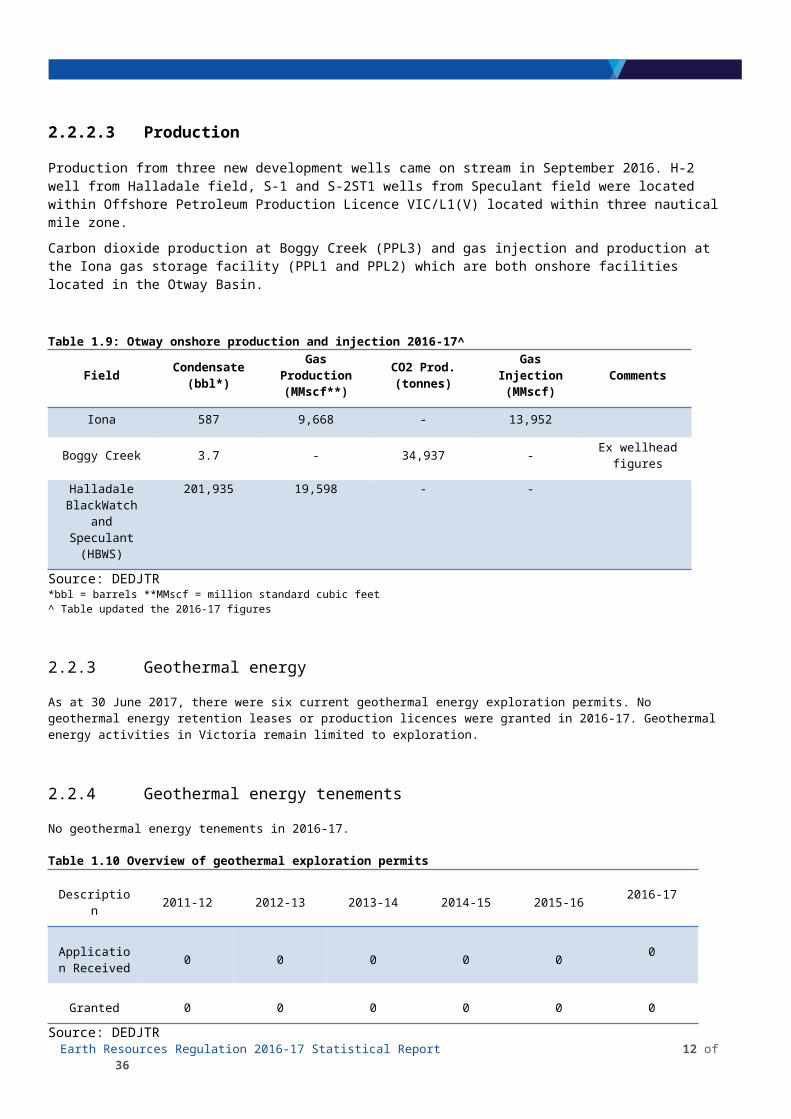
2.2.2.3 Production
Production from three new development wells came on stream in September 2016. H-2 well from Halladale field, S-1 and S-2ST1 wells from Speculant field were located within Offshore Petroleum Production Licence VIC/L1(V) located within three nautical mile zone.
Carbon dioxide production at Boggy Creek (PPL3) and gas injection and production at the Iona gas storage facility (PPL1 and PPL2) which are both onshore facilities located in the Otway Basin.
Table 1.9: Otway onshore production and injection 2016-17^
Field Condensate (bbl*)
Gas Production (MMscf**)
CO2 Prod. (tonnes)
Gas Injection (MMscf) Comments
Iona 587 9,668 - 13,952
Boggy Creek 3.7 - 34,937 - Ex wellhead figures
Halladale BlackWatch and
Speculant (HBWS)
201,935 19,598 - -
Source: DEDJTR*bbl = barrels **MMscf = million standard cubic feet ^ Table updated the 2016-17 figures
2.2.3 Geothermal energy
As at 30 June 2017, there were six current geothermal energy exploration permits. No geothermal energy retention leases or production licences were granted in 2016-17. Geothermal energy activities in Victoria remain limited to exploration.
2.2.4 Geothermal energy tenements
No geothermal energy tenements in 2016-17.
Table 1.10 Overview of geothermal exploration permits
Description 2011-12 2012-13 2013-14 2014-15 2015-16 2016-17
Application Received 0 0 0 0 0 0
Granted 0 0 0 0 0 0
Source: DEDJTR
Earth Resources Regulation 2016-17 Statistical Report 8 of 26
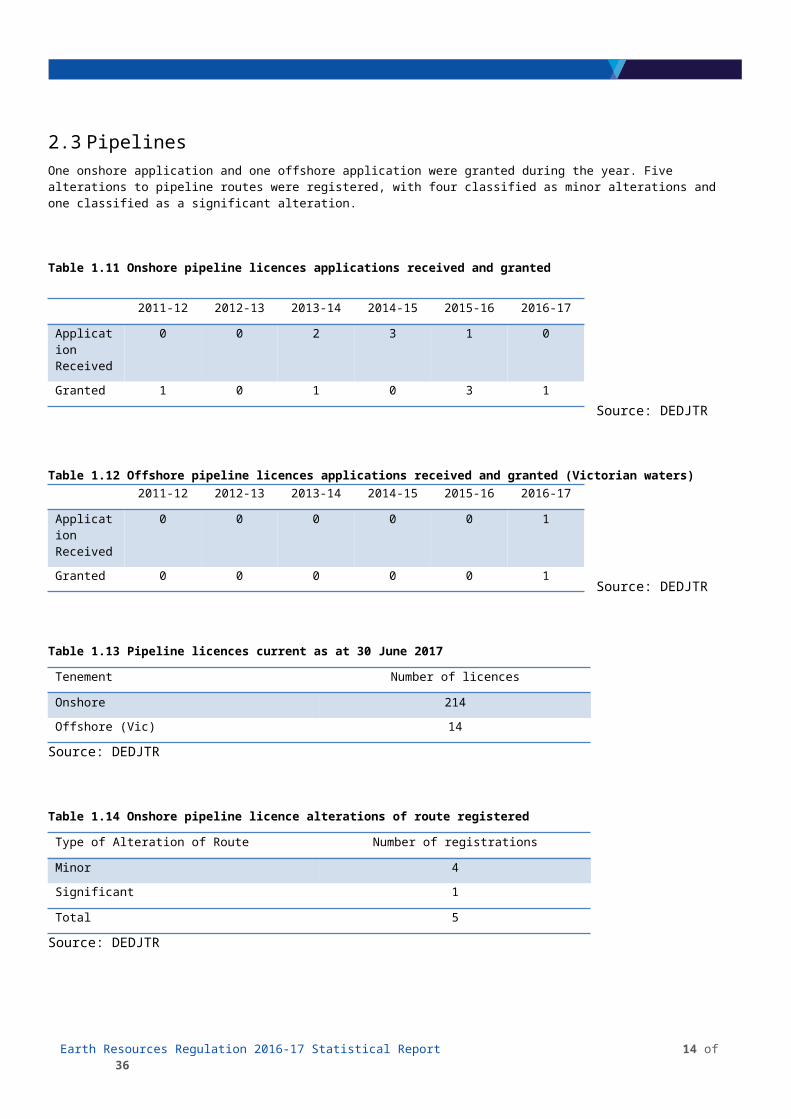
2.3 PipelinesOne onshore application and one offshore application were granted during the year. Five alterations to pipeline routes were registered, with four classified as minor alterations and one classified as a significant alteration.
Table 1.11 Onshore pipeline licences applications received and granted
Source: DEDJTR
Table 1.12 Offshore pipeline licences applications received and granted (Victorian waters)
Source: DEDJTR
Table 1.13 Pipeline licences current as at 30 June 2017
Tenement Number of licences
Onshore 214
Offshore (Vic) 14
Source: DEDJTR
Table 1.14 Onshore pipeline licence alterations of route registered
Type of Alteration of Route Number of registrations
Minor 4
Significant 1
Total 5
Source: DEDJTR
Earth Resources Regulation 2016-17 Statistical Report 9 of 26
2011-12 2012-13 2013-14 2014-15 2015-16 2016-17
Application Received
0 0 2 3 1 0
Granted 1 0 1 0 3 1
2011-12 2012-13 2013-14 2014-15 2015-16 2016-17
Application Received
0 0 0 0 0 1
Granted 0 0 0 0 0 1
3 Minerals
3.1 Mineral tenementsThe number of current retention and prospecting licences continued to increase year on year. The area covered by exploration licences also increased by 7 per cent. The total number of exploration and mining licences continued to reduce year on year.
Table 2.1 Licences current as at 30 June
Tenement Type 2012 2013 2014 2015 2016 2017
Exploration Licences 326 311 271 247 211 180
Mining Licences 208 212 191 171 170 162
Prospecting Licences 1 13 31 41 51 54
Retention Licences 0 1 1 8 11 15
Totals 535 537 494 467 443 411
Change year-on-year (%) 2.9 0.4 -8.0 -5.5 -6.0 -6.4
Source: DEDJTR
Graph 2.1 Licences current as at 30 June
2012 2013 2014 2015 2016 20170
50
100
150
200
250
300
350
Exploration Licences Mining Licences Prospecting Licences Retention Licences
Source: DEDJTR
Earth Resources Regulation 2016-17 Statistical Report 10 of 26
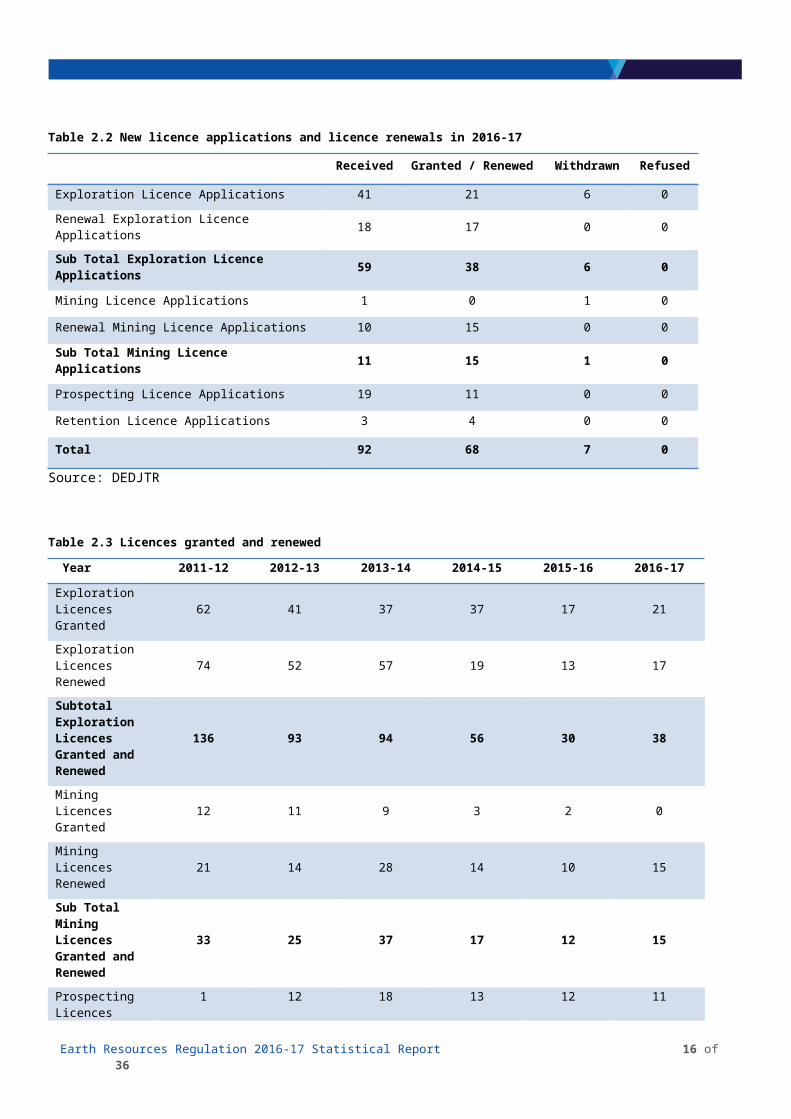
Table 2.2 New licence applications and licence renewals in 2016-17
Received Granted / Renewed Withdrawn Refused
Exploration Licence Applications 41 21 6 0
Renewal Exploration Licence Applications 18 17 0 0
Sub Total Exploration Licence Applications 59 38 6 0
Mining Licence Applications 1 0 1 0
Renewal Mining Licence Applications 10 15 0 0
Sub Total Mining Licence Applications 11 15 1 0
Prospecting Licence Applications 19 11 0 0
Retention Licence Applications 3 4 0 0
Total 92 68 7 0
Source: DEDJTR
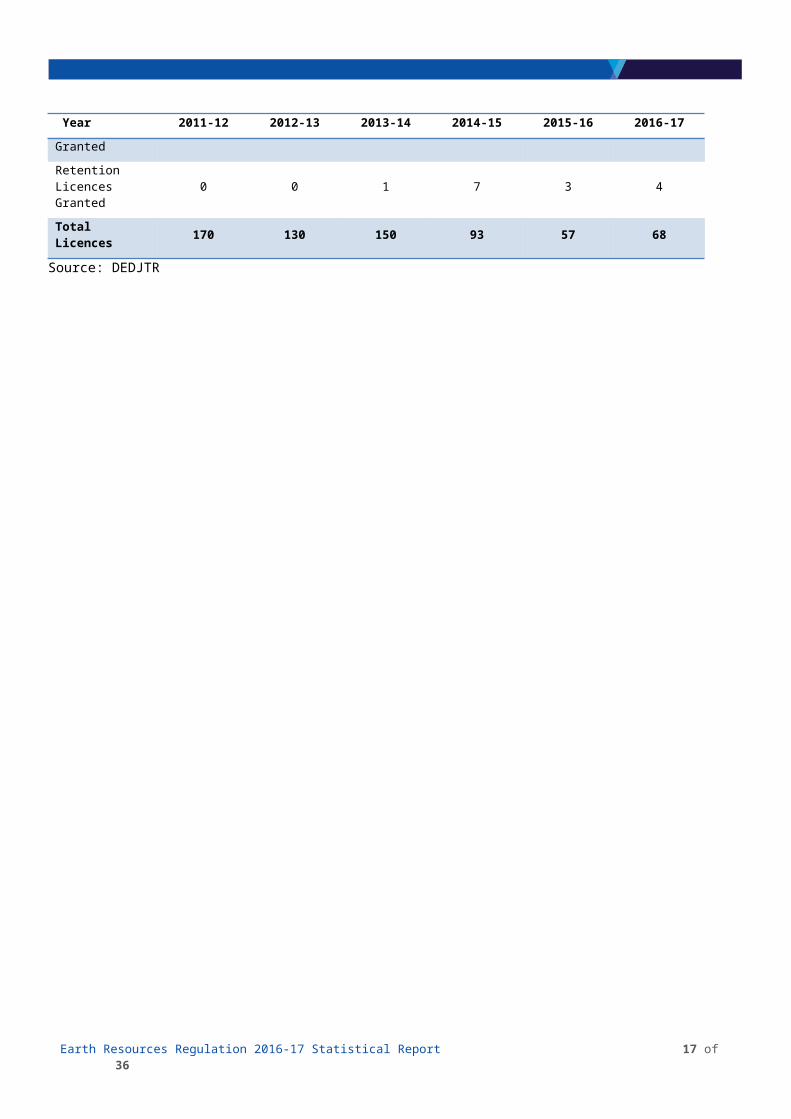
Table 2.3 Licences granted and renewed
Year 2011-12 2012-13 2013-14 2014-15 2015-16 2016-17
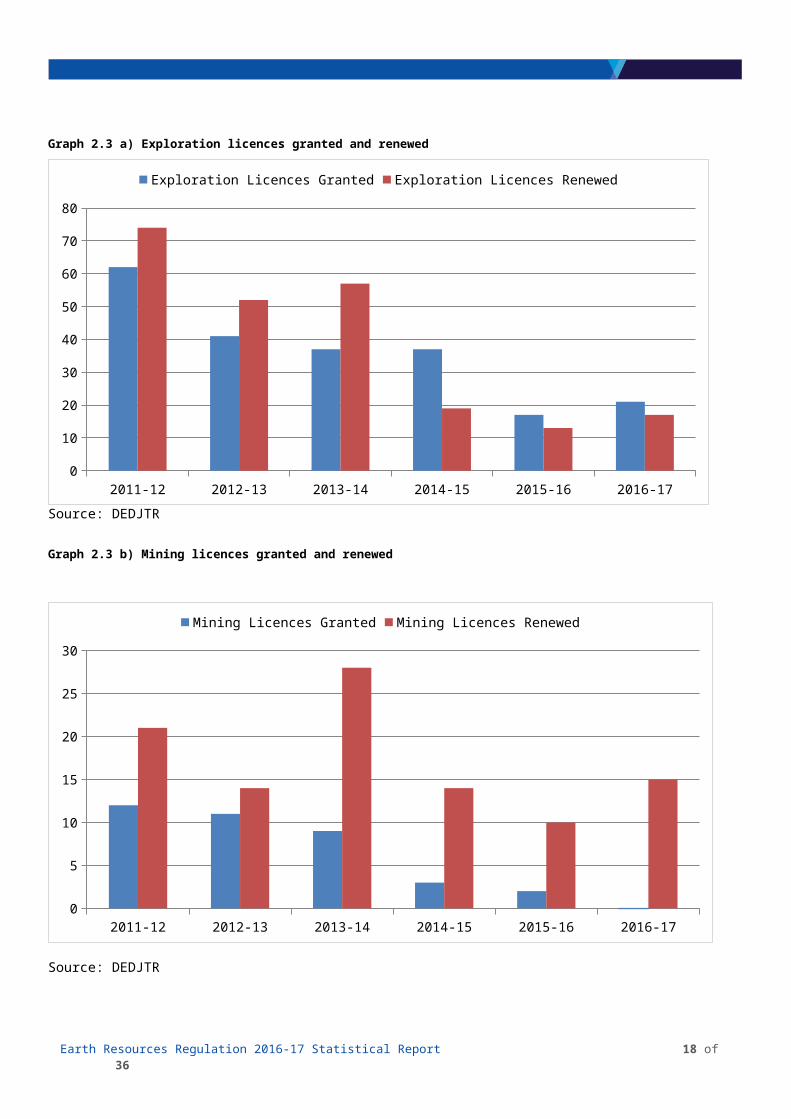
Exploration Licences Granted 62 41 37 37 17 21
Exploration Licences Renewed
74 52 57 19 13 17
Subtotal Exploration Licences Granted and Renewed
136 93 94 56 30 38
Mining Licences Granted 12 11 9 3 2 0
Mining Licences Renewed 21 14 28 14 10 15
Sub Total Mining Licences Granted and Renewed
33 25 37 17 12 15
Prospecting Licences Granted 1 12 18 13 12 11
Retention Licences Granted 0 0 1 7 3 4
Total Licences 170 130 150 93 57 68
Source: DEDJTR
Earth Resources Regulation 2016-17 Statistical Report 11 of 26
Graph 2.3 a) Exploration licences granted and renewed
2011-12 2012-13 2013-14 2014-15 2015-16 2016-170
10
20
30
40
50
60
70
80
Exploration Licences Granted Exploration Licences Renewed
Source: DEDJTR
Graph 2.3 b) Mining licences granted and renewed
2011-12 2012-13 2013-14 2014-15 2015-16 2016-170
5
10
15
20
25
30
Mining Licences Granted Mining Licences Renewed
Source: DEDJTR
Earth Resources Regulation 2016-17 Statistical Report 12 of 26

Graph 2.3 c) Prospecting* and retention licences granted
2011-12 2012-13 2013-14 2014-15 2015-16 2016-170
2
4
6
8
10
12
14
16
18
20
Prospecting Licences Granted Retention Licences Granted
Source: DEDJTR * A prospecting licence cannot be renewed.
The total area covered by exploration licences (current and in application) was 51,984 km2, an increase of 7 per cent compared to 2017.
Table 2.4 Total area covered by exploration licences (current and in application as at 30 June 2016)
Year 2012 2013 2014 2015 2016 2017
Total area (km2) 83,900 77,366 67,833* 54,698* 48,569 51,984
Source: DEDJTR*Figures for 2014 and 2015 have been revised due to calculation errors.
Graph 2.4 a) Total area of Victoria covered by mineral exploration licences
2012 2013 2014 2015 2016 20170
10,000
20,000
30,000
40,000
50,000
60,000
70,000
80,000
90,000
Total area (km2)
Source: DEDJTR
Earth Resources Regulation 2016-17 Statistical Report 13 of 26
3.2 Mineral exploration and mining expenditureAustralian Bureau of Statistics (ABS) data shows an increase of 40.8 per cent ($28.9 M to $40.7M) in Victorian exploration expenditure in 2016/17 compared to 2015/16. Data reported to Earth Resources Regulation on mineral exploration shows that the amount spent on exploration increased from $38.0 million to $43.5 million (14.5 per cent increase). MRSDA data shows that expenditure on mining has increased 10.6 per cent from $685.6 million to $758.3 million.
Table 2.5 Expenditure on mineral exploration and mining development ($A million) 2011-12 2012-13 2013-14 2014-15 2015-16 2016-17
Mineral Exploration (ABS)1
58.5 38.6 32.6 22.9 28.9 40.7
MRSDA Exploration2 37.8 39.7 30.5 47.5^ 38.0 43.5
MRSDA Mining3 813.8 701.2 650.3 607.8^ 685.6 758.3
Source: Figures collated from activity reports forwarded to DEDJTR required under the MRSDA, and ABS, Actual and Expected Private Mineral Exploration (Catalogue No. 8412.0)^ Data corrected as at 15/06/2018
By sector, exploration in gold mining and mineral sands accounted for over two-thirds of all exploration expenditure.
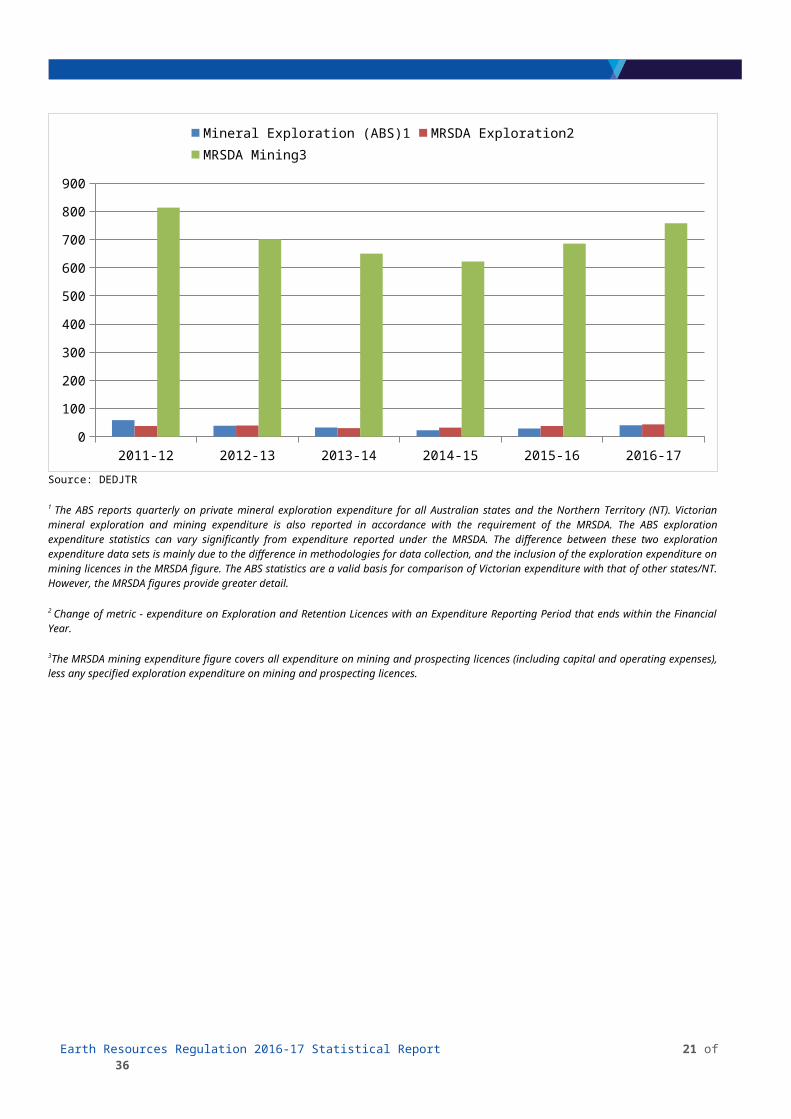
Graph 2.5 a) Expenditure on mineral exploration and mining
2011-12 2012-13 2013-14 2014-15 2015-16 2016-170
100
200
300
400
500
600
700
800
900
Mineral Exploration (ABS)1 MRSDA Exploration2 MRSDA Mining3
Source: DEDJTR
1 The ABS reports quarterly on private mineral exploration expenditure for all Australian states and the Northern Territory (NT). Victorian mineral exploration and mining expenditure is also reported in accordance with the requirement of the MRSDA. The ABS exploration expenditure statistics can vary significantly from expenditure reported under the MRSDA. The difference between these two exploration expenditure data sets is mainly due to the difference in methodologies for data collection, and the inclusion of the exploration expenditure on mining licences in the MRSDA figure. The ABS statistics are a valid basis for comparison of Victorian expenditure with that of other states/NT. However, the MRSDA figures provide greater detail.
2 Change of metric - expenditure on Exploration and Retention Licences with an Expenditure Reporting Period that ends within the Financial Year.
3The MRSDA mining expenditure figure covers all expenditure on mining and prospecting licences (including capital and operating expenses), less any specified exploration expenditure on mining and prospecting licences.
Earth Resources Regulation 2016-17 Statistical Report 14 of 26
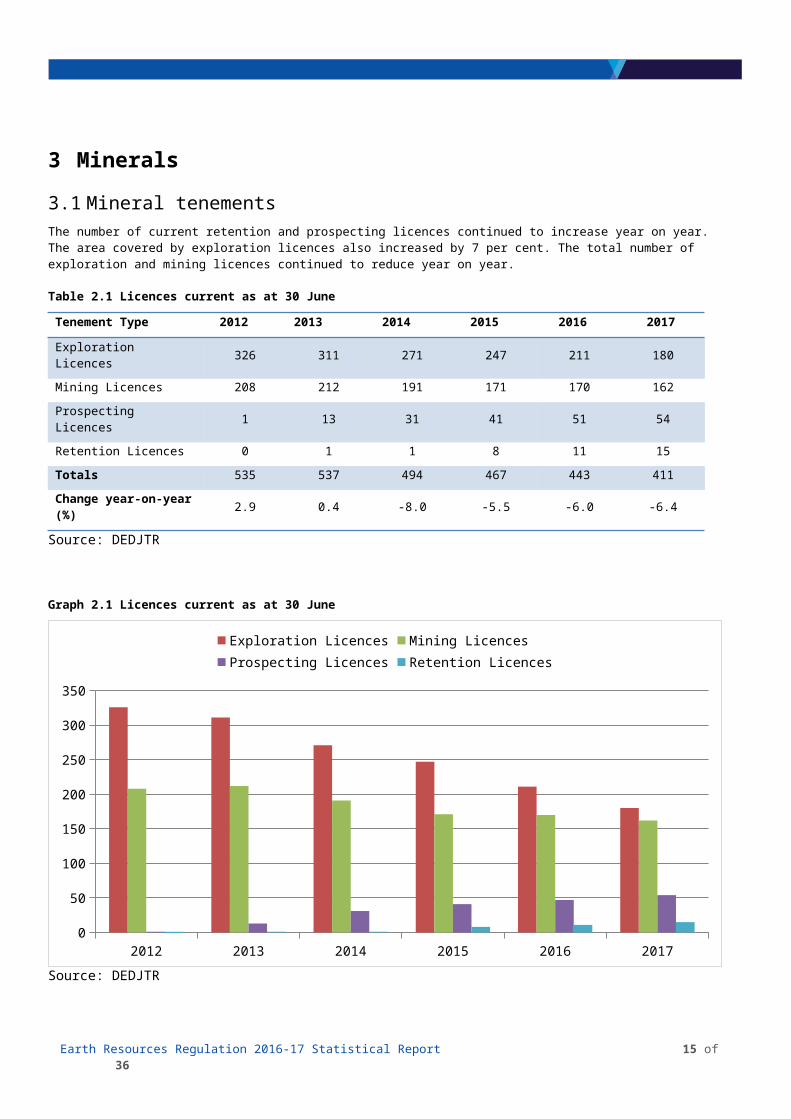
Table 2.6 Expenditure on mineral exploration and mining by commodity* Sector Exploration
($A million)As % of total Mining
($A million)As % of total
Coal 0.46 2.4% 431.21 55.1%
Gold 8.29 42.4% 275.99 36.6%
Mineral Sands 4.76 24.4% 15.55 2.0%
Other** 6.03 30.8% 48.99 6.3%
Total 19.55 100% 771.74 100%
Source: DEDJTR
*Notes: Expenditures are allocated to commodity according to the primary nominated mineral commodity on the licence.
** “Other” includes cases where there is more than one primary mineral.
Graph 2.6 Mineral exploration and mining expenditure by commodity (MRSDA) 2016-17
Coal Gold Mineral Sands Other **0
50
100
150
200
250
300
350
400
450
500
Exploration (A$ million) Mining (A$ million)
Source: DEDJTR
Earth Resources Regulation 2016-17 Statistical Report 15 of 26
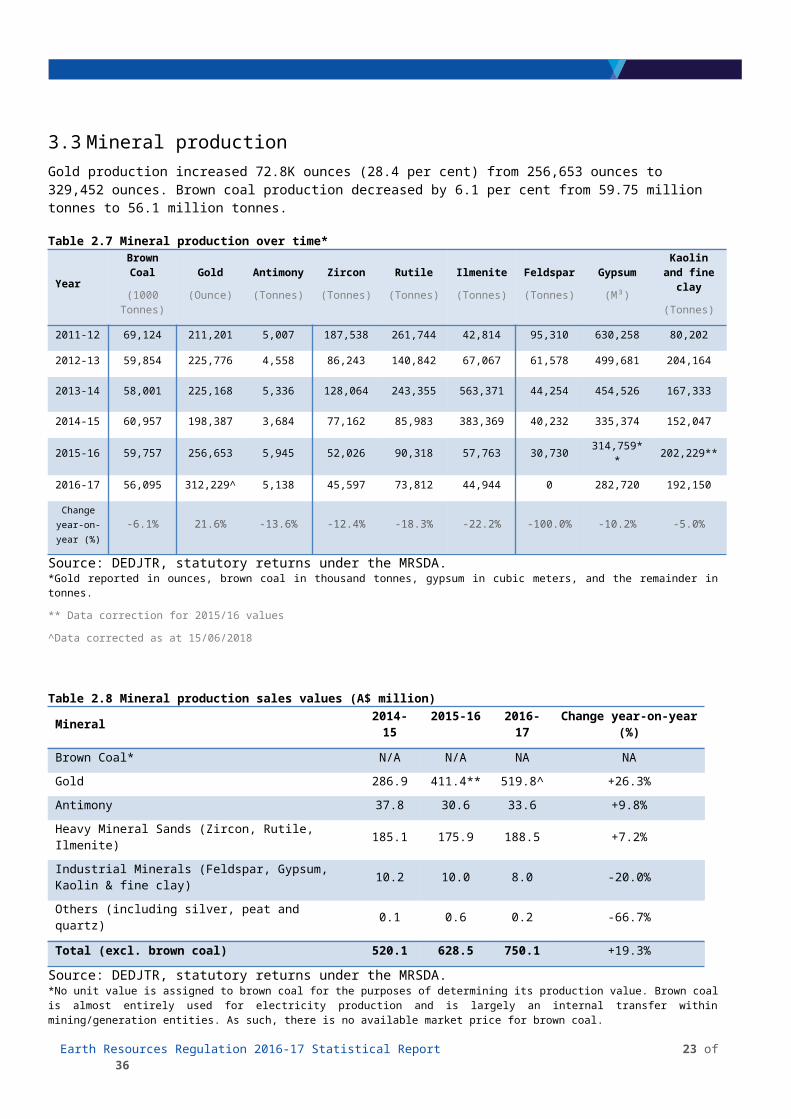
3.3 Mineral productionGold production increased 72.8K ounces (28.4 per cent) from 256,653 ounces to 329,452 ounces. Brown coal production decreased by 6.1 per cent from 59.75 million tonnes to 56.1 million tonnes.
Table 2.7 Mineral production over time*
Year
Brown Coal
(1000 Tonnes)
Gold
(Ounce)
Antimony
(Tonnes)
Zircon
(Tonnes)
Rutile
(Tonnes)
Ilmenite
(Tonnes)
Feldspar
(Tonnes)
Gypsum
(M³)
Kaolin and fine clay
(Tonnes)
2011-12 69,124 211,201 5,007 187,538 261,744 42,814 95,310 630,258 80,202
2012-13 59,854 225,776 4,558 86,243 140,842 67,067 61,578 499,681 204,164
2013-14 58,001 225,168 5,336 128,064 243,355 563,371 44,254 454,526 167,333
2014-15 60,957 198,387 3,684 77,162 85,983 383,369 40,232 335,374 152,047
2015-16 59,757 256,653 5,945 52,026 90,318 57,763 30,730 314,759** 202,229**
2016-17 56,095 312,229^ 5,138 45,597 73,812 44,944 0 282,720 192,150
Changeyear-on-year (%)
-6.1% 21.6% -13.6% -12.4% -18.3% -22.2% -100.0% -10.2% -5.0%
Source: DEDJTR, statutory returns under the MRSDA.*Gold reported in ounces, brown coal in thousand tonnes, gypsum in cubic meters, and the remainder in tonnes.
** Data correction for 2015/16 values
^Data corrected as at 15/06/2018
Table 2.8 Mineral production sales values (A$ million)
Mineral 2014-15 2015-16 2016-17 Change year-on-year (%)
Brown Coal* N/A N/A NA NA
Gold 286.9 411.4** 519.8^ +26.3%
Antimony 37.8 30.6 33.6 +9.8%
Heavy Mineral Sands (Zircon, Rutile, Ilmenite) 185.1 175.9 188.5 +7.2%
Industrial Minerals (Feldspar, Gypsum, Kaolin & fine clay) 10.2 10.0 8.0 -20.0%
Others (including silver, peat and quartz) 0.1 0.6 0.2 -66.7%
Total (excl. brown coal) 520.1 628.5 750.1 +19.3%
Source: DEDJTR, statutory returns under the MRSDA.*No unit value is assigned to brown coal for the purposes of determining its production value. Brown coal is almost entirely used for electricity production and is largely an internal transfer within mining/generation entities. As such, there is no available market price for brown coal.
**The average price of gold for 2015-16 was used multiplied by production amount.
^Data corrected as at 15/06/2018
Earth Resources Regulation 2016-17 Statistical Report 16 of 26
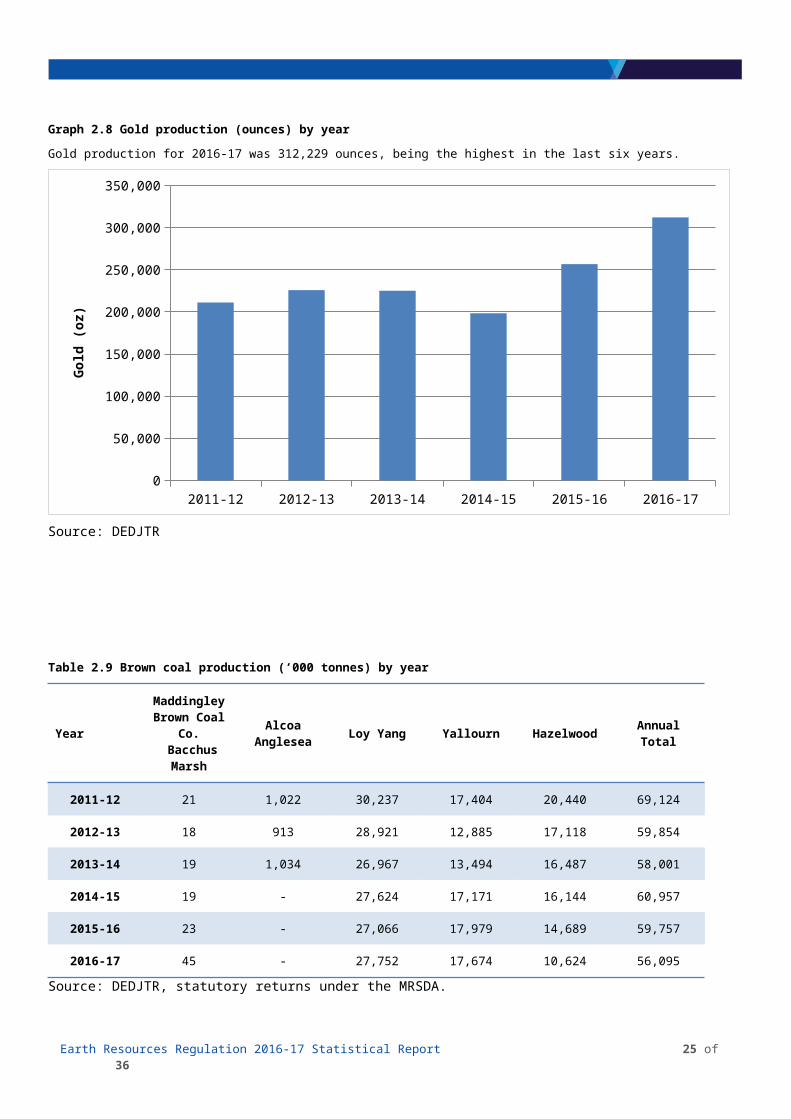
Graph 2.8 Gold production (ounces) by year
Gold production for 2016-17 was 312,229 ounces, being the highest in the last six years.
2011-12 2012-13 2013-14 2014-15 2015-16 2016-170
50,000
100,000
150,000
200,000
250,000
300,000
350,000
Gold
(oz)
Source: DEDJTR
Table 2.9 Brown coal production (‘000 tonnes) by year
Year
Maddingley Brown Coal
Co. Bacchus
Marsh
Alcoa Anglesea Loy Yang Yallourn Hazelwood Annual Total
2011-12 21 1,022 30,237 17,404 20,440 69,124
2012-13 18 913 28,921 12,885 17,118 59,854
2013-14 19 1,034 26,967 13,494 16,487 58,001
2014-15 19 - 27,624 17,171 16,144 60,957
2015-16 23 - 27,066 17,979 14,689 59,757
2016-17 45 - 27,752 17,674 10,624 56,095
Source: DEDJTR, statutory returns under the MRSDA.
Earth Resources Regulation 2016-17 Statistical Report 17 of 26
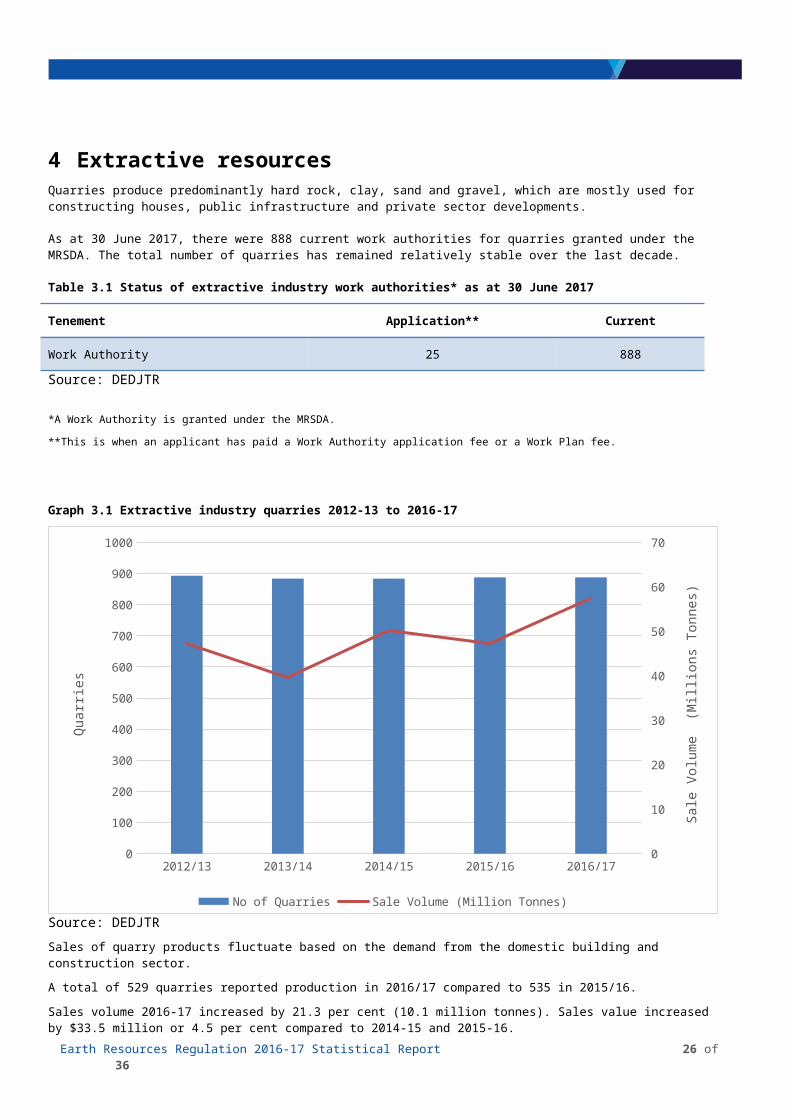
4 Extractive resourcesQuarries produce predominantly hard rock, clay, sand and gravel, which are mostly used for constructing houses, public infrastructure and private sector developments.
As at 30 June 2017, there were 888 current work authorities for quarries granted under the MRSDA. The total number of quarries has remained relatively stable over the last decade.
Table 3.1 Status of extractive industry work authorities* as at 30 June 2017
Tenement Application** Current
Work Authority 25 888
Source: DEDJTR
*A Work Authority is granted under the MRSDA.
**This is when an applicant has paid a Work Authority application fee or a Work Plan fee.
Graph 3.1 Extractive industry quarries 2012-13 to 2016-17
2012/13 2013/14 2014/15 2015/16 2016/170
100
200
300
400
500
600
700
800
900
1000
0
10
20
30
40
50
60
70
No of Quarries Sale Volume (Million Tonnes)
Qua
rrie
s
Sale
Vol
ume
(Mill
ions
Ton
nes)
Source: DEDJTR
Sales of quarry products fluctuate based on the demand from the domestic building and construction sector.
A total of 529 quarries reported production in 2016/17 compared to 535 in 2015/16.
Sales volume 2016-17 increased by 21.3 per cent (10.1 million tonnes). Sales value increased by $33.5 million or 4.5 per cent compared to 2014-15 and 2015-16.
Earth Resources Regulation 2016-17 Statistical Report 18 of 26
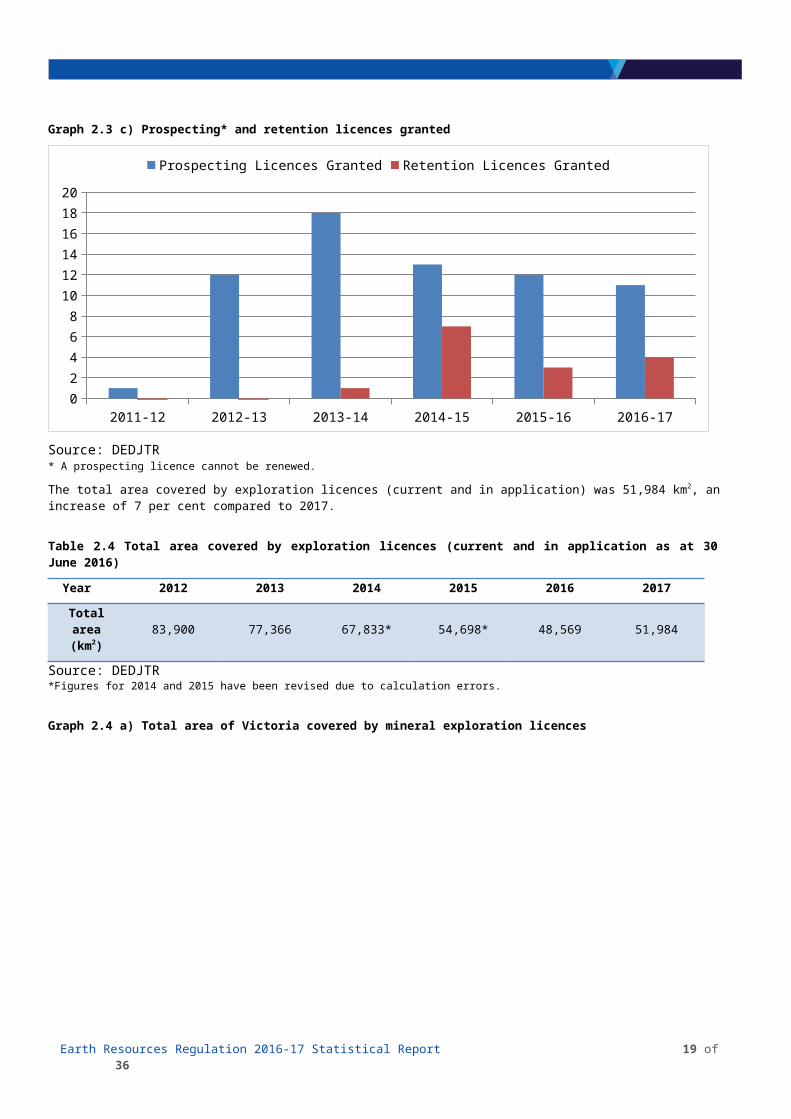
Table 3.2 Victorian Extractive industry sale by Product Type 2016-17
Product Group Product Type Sales Volume(Million Tonnes)
Sales Value($Am)
Single Size ProductsAggregate 20.65 383.47Armour 0.10 1.64
Single Size Products Total 20.76 385.12
Multi Size ProductsFill 3.33 29.95Road Base 6.37 84.66Road Sub-Base 10.39 125.57
Multi Size Products Total 20.08 240.17
Clay ProductsBrick 0.78 2.17Stoneware Pottery 0.00 0.03Tile/Pipe 0.03 0.08
Clay Products Total 0.81 2.28
Limestone ProductsAgriculture 0.52 14.14Cement 0.03 0.57Lime 0.15 2.43
Limestone Products Total 0.69 17.15
Sand Products
Concrete Sand 8.94 124.40Fine Sand 1.70 16.95Foundry Sand 0.74 17.22Industrial Filters 0.03 0.31
Sand Products Total 11.41 158.88
MiscellaneousDimension Stone 0.07 1.00Soil 0.03 0.42Unspecified 3.56 44.25
Miscellaneous Total 3.67 45.66Grand Total 57.42 849.27
Source: DEDJTR, statutory returns under the MRSDA.
Earth Resources Regulation 2016-17 Statistical Report 19 of 26
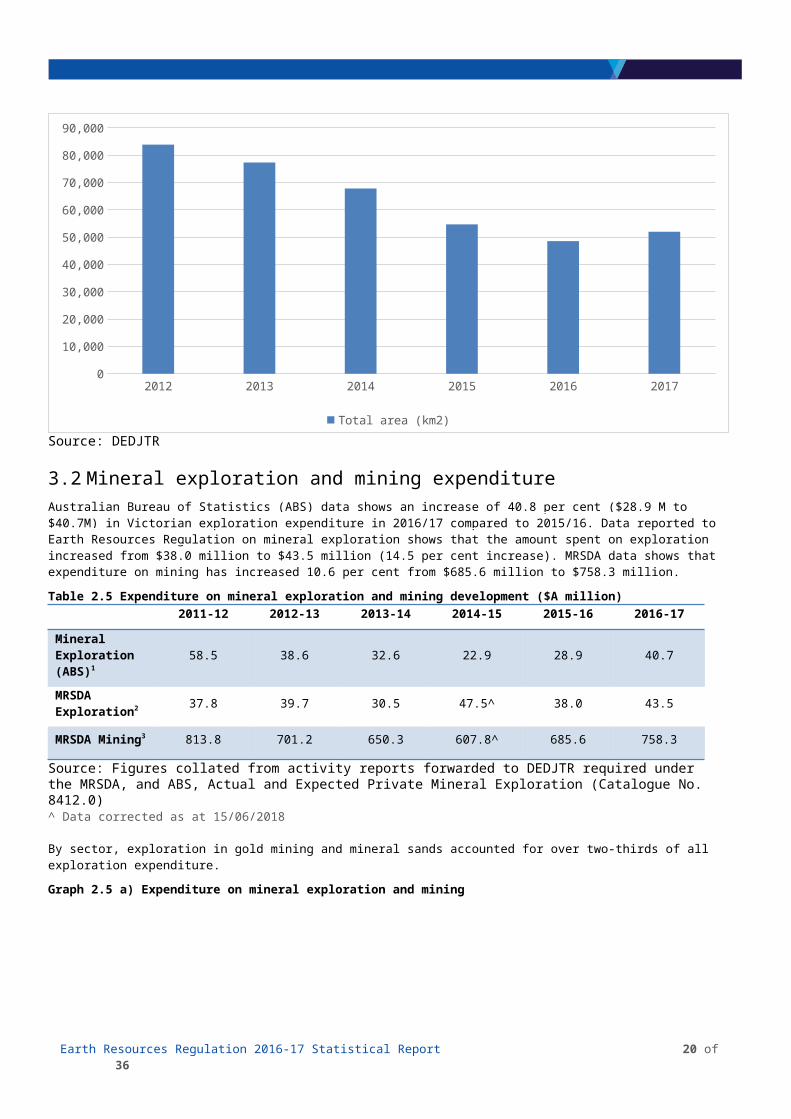
Table 3.3 Victorian extractive industries sales by rock type 2016-17
Rock Type Product Type
Sales Volume Sales Value
(million tonnes) ($Am)
Hard Rock BASALT 20.72 333.97
GNEISS 0.03 0
GRANITE 5.73 101.09
HORNFELS 5 73.1
QUARTZITE 0.05 0.54
RHYODACITE 1.8 38.03
SCHIST 0.21 4.04
SLATE 0.03 0.98
TRACHYTE 0.03 0.54
Hard Rock Total 33.6 552.29
Soft Rock CLAY & CLAY SHALE 1.08 2.62
LIMESTONE 1.78 25.58
SAND & GRAVEL 16.59 216.74
SEDIMENTARY* 2.95 37.09
SCORIA 0.67 11.09
SOIL 0.03 0.42
TUFF 0.72 3.44
Soft Rock Total 23.82 296.98
Other/Aggregates 0 0
GRAND TOTAL 57.42 849.27
Source: DEDJTR, statutory returns under the MRSDA.*Sedimentary (usually rippable rocks including sandstone, shale, siltstone, chert, mudstone, claystone).
Earth Resources Regulation 2016-17 Statistical Report 20 of 26
5 Revenue and bonds
5.1 RevenueIn 2016-17, a total of $87.9 million was collected from industry in royalties and fees under the relevant Acts. This was an increase of 69 per cent ($36 million) compared to $51.9 million collected in 2015-16. This increase was mostly attributable to an adjustment in the royalty rate for brown coal from $0.0776/Gigajoule to $0.2324/Gigajoule, which came into effect on 1 January 2017.
Table 4.1 Mineral, extractive and petroleum revenue 2016-17Revenue Stream Revenue ($A million)
Fees and charges 0.7
Rent 1.4
Royalty 84.4
Mine Stability Levy 1.4
Total 87.9
Source: DEDJTRGraph 4.1 a) Mineral, extractive and petroleum revenue 2016-17
Fees and charges, $0.7M 0.8% Rent, $1.4M
1.6%
Royalty, $84.4M96.0%
Mine Stability Levy, $1.4M1.6%
Source: DEDJTREarth Resources Regulation 2016-17 Statistical Report 21 of 26
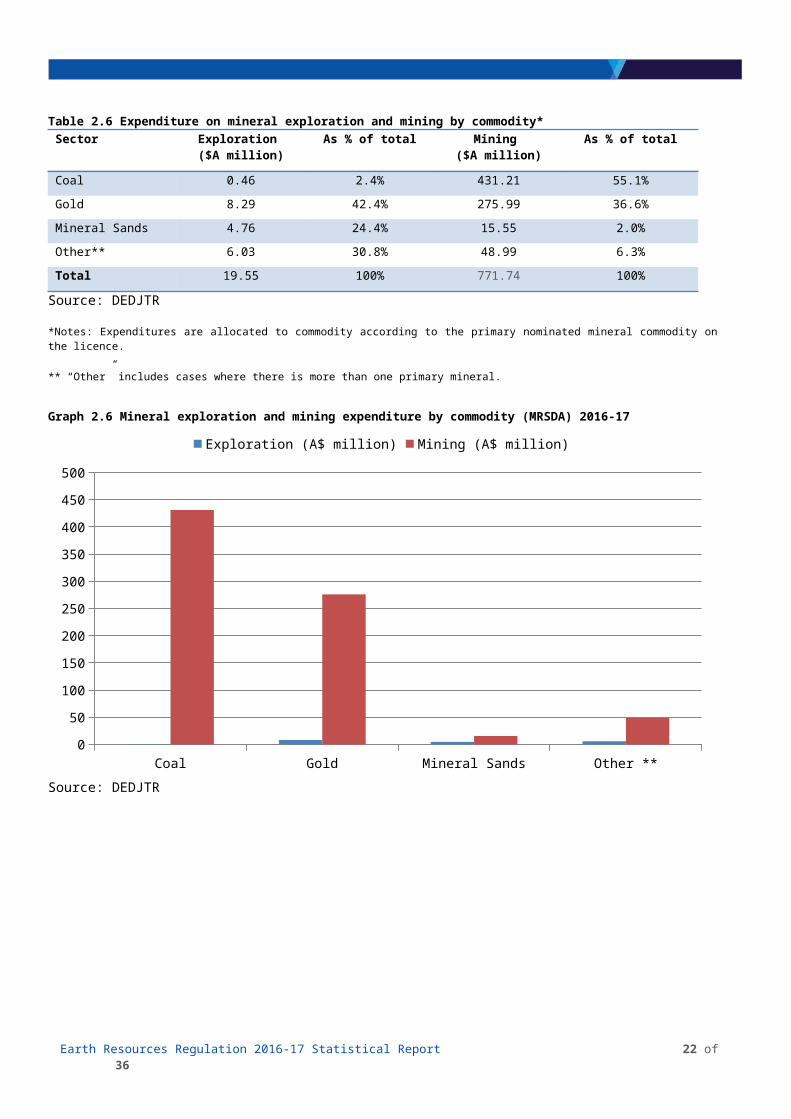
Table 4.2 Minerals, extractive and petroleum royalties 2016-17
Sector Royalties ($A million)
Mining 66.2
Extractive 14.9
Petroleum 3.4
Total 84.5
Source: DEDJTR
Graph 4.2 Mineral, extractive and petroleum royalties 2016-17
Mining $66.2M79.6%
Extractives $14.9M16.6%
Peroleum $3.4M3.8%
Source: DEDJTR
Earth Resources Regulation 2016-17 Statistical Report 22 of 26
5.2 Rehabilitation bondsThe total monetary value of the rehabilitation bonds held by Earth Resources Regulation in 2016-17 was $474.5 million, an increase of 43.5 per cent ($144 million) year on year.
Table 4.3 Value of rehabilitation bonds by authority type ($A million)
Year Exploration Licence
Mining Licence Prospecting Licence
Retention Licence
Extractive Industry Work
Authority
Total
2011-12 2.5 156.9 0 N/A 80.9 240.3
2012-13 2.4 158.3 0.025 N/A 81.0 241.7
2013-14 2.1 183.4 0.091 0.010 90.9 276.5
2014-15 1.9 153.0 0.138 0.050 85.8 241.0
2015-16 2.0 239.6 0.2 0.1 88.6 330.5
2016-17 2.0 380.5 0.2 0.1 91.7 474.5
Source: DEDJTR
Graph 4.3 a) Value of rehabilitation bonds by authority type ($A million) 2011-12 to 2016-17
2011-12 2012-13 2013-14 2014-15 2015-16 2016-170
50
100
150
200
250
300
350
400
Exploration Licence Mining Licence Prospecting LicenceRetention Licence Extractive Industry Work Authority
Source: DEDJTR
Earth Resources Regulation 2016-17 Statistical Report 23 of 26

Table 4.4 Rehabilitation bond reviews over time
Year Number of Bonds Reviewed
Result of Review -
Increase
Result of Review
No Change
Result of Review -
Decrease or Release
2011-12
216 19 193 4
2012-13
258 37 220 1
2013-14
214 66 139 9
2014-15
106 54 10 42
2015-16
100 48 6 46
2016-17
91 46 12 33
Source: DEDJTR
Graph 4.4 Outcome of bond reviews over time
2011-12 2012-13 2013-14 2014-15 2015-16 2016-170
50
100
150
200
250
300
Increase No Change Decrease or Release
Earth Resources Regulation 2016-17 Statistical Report 24 of 26
6 Monitoring, compliance and enforcementEarth Resources Regulation undertakes a compliance program to ensure that authority holders comply with their obligations. Monitoring, compliance and enforcement activities under the MRSDA are summarised in the table below.
Activities 2014-15 2015-16 2016-17
Audit 155 186 170Environmental Review Commit-tees 35 76 96
Inspections 380 366 357
Meetings 49 199 106
Site Closures 28 32 25
Site Visits 51 80 86
Total 698 939 840
Graph 5.1 Monitoring, compliance and enforcement activities 2016-17
Audit ERC Inspection Meeting Site Closure Site Visit0
50
100
150
200
250
300
350
400
2014-15 2015-16 2016-17
Source: DEDJTR
Earth Resources Regulation 2016-17 Statistical Report 25 of 26
Department of Economic Development, Jobs, Transport and Resources
1 Spring Street Melbourne Victoria 3000
Telephone 1300 366 356
© Copyright State of Victoria, Department of Economic Development, Jobs, Transport and Resources 2018
Except for any logos, emblems, trademarks, artwork and photography, this document is made available under the terms of the Creative Commons Attribution 3.0 Australia licence.
This document is also available in an accessible format at http://earthresources.efirst.com.au/categories.asp?cID=46
Earth Resources Regulation 2016-17 Statistical Report 26 of 26


