http://efc.sog.unc.edu @EFCatUNC Introduction to Public Enterprise Finance Jeff Hughes Director, Environmental Finance Center School of Government University of North Carolina at Chapel Hill 919 843-4956 [email protected]www.efc.sog.unc.edu
Transcript
http://efc.sog.unc.edu @EFCatUNC
Introduction to Public Enterprise Finance Jeff Hughes Director, Environmental Finance Center School of Government University of North Carolina at Chapel Hill 919 843-4956 [email protected] www.efc.sog.unc.edu
http://efc.sog.unc.edu @EFCatUNC
Session Objectives
Understand some of the public enterprise financial resources available at the School of Government
Peak your interest in public enterprise financial management by covering some of the basics…
http://efc.sog.unc.edu @EFCatUNC
Topics
• What is a public enterprise? • Monitoring fiscal health • Rates and charges • Capital funding • Market trends • Questions
http://efc.sog.unc.edu @EFCatUNC
What is a public enterprise?
§ 160A‑311. Public enterprise defined. (1) Electric power generation, transmission, and distribution
systems. (2) Water supply and distribution systems. (3) Wastewater collection, treatment, and disposal systems of all
types, including septic tank systems or other on‑site collection or disposal facilities or systems.
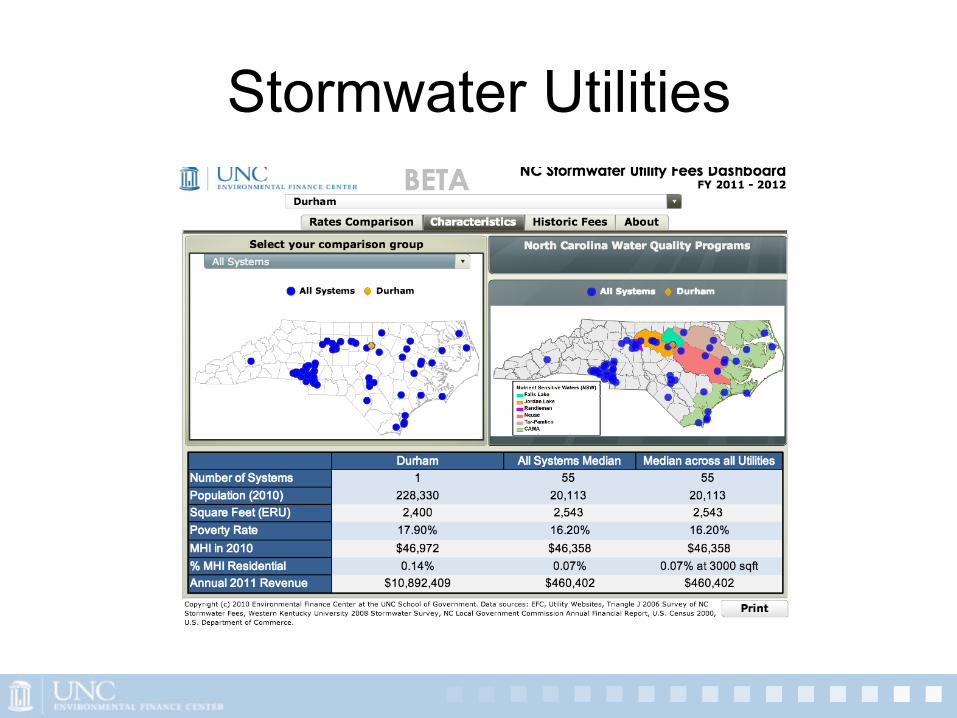
(4) Gas production (5) Public transportation systems. (6) Solid waste collection and disposal systems and facilities. (7) Cable television systems. (8) Off‑street parking facilities and systems. (9) Airports. (10) Stormwater management programs designed to protect water
quality by controlling the level of pollutants in, and the quantity and flow of, stormwater and structural and natural stormwater and drainage systems of all types.
What is a public enterprise?
• In terms of a financial management philosophy?
• In accounting terms? • From a liability standpoint? • From a budgeting perspective?
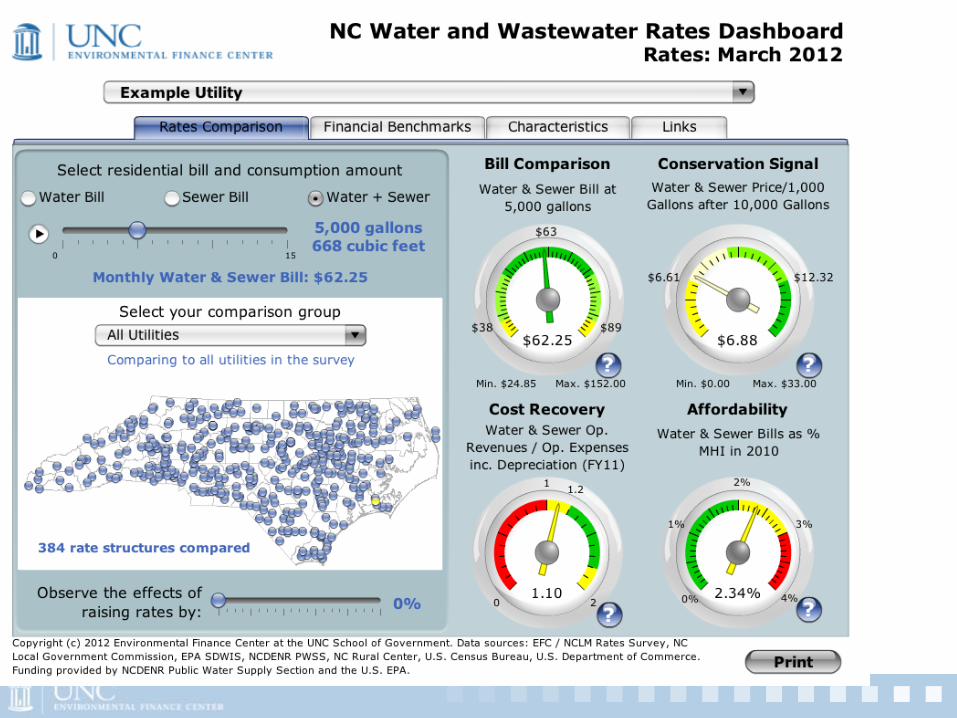
§ 160A‑314. Authority to fix and enforce rates.
(a) A city may establish and revise from time to time schedules of rents, rates, fees, charges, and penalties for the use of or the services furnished by any public enterprise. Schedules of rents, rates, fees, charges, and penalties may vary according to classes of service, and different schedules may be adopted for services provided outside the corporate limits of the city.
$8,105,384,976 in Outstanding W/S Debt (including State) as of
2013
$5,313,125,581 , 65%
$1,595,113,305 , 20%
$737,687,140 , 9%
$401,873,304 , 5%
$57,585,646 , 1%
Revenue
General Obligation
Drinking Water/Clean Water SRF Installment Purchase or Special Indebtedness Miscellaneous
Data analyzed by the University of North Carolina Environmental Finance Center. Data Source: North Carolina Department of State Treasurer State and Local Government Finance Division
State and Federal Water and Sewer Funding
• US Environmental Protection Agency/NC Department of Environment and Natural Resources State Revolving Loan Funds (SRF) – State Water Infrastructure Authority (SWIA)
• Now includes HUD CDBG Infrastructure Programs
• US Department of Agriculture Rural Development Water and Waste Grant and Loan Program
• HUD CDBG Infrastructure ** – State Water Infrastructure Authority (SWIA)
• NC Rural Center • Clean Water Management Trust Fund (removed water
and sewer funding)
Utility Capital Planning Tools www.efc.sog.unc.edu
A FEW MARKET TRENDS
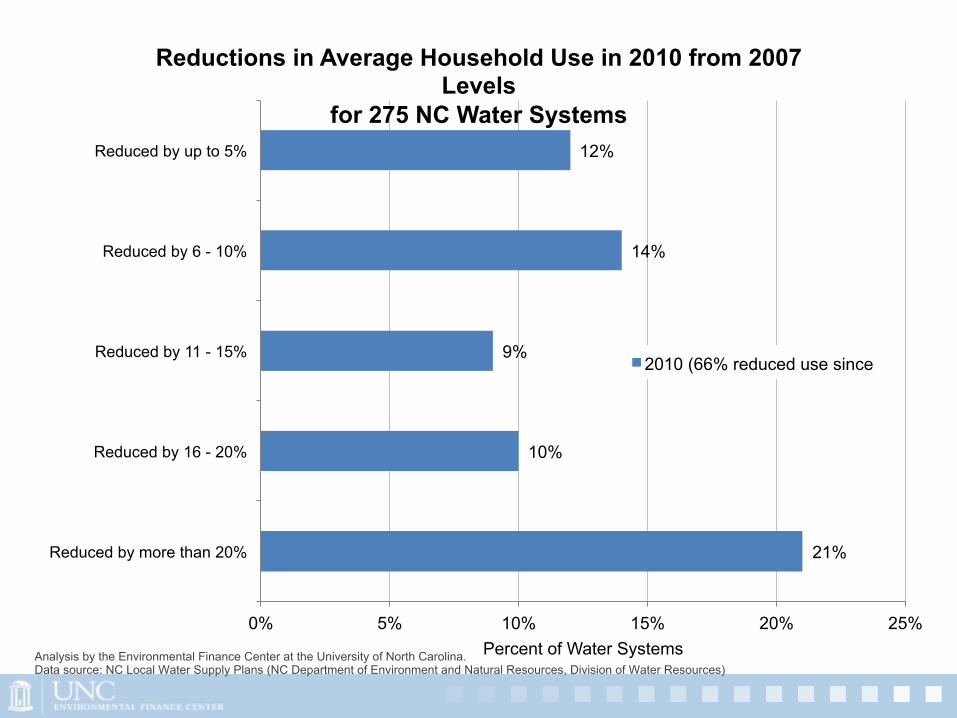
21%
10%
9%
14%
12%
0% 5% 10% 15% 20% 25%
Reduced by more than 20%
Reduced by 16 - 20%
Reduced by 11 - 15%
Reduced by 6 - 10%
Reduced by up to 5%
Percent of Water Systems
Reductions in Average Household Use in 2010 from 2007 Levels
for 275 NC Water Systems
2010 (66% reduced use since
Analysis by the Environmental Finance Center at the University of North Carolina. Data source: NC Local Water Supply Plans (NC Department of Environment and Natural Resources, Division of Water Resources)
Partnerships and Consolidations
-75%
-25%
25%
75%
0% 50% 100%
Cha
nge
in th
e To
tal O
pera
ting
Rev
enue
Change in the Total Monthly Bill for 5,000 Gallons
Changes in Rates and Operating Revenues Among NC Utilities
From 2007 to 2011 across 299 NC utilities
Data analyzed by the Environmental Finance Center at the University of North Carolina, Chapel Hill. Data sources: NCLM/EFC annual water and sewer rate surveys, NC Local Goverment Commission data from audited financial statements of water/sewer utilities
http://efc.sog.unc.edu @EFCatUNC www.efc.unc.edu
Jeff Hughes Director, Environmental Finance Center School of Government University of North Carolina at Chapel Hill 919 843-4956 [email protected] www.efc.sog.unc.edu