22
Introduction to the analysis of community data Vojtech Novotny Czech Academy of Science, University of South Bohemia & New Guinea Binatang Research Center
| Date post: | 15-Dec-2015 |
| Category: |
Documents |
| Upload: | noah-colling |
| View: | 214 times |
| Download: | 0 times |

Introduction to the analysis of community data
Vojtech NovotnyCzech Academy of Science, University of South Bohemia & New Guinea Binatang Research Center

Ecological analysis of community samples
typical data format:
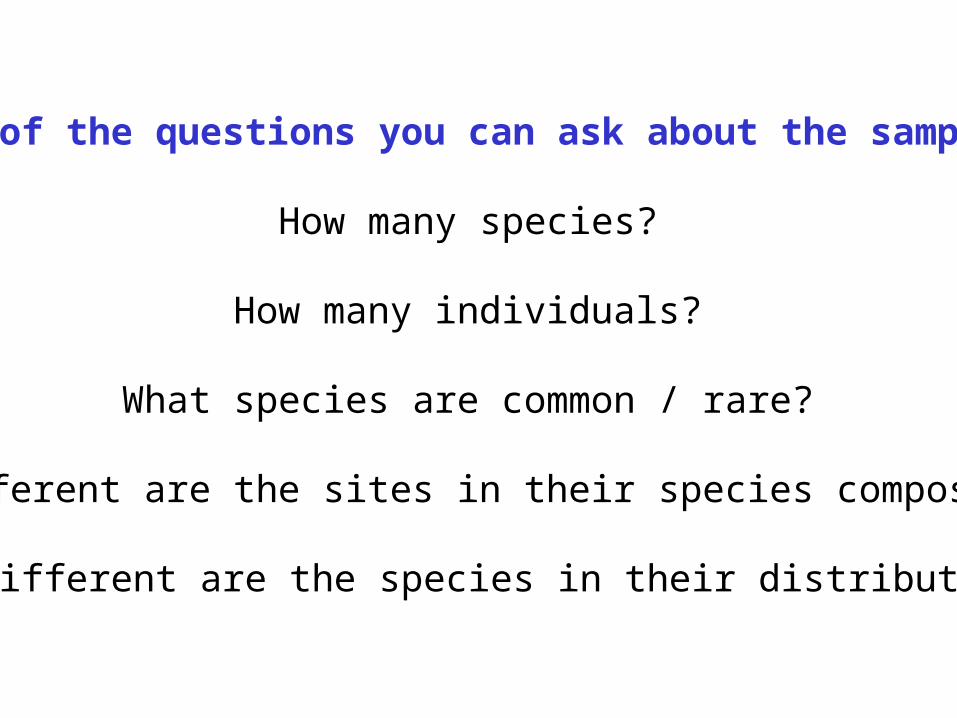
Some of the questions you can ask about the samples:
How many species?
How many individuals?
What species are common / rare?
How different are the sites in their species composition?
How different are the species in their distribution?
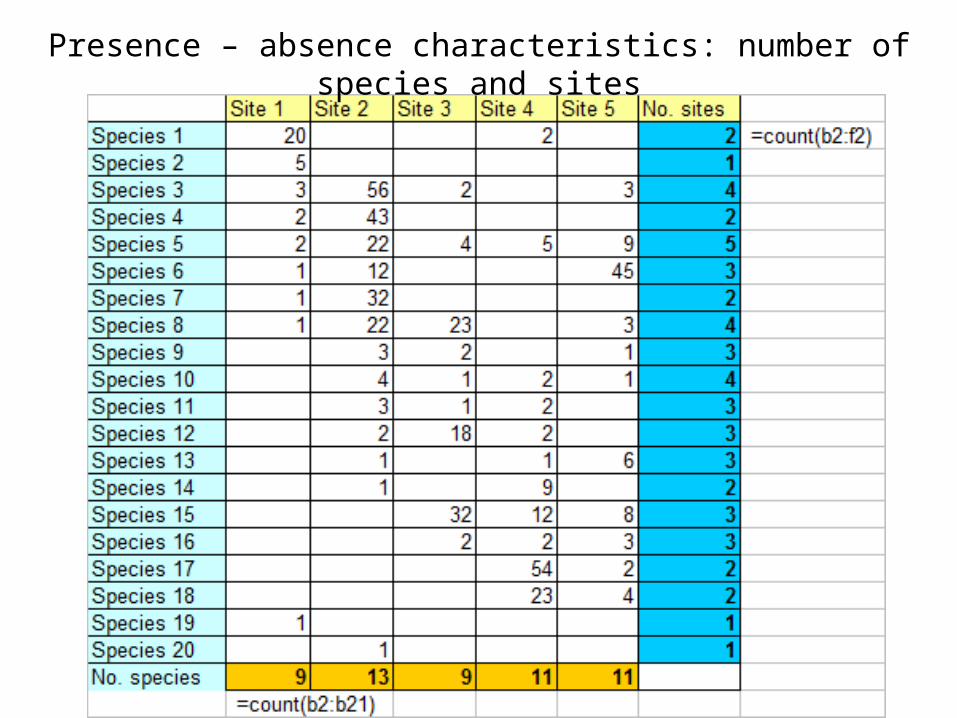
Presence – absence characteristics: number of species and sites
5
7
9
11
13
15
17
19
21
1 2 3 4 5
No. of sites
No
. o
f sp
ecie
s .
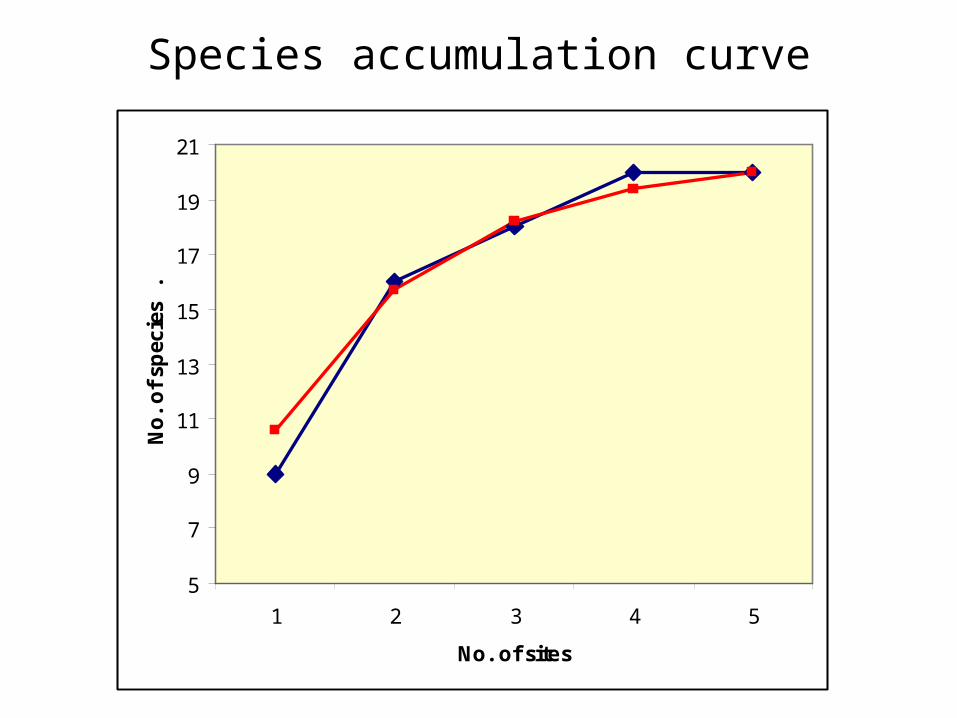
Site accummulation 1-2-3-4-5 Randomised sites
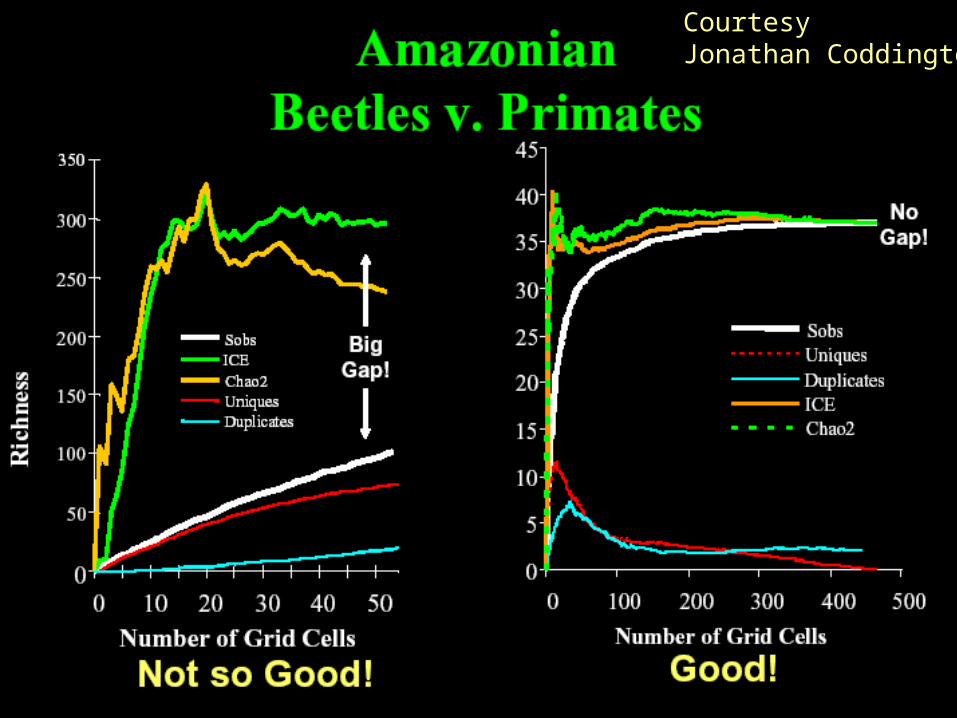
Species accumulation curve
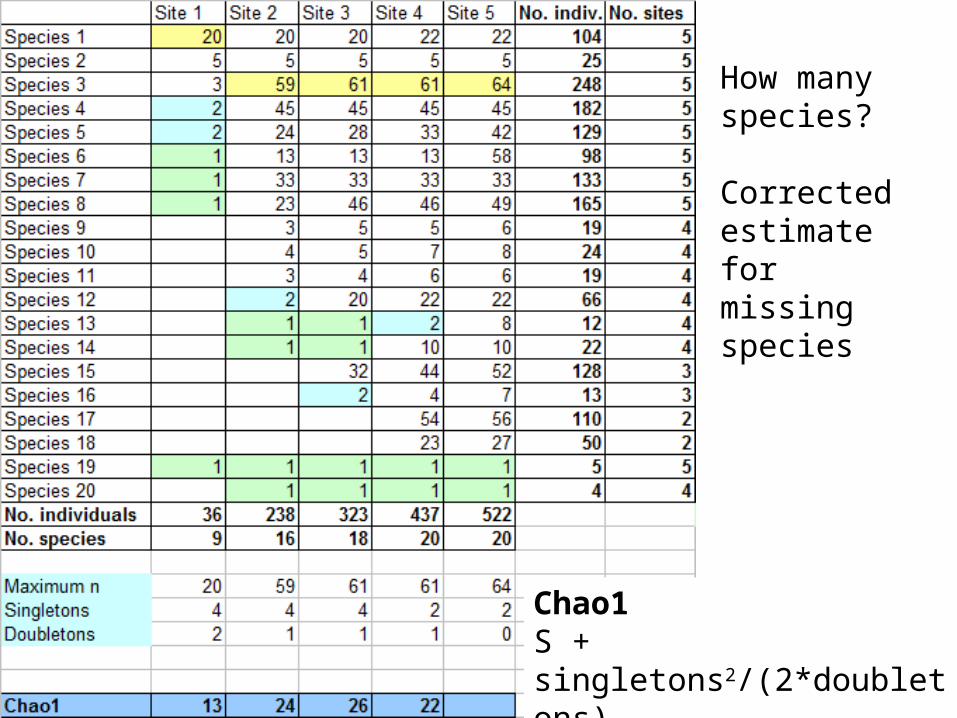
How many species?
Corrected estimate for missing species
Chao1 S + singletons2/(2*doubletons) S – number of species sampled
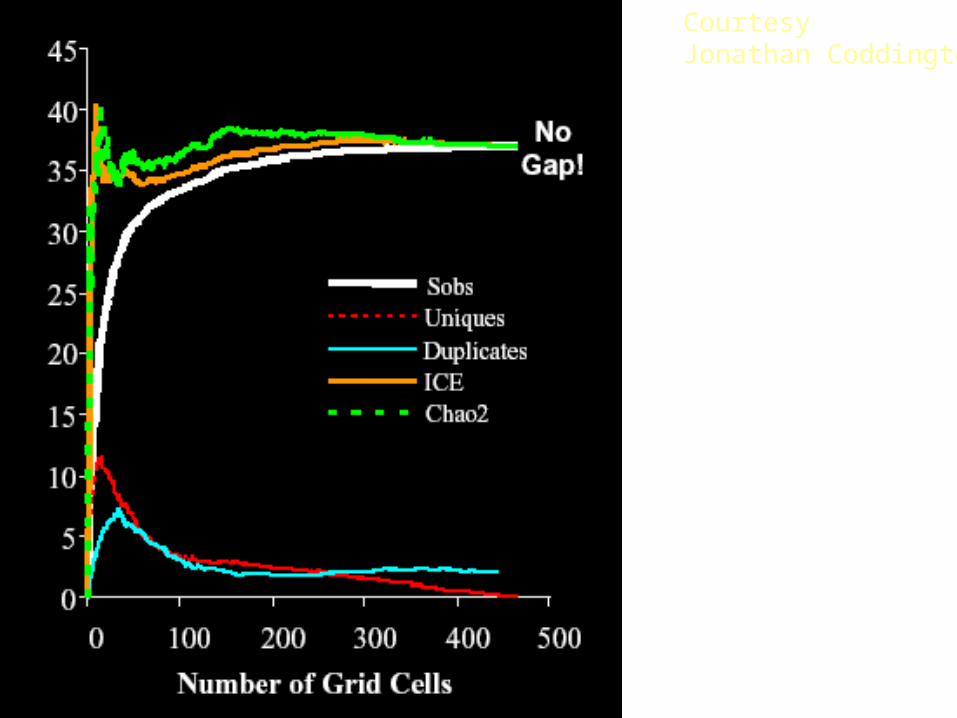
Courtesy Jonathan Coddington
..
Courtesy Jonathan Coddington
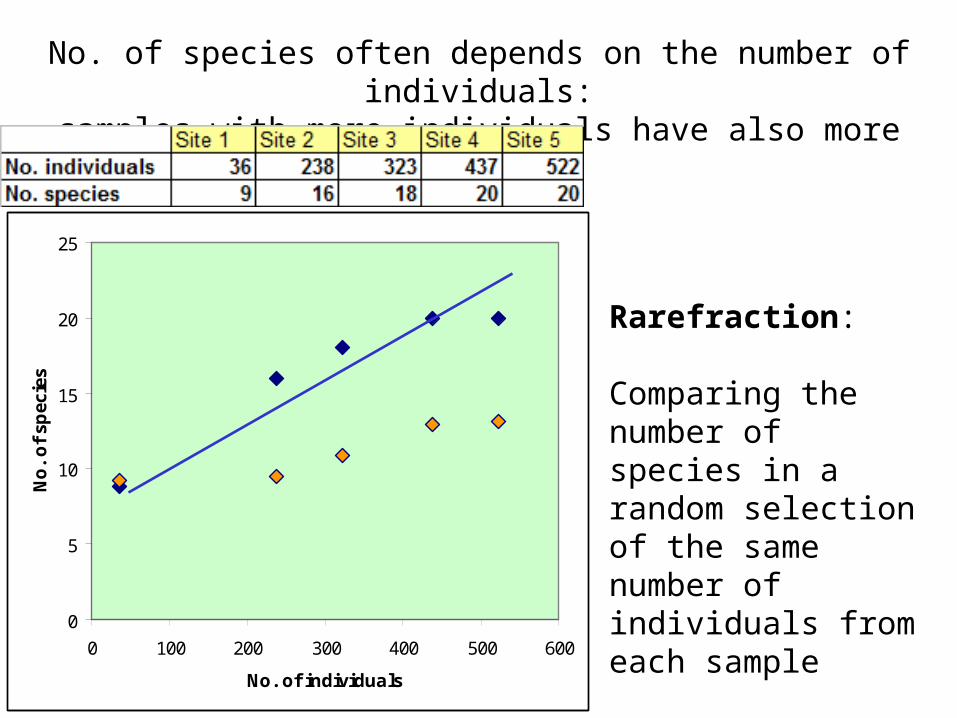
No. of species often depends on the number of individuals:samples with more individuals have also more species
0
5
10
15
20
25
0 100 200 300 400 500 600
No. of individuals
No
. o
f sp
ecie
s
observedrarefraction 36 ind.
Rarefraction:
Comparing the number of species in a random selection of the same number of individuals from each sample

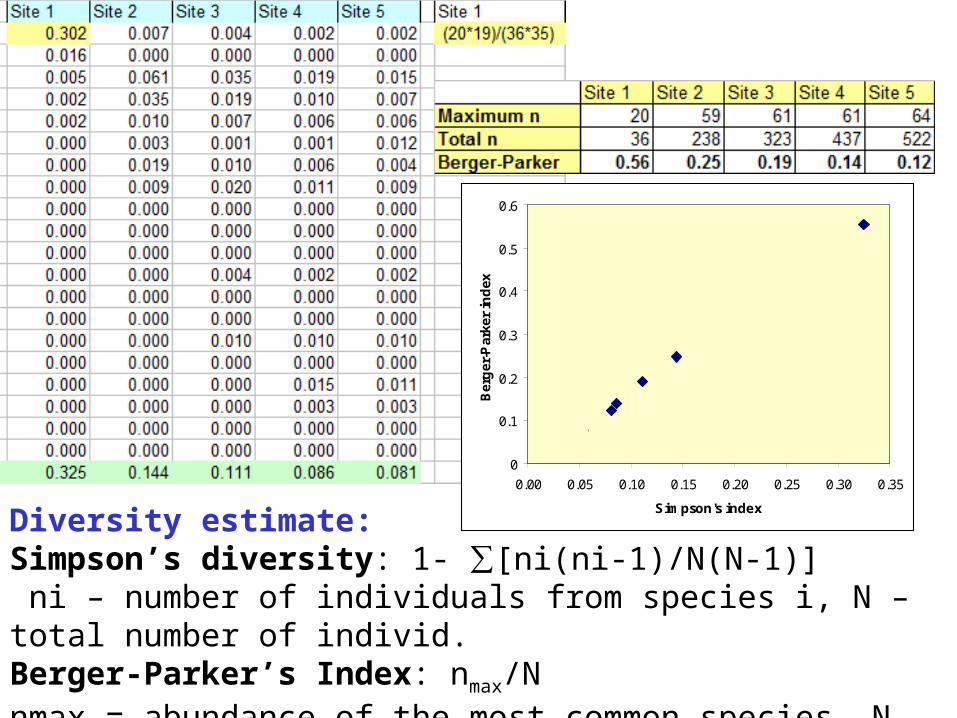
Diversity measures: describing distribution of individuals among species
Simpson’s index: the probability that two individuals chosen from your sample will belong to the same speciesBerger-Parker’s index: share of the most common species
0
0.1
0.2
0.3
0.4
0.5
0.6
0.00 0.05 0.10 0.15 0.20 0.25 0.30 0.35
Simpson's index
Ber
ger
-Par
ker
ind
ex
Site 1
Site 5
Diversity estimate:Simpson’s diversity: 1- ∑[ni(ni-1)/N(N-1)] ni – number of individuals from species i, N – total number of individ.Berger-Parker’s Index: nmax/Nnmax = abundance of the most common species, N – total no. of individ.
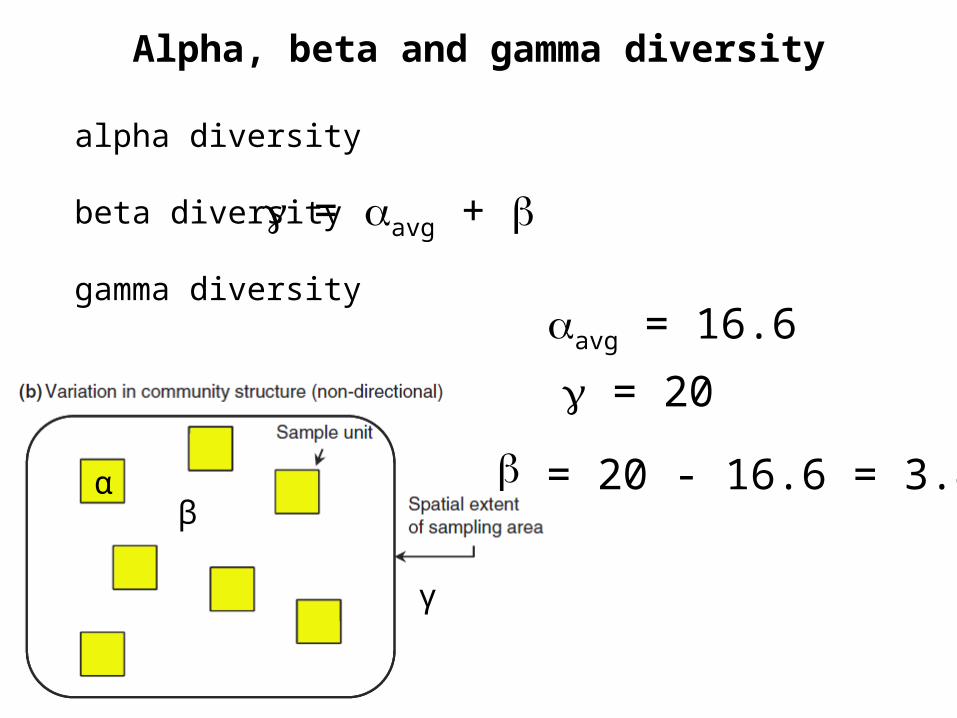
alpha diversity
beta diversity
gamma diversity
αβ
γ
= avg +
= 20
avg = 16.6
= 20 - 16.6 = 3.4
Alpha, beta and gamma diversity
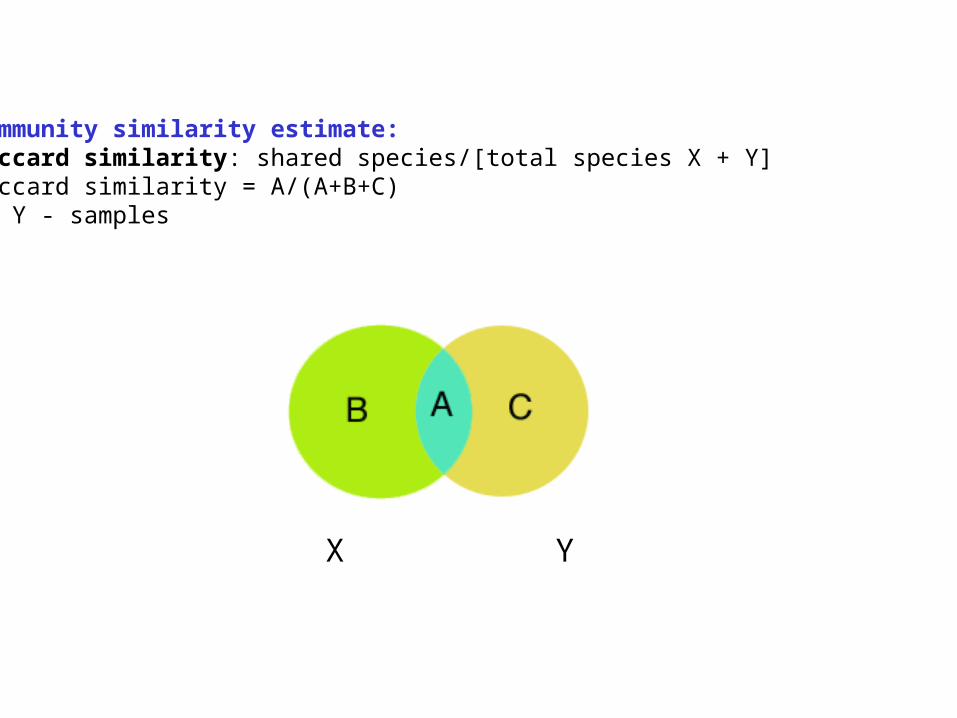
Community similarity estimate:Jaccard similarity: shared species/[total species X + Y]Jaccard similarity = A/(A+B+C)X, Y - samples
X Y
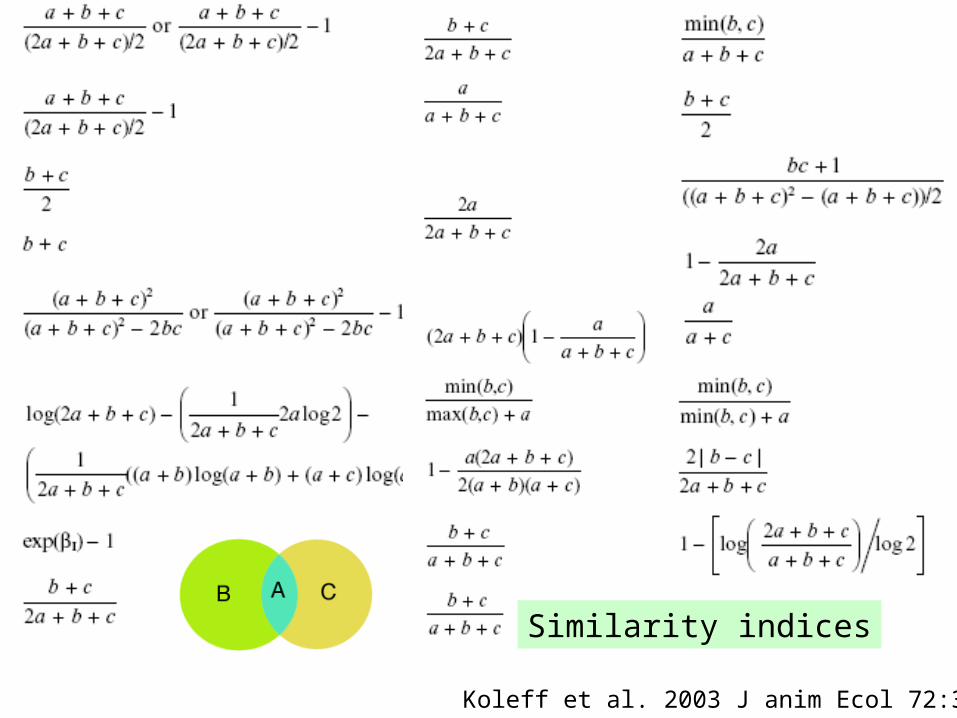
Koleff et al. 2003 J anim Ecol 72:367
Similarity indices

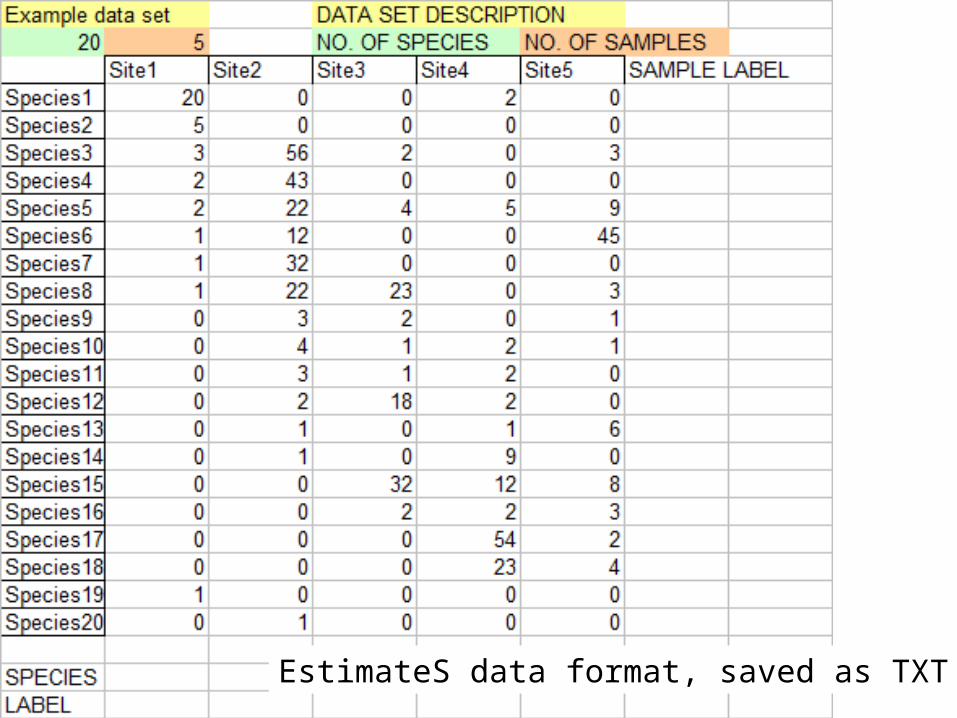
EstimateS data format, saved as TXT file
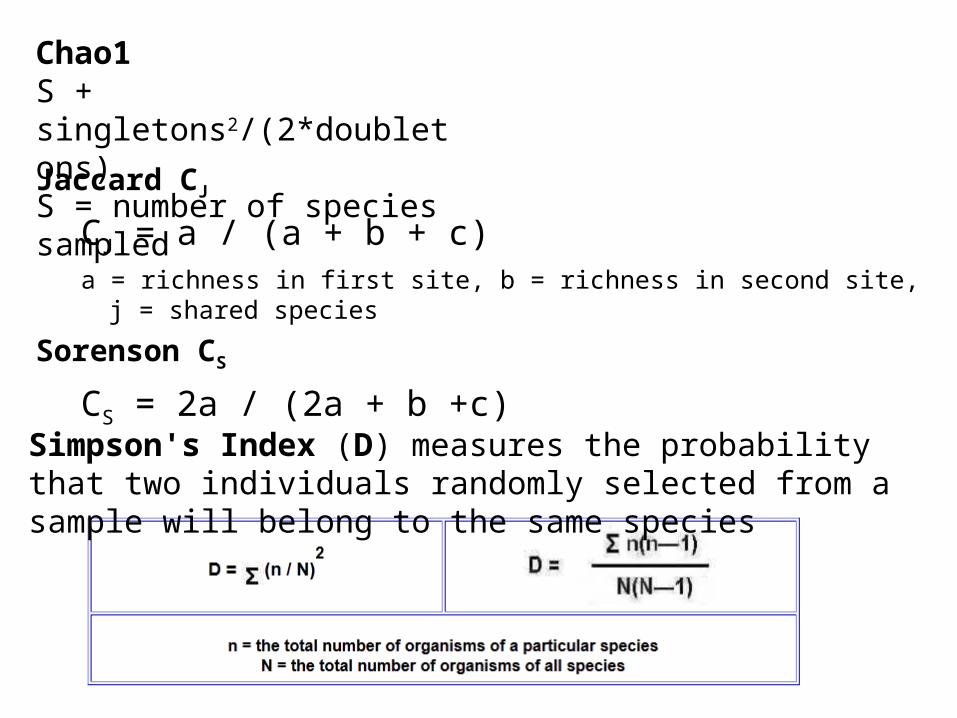
Chao1 S + singletons2/(2*doubletons) S = number of species sampled
Simpson's Index (D) measures the probability that two individuals randomly selected from a sample will belong to the same species
Jaccard CJ
CJ = a / (a + b + c)a = richness in first site, b = richness in second site, j = shared species
Sorenson CS
CS = 2a / (2a + b +c)
SU 2
Present Absent
SU 1Present a b
Absent c d
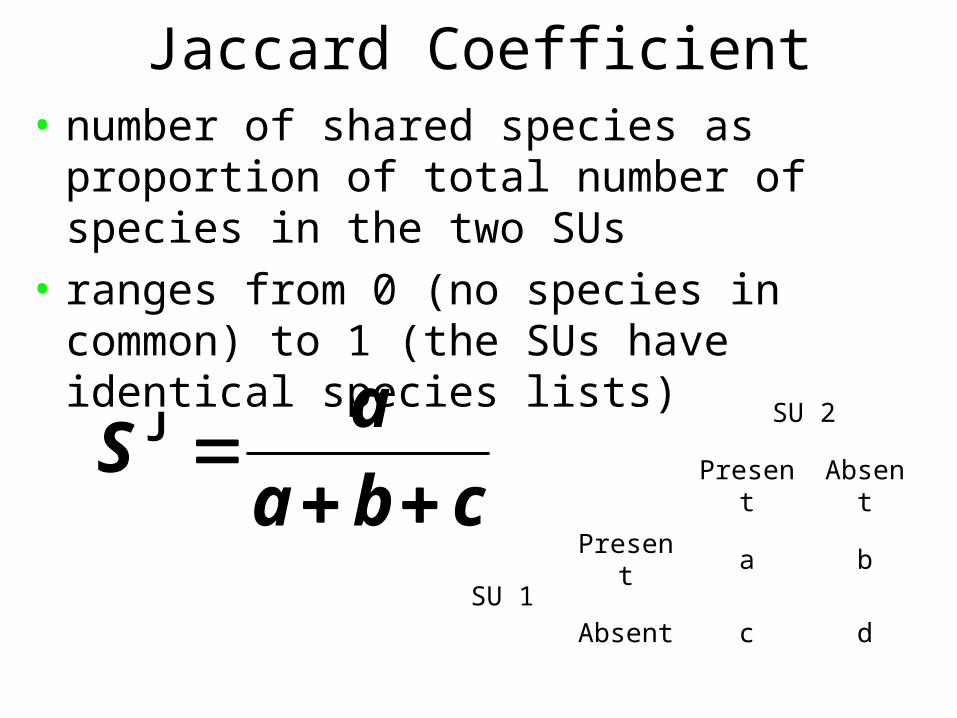
Jaccard Coefficient• number of shared species as
proportion of total number of species in the two SUs
• ranges from 0 (no species in common) to 1 (the SUs have identical species lists)
cba
aS
J

SU 2
Present Absent
SU 1Present a b
Absent c d
cba
aS
2
2BC
Sørenson Coefficient
• like Jaccard, ignores shared absences

Quantitative Version of Sørenson (Bray-Curtis) Similarity
s
iik
s
iij
s
iikij
XX
XX
11
1
,min2kj
jkjk TT
WS
2BC

• Morisita-Horn CmH
– Not influenced by sample size & richness– Highly sensitive to the abundance of common
spp.
– CmH = 2(ani * bni) / (da + db)(aN)(bN)• aN = total # of indiv in site A
• ani = # of individuals in ith species in site A
• da = ani2 / aN2


