12
Introduction to the Event Study Methodology Done by: Wong Shou Woon

Introduction to the Event Study Methodology
Done by:
Wong Shou Woon

Briefly describe the event study methodology and explain why this methodology is widely used in corporate finance research The event study methodology is designed to investigate the effect of an event on a specific dependant variable. A commonly used dependent variable in event studies is the stock price of the company. The definition of such an event study will be ‘a study of the changes in stock price beyond expectation (Abnormal returns) over a period of time (event window). We attribute the abnormal returns to the effects of the event.’ The event study methodology seeks to determine whether there is an abnormal stock price effect associated with an event. From this, the researcher can infer the significance of the event. The key assumption of the event study methodology is that the market must be efficient. Given an efficient market, the effects of the event will be reflected immediately in the stock prices of the company. This will allow us to observe the economic effect of the event over a relatively short period. The procedure of an event study comprises of:
Step 1: We have to first decide on the event that we wish to investigate, and then collect data of companies that had went through such an event. The data that we need includes the announcement date (eg first announcement date of a merger and acquisition event), the stock prices of the company before and after the event (eg -120 to +30 days), and the data on each of the companies so that we can categorise them into different groups (eg high, medium or low management ownership).

Step 2:
We will have to identify any estimation made. For example if we estimate that a sample size of 30 companies is enough for each level of management ownership, we should state that in the research report. Furthermore, we must decide on a period over which the security prices of the firms involved in this event will be examined. This is our event window. A post event period that is too short will not be able to display the full economic effects while a post event period that is too long will not be accurate as it might include effects of other events occurring in the same period. Step 3: Next we will have to make estimations of the important parameters that will give us the expected returns during the event period. For example if we use the market model to find the expected returns, we will need the alpha (y-intercept) and beta (slope) of the prices over a reasonably long estimation window (eg -120 to -31 days). Step 4: Other than the market model, we can use many other models to find expected earnings. Some examples will be the CAPM (Ri = Rf + B(Rm-Rf)), the Arbitrage pricing theory (Ri = BiFi + B2F2 + ..) and the Constant mean model. We can use these models to find the expected returns on each of the event day. After that, we will deduct the expected return from the actual return to get the abnormal return on each day in the event window. Step 5: We then add up the abnormal return over the entire period of time to get the cumulative abnormal return. After performing all the steps above, we can plot a graph of the abnormal return and cumulative abnormal return over the event window to check the effects of the event on return. The event study methodology is widely used in corporate finance because we are interested to know how corporate policies can impact the value of your firm (eg effect of a share buyback on value of company). On the surface, this might be a daunting task. However, using the event study methodology, we will be able to find the economic effect as long as we make sure that we can remove any confounding effects on return due to

other events. To get a representative event study, we will have to choose a reasonably large sample size, categorise the companies into groups that will make a difference in the effects (eg level of ownership), and choose an appropriate event period. The usefulness of such a study in corporate finance comes from the fact that, given rationality in the marketplace, the effects of an event will be reflected immediately in security prices. Thus a measure of the event’s economic impact can be constructed using security prices observed over a relatively short time period. In contrast, direct productivity related measures may require many months or even years of observation. The event findings are very clear and easy to interpret and share. We need not look at any factors such as investor’s sentiment, management considerations etc. We assume that all these are reflected in the stock price and return immediately due to the efficient market hypothesis. Therefore, we only have to look at the effect on one single item, the returns. This allows us to simply present the chart of the abnormal returns (AR) and cumulative abnormal returns (CAR) to the reader and makes event study methodology extremely popular in scenarios whereby the researcher has to present their findings to a large group of people who might not have the ability to understand complicated formulas and financial theories. This is the case in corporate finance research, whereby the research might be done to investigate a very sophisticated effect of an event, but their data have to be easy enough so that even the common investor on the street will be able to understand their publication. Due to all the reasons quote above, researchers often choose to use the event study methodology to examine the direction, magnitude and speed of price reactions to the various phenomenons in corporate finance.
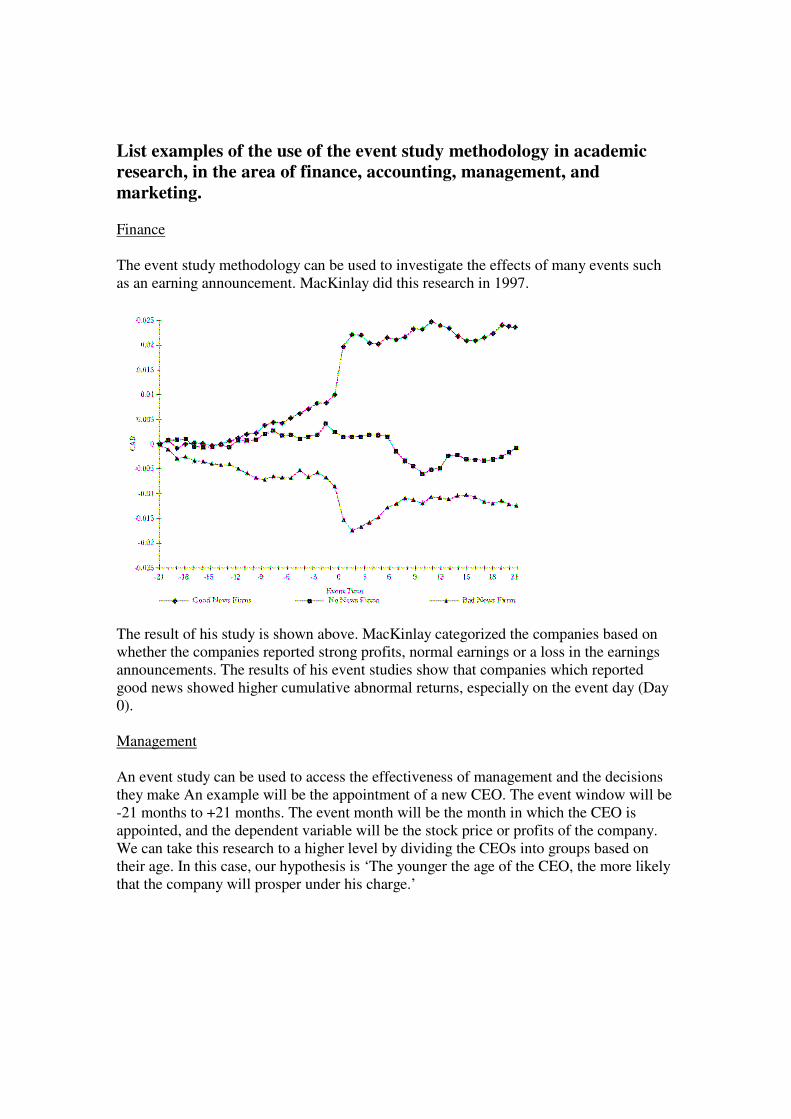
List examples of the use of the event study methodology in academic research, in the area of finance, accounting, management, and marketing. Finance The event study methodology can be used to investigate the effects of many events such as an earning announcement. MacKinlay did this research in 1997.
The result of his study is shown above. MacKinlay categorized the companies based on whether the companies reported strong profits, normal earnings or a loss in the earnings announcements. The results of his event studies show that companies which reported good news showed higher cumulative abnormal returns, especially on the event day (Day 0). Management An event study can be used to access the effectiveness of management and the decisions they make An example will be the appointment of a new CEO. The event window will be -21 months to +21 months. The event month will be the month in which the CEO is appointed, and the dependent variable will be the stock price or profits of the company. We can take this research to a higher level by dividing the CEOs into groups based on their age. In this case, our hypothesis is ‘The younger the age of the CEO, the more likely that the company will prosper under his charge.’

Effects of CEO's age on CAR
-10
-5
0
5
10
15
20
-10 -8 -6 -4 -2 0 2 4 6 8 10
Months
CA
R
40-5050-60>60
The chart above is just an illustration of how the CAR might be over the few months after appointment if our hypothesis is correct. The CAR should increase the most for CEOs who are young as he will be most motivated to perform in order to boost their personal reputation and value. Some actual research in this area include the ‘Changes in Performance Surrounding Top Management Turnover’ done by Denis and Denis (1995). It was found that companies perform more efficiently after a forced management change, with the greatest improvement in performance in the year after the change. This suggests that forced management change is most probably a good sign for the company, as we are replacing an underperforming manager with someone better.
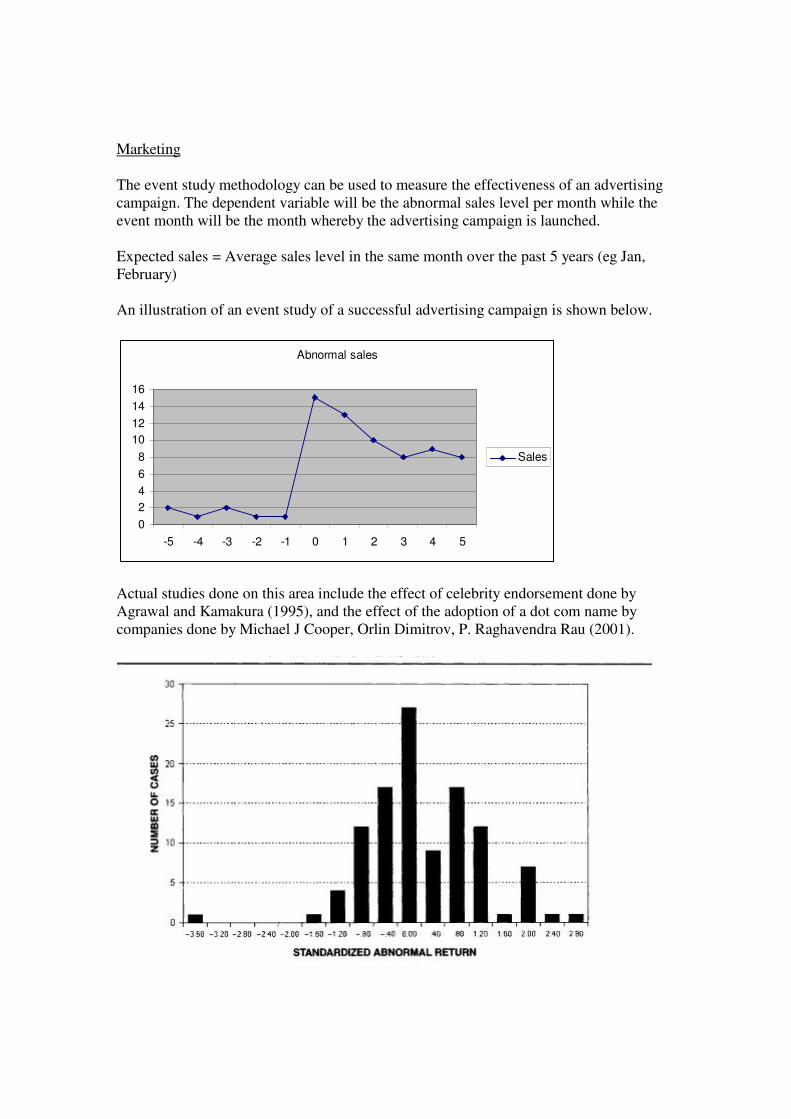
Marketing The event study methodology can be used to measure the effectiveness of an advertising campaign. The dependent variable will be the abnormal sales level per month while the event month will be the month whereby the advertising campaign is launched. Expected sales = Average sales level in the same month over the past 5 years (eg Jan, February) An illustration of an event study of a successful advertising campaign is shown below.
Abnormal sales
02468
10121416
-5 -4 -3 -2 -1 0 1 2 3 4 5
Sales
Actual studies done on this area include the effect of celebrity endorsement done by Agrawal and Kamakura (1995), and the effect of the adoption of a dot com name by companies done by Michael J Cooper, Orlin Dimitrov, P. Raghavendra Rau (2001).

The graph above shows the findings of the research done by Agrawal and Kamakura. It shows that celebrity endorsement often leads to a positive abnormal return, although there are many cases reporting small or zero abnormal returns, and even some cases with negative abnormal returns.
This graph shows the findings of the research done by ������������� ��� ��������� ���������������� ��������������������� ����� ����� ����������������!"� � �#��$��#���� "��
��������#����������������������#�%��������#���� �������!�� ���� ��� �#�� ������ �� �� �&'(��������&���"#�� �����������������"��)���� �����#��� ���������#���� ���#���#���� ������
���������� � ��� �� ����������� Accounting A change in accounting policy can has an impact on the company’s value. For example, when a property company changes its accounting policy from valuating assets at book value to valuating assets at fair value, its value might increase due to the fact that the fair value of its property assets usually appreciate in value over time.
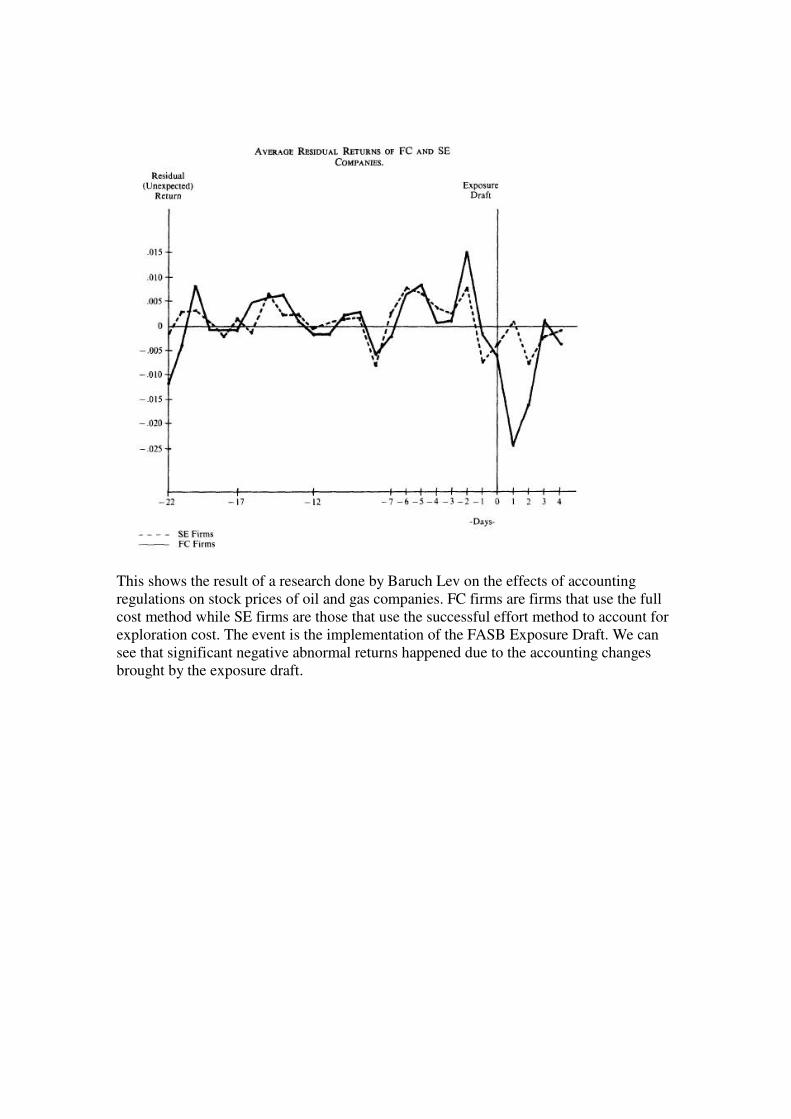
This shows the result of a research done by Baruch Lev on the effects of accounting regulations on stock prices of oil and gas companies. FC firms are firms that use the full cost method while SE firms are those that use the successful effort method to account for exploration cost. The event is the implementation of the FASB Exposure Draft. We can see that significant negative abnormal returns happened due to the accounting changes brought by the exposure draft.

List examples of the use of the event study methodology in non-academic settings. The event study methodology can be applied to many situations in life as long as they satisfy the following conditions:
1. Event is relevant to the dependent variable 2. We can remove any confounding effect 3. There is a specific event time 4. We have a benchmark to compare ourselves against
For example, if I am the owner of a restaurant and I would like to launch a ‘happy hour’ promotion. I can use the market model to estimate how many extra (or less) customers I will get due to this promotion.
Rmt can be found by observing restaurants which adopted the same policy and sell similar cuisine. After we have compiled a reasonable sample size, we can average the total number of customers and find the Rm. Next we have to estimate the alpha and beta based on past data of their customer arrival rate and the Rm. Finally we can find the abnormal number of customers for each restaurant using the above formula, and the average abnormal number of customers by averaging the figures. This figure will be helpful in our decision of whether the happy hour promotion is profitable or not. We can also use the event study methodology to evaluate the performance of a tuition teacher. The sample will comprise of the students taught by that teacher. Rmt would be the average results of the students taught by that tuition teacher. We can compare the results of each student with that of the Rm to find the alpha and beta. After that we can find the abnormal result (AR) for each student using the market model. Finally, by looking at the AAR for all the students, we will know whether the tuition teacher is good at his job and whether to employ him.

Discuss the limitations of this research methodology Although there are many benefits to using event studies in our research, there are still some limitations to the model.
Firstly, the event study methodology depends on the assumption of an efficient market. This assumption is not valid in many situations. The length of time required for individual investors to respond to event signals is random and therefore, the implication is that markets could exhibit market inefficiencies because prices do not instantly or fully reflect all available information. Individual stock prices usually increase in series of steps as investors normally respond in waves (as in the Elliot wave theory). Sometimes the abnormal returns might be spread out over such a long period of time that we are unable to see any significant ‘spike’ in the AR graph. We can only use the CAR graph in that case. Secondly, the methodology provide estimates of the short-run impact on shareholders only and fail to consider many other effects of the event. Even if we assume away the problems of inefficient markets, we might have further problems if the companies under study are contaminated by ensuing events. Concurrent events in different stocks might weaken or reinforce one another, resulting in abnormal returns that are not caused by the specific event of interest. This will make the results of our event study
Thirdly, the results of the event studies are sensitive to changes in your research design. A difference in choice of Rm (eg S & P 500, STI or customized compilation of companies’ stock prices) will result in vastly different results for your abnormal returns. Similarly a change in your estimation window will give you different alphas and betas, which will also affect your results. The choice of sample size will also result in differences in your results. The sensitivity of event studies will result in different conclusions being drawn by researcher studying the same event, thereby making it hard for us to choose which result to believe in. Lastly, it is a garbage in, garbage out system. The results of your estimation depend heavily on the data that you compiled. If the source of your data on the dependent variables (eg stock price, sales) is not trustworthy, then your estimations on abnormal returns will most probably be inaccurate too. Despite all the limitations in the event study methodology, it is still widely used in may areas of research. This is due to the fact that this research methodology has a powerful and easy design, is able to detect abnormal performance, can be used in less than perfect conditions and the results are easy to interpret and share.


