30
Introduction

Introduction

184 0 92 102 0 70 0 152 195 99 206 202 201 221 3 0 103 120
2014 Blackstone Investor Day
Blackstone 1
Blackstone: Leaving the pack behind
FAST LANE

184 0 92 102 0 70 0 152 195 99 206 202 201 221 3 0 103 120
2014 Blackstone Investor Day
Blackstone 2
What you may not know about Blackstone
Our funds created $33 billion of value in the past year
In the past year investors entrusted us with $52 billion in additional funds
We invest for over half of all U.S. pensioners
Innovation has driven $122 billion in AUM from new products since our IPO
We are the most profitable asset manager in the world
We have a greater presence on social media than any of our peers

184 0 92 102 0 70 0 152 195 99 206 202 201 221 3 0 103 120
2014 Blackstone Investor Day
Blackstone 3
2007 Today
$165
$84
$357
BX Alternatives
$38 $19 $6
$40 $41
$100
BX Alternatives
2007 Today
# of Public Companies
Market Cap and Free Float ($ in billions)
# of Institutions with >1mm Shares of BX
Average Daily Trading Volume ($ in millions)
The “Alternatives” have evolved
3
8
IPO Today
14
65
________________________________________________
Note: As of June 10, 2014. Alternatives include: APO, ARES, BX, CG, FIG, KKR, OAK and OZM.
Float Mkt Cap
2007 Today
Float Mkt Cap

184 0 92 102 0 70 0 152 195 99 206 202 201 221 3 0 103 120
2014 Blackstone Investor Day
Blackstone 4
Where would Blackstone rank today in the S&P 500?
________________________________________________
Note: As of June 10, 2014.
Market
Market
Cap / LTM
Avg. Daily
Trading
Cap Employees Employee Earnings Volume ’13A ’14E
Blackstone $38,014 2,016 $18.9 $3,700 $165 4.3% 5.4%
Median for Asset Managers in S&P 500 22,149 7,523 3.3 1,255 97 2.0% 2.0%
S&P 500 Financials Median 19,498 10,991 1.1 1,004 108 2.0% 2.1%
S&P 500 Median 17,983 17,800 1.0 796 124 1.6% 1.7%
In which quartile would
Blackstone rank?1 4 1 1 2 1 1
Dividend Yield
($ in millions)

Blackstone 5
2014 Blackstone Investor Day
Blackstone’s earnings are not closely linked to the stock market
R² = 0.22
-300%
-200%
-100%
0%
100%
200%
300%
-20% -15% -10% -5% 0% 5% 10% 15% 20%BX
EN
I
S&P 500
Blackstone Earnings vs. S&P 500

184 0 92 102 0 70 0 152 195 99 206 202 201 221 3 0 103 120
2014 Blackstone Investor Day
Blackstone 6
$0.4bn
$6.9bn
’98 ’00 ’02 ’04 ’06 ’08 ’10 ’12 1Q’14 LTM
The market values growth
31%
26%
10x
10%
24%
16x
15%
26%
23x
11%
39%
19x
9%
30%
23x
BX Asset Managers Advisory Firms Biotech Software
Earnings Growth(1)
Stock Volatility(2)
’14E P/E(3)
________________________________________________
Note: Asset managers include: AB, AMG, BEN, BLK, EV, FII, IVZ, JNS, LM, TROW and WDR. Advisory firms include: LAZ, GHL, EVR, and MC. Biotech and Software based on the Global Industry Classification Standard. (1) As of December, 31, 2013. Trailing 3-year CAGR. (2) Based on the average of the implied volatility (6M, 100 strike) for the companies within the industries. (3) Based on 2014 consensus estimates.
From peak to peak the growth was 120%

184 0 92 102 0 70 0 152 195 99 206 202 201 221 3 0 103 120
2014 Blackstone Investor Day
Blackstone 7
LTM 1 2 3 4 5 6 7 8 9 10Years
Current 1 2 3 4 5 6 7 8 9 10
Years
What’s it all worth?
________________________________________________
Note: Presentation of hypothetical growth in Fee-Earning AUM and Distributable Earnings not intended to project future performance. Calculation of hypothetical Distributable Earnings per unit is intended to be illustrative and for that purpose contains a number of assumptions including, among others, constant management and performance fee rates and margins over the ten-year period, a 2x realized multiple of invested capital over an average hold period of 4.5 years for our draw-down funds and an effective tax rate of 15%–20% on taxable income for the ten-year period. Cumulative distributions paid assumes 100% payout of Distributable Earnings. Analysis assumes no reinvestment of distributions paid.
Average Cash Earnings: $2.70
$4.15
$610
$204
Yield in Year 10
Year 10 excluding
Distributions
Cumulative Distributions
Paid Total
6% $69 $27 $96
5% $83 $27 $110
4% $104 $27 $131
+ + +
= = =
Hypothetical Fee-Earning AUM ($ in billions)
Hypothetical Distributable Earnings ($ per diluted unit) Implied Stock Price
If:
12% AUM growth
2x multiple on invested capital
7%–10% liquid fund returns
60% below our historic rate
Stocks price 10-yr CAGR @96 – 11.0%
@110 – 12.5% @131 – 14.5%

Welcome Remarks

Blackstone 1
184 0 92 102 0 70 0 152 195 99 206 202 201 221 3 0 103 120
2014 Blackstone Investor Day
Welcome to Blackstone’s fourth Investor Day
Private Equity
Joe Baratta
Dave Calhoun Real Estate
Jon Gray
Tactical Opportunities
David Blitzer
Hedge Fund Solutions
Tom Hill
Private Wealth
Brendan Boyle Finance & Technology
Laurence Tosi
Secondaries
Verdun Perry
Credit
Bennett Goodman

Blackstone 2
2014 Blackstone Investor Day
Leading market positions across all our businesses
People have been trying to imitate Blackstone for years…

Blackstone 3
184 0 92 102 0 70 0 152 195 99 206 202 201 221 3 0 103 120
2014 Blackstone Investor Day
Not easy to replicate
One of the best brands in all financial services
Most extensive network of institutional LP relationships
Deepest and broadest management team
Scale to handle large, complex transactions that others can’t
Better information; seamless sharing of knowledge and ideas
Unique culture
Tradition of winning
The only firm with leadership positions across multiple businesses

Blackstone 4
184 0 92 102 0 70 0 152 195 99 206 202 201 221 3 0 103 120
2014 Blackstone Investor Day
What makes Blackstone different?
Small Firm Feel
each person makes a difference
An enduring culture that is
unique and compelling
Engaged Leaders
shaping and guiding people daily
Flat Organization
no bureaucracy; move quickly
Talent
deep; broad; driven
Innovation
entrepreneurial spirit
Camaraderie
cohesive teams; common mission
Passion
drive to win
Blackstone 5
184 0 92 102 0 70 0 152 195 99 206 202 201 221 3 0 103 120
2014 Blackstone Investor Day
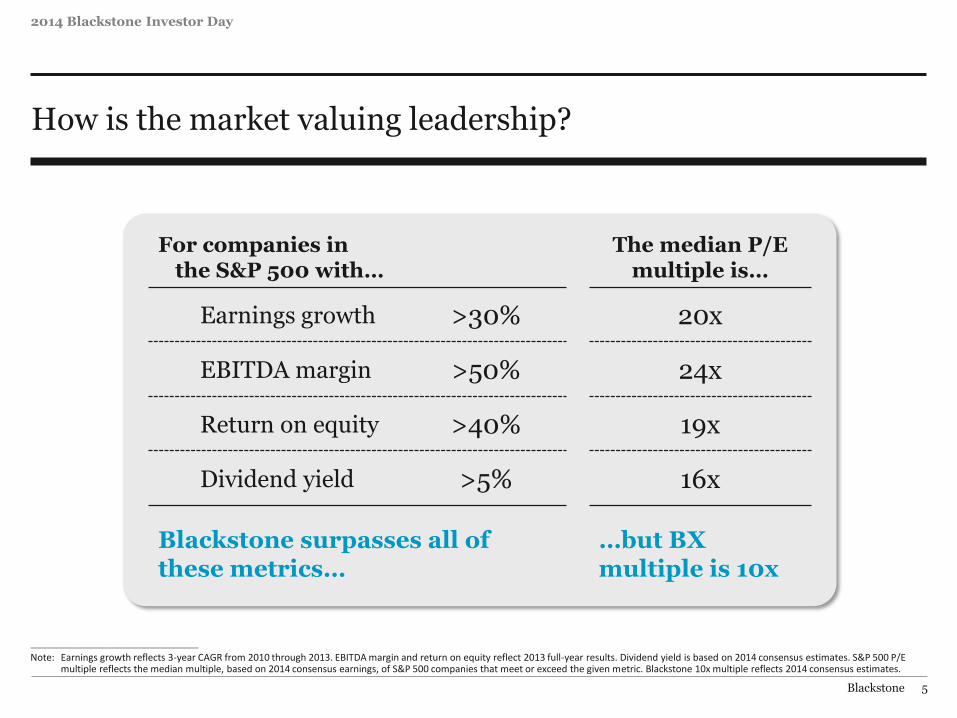
How is the market valuing leadership?
________________________________________________
Note: Earnings growth reflects 3-year CAGR from 2010 through 2013. EBITDA margin and return on equity reflect 2013 full-year results. Dividend yield is based on 2014 consensus estimates. S&P 500 P/E multiple reflects the median multiple, based on 2014 consensus earnings, of S&P 500 companies that meet or exceed the given metric. Blackstone 10x multiple reflects 2014 consensus estimates.
For companies in the S&P 500 with…
The median P/E multiple is…
Earnings growth >30% 20x
EBITDA margin >50% 24x
Return on equity >40% 19x
Dividend yield >5% 16x
Blackstone surpasses all of these metrics…
…but BX multiple is 10x

GSO

GSO’s Business Today

184 0 92 102 0 70 0 152 195 99 206 202 201 221 3 0 103 120
2014 Blackstone Investor Day
Blackstone 2
Global footprint with over 250 employees in New York, London, Dublin and Houston
GSO Capital Partners
$66.0 billion
Mezzanine Funds
$7.8 billion
Rescue Lending Funds
$8.8 billion
BDCs (Small Cap
Direct Lending)
$11.0 billion
CLOs
$20.3 billion
Closed End & Commingled
Funds, ETF and SMAs
$10.5 billion
Hedge Fund Strategies
$7.6 billion
Private Market Strategies Public Market Strategies
Total Assets Under Management
GSO question – can we change color of dotted lines and text color of bottom labels
Alternative Investment Funds
$35.2 billion
Customized Credit Strategies – Long Only
$30.8 billion
________________________________________________
Note: The AUM for Blackstone, GSO or any specific fund, account or investment strategy presented in this Presentation may differ from any comparable AUM disclosure in other non-public or public sources. Certain of these differences are in some cases required by applicable regulation.

184 0 92 102 0 70 0 152 195 99 206 202 201 221 3 0 103 120
2014 Blackstone Investor Day
Blackstone 3
Our Mission: Strong investment results across our strategies
________________________________________________
Note: Past Performance is not necessarily indicative of future results. See “Important Disclosures” section at the front of the presentation book. (1) Rescue Lending Flagship funds and Mezzanine Flagship funds returns shown from inception of the first flagship fund of each strategy (September 2009 and June 2007, respectively) through March 31,
2014. BDCs shown from inception of first fund in January 2009 through March 31, 2014. Hedge Fund Strategies Flagship Funds shown from inception (August 2005) through March 31, 2014. Leveraged Loans shown from December 2000 through March 31, 2014.
(2) Indices, in order, are as follows: DJ CS Event Driven Distressed, CS High Yield Index + 200bps, 80% CS LLI / 20% CS HYI, HFRI Fund Weighted Composite and CS Leveraged Loan Index. (3) U.S. Leveraged Loans Composite includes U.S. CLO and other vehicles where at least 80% of the invested assets are senior secured bank loans. Performance is presented gross of fees. Estimated net
returns for this composite are 3.8% and 4.5% for 2013 and ITD, respectively, assuming a 1.25% management fee. The performance of CLO portfolios included in this composite is calculated based on the unlevered underlying portfolio assets within the CLO structure. Actual management fees for accounts within this composite vary. CLOs within this composite also have an incentive fee specific to the fund, subject to an IRR hurdle, which is not included here.
2013 Results Inception to Date(1)
Strategy AUM Net Returns Net Returns Index(2)
Private Market Strategies
Rescue Lending Flagship Funds $8.6 24.3% 17.6% 9.2%
Mezzanine Flagship Funds 5.4 17.9% 19.0% 10.4%
Small Cap Direct Lending (BDCs) 11.0 16.5% 15.8% 14.1%
Public Market Strategies
Hedge Fund Strategies Flagship Funds $4.5 18.2% 9.4% 4.8%
U.S. Leveraged Loans Composite(3) 7.8 5.1% 5.7% 5.0%
($ in billions)

GSO’s Evolution

184 0 92 102 0 70 0 152 195 99 206 202 201 221 3 0 103 120
2014 Blackstone Investor Day
Blackstone 5
71% of our AUM and 34% of LPs are invested in products that did not exist five years ago
Evolution of the GSO platform
________________________________________________
(1) Alternative assets only.
December 31, 2008 March 31, 2014
Total AUM: $22.4 $66.0
Alternatives 5.9 35.2
Customized Credit Strategies 16.5 30.8
% of AUM from products that didn’t exist in 2008(1) – 71%
% of LPs invested in products that didn’t exist in 2008(1) – 34%
($ in billions)

184 0 92 102 0 70 0 152 195 99 206 202 201 221 3 0 103 120
2014 Blackstone Investor Day
Blackstone 6
Where have we grown?
Over the past five years, $25 billion of our AUM growth has come from new products and strategies
As of December 31, 2008 As of March 31, 2014
Hedge Fund Strategies Flagship funds $2.7 $4.5
Mezzanine Flagship funds 2.0 5.4
Rescue Lending Flagship funds – 8.6
Strategic SMAs(1) – 5.3
BDCs – 11.0
Other Credit Funds(2) 3.6 0.3
Customized Credit Strategies 14.1 30.8
Total AUM $22.4 $66.0
________________________________________________
(1) Includes various SMAs, co-investments and opportunistic funds managed by GSO. (2) Includes legacy funds currently in wind down.
($ in billions)

184 0 92 102 0 70 0 152 195 99 206 202 201 221 3 0 103 120
2014 Blackstone Investor Day
Blackstone 7
How have we achieved this growth?
Raise new pools of capital based on key industry themes developed within GSO and Blackstone
Examples: energy and residential housing
Rescue Lending Funds
Business Development Corps (BDCs)
CLO consolidation
Created over $5 billion in separate accounts with large LPs over past few years
Capitalizes on LP trend to consolidate GP relationships
Allows LPs to invest more capital quickly with better fees and greater transparency
Products that capitalize on strong demand for yield by retail investors: Closed-End Funds, ETF, BDCs
Tapping into private banks for distribution: Rescue Lending, Mezzanine and Hedge Funds
Leverage Industry Themes
Capitalize on Market Dislocations and
Regulatory Changes
Strategic Partnerships with Large LPs
Retail Channels

184 0 92 102 0 70 0 152 195 99 206 202 201 221 3 0 103 120
2014 Blackstone Investor Day
Blackstone 8
Capitalizing on industry themes: Energy and Power
GSO has invested over $15 billion in the Energy sector since 2005
Dedicated Energy team of 16 people with unique sector expertise and long-standing management relationships
Energy fits extremely well within GSO’s investment approach
• Deal flow driven by significant capital needs and fragmented nature of the industry
• Hard asset value coupled with commodity exposure should allow for downside protection
and upside participation
We have leveraged our Energy capability across the GSO platform
• $1 billion of Energy separate accounts
• Energy-focused BDC (~$3 billion)
• GSO believes high exposure to Energy investments has driven strong investment results across funds and has enabled us to raise larger sized funds

184 0 92 102 0 70 0 152 195 99 206 202 201 221 3 0 103 120
2014 Blackstone Investor Day
Blackstone 9
Select GSO Energy and Power investments
________________________________________________
Sub Sector / Theme Privately Originated Public Investments
Upstream
Midstream
Service and Equipment
Power Generation
Pecos
Lake Road Generating Calpeak
________________________________________________
All rights to the trademarks listed herein belong to their respective owners, and GSO’s use hereof does not imply any affiliation with, or endorsement by, the owners of these trademarks.

184 0 92 102 0 70 0 152 195 99 206 202 201 221 3 0 103 120
2014 Blackstone Investor Day
Blackstone 10
GSO’s Energy investments touch the major U.S. oil & gas plays
________________________________________________
Note: Green shading represents key U.S. oil & gas production area.
Exploration & Production
Midstream
Power
Services
Utica
Bakken
Exploration & Production
Midstream
Power
Services
Utica
Bakken

184 0 92 102 0 70 0 152 195 99 206 202 201 221 3 0 103 120
2014 Blackstone Investor Day
Blackstone 11
Capitalizing on industry themes: residential housing
Opportunistically invested $4 billion of capital across public and private strategies as our view on the housing recovery evolved(1)
________________________________________________
(1) Includes long investments made in GSO’s Hedge Fund Strategies funds, Rescue Lending funds, Mezzanine funds, total commitments for GSO’s dedicated Land Bank Fund and investments made by alternative investment SMAs managed by GSO since GSO’s inception within the Homebuilder, Building Materials and Real Estate sectors.
2006 2007 2008 2009 2010 2011 2012 2013
2006–2007
Bearish view
Short positions
2009
GSO provides capital to mid cap homebuilders: • Beazer Homes • Plygem • KB Homes
2013–2014
Rescue financings for Morris Homes, KP1
Hedge fund positions in Beazer, iStar, Quinn Group
GSO forms dedicated $500 million Land Bank Fund
2008
Cautious but turning constructive
Investment in Standard Pacific
2011–2012
Positive view on homebuilding recovery GSO deploys capital across public and private funds Invested in Hovnanian, City Ventures, Miller Homes,
CEMEX, Giant Cement, Cementos Portland and Realogy Land bank strategy initially deployed in hedge and
mezzanine funds

184 0 92 102 0 70 0 152 195 99 206 202 201 221 3 0 103 120
2014 Blackstone Investor Day
Blackstone 12
Select GSO homebuilder and building products investments
________________________________________________
All rights to the trademarks listed herein belong to their respective owners, and GSO’s use hereof does not imply any affiliation with, or endorsement by, the owners of these trademarks.
Sub Sector / Theme Privately Originated Public Investments
Homebuilders / Realtor
Building Products
REITs

184 0 92 102 0 70 0 152 195 99 206 202 201 221 3 0 103 120
2014 Blackstone Investor Day
Blackstone 13
Market dislocation and regulatory changes
GSO’s views on market opportunity
Significant structural and regulatory changes in financial markets create opportunity for GSO
Global investment banking model moved to “Capital Lite”
Volcker Rule / Dodd-Frank / OCC Leverage Guidelines
Basel III
CLO “skin in the game” requirements / limited new issuance
GSO Activities Rescue Lending Flagship Funds BDCs CLO Acquisitions
Launch: September 2009 January 2009 April 2010
New AUM(1): $8.6 billion $11 billion $15 billion
Strategy: Rescue lending Small cap direct
lending Consolidation of the
CLO industry ________________________________________________
(1) Rescue Lending Flagship Funds New AUM reflects AUM of GSO’s flagship Rescue Lending funds as of March 31, 2014. BDCs New AUM reflects AUM of GSO’s Small Cap Direct Lending funds as of March 31, 2014. CLO Acquisitions New AUM reflects the dollar amount of CLOs acquired by GSO following April 2010.

184 0 92 102 0 70 0 152 195 99 206 202 201 221 3 0 103 120
2014 Blackstone Investor Day
Blackstone 14
What’s next?
GSO’s views:
Credit markets remain frothy
• Yields and spreads at record lows
• Public market deals have more aggressive leverage, weaker covenants and lower credit quality
• Sets up well for next distressed cycle
Activity in Europe picking up significantly
Areas of Focus:
• European direct lending fund – $2.5 billion
• Expand into emerging market corporate debt
• Additional capital for energy activities
• Forge new strategic partnerships with large LPs

184 0 92 102 0 70 0 152 195 99 206 202 201 221 3 0 103 120
2014 Blackstone Investor Day
Blackstone 15
Why are we well positioned for the future?
Investment Performance
Superior results generated across the platform
Believe we’re top quartile performer in all of our major strategies
Unique Competitive Advantages
Ubiquitous presence in below investment grade corporate credit
Scale enables us to do deals that others can’t
“Blackstone / GSO” brand globally recognized by companies and boards
Tradition of Innovation
Long track record of providing creative solutions
Market volatility and dislocations are our opportunity to grow
Culture
Entrepreneurial group of 15 SMDs
Strong cooperation across Blackstone and GSO
Excellent alignment with our LPs


