Influence of rainfall spatial resolution on flash flood modelling
M. Sangati and M. Borga
Department of Land and Agroforest Environment, University of Padova, Agripolis, Legnaro (PD), Italy
Received: 4 April 2008 – Revised: 5 February 2009 – Accepted: 30 March 2009 – Published: 9 April 2009
Abstract. High resolution radar rainfall fields and a dis-tributed hydrologic model are used to evaluate the sensitivityof flash flood simulations to spatial aggregation of rainfallat catchment scales ranging from 10.5 km2 to 623 km2. Thecase study focuses on the extreme flash flood occurred on29 August 2003 on the eastern Italian Alps. Four rainfallspatial resolutions are considered, with grid size equal to 1-,4-, 8- and 16-km. The influence of rainfall spatial aggrega-tion is examined by using the flow distance as a spatial co-ordinate, hence emphasising the role of river network in theaveraging of space-time rainfall. Effects of rainfall spatialaggregation are quantified by using a dimensionless param-eter, represented by the ratio of rainfall resolution (Lr) tothe characteristic basin length (Lw), taken as the square rootof the watershed area. Increasing theLr/Lw parameter in-duces large errors on the simulated peak discharge, with val-ues of the peak discharge error up to 0.33 forLr/Lw equal to1.0. An important error source related to spatial rainfall ag-gregation is the rainfall volume error caused by incorrectlysmoothing the rainfall volume either inside or outside of ofthe watershed. It is found that forLr/Lw<1.0, around 50%of the peak discharge error is due to the rainfall volume error.Remaining errors are due to both the distortion of the rainfallspatial distribution, measured with respect to the river net-work, and to the reduced spatial variability of the rainfield.Further investigations are required to isolate and examine theeffect of river network geometry on the averaging of space-time rainfall at various aggregation lengths and on simulatedpeak discharges.
Rainfall is the primary input to most hydrological systems,and a key issue for hydrological science and practice is toassess the importance of the spatial structure of rainfall andits representation for flood runoff generation. This problemis particularly important for the case of flash flood events,which are characterised by high space-time variability bothin the rainfall forcing and in the hydrologic response (Creutinand Borga, 2003). The influence of rainfall representation onthe modelling of the hydrologic response is expected to de-pend on complex interactions between the rainfall space-timevariability, the variability of the catchment soil and land-scape properties, and the spatial scale (i.e. catchment area)of the problem (Obled et al., 1994; Woods and Sivapalan,1999; Bell and Moore, 2000; Smith et al., 2004). The liter-ature addressing this problem includes quite heterogeneousapproaches in terms of the methodologies adopted and con-clusions drawn from the analyses (Nicotina et al., 2008).
In general, when addressing the problem of the samplingscale effect, it is found that the measured (apparent) vari-ability of spatially-continuous fields depends on two terms:extent and support (Bloschl and Sivapalan, 1995). “Ex-tent” refers to the overall coverage of the data (the watershedscale, given byLw, root square of the watershed area); “sup-port” refers to the resolution area (the aggregation length,Lr). Based on theoretical and empirical evidence, it is foundthat the apparent spatial variability of the rainfall field repre-sented at some aggregation scale decreases with decreasingthe “extent” and with increasing the aggregation length. Thefirst effect is a logical consequence of the existence of spatialcorrelations: for a given aggregation length, the smallerLw,the closer the data and, thus, the closer their values. The sec-ond effect arises because dispersion within a fixed domainLw decreases as the supportLr increases: the rainfall valuesat 8-km resolution are less dispersed than the rainfall valuesat 1-km resolution, for a fixed domain.
Published by Copernicus Publications on behalf of the European Geosciences Union.
576 M. Sangati and M. Borga: Rainfall spatial resolution and flash flood modelling
23
549
550
551
Figure 1: Location of the OSMER radar and the Fella river basin at Moggio Udinese with DTM of 552 North-Eastern Italy. The locations of the raingauge stations used in the study are also reported. The 553 dotted line rectangle represents the area used for the analyses of rainfall spatial variability reported 554 in Fig. 3. 555
Fig. 1. Location of the OSMER radar and the Fella river basin atMoggio Udinese with topography of North-eastern Italy. The loca-tions of the raingauge stations used in the study are also reported.The dotted line rectangle represents the area used for the analysesof rainfall spatial variability reported in Fig. 3.
Increasing the aggregation length leads not only to a re-duction of the rainfall apparent spatial variability. It hasbeen found (Ogden and Julien, 1994; Winchell et al., 1998;Segond et al., 2007) that when the ratioLr/Lw exceeds acertain threshold, the uncertainty in the location of precipi-tation over the catchment becomes a major source of errorin rainfall volume estimation at the catchment scale. Indeed,typical spatially varying rainfall patterns consist of regions ofheavier or lighter precipitation outside the immediate bound-aries of a catchment. Rainfall values pertaining to areas justoutside the catchment may enter the computation of the aver-age rainfall over the basin by increasing the resolution area.As such, this error source leads to a rainfall volume error.
The sensitivity of runoff modelling to both attenuated spa-tial variability and rainfall volume error depends strongly onthe smoothing effect of catchment characteristics (Winchellet al., 1998; Segond et al., 2007). When there is not enoughvariability in rainfall to overcome the damping effect of thecatchment, detailed knowledge of rainfall spatial variabilityis not required to model the catchment response, althoughreliable information of catchment-averaged rainfall is impor-tant (Naden, 1992; Obled et al., 1994; Woods and Sivapalan,1999; Smith et al., 2004; Andreassian et al., 2001). How-ever, there is not an agreed approach to quantify the dampingeffect of a given catchment and the conclusions drawn fromthe different studies depend heavily on the runoff model, thecharacteristics of the rainfall forcing and the type of catch-ment examined.
Focusing the analysis on flash flood events allows one toisolate specific runoff generation mechanisms and catchmentproperties which are perceived as dominant with this typeof events. In particular, the substantial role exerted by Hor-
tonian runoff generation with high intensity rainfall eventsemphasise the role of surface runoff and river network ge-ometry in the averaging of space-time rainfall (Norbiato etal., 2008). In this case, the concept of flow distance, i.e. thedistance along the runoff flow path from a given point to theoutlet, may provide a useful metric to examine the influenceof rainfall resolution on runoff modelling (Woods and Siva-palan, 1999). The dampening effect arises here because theexcess rainfall generated at points placed at equal flow dis-tance will be averaged out in the runoff propagation process,in spite of the rainfall spatial variability. The averaging ofspace-time rainfall fields across locations with equal flowdistance coordinates may be sensitive to the spatial resolu-tion of the rainfall representation and as such it may explain,at least partially, the pattern of runoff model sensitivity torainfall resolution.
These concepts are examined in this study with referenceto the flash flood event which occurred on 29 August 2003in the Fella river basin (eastern Italian Alps). The regionalflood response of the Fella river basin is examined in termsof space–time rainfall variability and heterogeneous land sur-face properties. A distributed hydrologic model, which in-cludes an empirical infiltration model and a network-basedrepresentation of hillslope and channel response, plays a cen-tral role in examining the regional flood response. Detailedobservations from a weather radar are used to estimate therainfall forcing (Borga et al., 2007). To elucidate the controlsof rainfall spatial aggregation on model error, the distributedhydrologic model is applied over ten different sub basinsranging from 10.5 km2 to 623.0 km2 and by using four dif-ferent rainfall resolutions: 1-, 4-, 8- and 16-km. The range ofspatial resolution covers the aggregation scales often encoun-tered in flash flood forecasting, from fine-scale radar rainfallestimates to large-scale rainfall forecasts provided by numer-ical weather forecast models.
The paper is organized as follows. Section 2 describesthe study region and provides the documentation of the flashflood event used in this investigation. Section 3 illustratesthe distributed model used in the study, whereas Sect. 4 ex-amines its sensitivity to spatial resolution of rainfall over arange of catchment scales. Section 5 completes the paperwith discussion and conclusions.
2 The Fella 2003 flash flood
The flash flood of the Fella catchment on 29 August 2003(Fig. 1) occurred at the end of a climatic anomaly of a dryand hot summer and was one of the most devastating flashflood events in North-Eastern Italy since starting of system-atic observations. The rainfall event started at 10:00 CET(Central European Time) and lasted for 12 h, focusing on the705 km2-wide Fella basin (Fig. 2), which is a major left-handtributary of the Tagliamento river system. The Fella basinhas a mean altitude of 1140 m a.s.l., with an average annual
M. Sangati and M. Borga: Rainfall spatial resolution and flash flood modelling 577
precipitation of 1920 mm. Ten subbasins of the Fella riversystem are examined in this study, ranging from 10.5 km2 to623 km2.
Extreme rainfall from the August 2003 storm was pro-duced by quasi-stationary convective banded structures.Some of the bands persisted in the same locations for theduration of the event. The steadiness of these rainbandsled to highly variable precipitation accumulations and runoff(Borga et al., 2007). The storm total precipitation (Fig. 2)is characterised by a band of rainfall accumulation exceed-ing 300 mm localised on the right-hand tributaries of theFella river. The storm total rainfall distribution reflects southwest – north east motion of the storm elements and west-east shift of the tracks of the storms. Rainfall intensity upto 100 mm h−1 over 15-min time step was recorded duringthe explosive growth phase of the storm (between 14:00 and18:00 CET) (Norbiato et al., 2007). Rainfall produced by theAugust 2003 storm resulted in severe flooding throughout theFella river basin. The storm produced catastrophic floodingat drainage areas up to 80–90 km2.
2.1 Post event field campaign
Flash flood events are difficult to monitor because they de-velop at space and time scales that conventional measure-ment networks of rain and river discharges are not able tosample effectively (Borga et al., 2008). This explains whythe investigation of flash flood events is by necessity event-based and opportunistic as opposed to driven by observationsfrom carefully designed field campaigns. Post-event surveysplay therefore a critical role in gathering essential observa-tions to implement and verify hydrological models for flashflood analyses.
Following the August 2003 event, post flood surveys wereplanned. Surveys were concentrated in the upper Fella basinand included: (i) collection of rainfall data, (ii) collection ofstreamgauge data and execution of indirect peak flood esti-mation, and (iii) postflood interviews.
Radar and raingauge observations were used to deriverainfall fields for the August 2003 storm. 5-min rain-gauge data were collected at 15 raingauges (Fig. 1), whereasstorm total rainfall was available at further six daily rain-gauges. Volume scan reflectivity data from the Doppler,dual-polarised C-band OSMER radar station, located at Fos-salon di Grado (Fig. 1) (time resolution of 5 min and spatialresolution of 250 m in range by 0.9 degree in azimuth), wereused to derive radar rainfall rates. Spatially detailed rain-fall estimates were obtained by adjusting radar observationaccounting for the physics of the radar sensing and incorpo-rating accumulated values of the available raingauge stations(Borga et al., 2002).
Streamgauge data and observations from post-event sur-veys, combined with hydraulic modelling, were used to ex-amine the hydrologic response to the storm. Stream gaugedata were available at eight sites, generally located either
24
556
557
558
Figure 2: Storm total rainfall (mm) for the August 29, 2003 storm on the Fella river basin at 559 Moggio (basin outlet 10, 623km²) with the nine study subbasins: Rio degli Uccelli at Pontebba (1, 560 10.5km²); Rio Bianco at S. Caterina (2, 17.5km²); Uque at Ugovizza (3, 24km²); Aupa at Moggio 561 Udinese (4, 50km²); Pontebbana at Pontebba (5, 71.2km²); Fella at S.Caterina (6, 139km²); Fella at 562 Pontebba (7, 165km²); Fella at S.Rocco (8, 250km²) and Fella at Dogna (9, 329km²). 563 564 565
566
Fig. 2. Storm total rainfall (mm) for the 29 August 2003 storm onthe Fella river basin at Moggio (basin outlet 10, 623 km2) with thenine study subbasins: Rio degli Uccelli at Pontebba (1, 10.5 km2);Rio Bianco at S. Caterina (2, 17.5 km2); Uque at Ugovizza (3,24 km2); Aupa at Moggio Udinese (4, 50 km2); Pontebbana at Pon-tebba (5, 71.2 km2); Fella at S. Caterina (6, 139 km2); Fella at Pon-tebba (7, 165 km2); Fella at S. Rocco (8, 250 km2) and Fella atDogna (9, 329 km2).
close or at bridge crossing sites, where measurements aretaken by means of ultrasound sensors. Hydraulic modelling,combined with surveys of the post-flood river section geom-etry and data about pre- and post-flood geometry, was usedto derive stage-discharge relationships at these river sections(Borga et al., 2007). Furthermore, hydraulic modelling wasused to estimate peak discharges based on surveyed high wa-termarks and postflood channel geometry at another threesites (including the site at the outlet of Uqua basin, Fig. 2)and to confirm the estimates at the gauged sections. Twenty-two local residents, mostly located close to the Uqua riverbasin and its fan, were interviewed about the severity of thestorm, occurrences of surface flow, timing of rainfall andstage peaks.
2.2 Precipitation analyses
The structure of the rainfall spatial variability has been ex-amined by using the climatological variogram (Lebel et al.,
a) Range [km], resulting from spatial climatological variogram analysis, versus time step [h]; 569 results are compared with analysis carried out by Berne et al. [2004] (dashed line); 570
b) Mean precipitation of non zero values inside the rectangle area shown in Figure 1. 571 c) Lengths of maximum and minimum axis for indicator variogram on binary rainfall fields 572
using 20mm h-1 threshold. 573 574 575 576
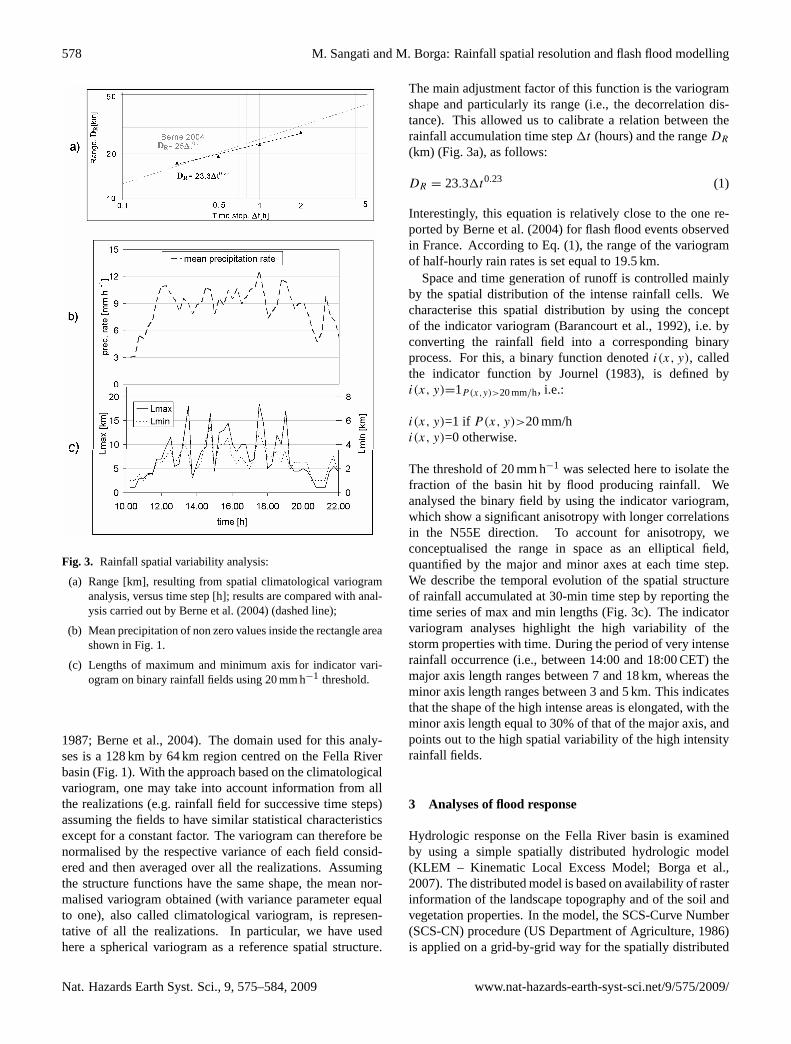
Fig. 3. Rainfall spatial variability analysis:
(a) Range [km], resulting from spatial climatological variogramanalysis, versus time step [h]; results are compared with anal-ysis carried out by Berne et al. (2004) (dashed line);
(b) Mean precipitation of non zero values inside the rectangle areashown in Fig. 1.
(c) Lengths of maximum and minimum axis for indicator vari-ogram on binary rainfall fields using 20 mm h−1 threshold.
1987; Berne et al., 2004). The domain used for this analy-ses is a 128 km by 64 km region centred on the Fella Riverbasin (Fig. 1). With the approach based on the climatologicalvariogram, one may take into account information from allthe realizations (e.g. rainfall field for successive time steps)assuming the fields to have similar statistical characteristicsexcept for a constant factor. The variogram can therefore benormalised by the respective variance of each field consid-ered and then averaged over all the realizations. Assumingthe structure functions have the same shape, the mean nor-malised variogram obtained (with variance parameter equalto one), also called climatological variogram, is represen-tative of all the realizations. In particular, we have usedhere a spherical variogram as a reference spatial structure.
The main adjustment factor of this function is the variogramshape and particularly its range (i.e., the decorrelation dis-tance). This allowed us to calibrate a relation between therainfall accumulation time step1t (hours) and the rangeDR
(km) (Fig. 3a), as follows:
DR = 23.31t0.23 (1)
Interestingly, this equation is relatively close to the one re-ported by Berne et al. (2004) for flash flood events observedin France. According to Eq. (1), the range of the variogramof half-hourly rain rates is set equal to 19.5 km.
Space and time generation of runoff is controlled mainlyby the spatial distribution of the intense rainfall cells. Wecharacterise this spatial distribution by using the conceptof the indicator variogram (Barancourt et al., 1992), i.e. byconverting the rainfall field into a corresponding binaryprocess. For this, a binary function denotedi(x, y), calledthe indicator function by Journel (1983), is defined byi(x, y)=1P(x,y)>20 mm/h, i.e.:
i(x, y)=1 if P(x, y)>20 mm/hi(x, y)=0 otherwise.
The threshold of 20 mm h−1 was selected here to isolate thefraction of the basin hit by flood producing rainfall. Weanalysed the binary field by using the indicator variogram,which show a significant anisotropy with longer correlationsin the N55E direction. To account for anisotropy, weconceptualised the range in space as an elliptical field,quantified by the major and minor axes at each time step.We describe the temporal evolution of the spatial structureof rainfall accumulated at 30-min time step by reporting thetime series of max and min lengths (Fig. 3c). The indicatorvariogram analyses highlight the high variability of thestorm properties with time. During the period of very intenserainfall occurrence (i.e., between 14:00 and 18:00 CET) themajor axis length ranges between 7 and 18 km, whereas theminor axis length ranges between 3 and 5 km. This indicatesthat the shape of the high intense areas is elongated, with theminor axis length equal to 30% of that of the major axis, andpoints out to the high spatial variability of the high intensityrainfall fields.
3 Analyses of flood response
Hydrologic response on the Fella River basin is examinedby using a simple spatially distributed hydrologic model(KLEM – Kinematic Local Excess Model; Borga et al.,2007). The distributed model is based on availability of rasterinformation of the landscape topography and of the soil andvegetation properties. In the model, the SCS-Curve Number(SCS-CN) procedure (US Department of Agriculture, 1986)is applied on a grid-by-grid way for the spatially distributed
M. Sangati and M. Borga: Rainfall spatial resolution and flash flood modelling 579
representation of runoff generating processes. A linear trans-fer function based on a simple description of the drainagesystem response is used to represent runoff propagation.
The general SCS-CN runoff equation is
q =(P−Ia)2
(P−Ia+S)for P ≥ Ia
q = 0 for P < Ia
(2)
whereq(mm) is the direct runoff depth,P (mm) is the eventrainfall depth,Ia (mm) is an “initial abstraction” or eventrainfall required for the initiation of runoff, andS (mm) isa site storage index defined as the maximum possible differ-ence betweenP andq asP→∞. P−Ia is also called “effec-tive rainfall”, or Pe. The SCS-CN method can be applied byspecifying a single parameter called the curve number,CN ,which is function of the hydrologic soil-cover complex andranges in principles from 1 to 100. The value ofS for a givensoil is related to the curve number as
S = C
(100
CN− 1
)(3)
whereC is a calibration parameter (mm), called infiltrationstorativity. The use of the parameterC allows one to use thespatial distribution ofCN values, which represents an inputdata in this work, and to simulate correctly, at the same time,the observed flood water balance (Borga et al., 2007).
The distributed runoff propagation procedure is based onthe identification of drainage paths, and requires the charac-terization of hillslope paths and channeled paths. We useda channelization support area (As) (km2), which is consid-ered constant at the subbasin scale, to distinguish hillslopeelements from channel elements and two parameters (vh andvc (m s−1)) as the two time-invariant hillslope and channelvelocities, respectively. The model has been implementedat 30-min time step and using a 20-m grid size cell for thedescription of landscape morphology and soil properties.
The hydrological model used here is based on the ratherstrong assumption that space-time excess rainfall distributionand drainage network structure provide the most importantcontrols on extreme flood response. However, its parsimo-nious structure is a favourable characteristics for analysis offlash flood events, which are affected by considerable uncer-tainty on rainfall and discharge data. As such, this modelstructure has been used in a number of studies on flash floodevents (Zhang et al., 2001; Borga et al., 2007). The accuracyof the model simulations have been examined and discussedby Borga et al. (2007), who showed that the model repro-duces peak discharge and the time of peak discharge reason-ably well. The model parameters calibrated at 1-km rainfallaggregation length were used for the sensitivity analysis.
3.1 Analysis of space-time precipitation variability atthree catchment scales and at two rainfall resolu-tions
To characterize the influence of temporal and spatial vari-ability of rainfall on flood response according to the metric
provided by the flow distance concept, we utilized 30-minrainfall fields at two different aggregation lengths to computethe following quantities:
1. the mean rainfall rate over the catchment at timet dur-ing the storm,M(t);
2. the fractional coverage of the basin by rainfall rates ex-ceeding 20 mm h−1, F(t);
3. the normalized time-distance of rainfall from the basinoutlet,D(t); and
4. the normalised dispersion of rainfall,SNOR(t).
Consistently with analyses reported above, the thresholdof 20 mm h−1 was selected here to isolate the fraction of thebasin hit by flood producing rainfall. The mean rainfall rateand fractional coverage time series provide basic informa-tion on rainfall mass balance and distribution of rainfall ratesover the catchment. They do not provide information on thespatial distribution of rainfall relative to the basin networkstructure, however. The drainage network, as represented bythe routing timeτ(u) from the arbitrary locationu=x, y tothe outlet of the basin. The routing timeτ (u) is defined as
τ(u) =Lh(u)
vh
+Lc(u)
vc
(4)
whereLh(u) is the distance from the generic pointu to thechannel network following the steepest descent path,Lc(u)
is the length of the subsequent drainage path through streamsdown to the watershed outlet, andvh and vc are the twoinvariant hillslope and channel velocities introduced above.The routing time provides a natural metric for analyzingthe spatial distribution of rainfall, as shown previously byWoods and Sivapalan (1999), Zhang et al. (2001) and Borgaet al. (2007). The routing time incorporates both geometricand kinematic properties in its determination.
The normalized time-distance at timet , D(t), is a functionof the rainfall fieldR(t, u) and the routing timeτ(u). It isdefined as the ratio of the rainfall-weighted centroid routingtimeD1(t) and the mean routing timeDmean,
D(t)=D1(t)
Dmean(5)
In Eq. (5) the time-distanceD1(t) is given by
D1(t) = |A|−1
∫A
w(t, u)τ (u)du (6)
whereA is the spatial domain of the drainage basin and theweight functionw(t, u) is given by
580 M. Sangati and M. Borga: Rainfall spatial resolution and flash flood modelling
26
577 578 Figure 4: Precipitation analysis for three catchments (Uccelli at Pontebba, 10.5km², Fella at 579 S.Caterina, 139 km² and Fella at Moggio Udinese, 623 km²), with two different rainfall grid 580 resolutions (1 km and 16 km): 581 a) mean rainfall intensity [mm h-1]; 582 b) coverage (for precipitation intensity > 20 mm h-1); 583 c) normalized time distance; 584 d) normalized time dispersion. 585 586 587 588 589 590
591
Fig. 4. Precipitation analysis for three catchments (Uccelli at Pontebba, 10.5 km2, Fella at S. Caterina, 139 km2 and Fella at Moggio Udinese,623 km2), with two different rainfall grid resolutions (1 km and 16 km):(a) mean rainfall intensity [mm h−1]; (b) coverage (for precipitation intensity>20 mm h−1); (c) normalized time distance;(d) normalizedtime dispersion.
The valueDmeanis defined as
Dmean= |A|−1
∫A
τ(u)du (8)
Values ofD(t) close to 1 reflect a rainfall distribution ei-ther concentrated close to the mean time-distance or homo-geneous, with values less than one indicating that rainfall isdistributed near the basin outlet, and values greater than oneindicating that rainfall is distributed towards the periphery ofthe drainage basin.
The rainfall-weighted flow time-distance dispersion isgiven by:
S(t) =
∫A
w(t, u) [τ(u) − D1(t)]2 du
0.5
(9)
The dispersion for uniform rainfall is defined by:
S1 =
∫A
[τ(u) − Dmean]2 du
0.5
(10)
and the normalised dispersion is given by
SNOR(t)=S(t)
S1(11)
Values ofSNOR(t) close to 1 reflect a uniform-like rainfalldistribution, with values less than 1 indicating that rainfall ischaracterised by a unimodal peak, and values greater than 1indicating cases of multimodal rainfall peaks close and farfrom the basin outlet.
Results are reported in Fig. 4 for three catchments: Riodegli Uccelli (10.5 km2), Fella at S. Caterina (139.0 km2)and Fella at Moggio (623.0 km2) and for rainfall fields ag-gregated over length scales of 1 and 16 km. Rio degli Uccelli
M. Sangati and M. Borga: Rainfall spatial resolution and flash flood modelling 581
and Fella at Moggio represent the smallest and largest catch-ment examined in the study, respectively, whereas Fella atS. Caterina represents an intermediate catchment scale. In-spection of the mean rainfall intensity shows that aggrega-tion at 16-km scale has relatively less effects over the largerbasin (Fella at Moggio), whereas significant smoothing ef-fects (with reductions up to 50%) are recognised over Riodegli Uccelli, particularly for the period 14:00 to 18:00, withintermediate effects for Fella at S. Caterina.
The dynamics of the fractional coverage is consistent withthe information provided by the temporal evolution of therainfall spatial structure reported in Fig. 3c. For Rio degliUccelli, which was located under one of the major convec-tion band during the phase of explosive growth of the storm,the size of the rainfall band is enough to ensure full cover-age in the period between 14:00 and 17:30. Interestingly,increasing the rainfall aggregation length induces generally asharper behaviour in the rainfall coverage, as it is illustratedby the case of the Fella at S. Caterina. Inspection of this lastcase shows that, even though the ratio of rainfall resolution tothe characteristic basin length (Lr/Lw) is larger than one forthe 16-km resolution, the rainfall is far from being spatiallyuniform, being the catchment located between two or morerainfall cells. This needs to be accounted for in the discussionbelow.
Examination of normalised distance highlights differentbehaviours across the various catchments. Analysis of nor-malised dispersion over the period of heavy rainfall and at1-km resolution shows that rainfall concentration translatesfrom the lower portion of the basin to the upper portionand that the dynamics of the normalised distance increaseswith catchment scale, as expected. Aggregation over 16-kmlength scale has generally the effect to reduce the dynamicsof the normalised distance and has a different impact accord-ing to catchment scale. For Rio degli Uccelli, aggregationover 16-km averages out any dynamics, as expected sincethe rainfall field provided to the catchment at this resolutionis completely uniform.
A similar pattern can be recognised for the normalised dis-persion, with precipitation exhibiting a unimodal peak forMoggio (at least during the period of extreme precipitation)and a more uniform distribution for the case of Rio degli Uc-celli, with S. Caterina being in an intermediate position.
4 Influence of rainfall spatial aggregation on peak dis-charge simulation
Effects of rainfall spatial aggregation on flood response mod-elling are examined here with reference to the ratio of rainfallresolution to the characteristic basin length (Lr/Lw), takenas the square root of the watershed area. To elucidate thecontrols of rainfall aggregation on model error, the KLEMmodel was applied over ten different subbasins ranging from10.5 km2 to 623 km2 (Table 1 and Fig. 2) and by using four
Table 1. Characteristics of the study basins, with catchment areaand mean areal cumulated precipitation at four different rainfall res-olutions; basin id numbers as reported in Fig. 2.
Basin id number Area [km2] Mean areal precipitation[mm] using resolution
different rainfall resolutions: 1-, 4-, 8- and 16-km. This pro-vides 40 different combinations of watershed characteristiclengths and rainfall aggregations.
As shown above, varying the spatial rainfall resolution in-duces rainfall volume errors, a reduction of the rainfall appar-ent spatial variability and a distortion of the rainfall geometrywith respect to the flow distance metric. In order to sepa-rately address the first two effects we performed numericalexperiments in which rainfall depths are rescaled and forcedto be exactly preserved at each time step over the range ofrainfall resolutions and catchment scales examined.
The error analysis was carried out for rainfall and runoffvolumes and for peak discharges, by comparing results ob-tained by using a given input resolution with those obtainedfrom 1-km grid size, considered here as the reference resolu-tion. The error statistics “normalised rainfall volume error”εr , “normalised runoff volume error”εv and “normalisedpeak discharge error”εq were computed for rainfall volume,runoff volume and peak discharge, respectively, as follows:
εr =|PLr−P1|
P1,
εv =|VLr−V1|
V1,
εq =|QLr−Q1|
Q1,
(12)
wherePLr andP1, VLr andV1, andQpLr andQp1, repre-sent the rainfall volume, the runoff volume and the peak dis-charge resulting from aggregation overLr - and 1-km length,respectively. The error statistics were computed before andafter rescaling the rainfall fields at different resolution to pre-serve rainfall volumes.
Examination of the normalised rainfall volume errors(Fig. 5a) highlights the impact of the error caused by in-correctly smoothing the rainfall volume either into or outof the watershed; this generally corresponds to negative er-rors – i.e. underestimation of the true rainfall volumes (Ta-ble 1). These results generalise those reported at the previous
582 M. Sangati and M. Borga: Rainfall spatial resolution and flash flood modelling
27
592 593
594 595 Figure 5: Relationship between the ratio Lr/Lw and a) normalised rainfall error; b) normalised 596 runoff volume error before rainfall volume rescaling; c) normalised runoff volume error after 597 rainfall volume rescaling; d) normalised peak discharge error before rainfall volume rescaling; e) 598 normalised peak discharge error after rainfall volume rescaling. 599
Fig. 5. Relationship between the ratioLr/Lw and(a) normalised rainfall error;(b) normalised runoff volume error before rainfall volumerescaling;(c) normalised runoff volume error after rainfall volume rescaling;(d) normalised peak discharge error before rainfall volumerescaling;(e)normalised peak discharge error after rainfall volume rescaling.
Section for the catchments of Rio degli Uccelli and Fellaat Moggio and examined by using grid resolutions equal to1 and 16 km. A large rainfall volume error was found forgrid size equal to 16 km for the Rio degli Uccelli. This cor-responds toLr/Lw equal to 5.1, for which the normalisedrainfall volume error amounts to 27%. On the contrary, theerror for the Fella basin at Moggio, for whichLr/Lw isequal to 0.64, amounts to 9%. For the Fella at S. Caterina(Lr/Lw=1.37), the error amounts to 15%. The figure showsthat use of the ratioLr/Lw is capable to filter out quite effec-tively the effect of the catchment size on the rainfall volumeerror. Inspection of the maximum values of the errors showsthat the error is up to 0.1 forLr/Lw equal to 0.4, and thenincreases to 0.2 forLr/Lw equal to 1.0 and to 0.5 forLr/Lw
equal to 2.5.
Results are reported in Fig. 5b, c, d and e for the volumeand peak errors, respectively. Large runoff volume errorsare shown in Fig. 5b, particularly for the 2005 event, whichis characterised by a peak value around 0.75 for a value ofLR/LW slightly exceeding two. The figure shows that thegeneral pattern of rainfall volume errors is transmitted to the
volume errors and that the rainfall volume errors generallymagnify through the rainfall-runoff modelling, as it is ex-pected after examining the structure of the SCS-CN runoffmodel.
The impact of reduced rainfall variability alone on runoffvolume errors is illustrated by Fig. 5c, where errors are re-ported after rainfall volume rescaling. The figure shows thaterrors are sharply reduced, and generally below 10%. Forone case (Aupa at Moggio) the runoff volume error slightlyexceeds 0.15.
The relationship between the normalised peak dischargeerror andLr/Lw, before rainfall volume rescaling, is re-ported in Fig. 5d. The pattern of peak discharge errors re-ported in this figure is consistent with that of runoff volumeerrors, as expected. The error may reach values up to 0.75for Lr/Lw slightly exceeding two. Peak discharge errors af-ter rainfall volume rescaling are reported in Fig. 5e. Thisfigure reveals that runoff volume errors explains the peak dis-charge errors in a number of cases, but not always. In threecases the peak discharge errors are comprised between 0.15and 0.22, and are not related to the corresponding volume
M. Sangati and M. Borga: Rainfall spatial resolution and flash flood modelling 583
errors, which are less than 0.05. Inspection of the simulatedhydrographs for these cases (not reported here for the sake ofbrevity) indicates that errors are related to differences in thepeak timing. This observation indicates that increasing therainfall aggregation length produces, in some cases, a largedistortion of the rainfall spatial distribution with respect tothe river network, hence resulting in considerable errors inthe shape of the simulated hydrographs (including peak val-ues and timing). This is not unexpected, because errors in therepresentation of the concentration of rainfall distribution interms of flow distance translate into a distorted timing distri-bution of the simulated runoff.
5 Summary and conclusions
This paper focuses on the analysis of the effects of spatialrainfall resolution on runoff simulation for an extreme flashflood event. The increasing availability of radar observa-tions at different spatial resolutions requires examination ofthe impact of using different aggregation lengths on hydro-logic modelling, with specific focus on highly variable flashflood-generating storms. Focus on extreme flash flood eventsleads, by necessity, to an event-based and opportunistic ap-proach, as opposed to driven by observations from carefullydesigned field campaigns in experimental watersheds. Ex-treme, flood-producing storms are spatially and temporallyrare and are seldom represented in the observations from ex-perimental watersheds. Accurate post event analyses playedan essential role in providing the data required for the presentstudy.
Our evaluations are based on combining fine space-timerainfall observations with a distributed hydrologic modelingbased on an empirical infiltration model and a network-basedrepresentation of hillslope and channel flow. Radar obser-vations and model analyses are used to evaluate the sensi-tivity of model results to spatial aggregation of rainfall atvarious catchment scales ranging from 10.5 km2 to 623 km2.Four rainfall spatial resolutions are considered, with grid sizeequal to 1-, 4-, 8- and 16-km. A dimensionless parametergiven by the ratio between length resolution and the squareroot of the watershed area (Lr/Lw) is used to describe thesensitivity of runoff model.
The analyses are focused on sensitivity of the simulatedpeak discharges to three different issues: i) rainfall spatialresolution; ii) rainfall volume errors and biased rainfall spa-tial variability; iii) distortion of rainfall spatial variabilitywith respect to the river network. The principal conclusionsof the study are summarized below.
1. Increasing theLr/Lw parameter induces large errors onthe simulated peak discharge. Maximum values of thepeak discharge error are up to 0.2 forLr/Lw equal to0.5 and to 0.33 forLr/Lw equal to 1.0. The error mayreach values up to 0.75 forLr/Lw exceeding 2.0. All
these errors are negative – i.e. the simulated peak dis-charge decreases by increasing theLr/Lw parameter.
2. An important error source related to spatial rainfall ag-gregation is the rainfall volume error caused by incor-rectly “smoothing rainfall volume” either into or outof the watershed. ForLr/Lw<1.0, around 50% of thepeak discharge error is due to the rainfall volume error.The remaining error is significantly controlled by the in-teraction between the attenuated and geometrically bi-ased rainfall spatial variability and the smoothing ef-fects of catchment characteristics.
3. We examined the role of river network geometry in theaveraging of space-time rainfall and on simulated peakdischarges after rescaling the rainfall fields to preserverainfall volumes. Increasing the resolution length maylead to a distorted geometry of the rainfall field withrespect to the river network. This is an important con-trol on peak discharge error – when rainfall volumes arepreserved.
Further work might determine whether the results obtainedin this investigation apply to other model formulations. Thepresent investigation has obtained illustrative examples ofhow rainfall variability, as filtered by using different spa-tial aggregation lengths, feeds through to variability in mod-elled runoff response at the catchment scale. More exten-sive investigations would strengthen this understanding andprovide additional guidance on the design of radar/raingaugenetworks for flow forecasting and the spatial resolution re-quirements for rainfall at different catchment scales.
Acknowledgements.The writers wish to thank three anonymousreviewers for the discussions and insight provided. This workwas supported by the European Community’s Sixth FrameworkProgramme through the grant to the budget of the Integrated ProjectFLOODsite, Contract GOCE-CT-2004-505420 and in part by theSTREP ProjectHYDRATE, Contract GOCE 037024. The RegionalMeteorological Observatory of Friuli-Venezia-Giulia is thanked formaking the radar dataset available and for the assistance in dataanalysis.
Edited by: G. RothReviewed by: L. Marchi and two anonymous Referees
References
Andreassian V., Perrin, C., Michel, C., Usart-Sanchez, I., andLavabre, J.: Impact of imperfect rainfall knowledge on the effi-ciency and the parameters of watershed models, J. Hydrol., 250,206–223, 2001.
Barancourt, C., Creutin, J. D., and Rivoirard, J.: A Method for De-lineating and Estimating Rainfall Fields, Water Resour. Res., 28,1133–1144, 1992.
Bell, V. A. and Moore, R. J.: The sensitivity of catchment runoffmodels to rainfall data at different spatial scales, Hydrol. Earth
Berne, A., Delrieu, G., Creutin, J. D., and Obled, C.: Temporal andspatial resolution of rainfall measurements required for urban hy-drology, J. Hydrol., 299, 166–179, 2004.
Bloschl G. and Sivapalan, M.: Scale issues in hydrological mod-elling: a review, Hydrol. Process., 9, 251–290 1995.
Borga, M., Tonelli, F., Moore, R. J., and Andrieu, H.: Long-termassessment of bias adjustment in radar rainfall estimation, WaterResour. Res., 38, 1226, doi:10.1029/2001WR000555, 2002.
Borga, M., Boscolo, P., Zanon, F., and Sangati, M.: Hydrometeoro-logical analysis of the August 29, 2003 flash flood in the easternItalian Alps, J. Hydrometeorol., 8, 1049–1067, 2007.
Borga, M., Gaume, E., Creutin, J. D., and Marchi, L.: Surveyingflash flood response: gauging the ungauged extremes, Hydrol.Process., 22(18), 3883–3885, 2008.
Creutin, J. D. and Borga, M.: Radar hydrology modifies the moni-toring of flash flood hazard, Hydrol. Process., 17(7), 1453–1456,2003.
Journel, A. G.: Non parametric estimation of spatial distributions,Math. Geol., 15, 445–467, 1983.
Kouwen, N. and Garland, G.: Resolution considerations in usingradar rainfall ata for flood forecasting, Can. J. Civ. Eng., 16, 279–289, 1989.
Lebel, T., Bastin, G., Obled, C., and Creutin, J.: On the Accuracyof Areal Rainfall Estimation: A Case Study, Water Resour. Res.,23, 2123–2134, 1987.
Naden P. S.: Spatial variability in flood estimation for large catch-ments: the exploitation of channel network structure, Hydrol.Sci. J., 37, 53–71, 1992.
Nicotina, L., Alessi-Celegon, E., Rinaldo, A., and Marani, M.: Onthe impact of rainfall patterns on the hydrologic response, WaterResour. Res., 44, W12401, doi:10.1029/2007WR006654, 2008.
Norbiato, D., Borga, M., Sangati, M., and Zanon, F.: Regional Fre-quency Analysis of Extreme Precipitation in the eastern ItalianAlps and the August 29, 2003 Flash Flood, J. Hydrol., 345(3–4),149–166, 2007.
Norbiato, D., Borga, M., Degli Esposti, S., Gaume, E., and An-quetin, S.: Flash flood warning based on rainfall depth-durationthresholds and soil moisture conditions: An assessment forgauged and ungauged basins, J. Hydrol., 362(3–4), 274–290,doi:10.1016/j.jhydrol.2008.08.023., 2008.
Obled, C., Wendling, J., and Beven, K.: Sensitivity of hydrologicalmodels to spatial rainfall patterns: An evaluation using observeddata, J. Hydrol., 159, 305–333, 1994.
Ogden, F. L. and Julien, P. Y.: Runoff model sensitivity to radarrainfall resolution, J. Hydrol., 158, 1–18, 1994.
Segond, M. L., Wheater, H. S., and Onof, C.: The significance ofspatial rainfall representation for flood runoff estimation: A nu-merical evaluation based on the Lee catchment, UK, J. Hydrol.,347, 116–131, 2007.
Smith, M. B., Seo, D. J., Koren, V. I., Reed, S. M., Zhang, Z.,Duan, Q., Moreda, F., and Cong, S.: The distributed model inter-comparison project (DMIP): motivation and experiment design,J. Hydrol., 298, 4–26, 2004.
US Department of Agriculture: Urban hydrology for small water-sheds, US Department of Agriculture Tech. Release, 55, 164 pp.,1986.
Winchell, M., Gupta, H., and Sorooshian, S.: On the Simulationof Infiltration- and Saturation-Excess Runoff Using Radar-BasedRainfall Estimates: Effects of Algorithm Uncertainty and PixelAggregation, Water Resour. Res., 34, 2655–2670, 1998.
Woods, R. A. and Sivapalan, M.: A synthesis of space-time vari-ability in storm response: Rainfall, runoff generation and rout-ing, Water Resour. Res., 35, 2469–2485, 1999.
Zhang, Y., Smith, J. A., and Baeck, M. L.: The hydrology and hy-drometeorology of extreme floods in the Great Plains of easternNebraska, Adv. Water Resour., 24, 1037–1050, 2001.