Proceedings of the 22 nd Association of Public Authority Surveyors Conference (APAS2017) Shoal Bay, New South Wales, Australia, 20-22 March 2017 48 Investigating an Anomaly in the Australian Height Datum at the NSW-Victoria Border in Barham/Koondrook Dean Watkins Richard Hogan & Co Surveyors [email protected]Volker Janssen Spatial Services NSW Department of Finance, Services & Innovation [email protected]Alex Woods Office of the Surveyor-General Victoria VIC Department of Environment, Land, Water & Planning [email protected]Thomas Grinter Spatial Services NSW Department of Finance, Services & Innovation [email protected]ABSTRACT The Australian Height Datum (AHD) is the national vertical datum for Australia. AHD continues to be a practical height datum that supports many surveying and engineering applications. However, several anomalies exist in the national height datum. One such anomaly was identified at the border between New South Wales and Victoria at Barham (NSW) and Koondrook (VIC). This discrepancy, of approximately 0.14 m, has major implications for surveyors and spatial professionals working on either side of the state border, as well as for flood management of the Murray River. This paper outlines the collaborative work performed by DFSI Spatial Services and the Office of the Surveyor- General Victoria to investigate and resolve this anomaly, using Global Navigation Satellite System (GNSS) technology and conventional 2-way levelling that included crossing several rivers. It was found that recent levelling conducted on both sides of the border and allowance for suspected mark instability at a national junction point in Victoria reduced the discrepancy to 0.066 m. The remaining anomaly can be attributed to the accumulation and distribution of error in the original data used to propagate AHD across Australia. Combining the NSW and Victorian level data into one contiguous adjustment, linking the junction points in Moulamein (NSW) and Kerang (VIC), will allow the remaining discrepancy to be distributed across the entire level run, ensuring much closer harmony between AHD marks on either side of the Murray River in Barham/Koondrook. KEYWORDS: AHD, levelling, GNSS, height datum anomaly, interstate collaboration. 1 INTRODUCTION Spatial Services, a unit of the NSW Department of Finance, Services & Innovation (DFSI), has a legislative, regulative responsibility to maintain the geodetic control network across the State on behalf of the Surveyor General of New South Wales. As such, DFSI Spatial Services
Transcript
Proceedings of the 22nd Association of Public Authority Surveyors Conference (APAS2017) Shoal Bay, New South Wales, Australia, 20-22 March 2017
48
Investigating an Anomaly in the Australian Height Datum at
ABSTRACT The Australian Height Datum (AHD) is the national vertical datum for Australia. AHD continues to be a practical height datum that supports many surveying and engineering applications. However, several anomalies exist in the national height datum. One such anomaly was identified at the border between New South Wales and Victoria at Barham (NSW) and Koondrook (VIC). This discrepancy, of approximately 0.14 m, has major implications for surveyors and spatial professionals working on either side of the state border, as well as for flood management of the Murray River. This paper outlines the collaborative work performed by DFSI Spatial Services and the Office of the Surveyor-General Victoria to investigate and resolve this anomaly, using Global Navigation Satellite System (GNSS) technology and conventional 2-way levelling that included crossing several rivers. It was found that recent levelling conducted on both sides of the border and allowance for suspected mark instability at a national junction point in Victoria reduced the discrepancy to 0.066 m. The remaining anomaly can be attributed to the accumulation and distribution of error in the original data used to propagate AHD across Australia. Combining the NSW and Victorian level data into one contiguous adjustment, linking the junction points in Moulamein (NSW) and Kerang (VIC), will allow the remaining discrepancy to be distributed across the entire level run, ensuring much closer harmony between AHD marks on either side of the Murray River in Barham/Koondrook. KEYWORDS: AHD, levelling, GNSS, height datum anomaly, interstate collaboration. 1 INTRODUCTION Spatial Services, a unit of the NSW Department of Finance, Services & Innovation (DFSI), has a legislative, regulative responsibility to maintain the geodetic control network across the State on behalf of the Surveyor General of New South Wales. As such, DFSI Spatial Services
Proceedings of the 22nd Association of Public Authority Surveyors Conference (APAS2017) Shoal Bay, New South Wales, Australia, 20-22 March 2017
49
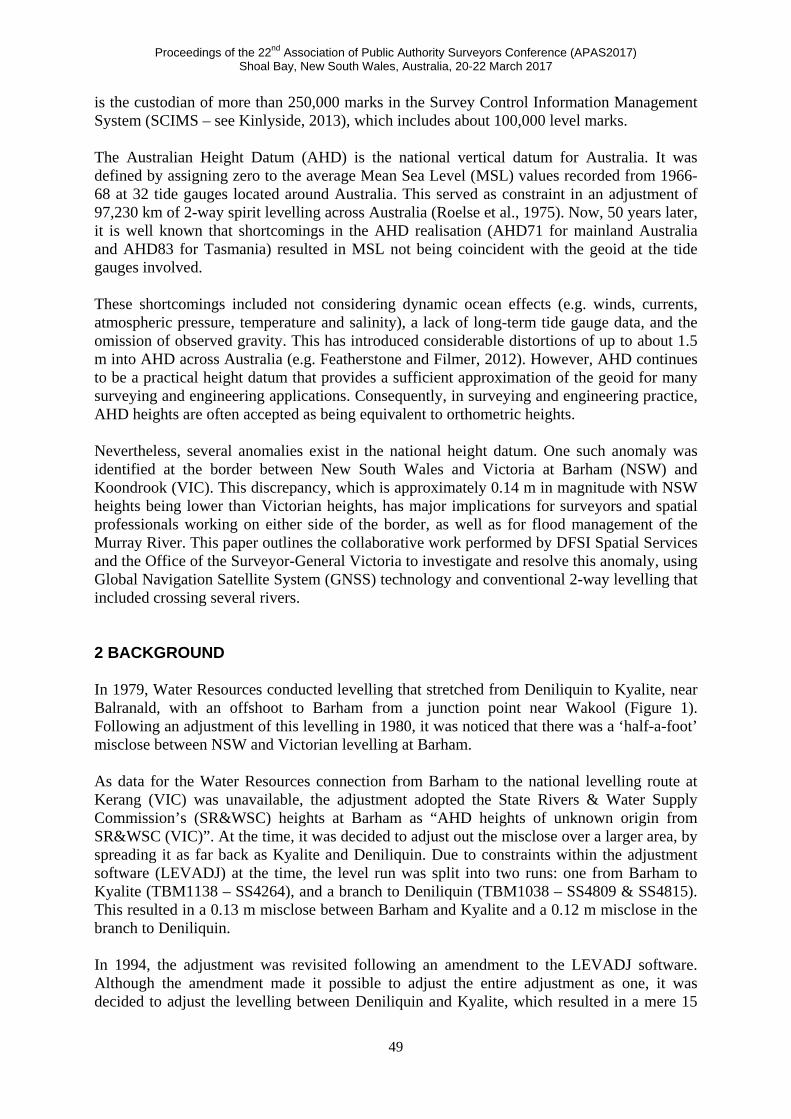
is the custodian of more than 250,000 marks in the Survey Control Information Management System (SCIMS – see Kinlyside, 2013), which includes about 100,000 level marks. The Australian Height Datum (AHD) is the national vertical datum for Australia. It was defined by assigning zero to the average Mean Sea Level (MSL) values recorded from 1966-68 at 32 tide gauges located around Australia. This served as constraint in an adjustment of 97,230 km of 2-way spirit levelling across Australia (Roelse et al., 1975). Now, 50 years later, it is well known that shortcomings in the AHD realisation (AHD71 for mainland Australia and AHD83 for Tasmania) resulted in MSL not being coincident with the geoid at the tide gauges involved. These shortcomings included not considering dynamic ocean effects (e.g. winds, currents, atmospheric pressure, temperature and salinity), a lack of long-term tide gauge data, and the omission of observed gravity. This has introduced considerable distortions of up to about 1.5 m into AHD across Australia (e.g. Featherstone and Filmer, 2012). However, AHD continues to be a practical height datum that provides a sufficient approximation of the geoid for many surveying and engineering applications. Consequently, in surveying and engineering practice, AHD heights are often accepted as being equivalent to orthometric heights. Nevertheless, several anomalies exist in the national height datum. One such anomaly was identified at the border between New South Wales and Victoria at Barham (NSW) and Koondrook (VIC). This discrepancy, which is approximately 0.14 m in magnitude with NSW heights being lower than Victorian heights, has major implications for surveyors and spatial professionals working on either side of the border, as well as for flood management of the Murray River. This paper outlines the collaborative work performed by DFSI Spatial Services and the Office of the Surveyor-General Victoria to investigate and resolve this anomaly, using Global Navigation Satellite System (GNSS) technology and conventional 2-way levelling that included crossing several rivers. 2 BACKGROUND In 1979, Water Resources conducted levelling that stretched from Deniliquin to Kyalite, near Balranald, with an offshoot to Barham from a junction point near Wakool (Figure 1). Following an adjustment of this levelling in 1980, it was noticed that there was a ‘half-a-foot’ misclose between NSW and Victorian levelling at Barham. As data for the Water Resources connection from Barham to the national levelling route at Kerang (VIC) was unavailable, the adjustment adopted the State Rivers & Water Supply Commission’s (SR&WSC) heights at Barham as “AHD heights of unknown origin from SR&WSC (VIC)”. At the time, it was decided to adjust out the misclose over a larger area, by spreading it as far back as Kyalite and Deniliquin. Due to constraints within the adjustment software (LEVADJ) at the time, the level run was split into two runs: one from Barham to Kyalite (TBM1138 – SS4264), and a branch to Deniliquin (TBM1038 – SS4809 & SS4815). This resulted in a 0.13 m misclose between Barham and Kyalite and a 0.12 m misclose in the branch to Deniliquin. In 1994, the adjustment was revisited following an amendment to the LEVADJ software. Although the amendment made it possible to adjust the entire adjustment as one, it was decided to adjust the levelling between Deniliquin and Kyalite, which resulted in a mere 15
Proceedings of the 22nd Association of Public Authority Surveyors Conference (APAS2017) Shoal Bay, New South Wales, Australia, 20-22 March 2017
50
mm misclose over about 185 km, and a spur of 28 km from TBM1038 to Barham (see Figure 1).
Figure 1: Water Resources levelling performed in 1979, highlighted in green.
It was also decided to not constrain the SR&WSC marks in Barham, as the connection to Victorian control was regarded as non-geodetic. This meant that the spur to Barham was unclosed and, as a result, the heights in Barham dropped by half a foot. This shift in the datum was noticed in the late 1990s by Russell Douthat of Laughlin Surveys, Barham, who was involved in supplying site levels for new dwellings in the Barham/Koondrook area. These site levels were then compared to existing flood level information, which he believed to be based on the pre-1994 height datum. Mr Douthat was concerned about their (and other surveyors’) legal liability in regards to problems arising from the changed datum as well as the inhomogeneity of the height datum between NSW and Victoria. After much correspondence with Mr Douthat in the late 1990s to early 2000s, it was attempted to source information on the levelling of the SR&WSC marks in Barham from Goulburn Murray Water. It was hoped that access to this levelling information would enable another readjustment of the levelling, constraining the height in Barham to Victorian derived AHD. Unfortunately, these attempts proved to be unsuccessful. The Department of Sustainability and Environment (VIC), which is now the Department of Environment, Land, Water & Planning, was subsequently contacted to attempt to resolve the discrepancy at Barham. While reduced levels (RLs) of a levelling connection from the national levelling route at Kerang to Barham were provided, the origin of the levelling information remained unknown. Although the existence of this discrepancy had been known for many years, nothing substantial was done to rectify the issue, primarily due to a lack of resources. However, in 2012/13, an opportunity to conduct some investigative levelling arose with the dual benefit of transferring the necessary knowledge base to younger survey staff at DFSI Spatial Services.
KYALITE
WAKOOL
VICTORIA
Proceedings of the 22nd Association of Public Authority Surveyors Conference (APAS2017) Shoal Bay, New South Wales, Australia, 20-22 March 2017
51
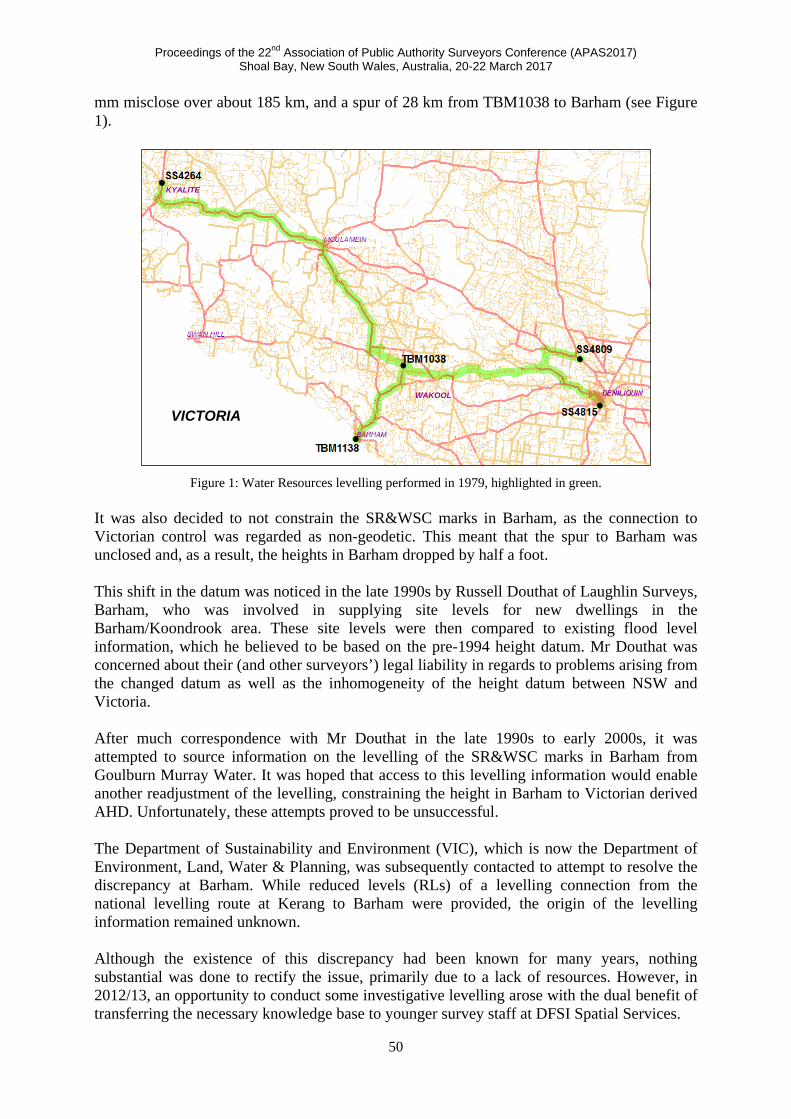
3 FIELD WORK AND OBSERVATIONS IN NSW 3.1 Initial Reconnaissance Initial reconnaissance was carried out on 20-24 February 2012, with the purpose of confirming the presence of the discrepancy and attempting to isolate the location of a potential error. Firstly, in order to confirm the discrepancy between NSW and Victoria, spirit levelling was conducted on either side of the state border. A simultaneous and reciprocal trigonometrical heighting methodology was adopted to transfer height across the Murray River (between PM22423 and PM148306). Figure 2 illustrates this initial stage of the reconnaissance survey.
Figure 2: Reconnaissance levelling performed in February 2012, indicated in blue.
The NSW-derived heights for the four marks in Koondrook were found to be about 0.11-0.15 m lower than the Victorian heights. Although not particularly rigorous, this survey indeed confirmed the discrepancy in the AHD between NSW and Victoria. Secondly, an extended GNSS survey was conducted in an attempt to identify the source of the error so that further investigative survey work could be better focused. Static GNSS baselines were measured to connect the levelling in Barham/Koondrook to the national levelling route at Kerang as well as to two marks (TBM1125 and TBM1119) along the original Water Resources levelling route. Figure 3 illustrates the observed GNSS network. Baseline lengths
Koondrook
Proceedings of the 22nd Association of Public Authority Surveyors Conference (APAS2017) Shoal Bay, New South Wales, Australia, 20-22 March 2017
52
ranged between 600 m and 15 km, and observation sessions lasted between 8 and 49 minutes, generally depending on baseline length. All 10 marks were also occupied using Real Time Kinematic (RTK).
By constraining the height of PM22420, in Barham, it was clearly evident that the discrepancy noticed at the border extended to the national levelling marks in Kerang with differences between NSW and Victorian heights again ranging from 0.09 m to 0.13 m. At the same time, the derived heights of the Water Resources marks agreed with original levelling data to within expected values based on the methodology applied and the soil composition in the area. This led to the conclusion that the error could lie within the original Water Resources levelling, most likely in the 28 km spur from TBM1038 to Barham. Attempts were made to locate TBM1038 (nail in post) and other benchmarks near this junction but were unsuccessful. 3.2 Secondary Reconnaissance After the initial reconnaissance uncovered that the height datum discrepancy at the NSW-Victoria border was likely caused by an error within the original levelling from Wakool to Barham, it was decided that re-levelling the offshoot to Barham was necessary to resolve the discrepancy in the AHD. However, as the benchmarks at the junction of the spur to Barham (TBM1038) were not located in the initial reconnaissance, it was decided that in order to re-establish a reliable datum it would be necessary to level to Barham from as far back as Moulamein. Office investigations also noted a third-order levelling connection from TS3479 (also known as
VICTORIA
Kerang
Proceedings of the 22nd Association of Public Authority Surveyors Conference (APAS2017) Shoal Bay, New South Wales, Australia, 20-22 March 2017
53
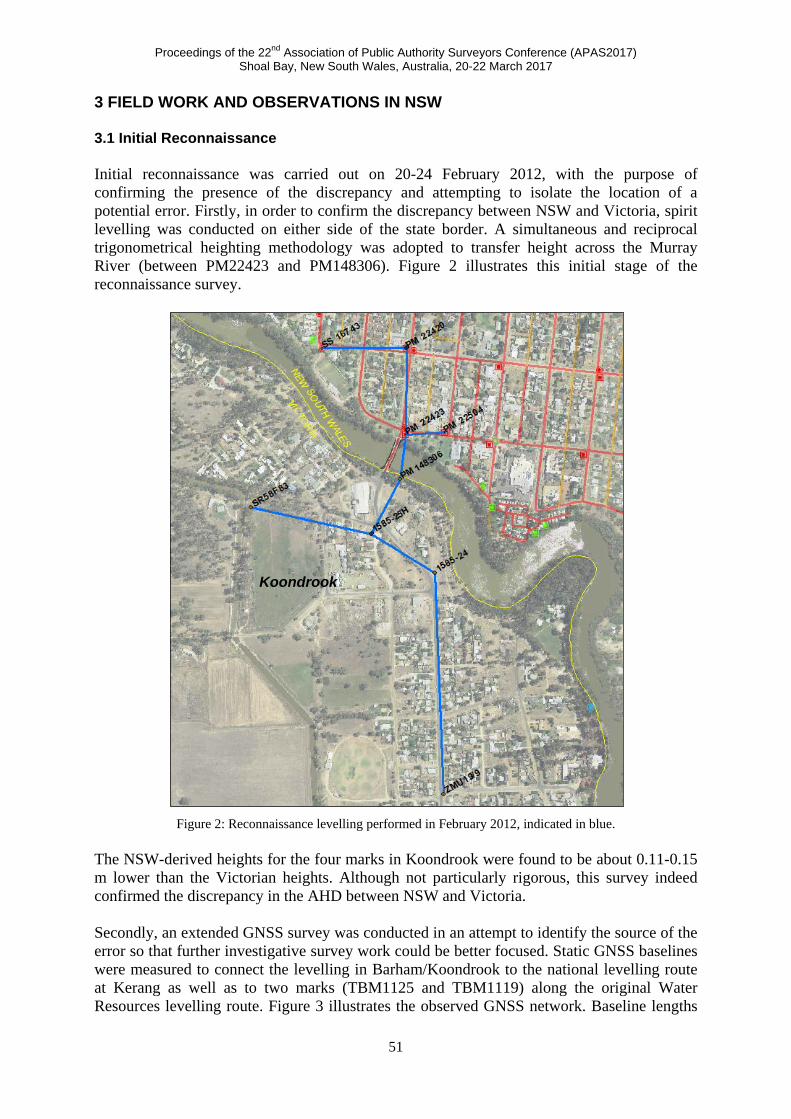
national junction point 1873), 8 km north of Moulamein, to the national levelling route between Hay and Balranald. A secondary reconnaissance was conducted on 12-17 August 2013 with the purpose of locating the original Water Resources benchmarks and NSW state control marks (PMs and SSMs) between Moulamein and Barham. Each mark was then coordinated horizontally at the sub-metre level using Differential GPS (DGPS) technology in order to facilitate easy future access. During this reconnaissance, it was also decided to level between TS3479 and SS16734 (in Moulamein) to confirm the original Water Resources levelling datum at Moulamein. Due to time constraints the levelling was only performed one-way using a Leica DNA03 and fiberglass telescopic staff. The resulting height difference between TS3479 and SS16734 showed 1 mm agreement with published values. 3.3 Levelling Survey The levelling methodology adopted follows the recommendations given in ICSM (2007, 2014). Second-order levelling was conducted in two separate stages: the first on 16-27 September 2013 and the second on 4-9 November 2013. Levelling was performed by two field parties of three members, each using a Leica DNA03 digital level on a fixed-leg tripod sighting to two calibrated 3-metre rigid invar staves. The two field parties levelled in opposite directions to one another. The verticality of the spot bubbles on the invar staves was checked prior to each of the levelling trips and no adjustments were needed. The collimation of the digital level was checked daily prior to the commencement of each day’s levelling via a two-peg test using the ‘A x x B’ method, i.e. using two instrument setups between the two staff positions (Figure 4). The results of the collimation check were stored in the instrument each day.
Figure 4: Two-peg test setup following the ‘A x x B’ method (Leica Geosystems, 2006).
All levelling observations were made using the ‘B-F-F-B’ methodology (i.e. backsight-foresight-foresight-backsight). Each recorded observation was the mean of five individual readings with a standard deviation not exceeding 0.3 mm per 20 m. The two height differences obtained at each setup could not differ by more than 0.3 mm or a full re-measure was undertaken. Despite temperature being observed at the terminals of each bay (section) by one of the field parties using a Kestrel digital weather tracker, observations were not corrected for temperature due to the relatively flat topography.
Proceedings of the 22nd Association of Public Authority Surveyors Conference (APAS2017) Shoal Bay, New South Wales, Australia, 20-22 March 2017
54
The field work presented several challenges (Figure 5). For example, heat shimmer forced the survey parties to include unscheduled breaks on several days, while wind caused significant concerns at other times with sighting distances being considerably shortened as a result. Backsight and foresight distances were kept equal (generally ±2 m) and varied between 5 m and 60 m.
Figure 5: Levelling field work in 2013.
In order to level across the Edward River at Moulamein, simultaneous and reciprocal observations were made at each side of the river (Figure 6). Five sets of height differences (B-F-F-B) were measured on each side of the river by both levelling parties and the mean height difference was taken. For all other creek and river crossings between Moulamein and Barham, conventional levelling techniques were adopted. This generally included one staff position on the bridge, placed at the location of a supporting pillar to minimise bridge movement during the observation. It was found that the resulting standard deviations were comparable to the remainder of the level run.
Figure 6: Simultaneous and reciprocal levelling across a river. L1 and L2 denote the instrument setups, while A
and B denote the staff locations (Moffitt and Bouchard, 1982). At the conclusion of each day’s levelling, the misclose between the fore and back runs of each bay was checked to determine if it was within second-order specifications, i.e. misclose < 8*√k, where k is the distance of the level bay in kilometres and the misclose is obtained in millimetres (ICSM, 2007). All bays satisfied this limit and no re-measures were necessary. For a discussion of the terms Class and Order, the reader is referred to ICSM (2007) and Dickson (2012). While it is acknowledged that ICSM (2007) has recently been superseded by ICSM (2014), this update does not affect the outcome of this paper.
Proceedings of the 22nd Association of Public Authority Surveyors Conference (APAS2017) Shoal Bay, New South Wales, Australia, 20-22 March 2017
55
The levelling began at TS3479 (LCL3), 8 km north of Moulamein, and finished at PM22423 in Barham, totalling approximately 85 km. This levelling route coincides with part of two segments of the original Water Resources levelling: between SS16734 and TBM1043 and between TBM1120 and TBM1132. The levelling also incorporated a total of 41 state control marks, of which 14 had an existing vertical Class and Order of LDL4. In addition, a variety of existing benchmarks were observed, which were assigned Miscellaneous Mark numbers (28 marks in total). Figure 7 illustrates the levelling route followed in this survey, between TS3479 and PM22423 (highlighted in blue). Also shown is the Water Resources levelling observed in 1979 (highlighted in green), which indicates where the two levelling routes overlap.
Figure 7: Levelling route taken in the 2013 survey (blue), and the original 1979 levelling (green).
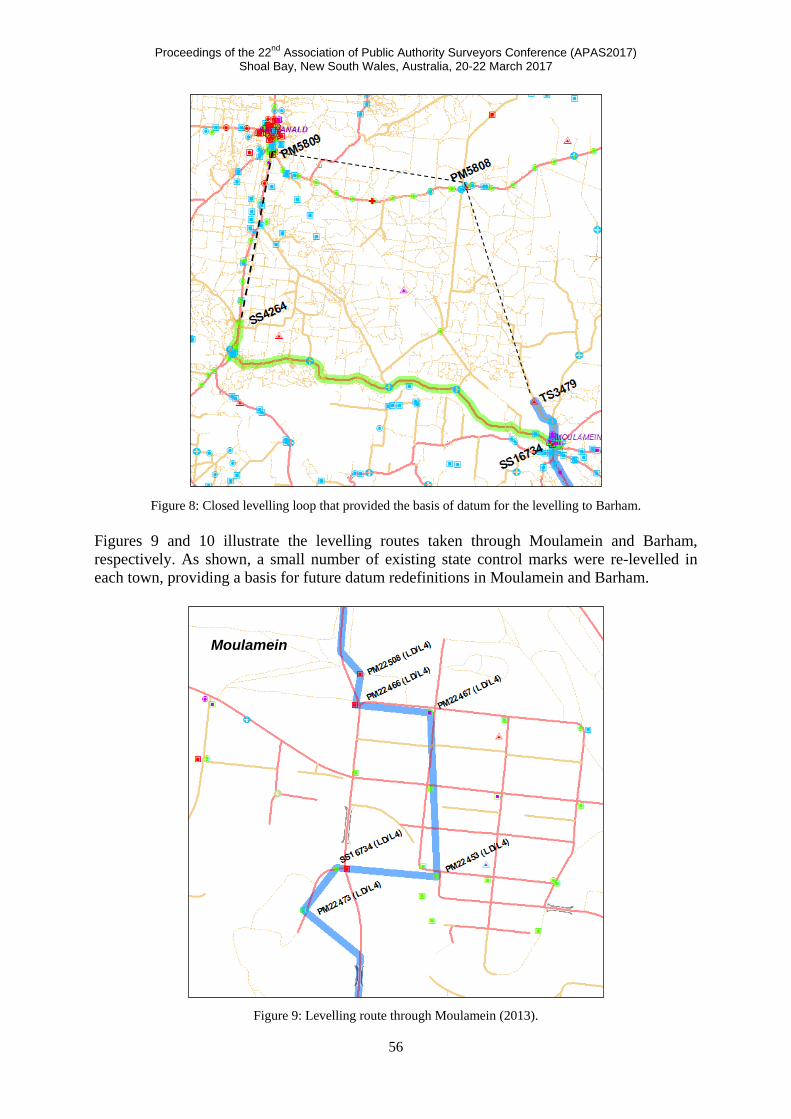
4 ADJUSTMENT STRATEGY AND NETWORK GEOMETRY The results from the second-order levelling connection between TS3479 and SS16734 in Moulamein again agreed to control to within 1 mm. Importantly, this section closed a large loop of existing third-order levelling: SS16734 – SS4264 – PM5809 – PM5808 – TS3479 – SS16734 (Figure 8). This closed loop of approximately 183 km had an overall misclose of 10 mm, comfortably meeting second-order specifications. This agreement within the loop further supported the basis of the datum for this adjustment. The levelling network for this adjustment (see Figure 7) was simply a linear 85 km levelling route from Moulamein to Barham. The heights of two marks, TS3479 (LCL3) and SS16734 (LDL4), were constrained in the adjustment, while the other end of the levelling run in Barham was left unconstrained. This allowed us to establish a new datum in Barham to confirm either the NSW or Victorian levelling at the border.
VICTORIA
Proceedings of the 22nd Association of Public Authority Surveyors Conference (APAS2017) Shoal Bay, New South Wales, Australia, 20-22 March 2017
56
Figure 8: Closed levelling loop that provided the basis of datum for the levelling to Barham.
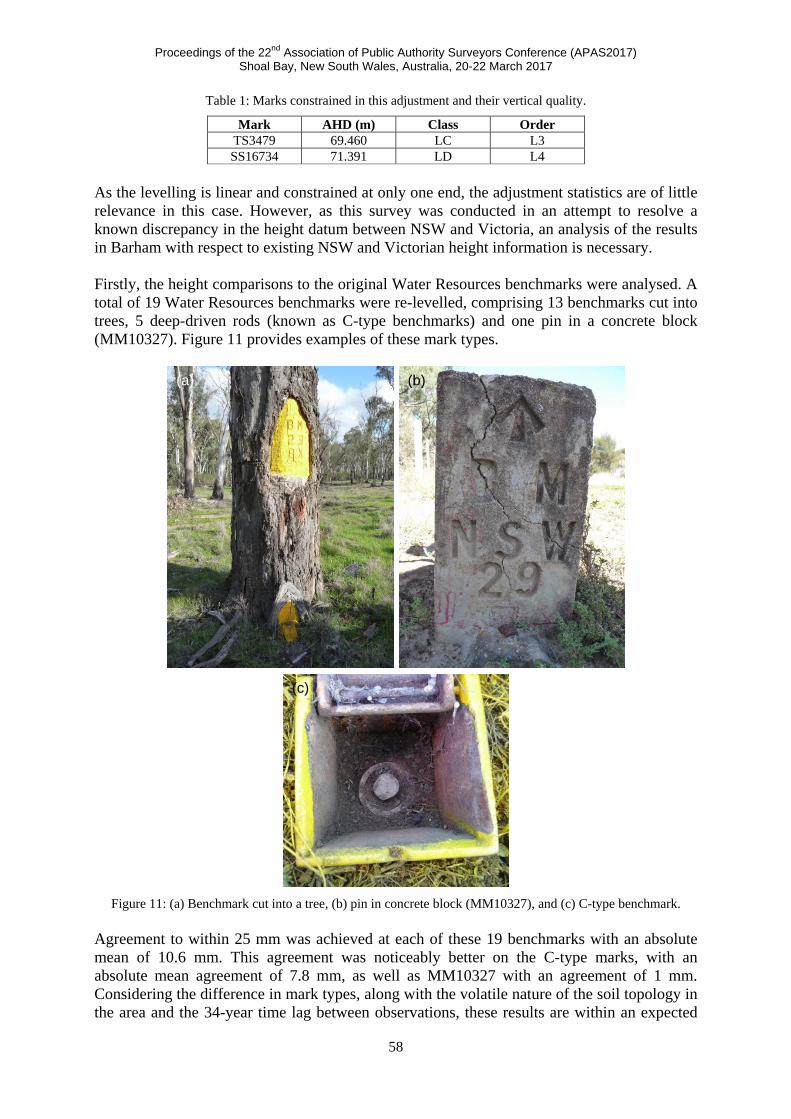
Figures 9 and 10 illustrate the levelling routes taken through Moulamein and Barham, respectively. As shown, a small number of existing state control marks were re-levelled in each town, providing a basis for future datum redefinitions in Moulamein and Barham.
Figure 9: Levelling route through Moulamein (2013).
Moulamein
Proceedings of the 22nd Association of Public Authority Surveyors Conference (APAS2017) Shoal Bay, New South Wales, Australia, 20-22 March 2017
57
Figure 10: Levelling route through Barham (2013).
5 ADJUSTMENT RESUTS Generally, a minimally constrained network adjustment is performed to evaluate the quality of the observations and check the data for outliers. This is then followed by a constrained adjustment in order to fit the new observations into the existing fabric and determine new or updated coordinates and/or heights for a number of marks to improve the control network. 5.1 Minimally Constrained Adjustment Results As the network geometry of the levelling performed is linear, a minimally constrained adjustment is unnecessary because the residuals would all be zero. Instead, the quality of the levelling was assessed through the comparison between fore and back runs. The overall misclose between fore and back runs was 6.1 mm over 85 km, which is substantially below the second-order allowable misclose of 73.9 mm. The maximum difference between any fore and back run was 3.4 mm in the 1.83 km bay between PM80590 and PM80591, which still comfortably met the second-order limit of 10.8 mm. The average difference between fore and back runs for each bay was 0.6 mm. This analysis, coupled with the measurement techniques adopted, confirmed unequivocally that the levelling met Class LB standards (ICSM, 2007). 5.2 Constrained Adjustment Results Table 1 lists the two marks in Moulamein that were constrained in the final adjustment.
Barham
Proceedings of the 22nd Association of Public Authority Surveyors Conference (APAS2017) Shoal Bay, New South Wales, Australia, 20-22 March 2017
58
Table 1: Marks constrained in this adjustment and their vertical quality. Mark AHD (m) Class Order
TS3479 69.460 LC L3 SS16734 71.391 LD L4
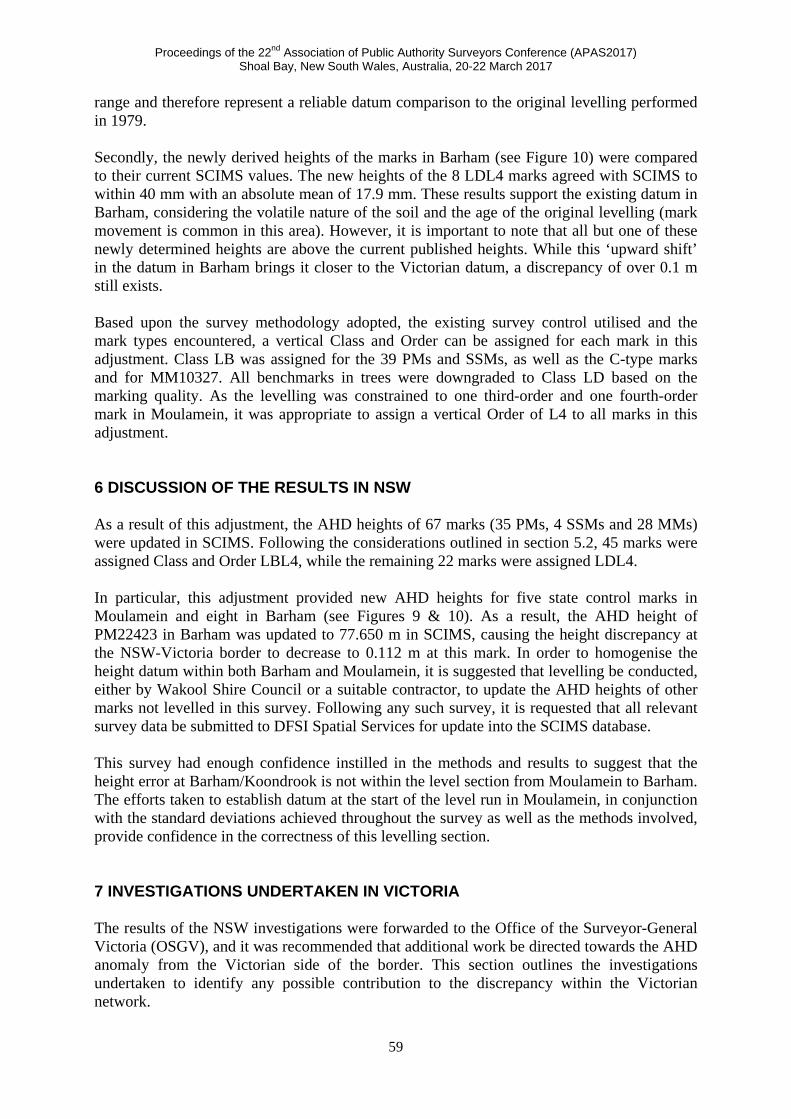
As the levelling is linear and constrained at only one end, the adjustment statistics are of little relevance in this case. However, as this survey was conducted in an attempt to resolve a known discrepancy in the height datum between NSW and Victoria, an analysis of the results in Barham with respect to existing NSW and Victorian height information is necessary. Firstly, the height comparisons to the original Water Resources benchmarks were analysed. A total of 19 Water Resources benchmarks were re-levelled, comprising 13 benchmarks cut into trees, 5 deep-driven rods (known as C-type benchmarks) and one pin in a concrete block (MM10327). Figure 11 provides examples of these mark types.
Figure 11: (a) Benchmark cut into a tree, (b) pin in concrete block (MM10327), and (c) C-type benchmark.
Agreement to within 25 mm was achieved at each of these 19 benchmarks with an absolute mean of 10.6 mm. This agreement was noticeably better on the C-type marks, with an absolute mean agreement of 7.8 mm, as well as MM10327 with an agreement of 1 mm. Considering the difference in mark types, along with the volatile nature of the soil topology in the area and the 34-year time lag between observations, these results are within an expected
(a) (b)
(c)
Proceedings of the 22nd Association of Public Authority Surveyors Conference (APAS2017) Shoal Bay, New South Wales, Australia, 20-22 March 2017
59
range and therefore represent a reliable datum comparison to the original levelling performed in 1979. Secondly, the newly derived heights of the marks in Barham (see Figure 10) were compared to their current SCIMS values. The new heights of the 8 LDL4 marks agreed with SCIMS to within 40 mm with an absolute mean of 17.9 mm. These results support the existing datum in Barham, considering the volatile nature of the soil and the age of the original levelling (mark movement is common in this area). However, it is important to note that all but one of these newly determined heights are above the current published heights. While this ‘upward shift’ in the datum in Barham brings it closer to the Victorian datum, a discrepancy of over 0.1 m still exists. Based upon the survey methodology adopted, the existing survey control utilised and the mark types encountered, a vertical Class and Order can be assigned for each mark in this adjustment. Class LB was assigned for the 39 PMs and SSMs, as well as the C-type marks and for MM10327. All benchmarks in trees were downgraded to Class LD based on the marking quality. As the levelling was constrained to one third-order and one fourth-order mark in Moulamein, it was appropriate to assign a vertical Order of L4 to all marks in this adjustment. 6 DISCUSSION OF THE RESULTS IN NSW As a result of this adjustment, the AHD heights of 67 marks (35 PMs, 4 SSMs and 28 MMs) were updated in SCIMS. Following the considerations outlined in section 5.2, 45 marks were assigned Class and Order LBL4, while the remaining 22 marks were assigned LDL4. In particular, this adjustment provided new AHD heights for five state control marks in Moulamein and eight in Barham (see Figures 9 & 10). As a result, the AHD height of PM22423 in Barham was updated to 77.650 m in SCIMS, causing the height discrepancy at the NSW-Victoria border to decrease to 0.112 m at this mark. In order to homogenise the height datum within both Barham and Moulamein, it is suggested that levelling be conducted, either by Wakool Shire Council or a suitable contractor, to update the AHD heights of other marks not levelled in this survey. Following any such survey, it is requested that all relevant survey data be submitted to DFSI Spatial Services for update into the SCIMS database. This survey had enough confidence instilled in the methods and results to suggest that the height error at Barham/Koondrook is not within the level section from Moulamein to Barham. The efforts taken to establish datum at the start of the level run in Moulamein, in conjunction with the standard deviations achieved throughout the survey as well as the methods involved, provide confidence in the correctness of this levelling section. 7 INVESTIGATIONS UNDERTAKEN IN VICTORIA The results of the NSW investigations were forwarded to the Office of the Surveyor-General Victoria (OSGV), and it was recommended that additional work be directed towards the AHD anomaly from the Victorian side of the border. This section outlines the investigations undertaken to identify any possible contribution to the discrepancy within the Victorian network.
Proceedings of the 22nd Association of Public Authority Surveyors Conference (APAS2017) Shoal Bay, New South Wales, Australia, 20-22 March 2017
60
7.1 Levelling from Kerang to Barham/Koondrook In 2006, OSGV surveyors conducted 2-way levelling, using third-order techniques, from Kerang to Barham/Koondrook (Figure 12). This level run established AHD heights on Victorian Survey Control Network (SCN) marks, spaced approximately every 1,600 m along the Kerang-Koondrook Road, and provided a direct level link from the Victorian Levelling Network (VLN) to these marks. This levelling survey included a level connection across the Murray River to PM22423 (1585-26) in Barham, which was the end point of the NSW levelling conducted in 2013 (see section 3.3).
Figure 12: Victorian Levelling Network from Kerang to Barham/Koondrook.
In 2016, the 2006 Victorian level run from Kerang to Barham was re-investigated. The original level book (1585) was examined and it was confirmed that all the observed height differences in the levelling adjustment matched those observed in the field (allowing for scale factor corrections). As part of the 2006 level run, several marks in Kerang were check-levelled to confirm the datum, and it was noted that there was difficulty in confirming the datum in Kerang due to suspected mark instability in the area. It was decided to adopt the national junction point in Kerang (500-8) as the datum for the level run using the original 1968 value. Figure 13 illustrates the levelling around national junction point 500-8. However, examination of the 2006 check-levelling observations indicated that the national junction point in Kerang (500-8) was the mark showing the most mark movement (notwithstanding some apparent movement in all marks). Marks 500-6 and 500-10 showed reasonable agreement and stability (6 mm), whereas the marks in between (i.e. 500-7, 500-8, A97-15) appear to have moved by 20-40 mm in height. A comparison of the levelling observations from 1968 and 2006 is shown in Table 2.
Kerang
Barham / Koondrook
500-8
PM22423 (1585-26)
Proceedings of the 22nd Association of Public Authority Surveyors Conference (APAS2017) Shoal Bay, New South Wales, Australia, 20-22 March 2017
61
Figure 13: Victorian Levelling Network centred on Kerang with national junction point 500-8 highlighted.
Table 2: Comparison of levelled height differences observed in Kerang in 1968 and 2006.
A97-15 500-10 0.786 0.805 0.019 The changes seen in the height differences indicate that mark 500-8 had dropped by approximately 40 mm relative to marks 500-6 and 500-10. Therefore, it seems unwise to constrain the Koondrook level run to this potentially unstable mark, despite its status as a national junction point. Victoria has a contiguous, state-wide levelling network (VLN) adjustment that contains all the levelling observations collected across Victoria by Geodetic Survey for the propagation of AHD across the State. The VLN adjustment includes all the level observations between marks along the level sections running between the junction points and making up the National Levelling Network (NLN). Additional levelling observations collected for the extension of AHD and the establishment of new AHD SCN marks are also included in the adjustment. The national junction points serve as constraint in the adjustment, with every junction point constrained to the AHD value derived from the NLN adjustment with an uncertainty of 5 mm. The assembly of all the levelling observations into one state-wide adjustment enabled the identification of various blunders in the original levelling observations. The 2006 Kerang to Barham/Koondrook levelling observations are included in the VLN adjustment. Due to the nature of the adjustment, the level run is constrained to the national
Kerang
Proceedings of the 22nd Association of Public Authority Surveyors Conference (APAS2017) Shoal Bay, New South Wales, Australia, 20-22 March 2017
62
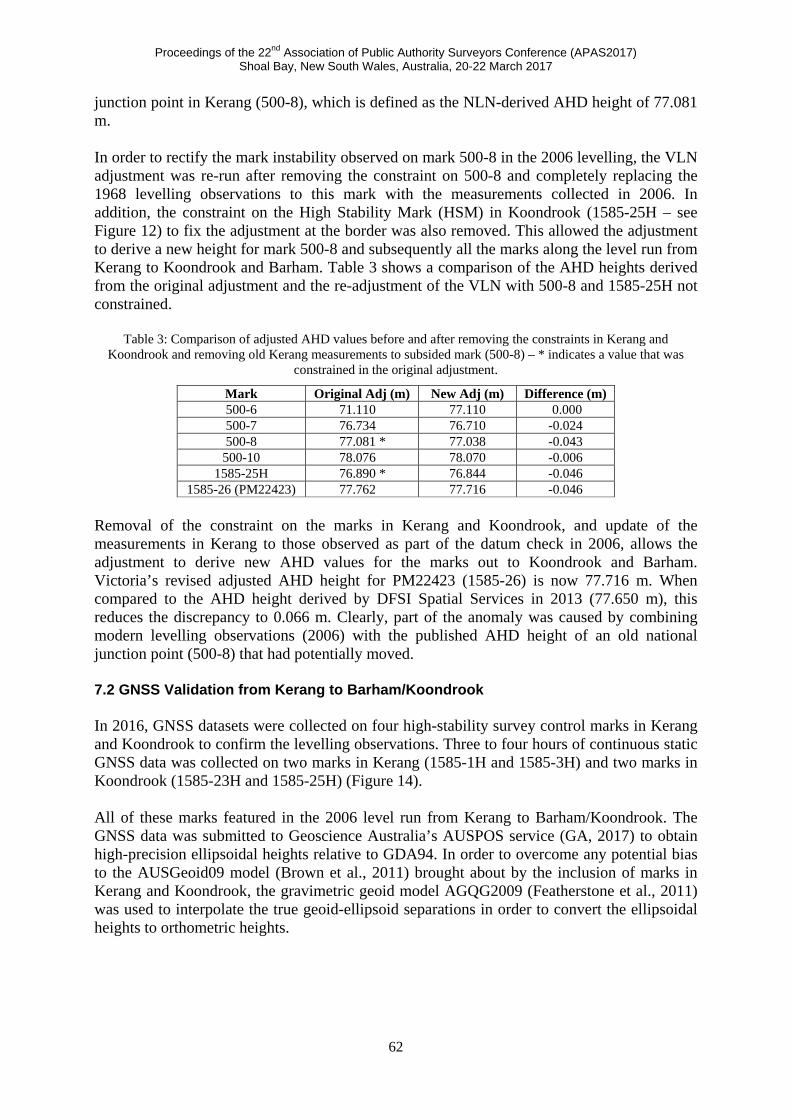
junction point in Kerang (500-8), which is defined as the NLN-derived AHD height of 77.081 m. In order to rectify the mark instability observed on mark 500-8 in the 2006 levelling, the VLN adjustment was re-run after removing the constraint on 500-8 and completely replacing the 1968 levelling observations to this mark with the measurements collected in 2006. In addition, the constraint on the High Stability Mark (HSM) in Koondrook (1585-25H – see Figure 12) to fix the adjustment at the border was also removed. This allowed the adjustment to derive a new height for mark 500-8 and subsequently all the marks along the level run from Kerang to Koondrook and Barham. Table 3 shows a comparison of the AHD heights derived from the original adjustment and the re-adjustment of the VLN with 500-8 and 1585-25H not constrained.
Table 3: Comparison of adjusted AHD values before and after removing the constraints in Kerang and Koondrook and removing old Kerang measurements to subsided mark (500-8) – * indicates a value that was
constrained in the original adjustment. Mark Original Adj (m) New Adj (m) Difference (m) 500-6 71.110 77.110 0.000 500-7 76.734 76.710 -0.024 500-8 77.081 * 77.038 -0.043
1585-26 (PM22423) 77.762 77.716 -0.046 Removal of the constraint on the marks in Kerang and Koondrook, and update of the measurements in Kerang to those observed as part of the datum check in 2006, allows the adjustment to derive new AHD values for the marks out to Koondrook and Barham. Victoria’s revised adjusted AHD height for PM22423 (1585-26) is now 77.716 m. When compared to the AHD height derived by DFSI Spatial Services in 2013 (77.650 m), this reduces the discrepancy to 0.066 m. Clearly, part of the anomaly was caused by combining modern levelling observations (2006) with the published AHD height of an old national junction point (500-8) that had potentially moved. 7.2 GNSS Validation from Kerang to Barham/Koondrook In 2016, GNSS datasets were collected on four high-stability survey control marks in Kerang and Koondrook to confirm the levelling observations. Three to four hours of continuous static GNSS data was collected on two marks in Kerang (1585-1H and 1585-3H) and two marks in Koondrook (1585-23H and 1585-25H) (Figure 14). All of these marks featured in the 2006 level run from Kerang to Barham/Koondrook. The GNSS data was submitted to Geoscience Australia’s AUSPOS service (GA, 2017) to obtain high-precision ellipsoidal heights relative to GDA94. In order to overcome any potential bias to the AUSGeoid09 model (Brown et al., 2011) brought about by the inclusion of marks in Kerang and Koondrook, the gravimetric geoid model AGQG2009 (Featherstone et al., 2011) was used to interpolate the true geoid-ellipsoid separations in order to convert the ellipsoidal heights to orthometric heights.
Proceedings of the 22nd Association of Public Authority Surveyors Conference (APAS2017) Shoal Bay, New South Wales, Australia, 20-22 March 2017
63
Figure 14: SCN marks observed in 2016 with GNSS in Kerang and Koondrook to verify the 2006 levelling
observations. Orthometric height differences (undistorted by any anomalies in AHD) were then determined between the marks and compared to the levelled height differences observed in 2006 (Table 4). The GNSS-derived height differences closely agree with the levelled height differences, indicating that there are no significant errors in the 2006 level run from Kerang to Barham/Koondrook.
Table 4: Comparison of height differences observed in the 2006 levelling and those observed using GNSS and the gravimetric geoid model in 2016.
From To ΔHLevel(2006) (m) ΔHGNSS(2016) (m) Difference (m) 1585-1H 1585-3H -0.890 -0.886 0.004 1585-3H 1585-23H 0.572 0.588 0.016
1585-23H 1585-25H -0.362 -0.366 -0.004 7.3 Assessment of the National Levelling Network The levelling and GNSS investigation carried out by DFSI Spatial Services from Moulamein to Barham confirmed that there were no apparent discrepancies in the NSW levelling data. Similarly, the levelling and GNSS investigation conducted by OSGV from Kerang to Barham/Koondrook provides no reason to doubt the levelling measurements in Victoria. If anything, there is an apparent error in the original 1966 NLN height for 500-8 of approximately 40-50 mm. Whether this is the result of subsidence or error in the original NLN remains unknown.
VICTORIA
NSW
Kerang
Proceedings of the 22nd Association of Public Authority Surveyors Conference (APAS2017) Shoal Bay, New South Wales, Australia, 20-22 March 2017
64
Based on the 2006 levelling and 2016 GNSS surveys and subsequent revision of the Victorian levelling adjustment (i.e. removal of the errant 500-8 constraint), it is concluded that the remaining 0.066 m AHD height discrepancy between the NSW and Victorian levelling observations, meeting at Barham, is attributed to the accumulation and distribution of error in the original 1966 levelling observations across the NLN. The NLN consists of level sections running across the entire Australian continent. These level sections begin and end at junction points, often located at the intersection of major highways. Each level section is represented by a single height-difference observation from junction point to junction point, with an estimate of uncertainty. These height differences were obtained by combining the observed levelling height differences between survey marks along the level section and an uncertainty estimate derived based on the distance between junction points. The NLN was constrained to 30 tide gauges located around the coast of mainland Australia and two tide gauges along the coast of Tasmania, where MSL was fixed to 0.000 m. Figure 15 illustrates the NLN across Australia, while Figure 16 shows the NLN over the area of interest.
Figure 15: National Levelling Network across Australia.
Proceedings of the 22nd Association of Public Authority Surveyors Conference (APAS2017) Shoal Bay, New South Wales, Australia, 20-22 March 2017
65
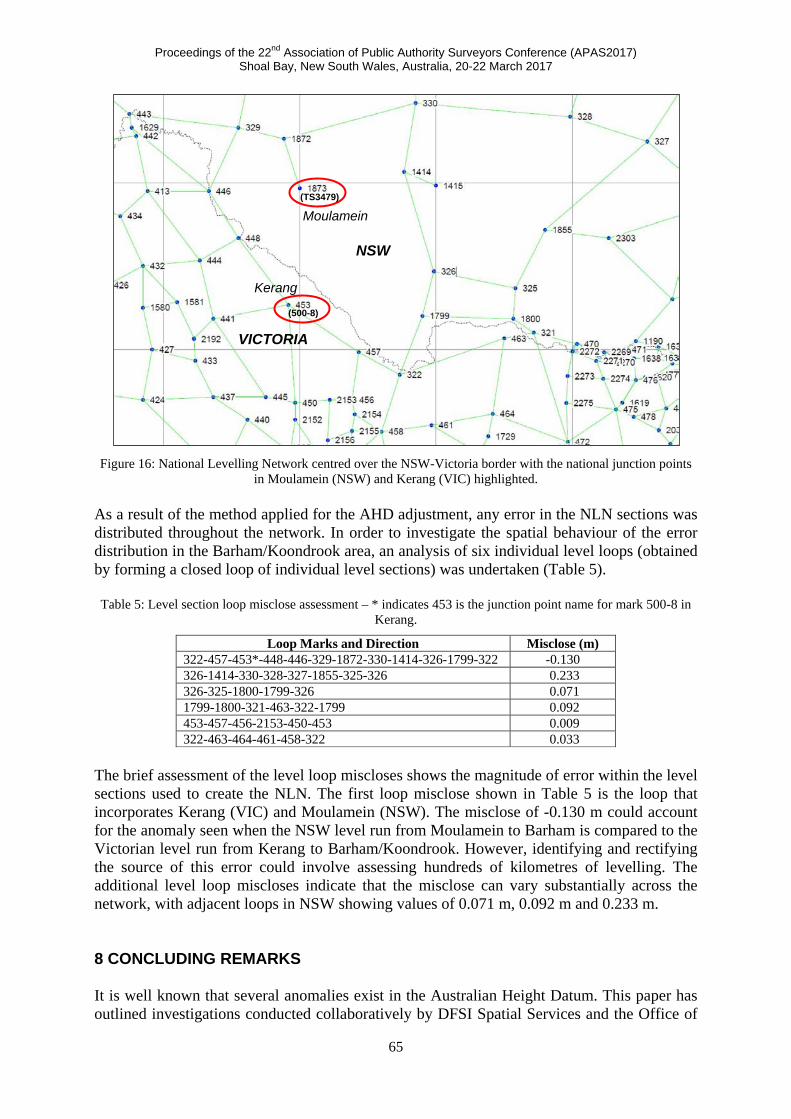
Figure 16: National Levelling Network centred over the NSW-Victoria border with the national junction points
in Moulamein (NSW) and Kerang (VIC) highlighted. As a result of the method applied for the AHD adjustment, any error in the NLN sections was distributed throughout the network. In order to investigate the spatial behaviour of the error distribution in the Barham/Koondrook area, an analysis of six individual level loops (obtained by forming a closed loop of individual level sections) was undertaken (Table 5). Table 5: Level section loop misclose assessment – * indicates 453 is the junction point name for mark 500-8 in
The brief assessment of the level loop miscloses shows the magnitude of error within the level sections used to create the NLN. The first loop misclose shown in Table 5 is the loop that incorporates Kerang (VIC) and Moulamein (NSW). The misclose of -0.130 m could account for the anomaly seen when the NSW level run from Moulamein to Barham is compared to the Victorian level run from Kerang to Barham/Koondrook. However, identifying and rectifying the source of this error could involve assessing hundreds of kilometres of levelling. The additional level loop miscloses indicate that the misclose can vary substantially across the network, with adjacent loops in NSW showing values of 0.071 m, 0.092 m and 0.233 m. 8 CONCLUDING REMARKS It is well known that several anomalies exist in the Australian Height Datum. This paper has outlined investigations conducted collaboratively by DFSI Spatial Services and the Office of
NSW
VICTORIA
Kerang
Moulamein
(500-8)
(TS3479)
Proceedings of the 22nd Association of Public Authority Surveyors Conference (APAS2017) Shoal Bay, New South Wales, Australia, 20-22 March 2017
66
the Surveyor-General Victoria into one such anomaly, which initially amounted to approximately 0.14 m and occurs at the NSW-Victoria border between Barham and Koondrook. Understandably, this discrepancy has major implications for surveyors and spatial professionals working on either side of the state border, as well as for flood management of the Murray River. Recent survey work performed by DFSI Spatial Services utilised GNSS technology and 85 km of conventional, second-order, 2-way levelling conducted in 2013 to identify the source of the anomaly. It was found that the levelling connections are consistent. Based on the levelling conducted in 2013, the AHD height of PM22423 in Barham was updated to 77.650 m, causing the height discrepancy between NSW and Victoria to decrease to 0.112 m at this mark. Examining third-order levelling data collected in 2006 and GNSS data observed in 2016, the Office of the Surveyor-General Victoria revealed that issues arise when National Levelling Network (NLN) junction points are constrained and new levelling observations are taken between junction points. In this case, the Moulamein junction point (1873 or TS3479) was constrained at 69.460 m and AHD propagated along the level run to Barham, and the Kerang junction point (453 or 500-8) was constrained at 77.081 m and AHD propagated along the level run to Barham. NSW and Victoria are both confident in the quality of these level runs, with GNSS observations confirming height differences. The Office of the Surveyor-General Victoria modified the constraint in Kerang to better fit the 2006 levelling and to allow for the suspected mark instability at the junction point. This accounts for 0.046 m of the discrepancy at Barham. Therefore, the remaining 0.066 m discrepancy is most likely located within the NLN – and is most likely present in both NSW and Victoria. Due to the nature of the original AHD levelling adjustment, it is difficult to identify the precise location of the error source because generally it is distributed across many level sections throughout the network. In order to rectify this problem in a conclusive way, the NSW and Victorian level run data will be combined into a contiguous adjustment, linking the junction points in Moulamein (1873) and Kerang (453). This will allow the 0.066 m discrepancy in the NLN to be distributed across the entire level run, and ensure much closer harmony between AHD heights on either side of the Murray River in Barham/Koondrook. This paper is also a showcase example of collaboration between the state government departments responsible for maintaining survey control across NSW and Victoria. Together, DFSI Spatial Services and the Office of the Surveyor-General Victoria have identified, investigated and solved (at least in part) an AHD anomaly at the NSW-Victoria border. The outcome of this investigation will not only benefit surveyors and spatial professionals working on either side of the state border but also improve flood management of the Murray River. ACKNOWLEDGEMENTS The following current and former DFSI Spatial Services staff members are kindly acknowledged for carrying out the reconnaissance and levelling surveys involved in NSW: Zak Brown, Greg Dickson, Chris Hicks, Luke Moran, Shane Oates, Grant Ross, Chris Ryan, and Dean Watkins.
Proceedings of the 22nd Association of Public Authority Surveyors Conference (APAS2017) Shoal Bay, New South Wales, Australia, 20-22 March 2017
67
REFERENCES Brown N.J., Featherstone W.E., Hu G. and Johnston G.M. (2011) AUSGeoid09: A more
direct and more accurate model for converting ellipsoidal heights to AHD heights, Journal of Spatial Science, 56(1), 27-37.
Dickson G. (2012) Control surveys: Why things are the way they are and not the way you think they should be! Proceedings of Association of Public Authority Surveyors Conference (APAS2012), Wollongong, Australia, 19-21 March, 12-28.
Featherstone W.E. and Filmer M.S. (2012) The north-south tilt in the Australian Height Datum is explained by the ocean’s mean dynamic topography, Journal of Geophysical Research, 117, C08035, doi:10.1029/2012JC007974.
Featherstone W.E., Kirby J.F., Hirt C., Filmer M.S., Claessens S.J., Brown N.J., Hu G. and Johnston G.M. (2011) The AUSGeoid09 model of the Australian Height Datum, Journal of Geodesy, 85(3), 133-150.
GA (2017) AUSPOS – Online GPS processing service, http://www.ga.gov.au/scientific-topics/positioning-navigation/geodesy/auspos (accessed Feb 2017).
ICSM (2007) Standards and practices for control surveys (SP1), version 1.7, http://www.icsm.gov.au/publications/sp1/sp1v1-7.pdf (accessed Feb 2017).
ICSM (2014) Standard for the Australian survey control network (SP1), version 2.1, http://www.icsm.gov.au/publications/ (accessed Feb 2017).
Kinlyside D. (2013) SCIMS3: The next generation Survey Control Information Management System, Proceedings of Association of Public Authority Surveyors Conference (APAS2013), Canberra, Australia, 12-14 March, 174-186.
Leica Geosystems (2006) Leica DNA03/DNA10 user manual, version 2.0, 158pp.
Moffitt F.H. and Bouchard H. (1982) Surveying (7th edition), Harper & Row, New York, 834pp.
Roelse A., Granger H.W. and Graham J.W. (1975) The adjustment of the Australian levelling survey 1970-1971, Technical Report 12 (2nd edition), Division of National Mapping, Canberra, Australia, 109pp.