43
Oceaneering.com Investor Presentation 2021 First Quarter 1
Oceaneering.com
Investor Presentation2021 First Quarter
1
You should not place undue reliance on forward‐looking statements. This presentation reflects the views of Oceaneering's management as of the date hereof. Except to the extent required by applicable law, Oceaneering undertakes no obligation to update or revise any forward‐looking statement.
Non‐GAAP Disclosures:
This presentation includes several “non‐GAAP” financial measures, as defined under Regulation G of the U.S. Securities Exchange Act of 1934, as amended. Oceaneering reports its financial results in accordance with U.S. generally accepted accounting principles but believes that certain non‐GAAP financial measures provide useful supplemental information to investors regarding the underlying business trends and performance of its ongoing operations and are useful for period‐over‐period comparisons of those operations. The non‐GAAP measures in this presentation include EBITDA, Adjusted EBITDA, Adjusted Operating EBITDA and Free Cash Flow. These non‐GAAP financial measures should be considered as supplemental to, and not as substitutes for or superior to, the financial measures prepared in accordance with GAAP. The definitions of these non‐GAAP financial measures and reconciliations to the most comparable GAAP measures are provided in the section of this presentation titled Supplemental Information.
Forward‐Looking StatementsThose statements are made by using various underlying assumptions and are subject to numerous risks, contingencies and uncertainties, including, among others: factors affecting the level of activity in the oil and gas industry; supply and demand of drilling rigs; oil and natural gas demand and production growth; oil and natural gas prices; actions by members of OPEC and other oil exporting countries; factors affecting the level of activity in each of our government and entertainment businesses, including decisions on spending and funding by the U.S. Government and capital expenditure decisions by entertainment business customers, such as theme park operators; general economic and business conditions and industry trends, including the ongoing transition to alternative sources of energy to reduce worldwide emissions of carbon dioxide and other “greenhouse gases”; the continuing effects of the coronavirus (COVID‐19) pandemic and the governmental, customer, supplier and other responses to the pandemic; fluctuations in currency markets worldwide; future global economic conditions; the loss of major contracts or alliances; future performance under our customer contracts; and the effects of competition. Should one or more of these risks or uncertainties materialize, or should the assumptions underlying the forward‐looking statements prove incorrect, actual outcomes could vary materially from those indicated.
For additional information regarding these and other factors that may affect our actual results, see our periodic filings with the Securities and Exchange Commission, including our most recent Reports on Forms 10‐K and 10‐Q.
2
In accordance with the Safe Harbor provisions of the Private Securities Litigation Reform Act of 1995, Oceaneering cautions that statements in this presentation that express a belief, expectation, or intention are forward looking. Forward‐looking statements are generally accompanied by words such as “estimate,” “project,” “predict,” “believe,” “expect,” “anticipate,” “plan,” “forecast,” “budget,” “goal,” or other words that convey the uncertainty of future events or outcomes.
The forward‐looking statements in this presentation include, among other things, statements about: growing non‐energy portfolio; increasing focus on eco‐friendly enabling opportunities and digitalization; future revenue under contracts; our Manufactured Products backlog, to the extent backlog may be viewed as an indicator of future revenue or profitability; our outlook for the second quarter and full year of 2021 and the factors underlying our outlook, including as to free cash flow, capital expenditures, tax payments, and tax refunds to be received; offshore activity, future innovation; and investment levels and the outlook for offshore energy for 2021, including estimates of 2021 Brent crude prices, offshore and subsea expenditures and investments, contracted floating rig demand, subsea tree awards and installations, greenfield project FIDs; and our focus on generating free cash flow, preserving and improving our liquidity and balance sheet, and improving our returns. Although we believe that the expectations reflected in those forward‐looking statements are reasonable, we can give no assurance that those expectations will prove to have been correct.
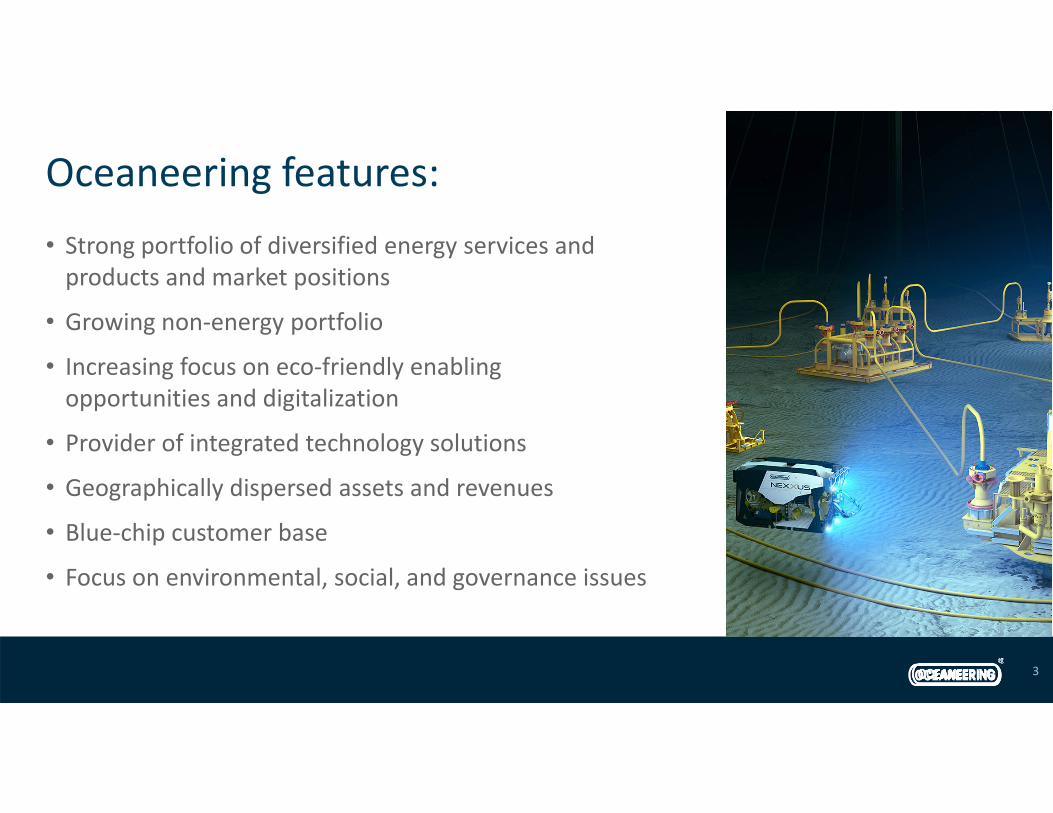
Oceaneering features: • Strong portfolio of diversified energy services and products and market positions
• Growing non‐energy portfolio• Increasing focus on eco‐friendly enabling opportunities and digitalization
• Provider of integrated technology solutions• Geographically dispersed assets and revenues• Blue‐chip customer base
• Focus on environmental, social, and governance issues
3
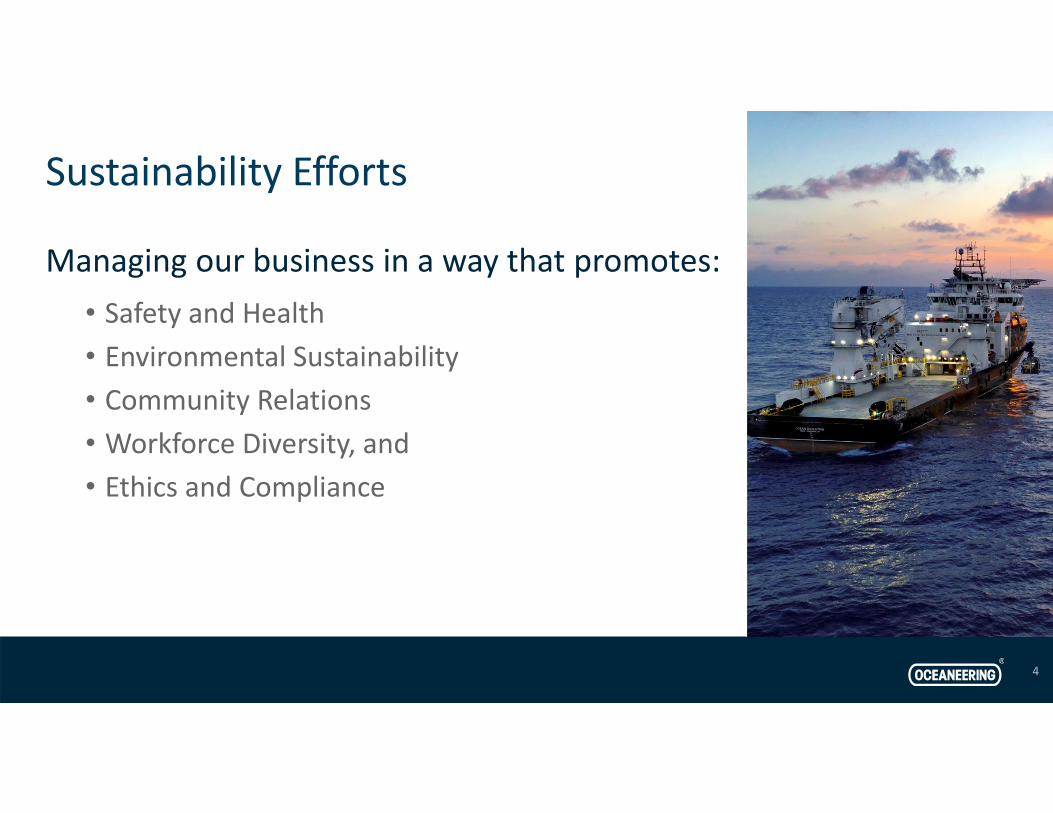
Managing our business in a way that promotes:• Safety and Health• Environmental Sustainability • Community Relations• Workforce Diversity, and • Ethics and Compliance
4
Sustainability Efforts
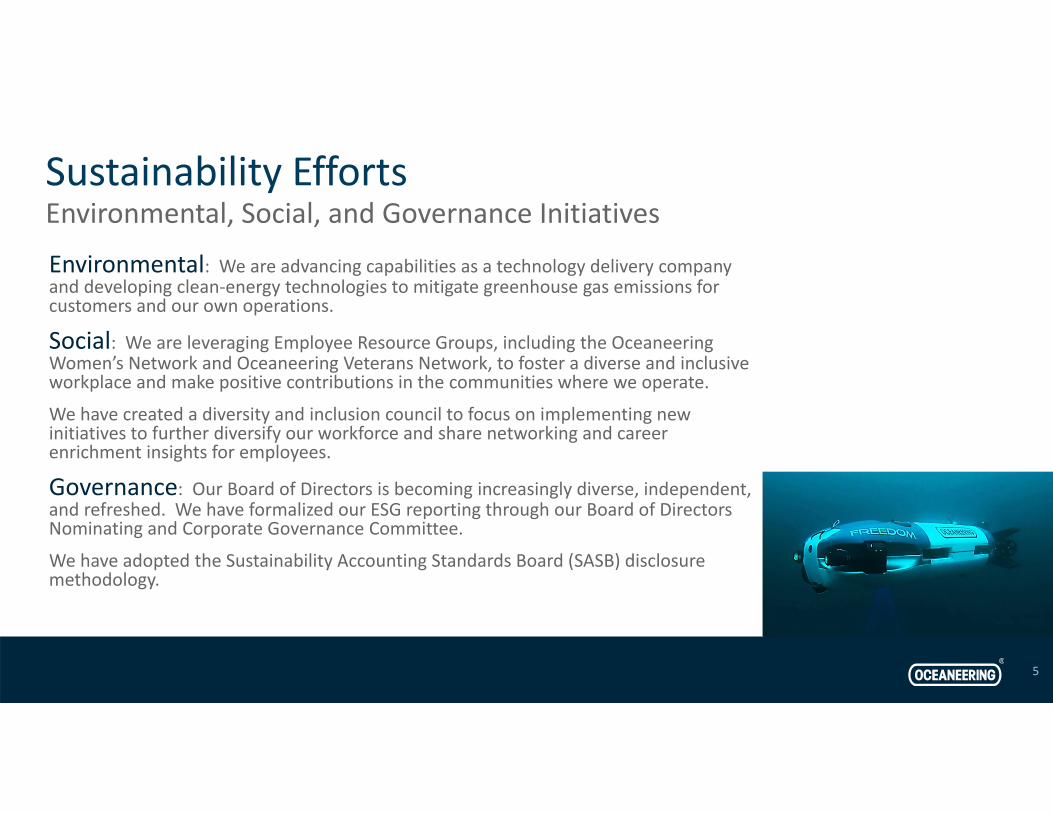
Environmental: We are advancing capabilities as a technology delivery company and developing clean‐energy technologies to mitigate greenhouse gas emissions for customers and our own operations.
Social: We are leveraging Employee Resource Groups, including the Oceaneering Women’s Network and Oceaneering Veterans Network, to foster a diverse and inclusive workplace and make positive contributions in the communities where we operate.
We have created a diversity and inclusion council to focus on implementing new initiatives to further diversify our workforce and share networking and career enrichment insights for employees.
Governance: Our Board of Directors is becoming increasingly diverse, independent, and refreshed. We have formalized our ESG reporting through our Board of Directors Nominating and Corporate Governance Committee.
We have adopted the Sustainability Accounting Standards Board (SASB) disclosure methodology.
5
Sustainability EffortsEnvironmental, Social, and Governance Initiatives
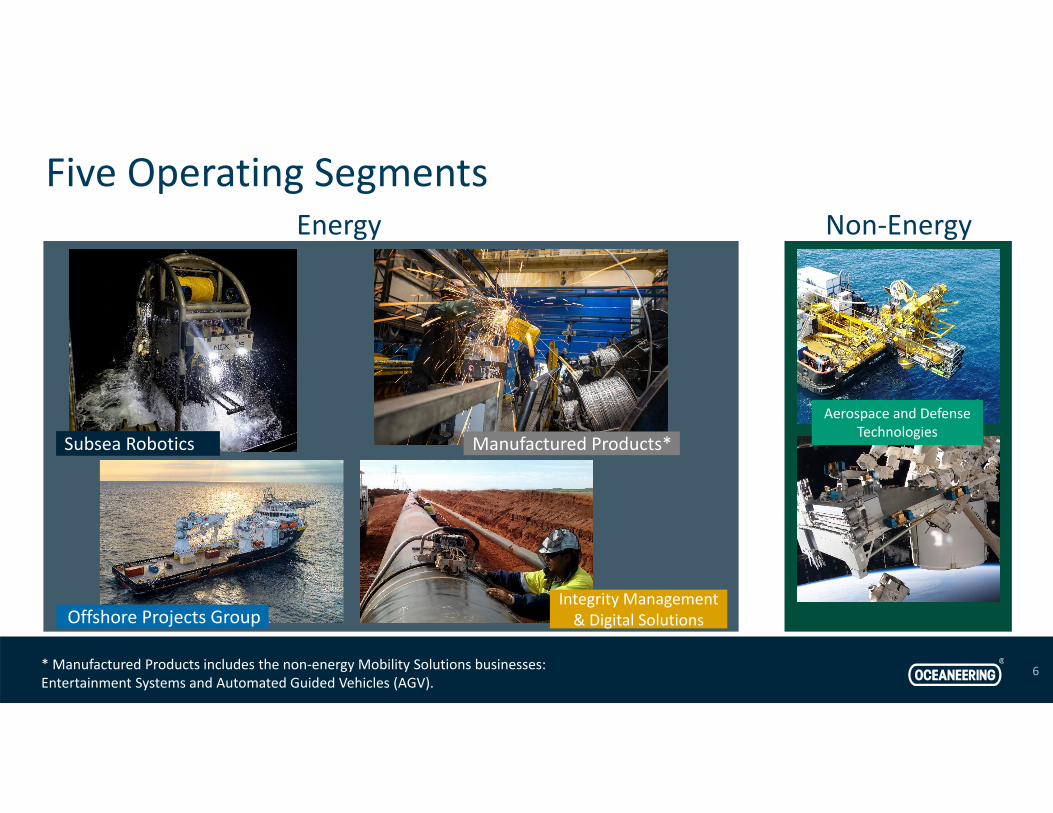
Five Operating Segments
6
Non‐Energy
* Manufactured Products includes the non‐energy Mobility Solutions businesses: Entertainment Systems and Automated Guided Vehicles (AGV).
Energy
Subsea Robotics Manufactured Products*
Offshore Projects GroupIntegrity Management & Digital Solutions
Aerospace and Defense Technologies
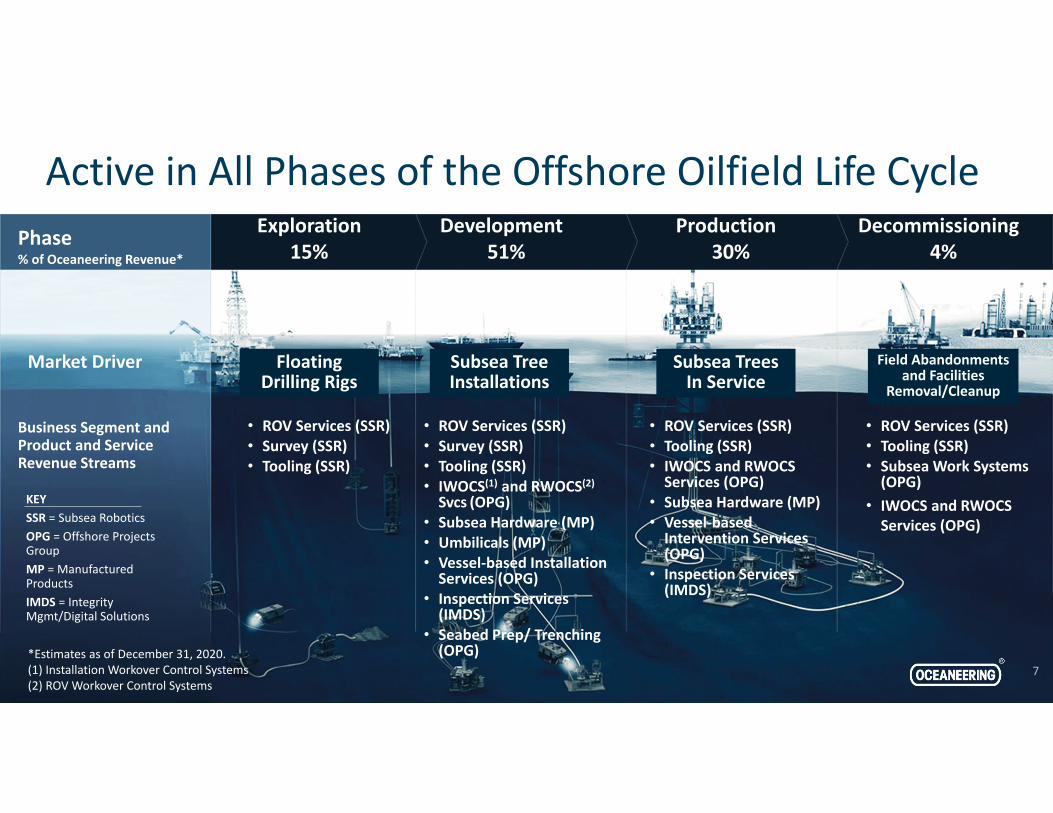
Phase% of Oceaneering Revenue*
Exploration 15%
Development51%
Production30%
Decommissioning4%
Market Driver Floating Drilling Rigs
Subsea Tree Installations
Subsea Trees In Service
Field Abandonments and Facilities
Removal/Cleanup
• ROV Services (SSR)• Survey (SSR)• Tooling (SSR)
• ROV Services (SSR) • Survey (SSR)• Tooling (SSR)• IWOCS(1) and RWOCS(2) Svcs (OPG)
• Subsea Hardware (MP)• Umbilicals (MP)• Vessel‐based Installation Services (OPG)
• Inspection Services (IMDS)
• Seabed Prep/ Trenching (OPG)
• ROV Services (SSR) • Tooling (SSR)• IWOCS and RWOCS Services (OPG)
• Subsea Hardware (MP)• Vessel‐based Intervention Services (OPG)
• Inspection Services (IMDS)
• ROV Services (SSR) • Tooling (SSR)• Subsea Work Systems (OPG)
• IWOCS and RWOCS Services (OPG)
Business Segment and Product and Service Revenue Streams
KEYSSR = Subsea RoboticsOPG = Offshore Projects GroupMP = Manufactured ProductsIMDS = Integrity Mgmt/Digital Solutions
Active in All Phases of the Offshore Oilfield Life Cycle
7*Estimates as of December 31, 2020.(1) Installation Workover Control Systems(2) ROV Workover Control Systems
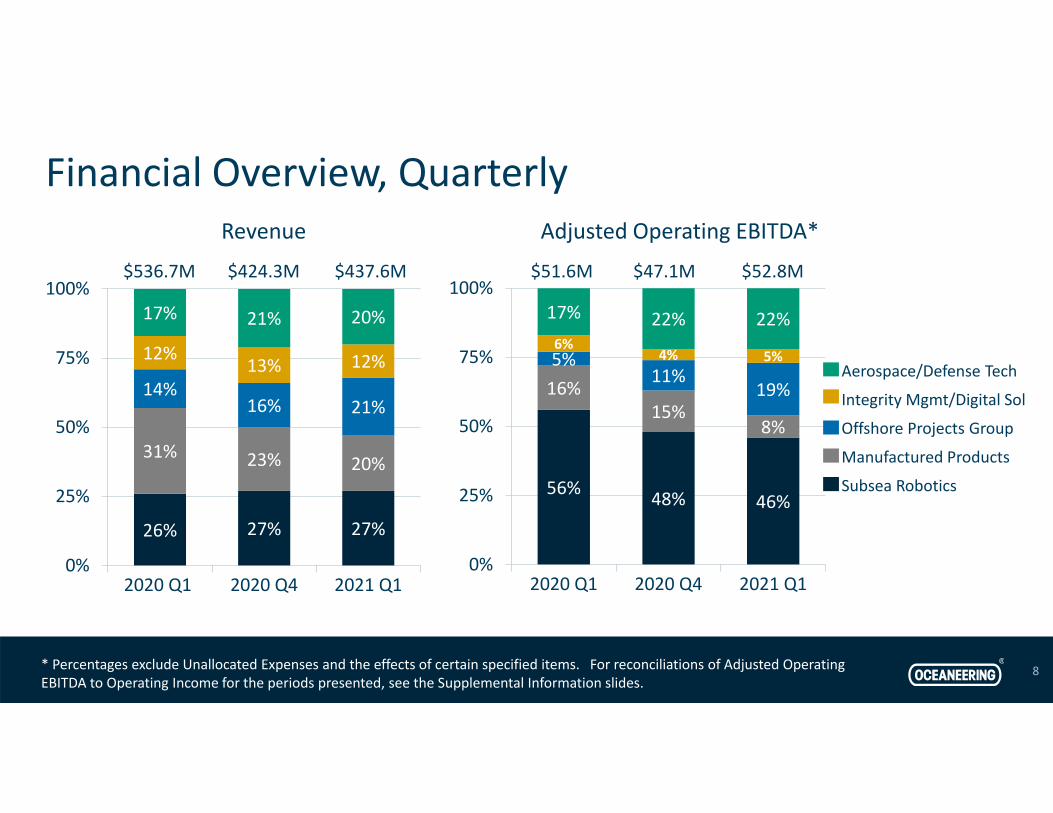
Financial Overview, Quarterly
8
26% 27% 27%
31% 23% 20%
14%16% 21%
12%13% 12%
17% 21% 20%
0%
25%
50%
75%
100%
2020 Q1 2020 Q4 2021 Q1
Revenue Adjusted Operating EBITDA*
56% 48% 46%
16%15%
8%
5%11%
19%
6%4% 5%
17% 22% 22%
0%
25%
50%
75%
100%
2020 Q1 2020 Q4 2021 Q1
$52.8M$51.6M $47.1M$437.6M$536.7M
Aerospace/Defense Tech
Manufactured Products
Integrity Mgmt/Digital Sol
Offshore Projects Group
Subsea Robotics
* Percentages exclude Unallocated Expenses and the effects of certain specified items. For reconciliations of Adjusted Operating EBITDA to Operating Income for the periods presented, see the Supplemental Information slides.
$424.3M
9
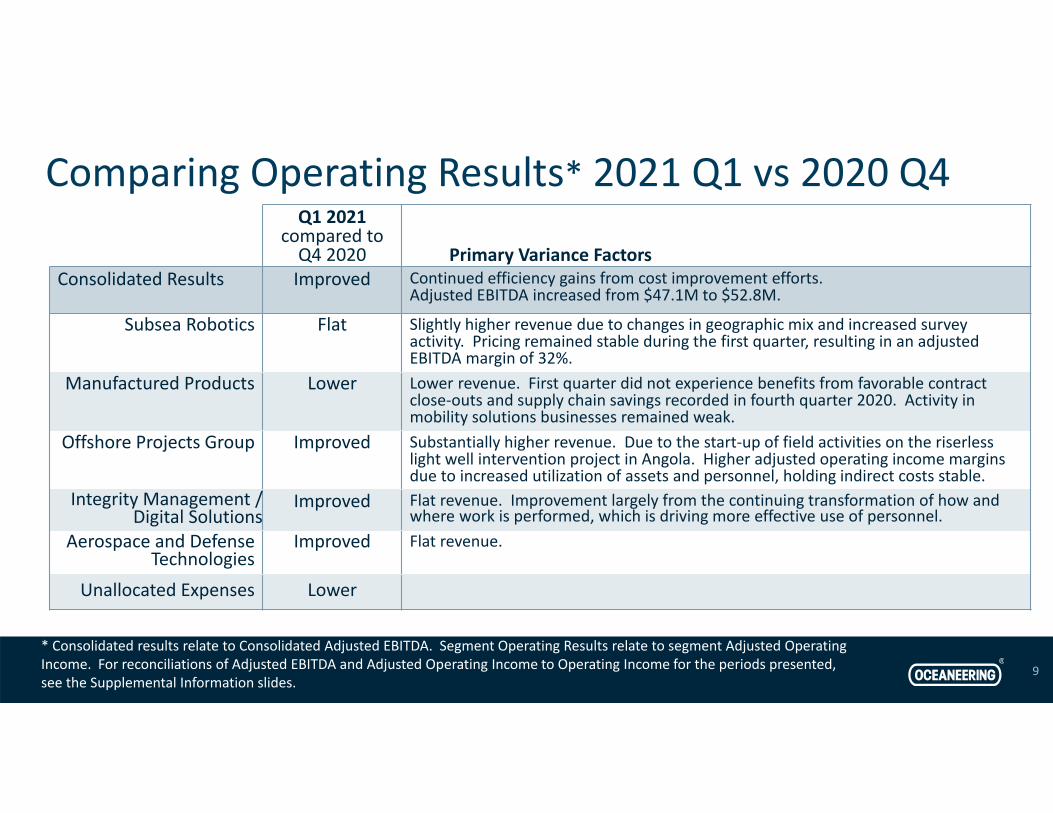
Q1 2021 compared to Q4 2020 Primary Variance Factors
Consolidated Results Improved Continued efficiency gains from cost improvement efforts.Adjusted EBITDA increased from $47.1M to $52.8M.
Subsea Robotics Flat Slightly higher revenue due to changes in geographic mix and increased survey activity. Pricing remained stable during the first quarter, resulting in an adjusted EBITDA margin of 32%.
Manufactured Products Lower Lower revenue. First quarter did not experience benefits from favorable contract close‐outs and supply chain savings recorded in fourth quarter 2020. Activity in mobility solutions businesses remained weak.
Offshore Projects Group Improved Substantially higher revenue. Due to the start‐up of field activities on the riserlesslight well intervention project in Angola. Higher adjusted operating income margins due to increased utilization of assets and personnel, holding indirect costs stable.
Integrity Management /Digital Solutions
Improved Flat revenue. Improvement largely from the continuing transformation of how and where work is performed, which is driving more effective use of personnel.
Aerospace and Defense Technologies
Improved Flat revenue.
Unallocated Expenses Lower
Comparing Operating Results* 2021 Q1 vs 2020 Q4
* Consolidated results relate to Consolidated Adjusted EBITDA. Segment Operating Results relate to segment Adjusted Operating Income. For reconciliations of Adjusted EBITDA and Adjusted Operating Income to Operating Income for the periods presented, see the Supplemental Information slides.
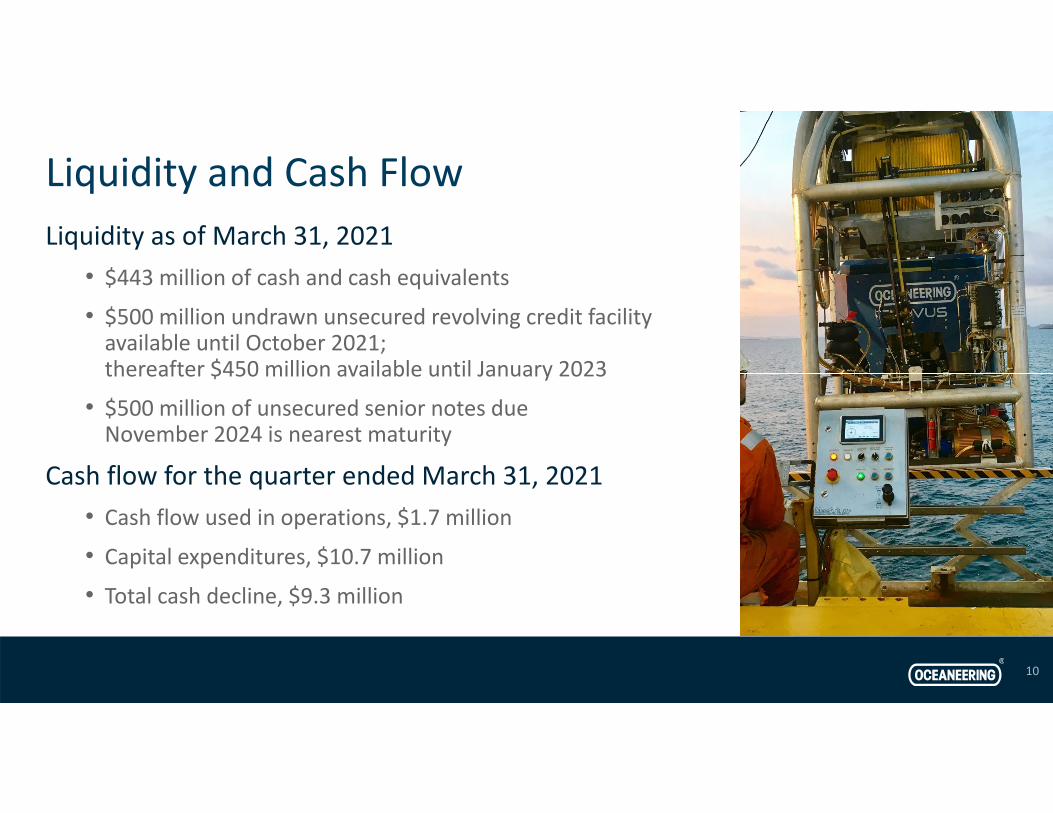
Liquidity and Cash FlowLiquidity as of March 31, 2021
• $443 million of cash and cash equivalents
• $500 million undrawn unsecured revolving credit facility available until October 2021; thereafter $450 million available until January 2023
• $500 million of unsecured senior notes due November 2024 is nearest maturity
Cash flow for the quarter ended March 31, 2021• Cash flow used in operations, $1.7 million
• Capital expenditures, $10.7 million
• Total cash decline, $9.3 million
10
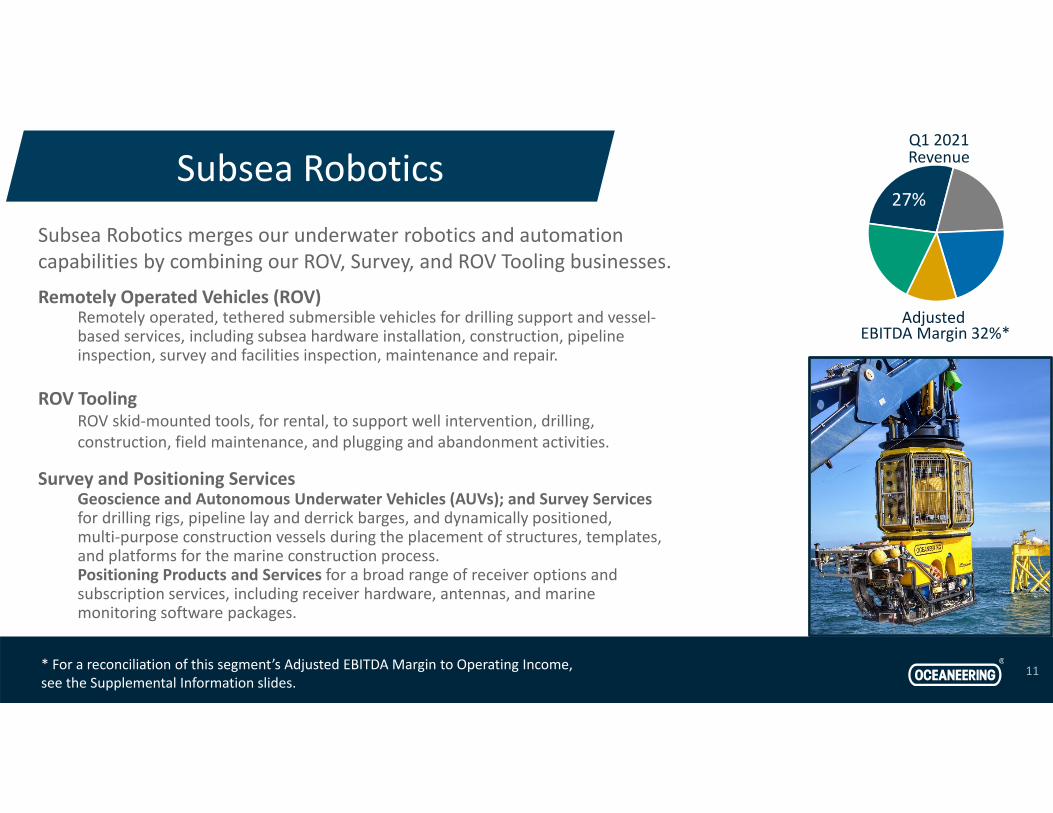
Subsea Robotics merges our underwater robotics and automation capabilities by combining our ROV, Survey, and ROV Tooling businesses.
Remotely Operated Vehicles (ROV)Remotely operated, tethered submersible vehicles for drilling support and vessel‐based services, including subsea hardware installation, construction, pipeline inspection, survey and facilities inspection, maintenance and repair.
ROV ToolingROV skid‐mounted tools, for rental, to support well intervention, drilling, construction, field maintenance, and plugging and abandonment activities.
Survey and Positioning ServicesGeoscience and Autonomous Underwater Vehicles (AUVs); and Survey Services for drilling rigs, pipeline lay and derrick barges, and dynamically positioned, multi‐purpose construction vessels during the placement of structures, templates, and platforms for the marine construction process. Positioning Products and Services for a broad range of receiver options and subscription services, including receiver hardware, antennas, and marine monitoring software packages.
Subsea Robotics
11
27%
Q1 2021Revenue
Adjusted EBITDA Margin 32%*
* For a reconciliation of this segment’s Adjusted EBITDA Margin to Operating Income, see the Supplemental Information slides.
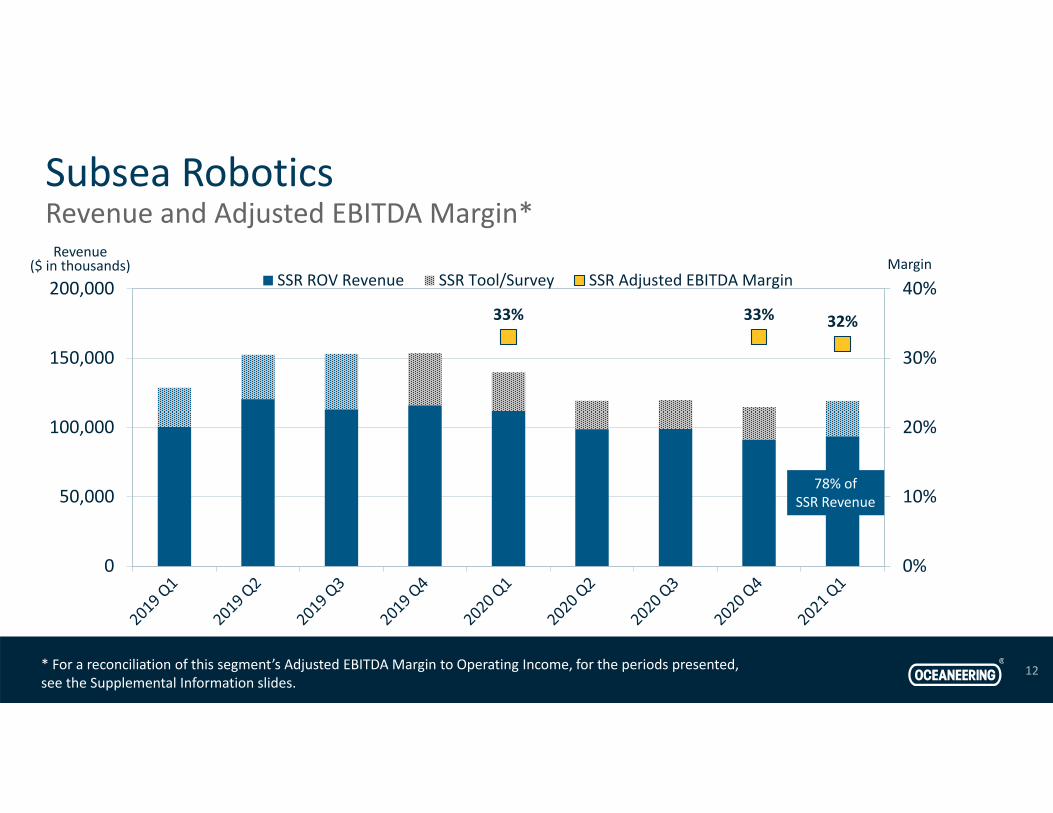
Subsea RoboticsRevenue and Adjusted EBITDA Margin*
33% 33% 32%
0%
10%
20%
30%
40%
0
50,000
100,000
150,000
200,000Margin
Revenue($ in thousands)
SSR ROV Revenue SSR Tool/Survey SSR Adjusted EBITDA Margin
78% of SSR Revenue
12* For a reconciliation of this segment’s Adjusted EBITDA Margin to Operating Income, for the periods presented, see the Supplemental Information slides.
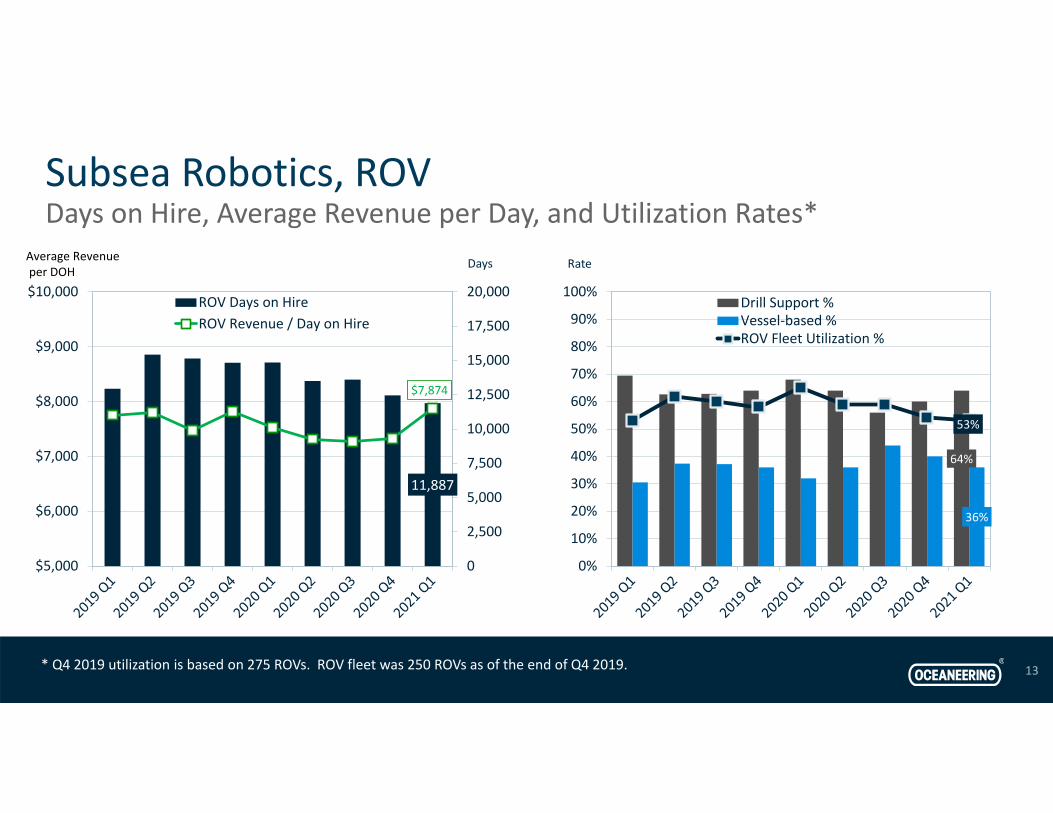
Subsea Robotics, ROVDays on Hire, Average Revenue per Day, and Utilization Rates*
11,887
$7,874
0
2,500
5,000
7,500
10,000
12,500
15,000
17,500
20,000
$5,000
$6,000
$7,000
$8,000
$9,000
$10,000
Days
ROV Days on HireROV Revenue / Day on Hire
Average Revenueper DOH
* Q4 2019 utilization is based on 275 ROVs. ROV fleet was 250 ROVs as of the end of Q4 2019.
64%
36%
53%
0%
10%
20%
30%
40%
50%
60%
70%
80%
90%
100%
Rate
Drill Support %Vessel‐based %ROV Fleet Utilization %
13
14
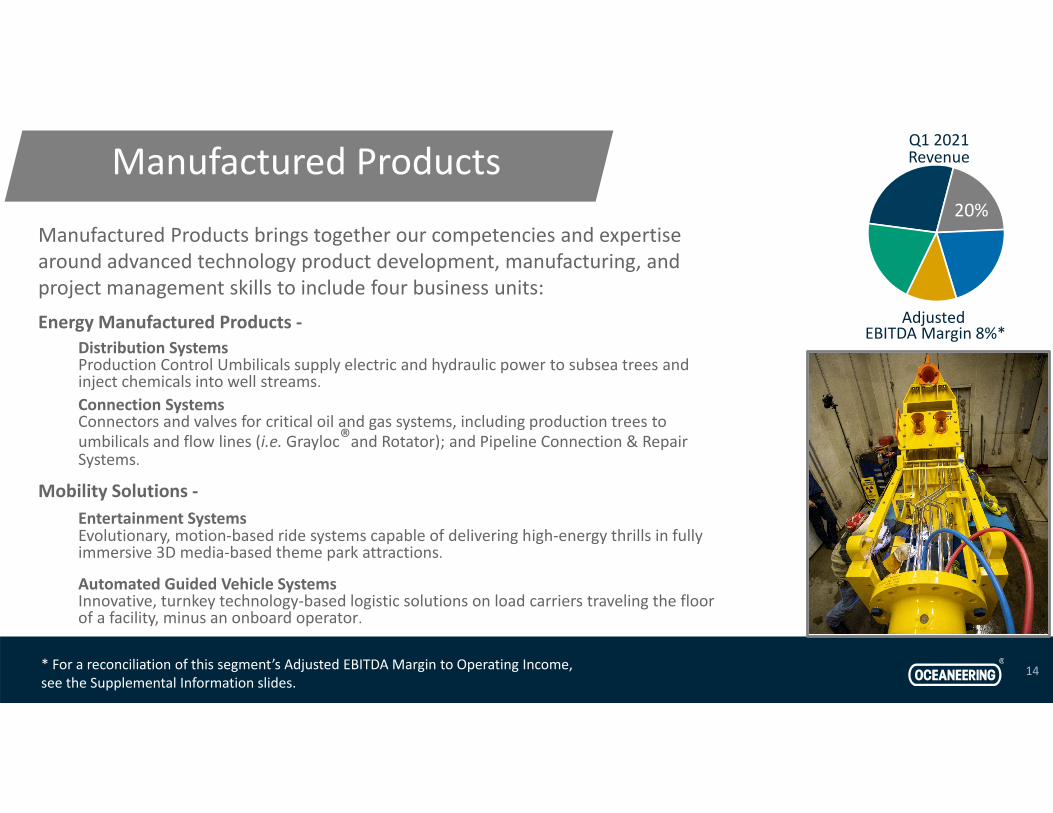
Manufactured Products brings together our competencies and expertise around advanced technology product development, manufacturing, and project management skills to include four business units:Energy Manufactured Products ‐
Distribution Systems Production Control Umbilicals supply electric and hydraulic power to subsea trees and inject chemicals into well streams.Connection Systems Connectors and valves for critical oil and gas systems, including production trees to umbilicals and flow lines (i.e. Grayloc®and Rotator); and Pipeline Connection & Repair Systems.
Mobility Solutions ‐Entertainment Systems Evolutionary, motion‐based ride systems capable of delivering high‐energy thrills in fully immersive 3D media‐based theme park attractions.
Automated Guided Vehicle Systems Innovative, turnkey technology‐based logistic solutions on load carriers traveling the floor of a facility, minus an onboard operator.
Manufactured Products
* For a reconciliation of this segment’s Adjusted EBITDA Margin to Operating Income, see the Supplemental Information slides.
20%
Q1 2021Revenue
Adjusted EBITDA Margin 8%*
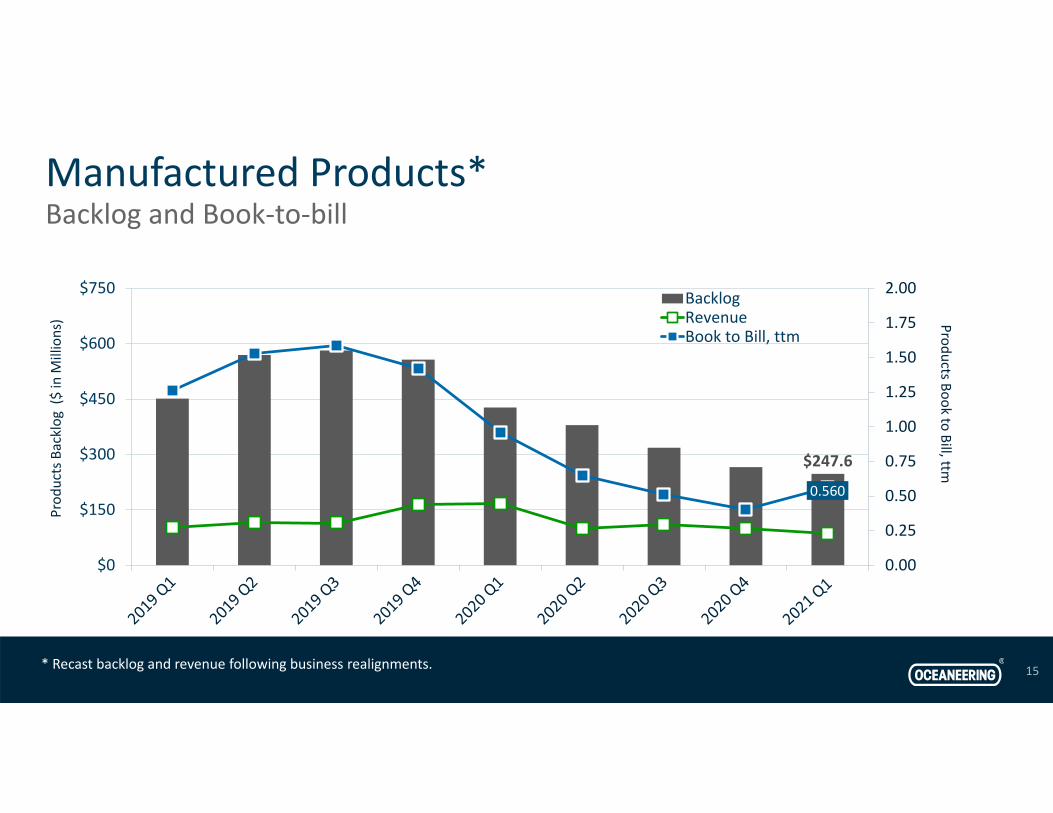
Manufactured Products*Backlog and Book‐to‐bill
15
$247.6
0.560
0.00
0.25
0.50
0.75
1.00
1.25
1.50
1.75
2.00
$0
$150
$300
$450
$600
$750
Products Book to Bill, ttm
Prod
ucts Backlog
($ in M
illions)
BacklogRevenueBook to Bill, ttm
* Recast backlog and revenue following business realignments.

16
Offshore Projects Group
Offshore Projects Group (OPG) provides a broad portfolio of integrated subsea project capabilities and solutions, including:
project management and engineering; subsea installation and intervention; IMR (inspection, maintenance and repair) services; IWOCS and RWOCS services; large work packages (e.g., riserlesslight well intervention; hydrate remediation; well stimulation); dredging and decommissioning.
OPG provides seabed preparation, route clearance, and trenching services to the renewable energy and oil and gas industries.
Project scopes are supported by:• our owned vessels;• third‐party chartered vessels, as needed; and• manned diving operations for special services.
* For a reconciliation of this segment’s Adjusted EBITDA Margin to Operating Income, see the Supplemental Information slides.
21%
Q1 2021Revenue
Adjusted EBITDA Margin 18%*
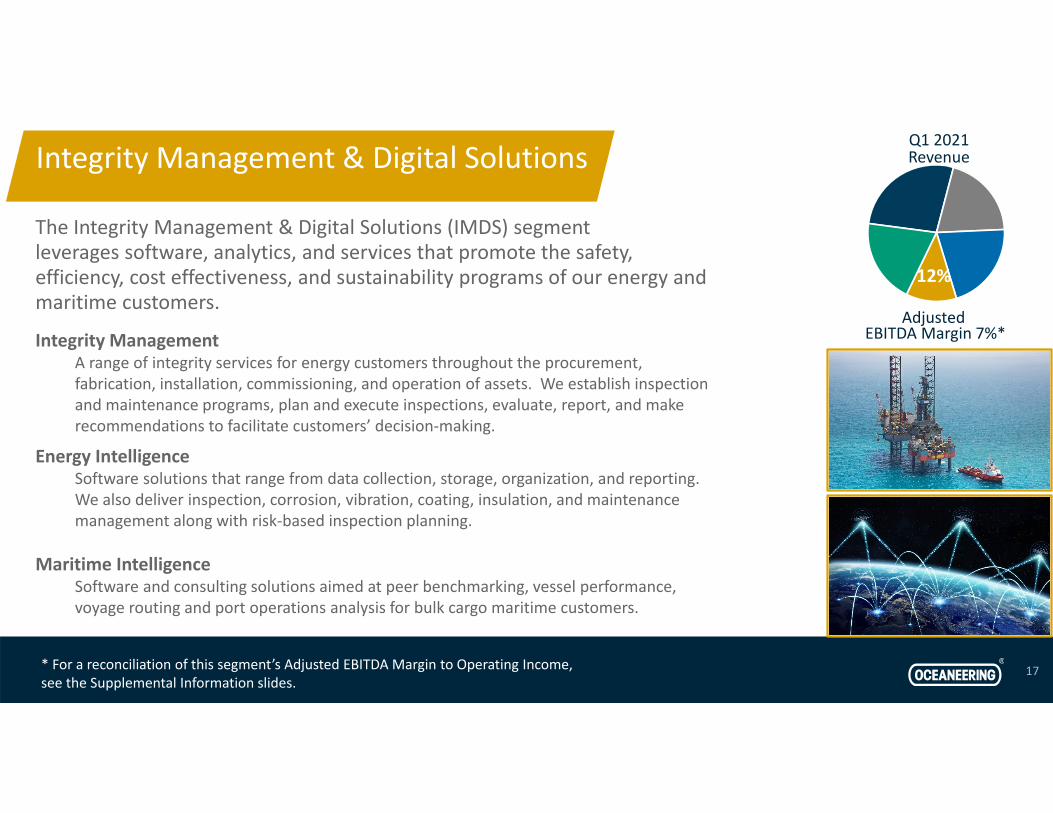
The Integrity Management & Digital Solutions (IMDS) segment leverages software, analytics, and services that promote the safety, efficiency, cost effectiveness, and sustainability programs of our energy and maritime customers.
Integrity Management A range of integrity services for energy customers throughout the procurement, fabrication, installation, commissioning, and operation of assets. We establish inspection and maintenance programs, plan and execute inspections, evaluate, report, and make recommendations to facilitate customers’ decision‐making.
Energy Intelligence Software solutions that range from data collection, storage, organization, and reporting. We also deliver inspection, corrosion, vibration, coating, insulation, and maintenance management along with risk‐based inspection planning.
Maritime Intelligence Software and consulting solutions aimed at peer benchmarking, vessel performance, voyage routing and port operations analysis for bulk cargo maritime customers.
17
Integrity Management & Digital Solutions
* For a reconciliation of this segment’s Adjusted EBITDA Margin to Operating Income, see the Supplemental Information slides.
12%
Q1 2021Revenue
Adjusted EBITDA Margin 7%*

Aerospace and Defense Technologies (ADTech) provides engineering services and related manufacturing, principally for the U.S. Department of Defense and NASA and its prime contractors.
Defense Subsea Technologies Design, build, and operate unique maritime and specialized harsh environment systems for government and commercial customers.
Marine ServicesFull‐service ship repair capabilities for U.S. Naval vessels, including submarines, surface ships and craft, and deep submergence systems. Design, repair, maintenance, modification, and installation of hull, mechanical, and electrical systems.
Space Systems Turnkey design, development, manufacturing, certification, maintenance, testing, and sustaining engineering for space‐based robotics and automation, satellite servicing, human space flight systems, and thermal protection systems.
1818
Aerospace and Defense Technologies
* For a reconciliation of this segment’s Adjusted EBITDA Margin to Operating Income, see the Supplemental Information slides.
20%
Q1 2021Revenue
Adjusted EBITDA Margin 21%*
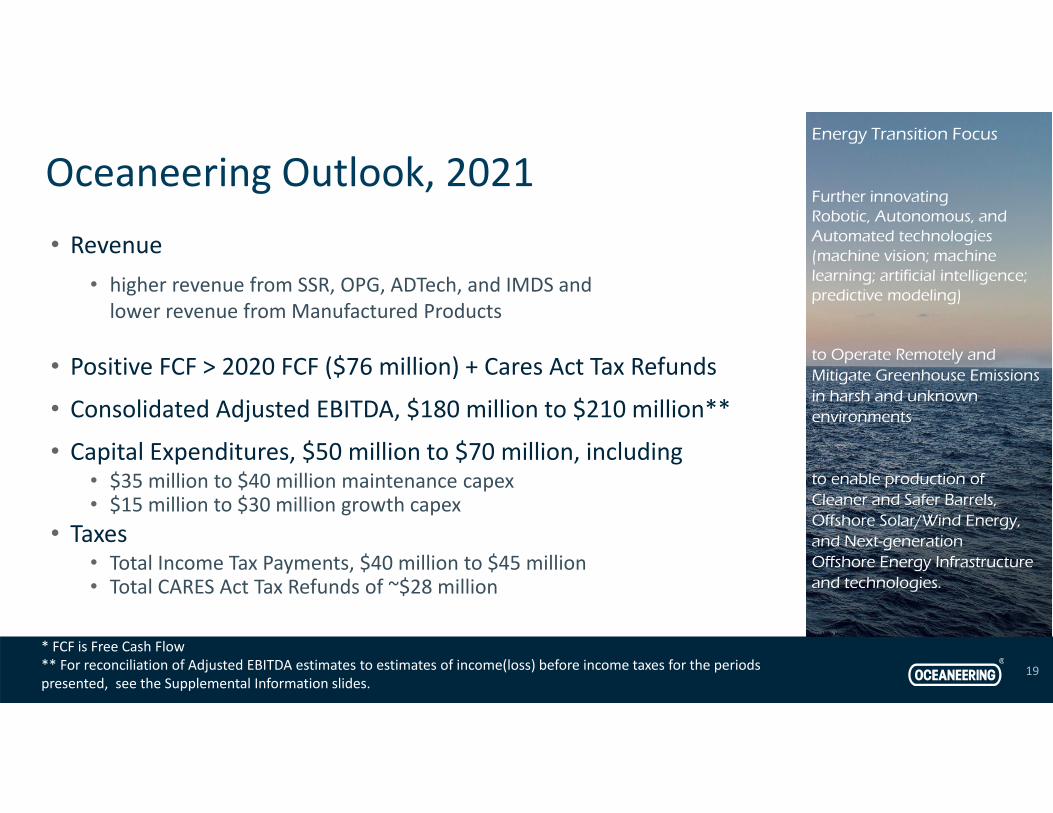
• Revenue• higher revenue from SSR, OPG, ADTech, and IMDS and lower revenue from Manufactured Products
• Positive FCF > 2020 FCF ($76 million) + Cares Act Tax Refunds
• Consolidated Adjusted EBITDA, $180 million to $210 million**
• Capital Expenditures, $50 million to $70 million, including• $35 million to $40 million maintenance capex • $15 million to $30 million growth capex
• Taxes• Total Income Tax Payments, $40 million to $45 million• Total CARES Act Tax Refunds of ~$28 million
Oceaneering Outlook, 2021
19
* FCF is Free Cash Flow** For reconciliation of Adjusted EBITDA estimates to estimates of income(loss) before income taxes for the periods presented, see the Supplemental Information slides.
Energy Transition Focus
Further innovating Robotic, Autonomous, and Automated technologies (machine vision; machine learning; artificial intelligence; predictive modeling)
to Operate Remotely and Mitigate Greenhouse Emissions in harsh and unknown environments
to enable production of Cleaner and Safer Barrels,Offshore Solar/Wind Energy, and Next-generation Offshore Energy Infrastructure and technologies.
20
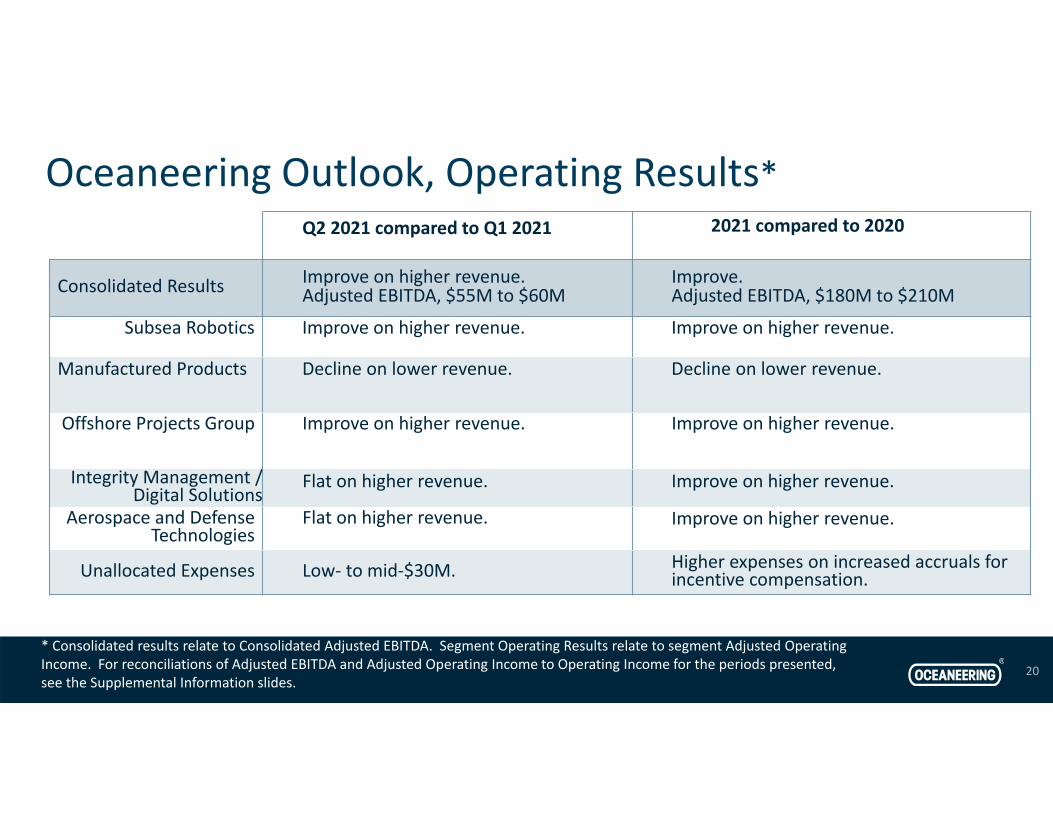
Q2 2021 compared to Q1 2021 2021 compared to 2020
Consolidated Results Improve on higher revenue. Adjusted EBITDA, $55M to $60M
Improve. Adjusted EBITDA, $180M to $210M
Subsea Robotics Improve on higher revenue. Improve on higher revenue.
Manufactured Products Decline on lower revenue. Decline on lower revenue.
Offshore Projects Group Improve on higher revenue. Improve on higher revenue.
Integrity Management /Digital Solutions
Flat on higher revenue. Improve on higher revenue.
Aerospace and Defense Technologies
Flat on higher revenue. Improve on higher revenue.
Unallocated Expenses Low‐ to mid‐$30M. Higher expenses on increased accruals for incentive compensation.
Oceaneering Outlook, Operating Results*
* Consolidated results relate to Consolidated Adjusted EBITDA. Segment Operating Results relate to segment Adjusted Operating Income. For reconciliations of Adjusted EBITDA and Adjusted Operating Income to Operating Income for the periods presented, see the Supplemental Information slides.
21
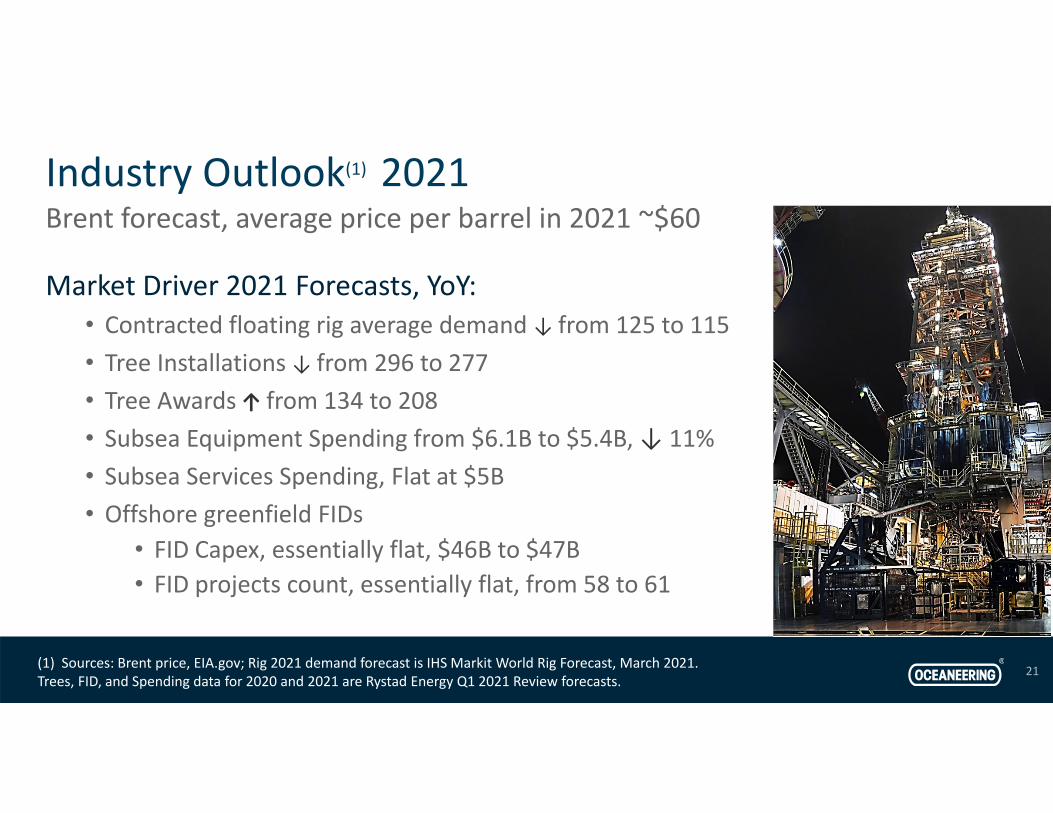
Brent forecast, average price per barrel in 2021 ~$60
(1) Sources: Brent price, EIA.gov; Rig 2021 demand forecast is IHS Markit World Rig Forecast, March 2021. Trees, FID, and Spending data for 2020 and 2021 are Rystad Energy Q1 2021 Review forecasts.
Industry Outlook(1) 2021
Market Driver 2021 Forecasts, YoY:• Contracted floating rig average demand ↓ from 125 to 115 • Tree Installations ↓ from 296 to 277 • Tree Awards↑ from 134 to 208• Subsea Equipment Spending from $6.1B to $5.4B, ↓ 11% • Subsea Services Spending, Flat at $5B• Offshore greenfield FIDs
• FID Capex, essentially flat, $46B to $47B• FID projects count, essentially flat, from 58 to 61
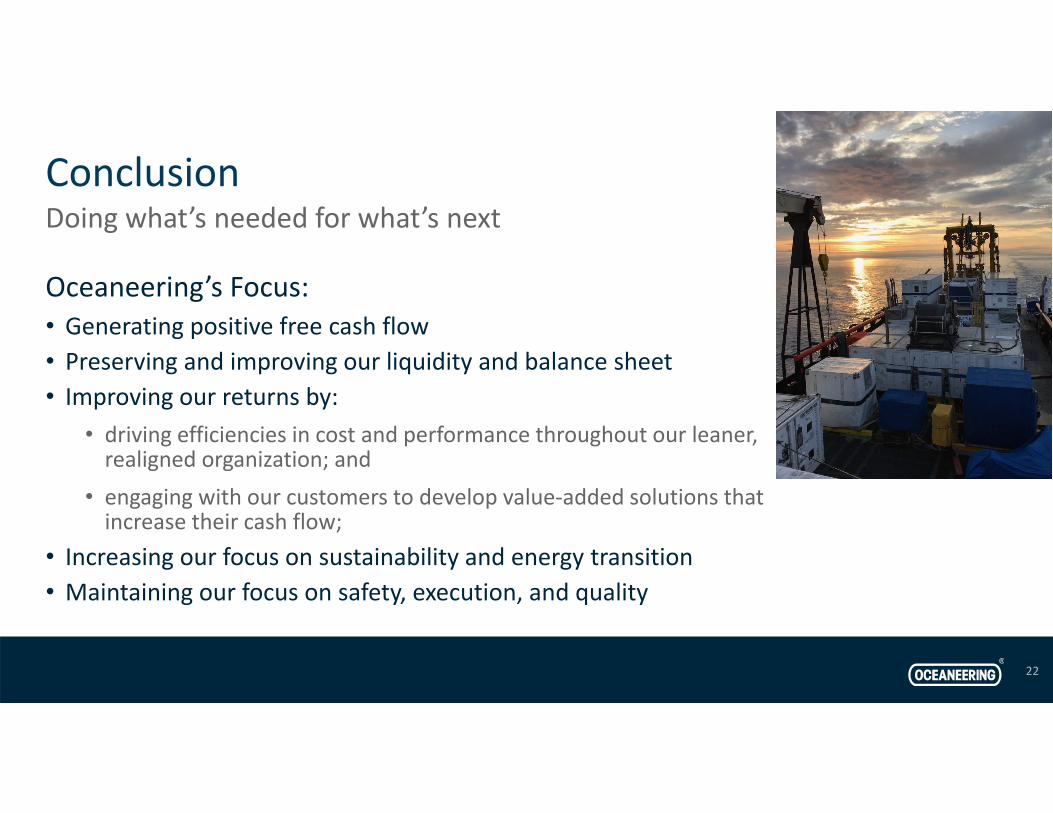
Doing what’s needed for what’s next
22
Oceaneering’s Focus: • Generating positive free cash flow • Preserving and improving our liquidity and balance sheet• Improving our returns by:
• driving efficiencies in cost and performance throughout our leaner, realigned organization; and
• engaging with our customers to develop value‐added solutions that increase their cash flow;
• Increasing our focus on sustainability and energy transition • Maintaining our focus on safety, execution, and quality
Conclusion

Investor Relations ContactMark PetersonVice President, Corporate Development and Investor [email protected]
23
Supplemental Information
24
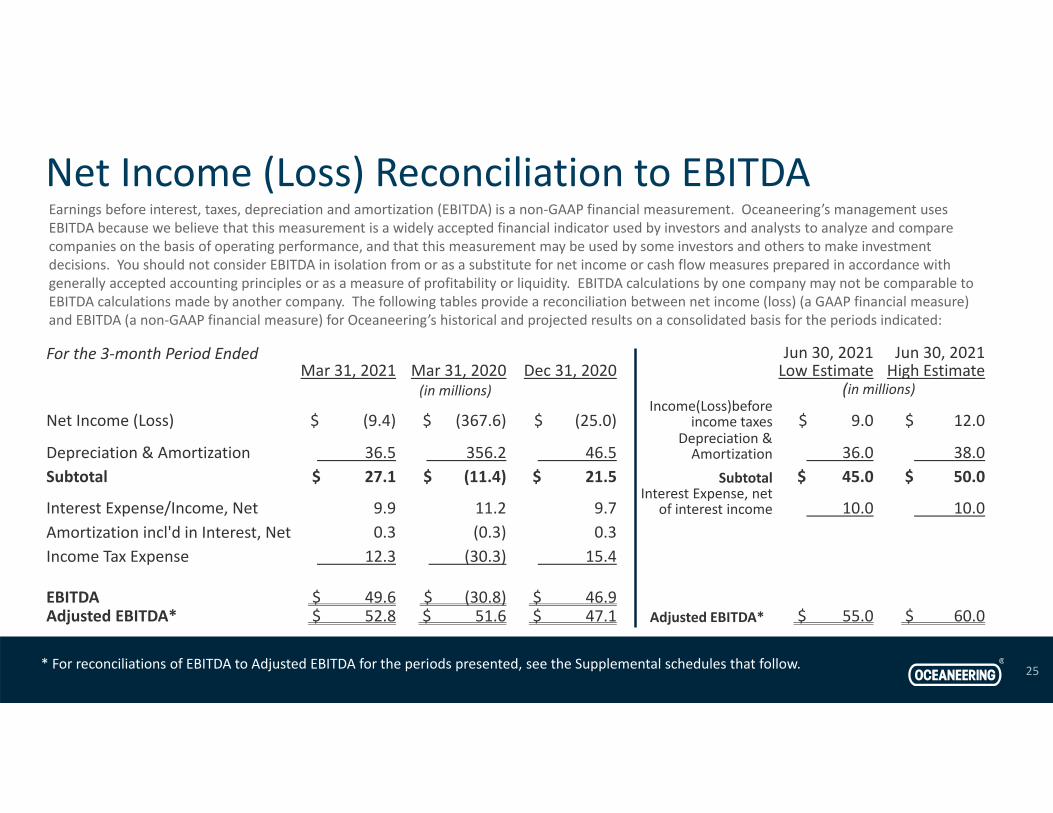
Earnings before interest, taxes, depreciation and amortization (EBITDA) is a non‐GAAP financial measurement. Oceaneering’s management uses EBITDA because we believe that this measurement is a widely accepted financial indicator used by investors and analysts to analyze and compare companies on the basis of operating performance, and that this measurement may be used by some investors and others to make investment decisions. You should not consider EBITDA in isolation from or as a substitute for net income or cash flow measures prepared in accordance with generally accepted accounting principles or as a measure of profitability or liquidity. EBITDA calculations by one company may not be comparable to EBITDA calculations made by another company. The following tables provide a reconciliation between net income (loss) (a GAAP financial measure) and EBITDA (a non‐GAAP financial measure) for Oceaneering’s historical and projected results on a consolidated basis for the periods indicated:
Net Income (Loss) Reconciliation to EBITDA
25
For the 3‐month Period EndedMar 31, 2021 Mar 31, 2020 Dec 31, 2020
Jun 30, 2021 Low Estimate
Jun 30, 2021 High Estimate
(in millions) (in millions)
Net Income (Loss) $ (9.4) $ (367.6) $ (25.0)Income(Loss)before
income taxes $ 9.0 $ 12.0
Depreciation & Amortization 36.5 356.2 46.5 Depreciation & Amortization 36.0 38.0
Subtotal $ 27.1 $ (11.4) $ 21.5 Subtotal $ 45.0 $ 50.0
Interest Expense/Income, Net 9.9 11.2 9.7 Interest Expense, net
of interest income 10.0 10.0 Amortization incl'd in Interest, Net 0.3 (0.3) 0.3 Income Tax Expense 12.3 (30.3) 15.4
EBITDA $ 49.6 $ (30.8) $ 46.9 Adjusted EBITDA* $ 52.8 $ 51.6 $ 47.1 Adjusted EBITDA* $ 55.0 $ 60.0
* For reconciliations of EBITDA to Adjusted EBITDA for the periods presented, see the Supplemental schedules that follow.
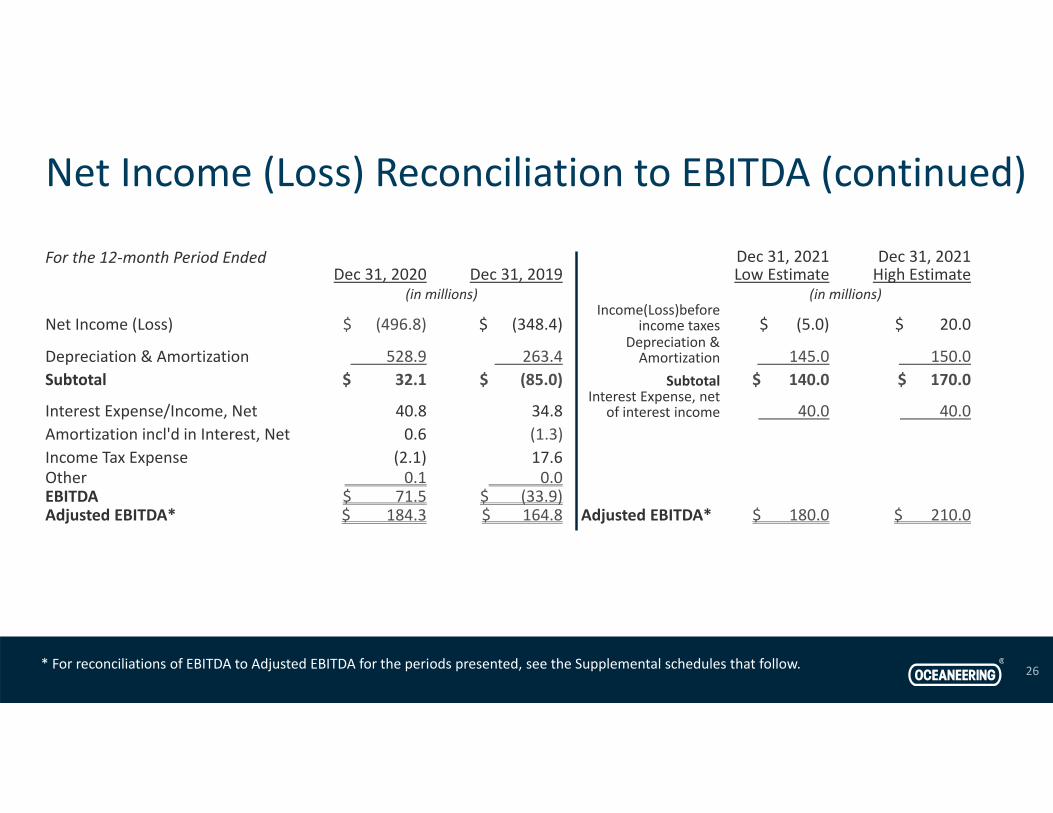
Net Income (Loss) Reconciliation to EBITDA (continued)
26
For the 12‐month Period EndedDec 31, 2020 Dec 31, 2019
Dec 31, 2021Low Estimate
Dec 31, 2021High Estimate
(in millions) (in millions)
Net Income (Loss) $ (496.8) $ (348.4)Income(Loss)before
income taxes $ (5.0) $ 20.0
Depreciation & Amortization 528.9 263.4 Depreciation & Amortization 145.0 150.0
Subtotal $ 32.1 $ (85.0) Subtotal $ 140.0 $ 170.0
Interest Expense/Income, Net 40.8 34.8 Interest Expense, net
of interest income 40.0 40.0Amortization incl'd in Interest, Net 0.6 (1.3)Income Tax Expense (2.1) 17.6 Other 0.1 0.0EBITDA $ 71.5 $ (33.9)Adjusted EBITDA* $ 184.3 $ 164.8 Adjusted EBITDA* $ 180.0 $ 210.0
* For reconciliations of EBITDA to Adjusted EBITDA for the periods presented, see the Supplemental schedules that follow.
27
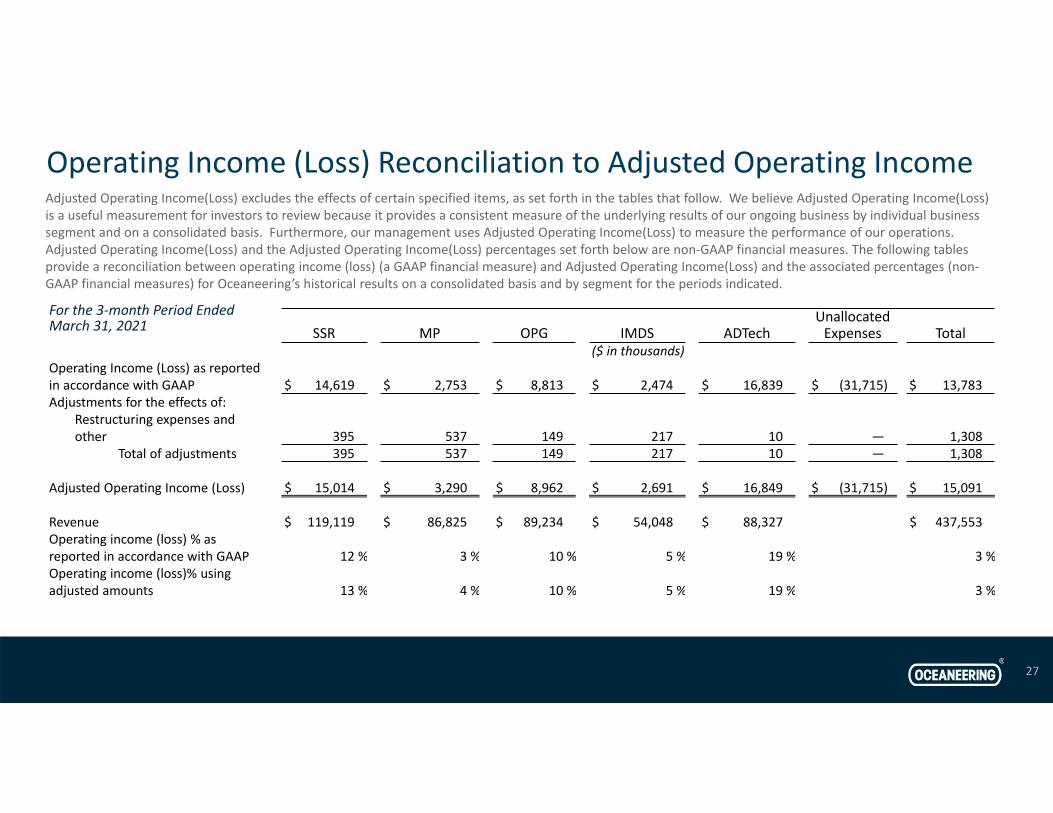
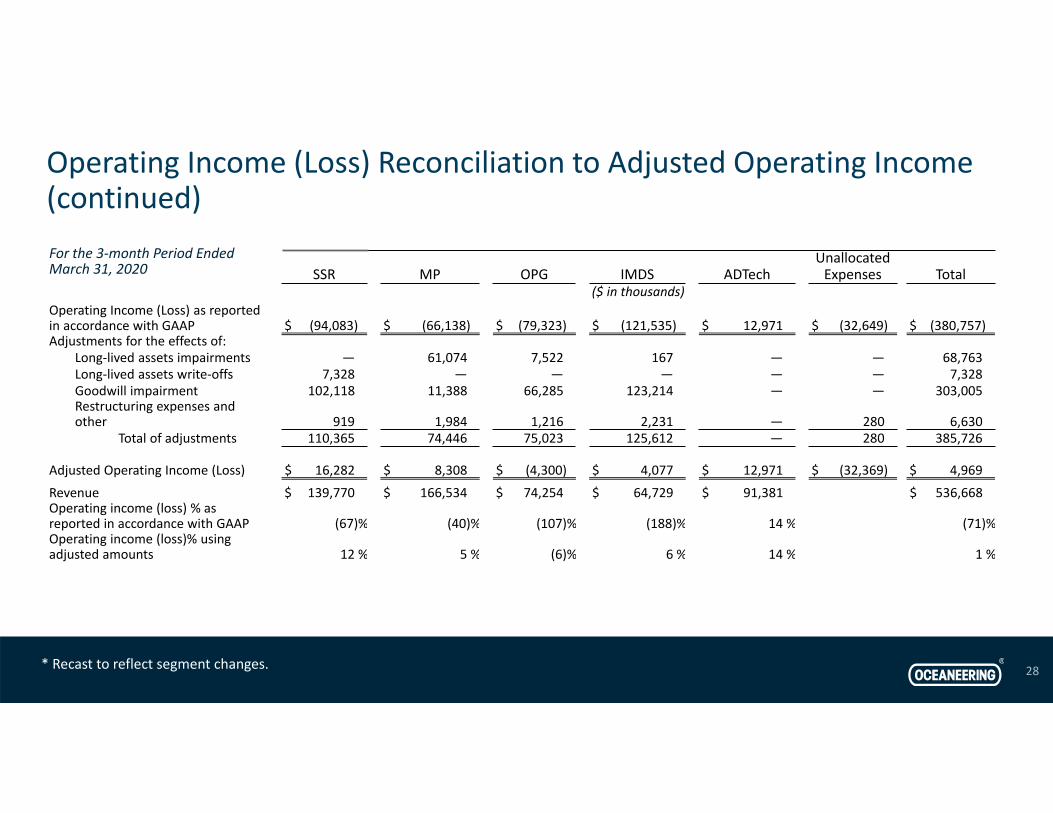
Operating Income (Loss) Reconciliation to Adjusted Operating Income
For the 3‐month Period EndedMarch 31, 2021
Adjusted Operating Income(Loss) excludes the effects of certain specified items, as set forth in the tables that follow. We believe Adjusted Operating Income(Loss) is a useful measurement for investors to review because it provides a consistent measure of the underlying results of our ongoing business by individual business segment and on a consolidated basis. Furthermore, our management uses Adjusted Operating Income(Loss) to measure the performance of our operations. Adjusted Operating Income(Loss) and the Adjusted Operating Income(Loss) percentages set forth below are non‐GAAP financial measures. The following tables provide a reconciliation between operating income (loss) (a GAAP financial measure) and Adjusted Operating Income(Loss) and the associated percentages (non‐GAAP financial measures) for Oceaneering’s historical results on a consolidated basis and by segment for the periods indicated.
SSR MP OPG IMDS ADTechUnallocated Expenses Total
($ in thousands)Operating Income (Loss) as reported in accordance with GAAP $ 14,619 $ 2,753 $ 8,813 $ 2,474 $ 16,839 $ (31,715) $ 13,783Adjustments for the effects of:
Restructuring expenses and other 395 537 149 217 10 — 1,308
Total of adjustments 395 537 149 217 10 — 1,308
Adjusted Operating Income (Loss) $ 15,014 $ 3,290 $ 8,962 $ 2,691 $ 16,849 $ (31,715) $ 15,091
Revenue $ 119,119 $ 86,825 $ 89,234 $ 54,048 $ 88,327 $ 437,553Operating income (loss) % as reported in accordance with GAAP 12 % 3 % 10 % 5 % 19 % 3 %Operating income (loss)% using adjusted amounts 13 % 4 % 10 % 5 % 19 % 3 %
SSR MP OPG IMDS ADTechUnallocated Expenses Total
($ in thousands)Operating Income (Loss) as reported in accordance with GAAP $ (94,083) $ (66,138) $ (79,323) $ (121,535) $ 12,971 $ (32,649) $ (380,757)Adjustments for the effects of:
Long‐lived assets impairments — 61,074 7,522 167 — — 68,763Long‐lived assets write‐offs 7,328 — — — — — 7,328Goodwill impairment 102,118 11,388 66,285 123,214 — — 303,005Restructuring expenses and other 919 1,984 1,216 2,231 — 280 6,630
Total of adjustments 110,365 74,446 75,023 125,612 — 280 385,726
Adjusted Operating Income (Loss) $ 16,282 $ 8,308 $ (4,300) $ 4,077 $ 12,971 $ (32,369) $ 4,969
Revenue $ 139,770 $ 166,534 $ 74,254 $ 64,729 $ 91,381 $ 536,668Operating income (loss) % as reported in accordance with GAAP (67)% (40)% (107)% (188)% 14 % (71)%Operating income (loss)% using adjusted amounts 12 % 5 % (6)% 6 % 14 % 1 %
28
For the 3‐month Period EndedMarch 31, 2020
* Recast to reflect segment changes.
Operating Income (Loss) Reconciliation to Adjusted Operating Income (continued)
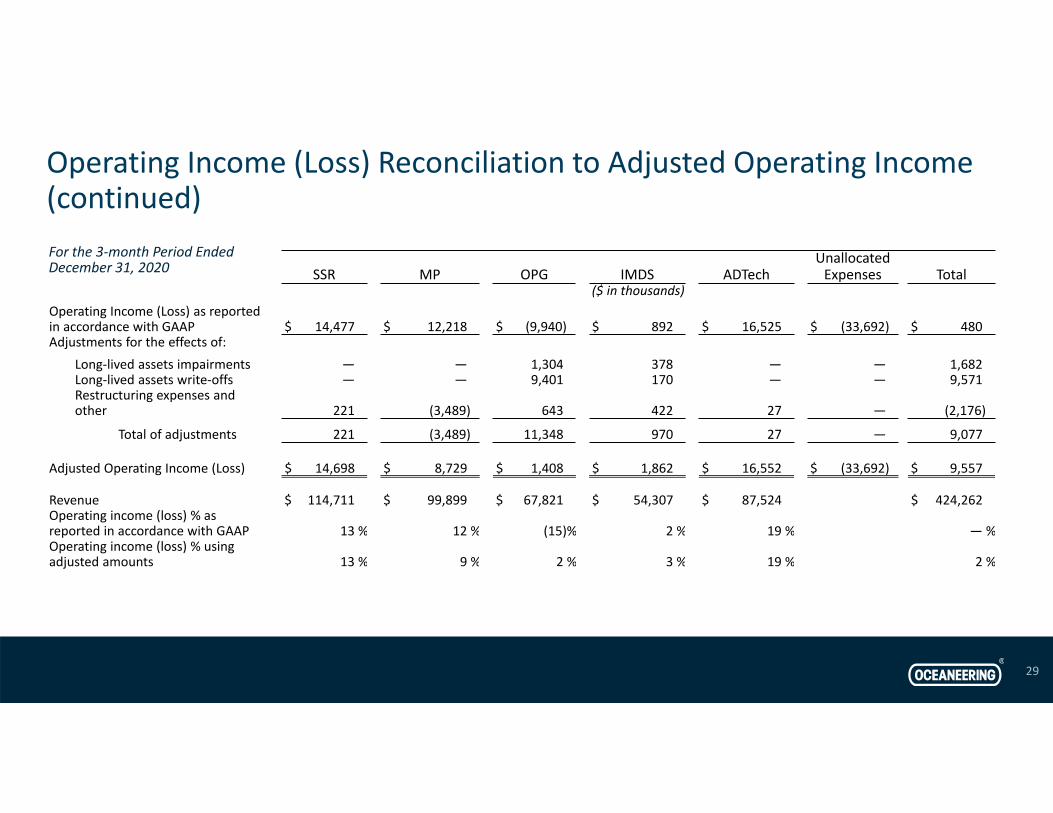
SSR MP OPG IMDS ADTechUnallocated Expenses Total
($ in thousands)Operating Income (Loss) as reported in accordance with GAAP $ 14,477 $ 12,218 $ (9,940) $ 892 $ 16,525 $ (33,692) $ 480Adjustments for the effects of:
Long‐lived assets impairments — — 1,304 378 — — 1,682Long‐lived assets write‐offs — — 9,401 170 — — 9,571Restructuring expenses and other 221 (3,489) 643 422 27 — (2,176)
Total of adjustments 221 (3,489) 11,348 970 27 — 9,077
Adjusted Operating Income (Loss) $ 14,698 $ 8,729 $ 1,408 $ 1,862 $ 16,552 $ (33,692) $ 9,557
Revenue $ 114,711 $ 99,899 $ 67,821 $ 54,307 $ 87,524 $ 424,262Operating income (loss) % as reported in accordance with GAAP 13 % 12 % (15)% 2 % 19 % — %Operating income (loss) % using adjusted amounts 13 % 9 % 2 % 3 % 19 % 2 %
29
Operating Income (Loss) Reconciliation to Adjusted Operating Income (continued)For the 3‐month Period EndedDecember 31, 2020
SSR MP OPG IMDS ADTech
Unallocated Expenses and other Total
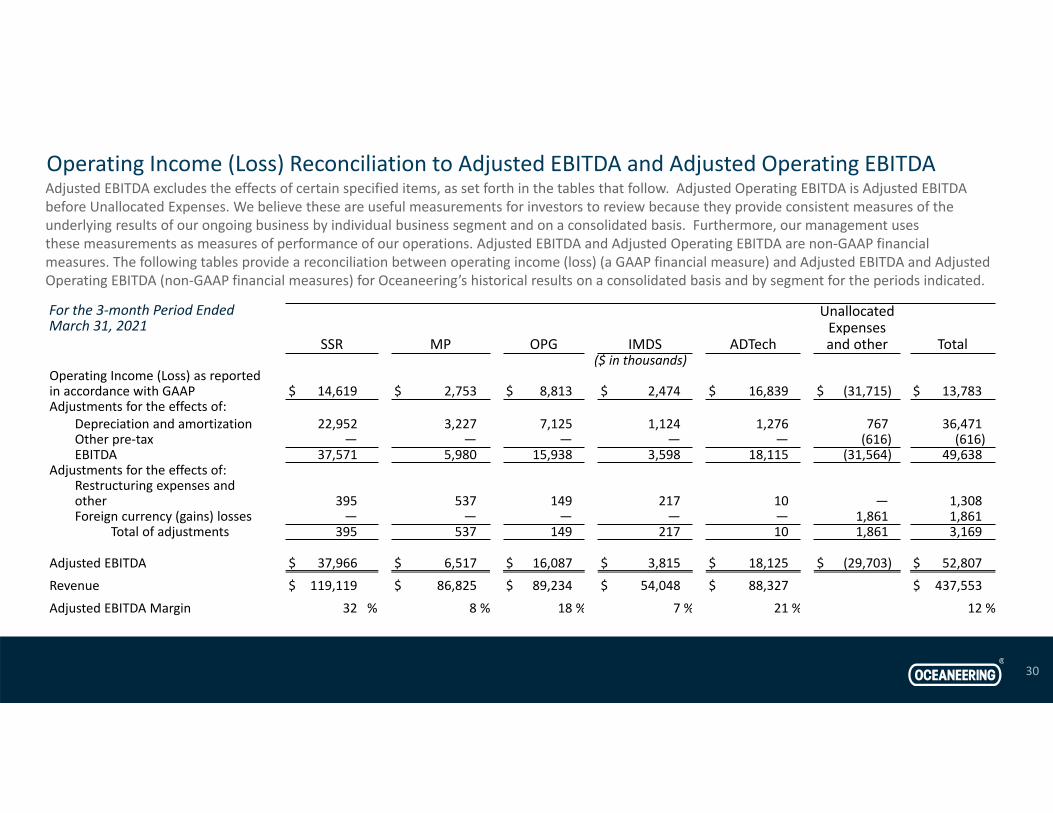
($ in thousands)Operating Income (Loss) as reported in accordance with GAAP $ 14,619 $ 2,753 $ 8,813 $ 2,474 $ 16,839 $ (31,715) $ 13,783Adjustments for the effects of:
Depreciation and amortization 22,952 3,227 7,125 1,124 1,276 767 36,471Other pre‐tax — — — — — (616) (616)EBITDA 37,571 5,980 15,938 3,598 18,115 (31,564) 49,638
Adjustments for the effects of:Restructuring expenses and other 395 537 149 217 10 — 1,308Foreign currency (gains) losses — — — — — 1,861 1,861
Total of adjustments 395 537 149 217 10 1,861 3,169
Adjusted EBITDA $ 37,966 $ 6,517 $ 16,087 $ 3,815 $ 18,125 $ (29,703) $ 52,807
Revenue $ 119,119 $ 86,825 $ 89,234 $ 54,048 $ 88,327 $ 437,553
Adjusted EBITDA Margin 32 % 8 % 18 % 7 % 21 % 12 %
30
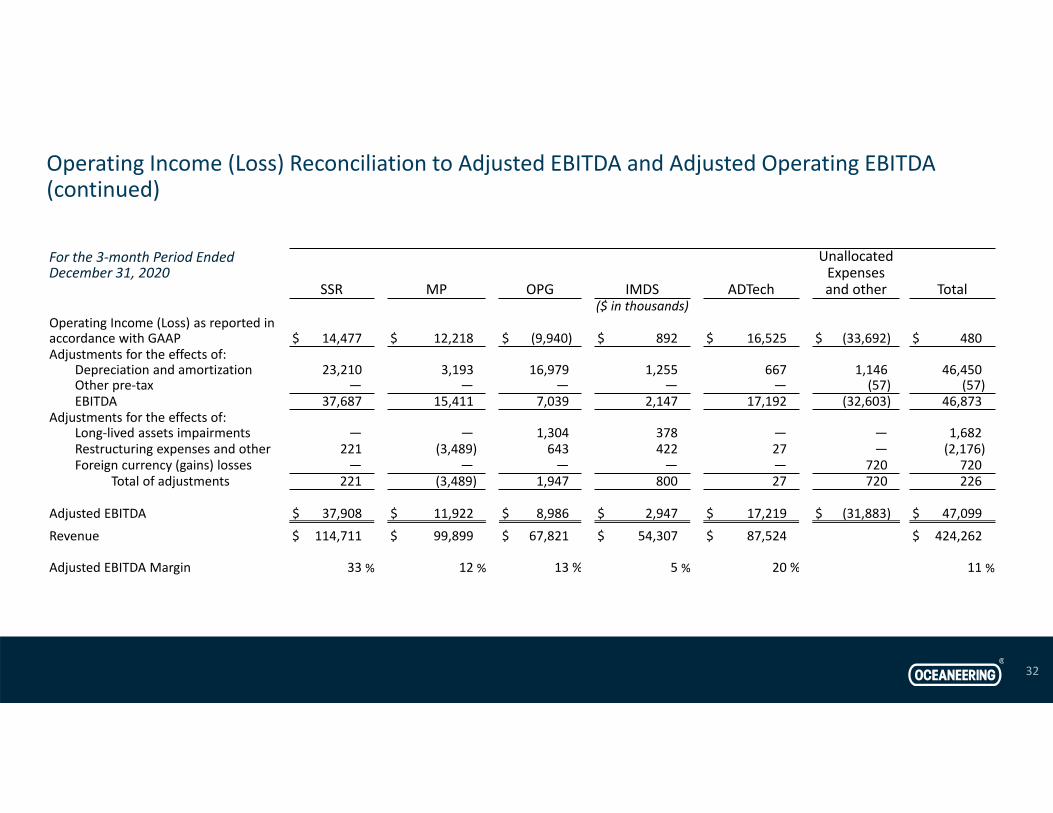
Operating Income (Loss) Reconciliation to Adjusted EBITDA and Adjusted Operating EBITDA
For the 3‐month Period EndedMarch 31, 2021
Adjusted EBITDA excludes the effects of certain specified items, as set forth in the tables that follow. Adjusted Operating EBITDA is Adjusted EBITDA before Unallocated Expenses. We believe these are useful measurements for investors to review because they provide consistent measures of the underlying results of our ongoing business by individual business segment and on a consolidated basis. Furthermore, our management uses these measurements as measures of performance of our operations. Adjusted EBITDA and Adjusted Operating EBITDA are non‐GAAP financial measures. The following tables provide a reconciliation between operating income (loss) (a GAAP financial measure) and Adjusted EBITDA and Adjusted Operating EBITDA (non‐GAAP financial measures) for Oceaneering’s historical results on a consolidated basis and by segment for the periods indicated.
SSR MP OPG IMDS ADTech
Unallocated Expenses and other Total
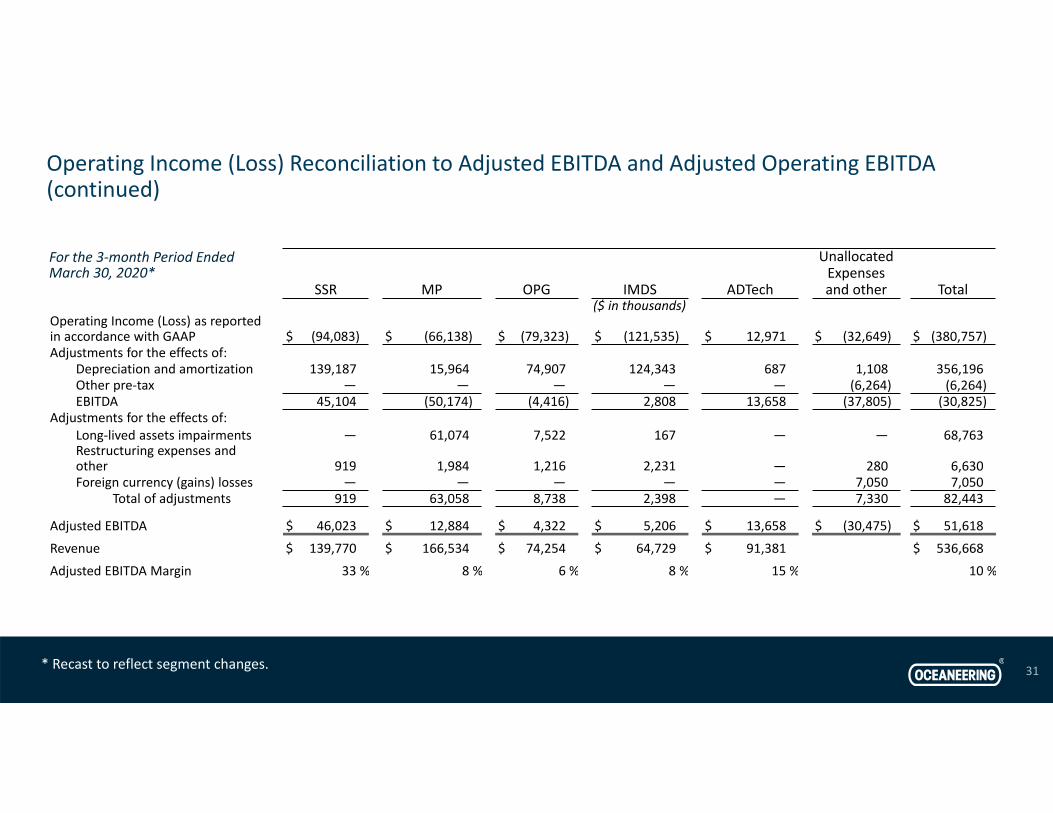
($ in thousands)Operating Income (Loss) as reported in accordance with GAAP $ (94,083) $ (66,138) $ (79,323) $ (121,535) $ 12,971 $ (32,649) $ (380,757)Adjustments for the effects of:
Depreciation and amortization 139,187 15,964 74,907 124,343 687 1,108 356,196Other pre‐tax — — — — — (6,264) (6,264)EBITDA 45,104 (50,174) (4,416) 2,808 13,658 (37,805) (30,825)
Adjustments for the effects of:Long‐lived assets impairments — 61,074 7,522 167 — — 68,763Restructuring expenses and other 919 1,984 1,216 2,231 — 280 6,630Foreign currency (gains) losses — — — — — 7,050 7,050
Total of adjustments 919 63,058 8,738 2,398 — 7,330 82,443
Adjusted EBITDA $ 46,023 $ 12,884 $ 4,322 $ 5,206 $ 13,658 $ (30,475) $ 51,618
Revenue $ 139,770 $ 166,534 $ 74,254 $ 64,729 $ 91,381 $ 536,668
Adjusted EBITDA Margin 33 % 8 % 6 % 8 % 15 % 10 %
31
Operating Income (Loss) Reconciliation to Adjusted EBITDA and Adjusted Operating EBITDA (continued)
For the 3‐month Period EndedMarch 30, 2020*
* Recast to reflect segment changes.
SSR MP OPG IMDS ADTech
Unallocated Expenses and other Total
($ in thousands)Operating Income (Loss) as reported in accordance with GAAP $ 14,477 $ 12,218 $ (9,940) $ 892 $ 16,525 $ (33,692) $ 480Adjustments for the effects of:
Depreciation and amortization 23,210 3,193 16,979 1,255 667 1,146 46,450Other pre‐tax — — — — — (57) (57)EBITDA 37,687 15,411 7,039 2,147 17,192 (32,603) 46,873
Adjustments for the effects of:Long‐lived assets impairments — — 1,304 378 — — 1,682Restructuring expenses and other 221 (3,489) 643 422 27 — (2,176)Foreign currency (gains) losses — — — — — 720 720
Total of adjustments 221 (3,489) 1,947 800 27 720 226
Adjusted EBITDA $ 37,908 $ 11,922 $ 8,986 $ 2,947 $ 17,219 $ (31,883) $ 47,099
Revenue $ 114,711 $ 99,899 $ 67,821 $ 54,307 $ 87,524 $ 424,262
Adjusted EBITDA Margin 33 % 12 % 13 % 5 % 20 % 11 %
32
Operating Income (Loss) Reconciliation to Adjusted EBITDA and Adjusted Operating EBITDA (continued)
For the 3‐month Period EndedDecember 31, 2020
SSR MP OPG IMDS ADTech
Unallocated Expenses and other Total
($ in thousands)Operating Income (Loss) as reported in accordance with GAAP $ (65,817) $ (88,253) $ (105,680) $ (121,675) $ 56,023 $ (120,677) $ (446,079)Adjustments for the effects of:
Depreciation and amortization 212,621 66,772 115,288 127,221 2,666 4,327 528,895Other pre‐tax — — — — — (11,362) (11,362)EBITDA 146,804 (21,481) 9,608 5,546 58,689 (127,712) 71,454
Adjustments for the effects of:Long‐lived assets impairments — 61,074 8,826 545 — — 70,445Inventory write‐downs 7,038 — — — — — 7,038Restructuring expenses and other 5,055 2,266 8,590 4,272 572 455 21,210Foreign currency (gains) losses — — — — — 14,140 14,140
Total of adjustments 12,093 63,340 17,416 4,817 572 14,595 112,833Adjusted EBITDA $ 158,897 $ 41,859 $ 27,024 $ 10,363 $ 59,261 $ (113,117) $ 184,287
Revenue $ 493,332 $ 477,419 $ 289,127 $ 226,938 $ 341,073 $ 1,827,889Adjusted EBITDA Margin 32 % 9 % 9 % 5 % 17 % 10 %
33
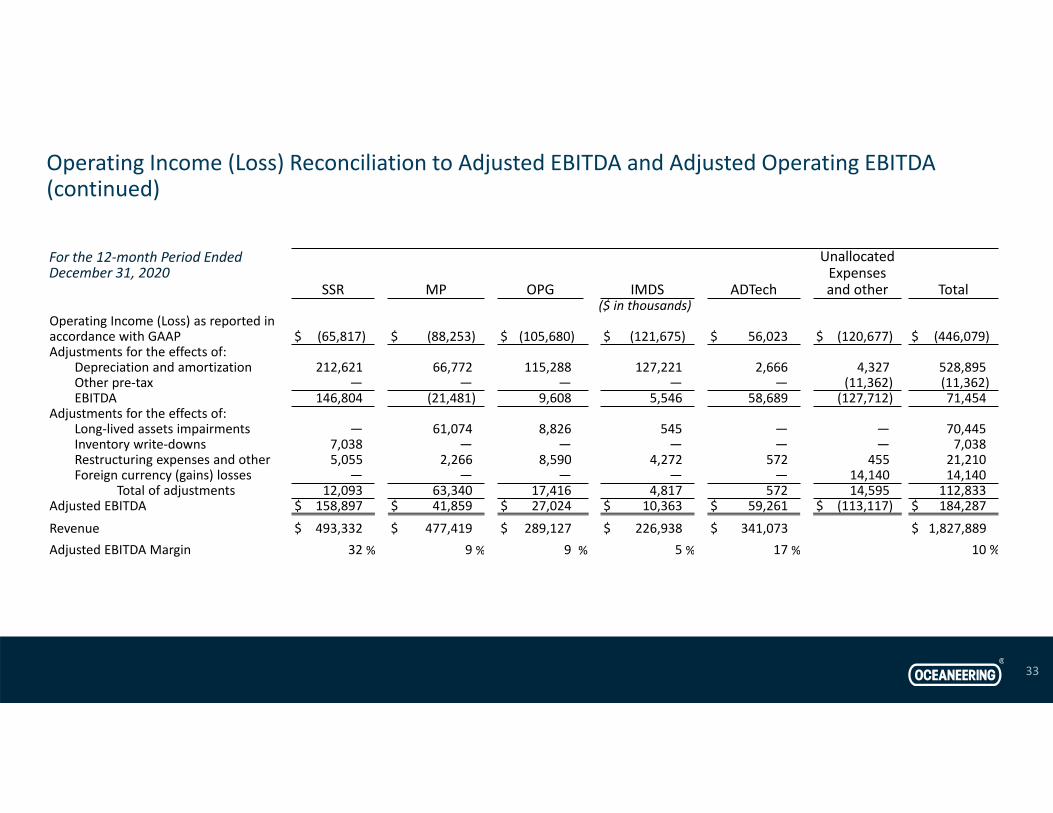
Operating Income (Loss) Reconciliation to Adjusted EBITDA and Adjusted Operating EBITDA (continued)
For the 12‐month Period EndedDecember 31, 2020
SSR MP OPG IMDS ADTech
Unallocated Expenses and other Total
($ in thousands)Operating Income (Loss) as reported in accordance with GAAP $ 11,627 $ 5,730 $ (170,013) $ (52,527) $ 42,574 $ (128,104) $ (290,713)Adjustments for the effects of:
Depreciation and amortization 140,087 20,732 58,044 37,160 2,644 4,760 263,427Other pre‐tax — — — — — (6,635) (6,635)EBITDA 151,714 26,462 (111,969) (15,367) 45,218 (129,979) (33,921)
Adjustments for the effects of:Long‐lived assets impairments — — 142,615 16,738 — — 159,353Inventory write‐downs 15,433 2,107 2,771 719 255 — 21,285Restructuring expenses and other 4,228 757 3,526 3,082 102 56 11,751Foreign currency (gains) losses — — — — — 6,320 6,320
Total of adjustments 19,661 2,864 148,912 20,539 357 6,376 198,709Adjusted EBITDA $ 171,375 $ 29,326 $ 36,943 $ 5,172 $ 45,575 $ (123,603) $ 164,788
Revenue $ 583,652 $ 498,350 $ 380,966 $ 266,086 $ 319,070 $ 2,048,124
Adjusted EBITDA Margin 29 % 6 % 10 % 2 % 14 % 8 %
34
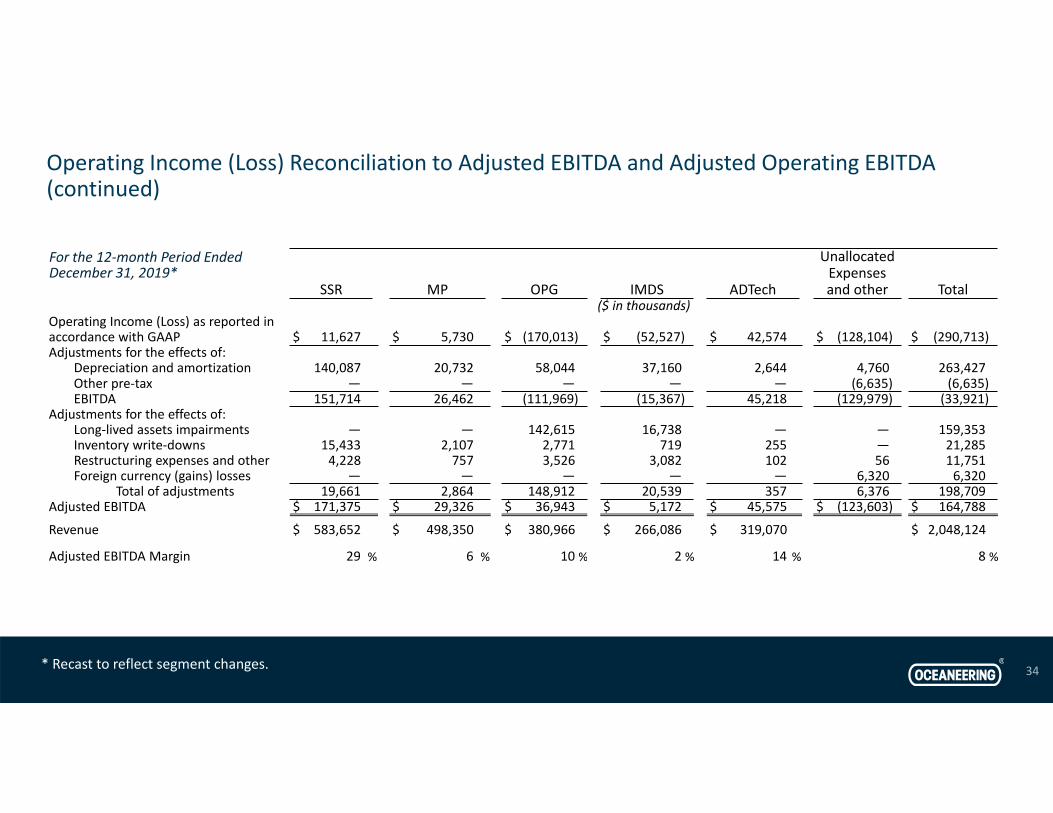
Operating Income (Loss) Reconciliation to Adjusted EBITDA and Adjusted Operating EBITDA (continued)
For the 12‐month Period EndedDecember 31, 2019*
* Recast to reflect segment changes.
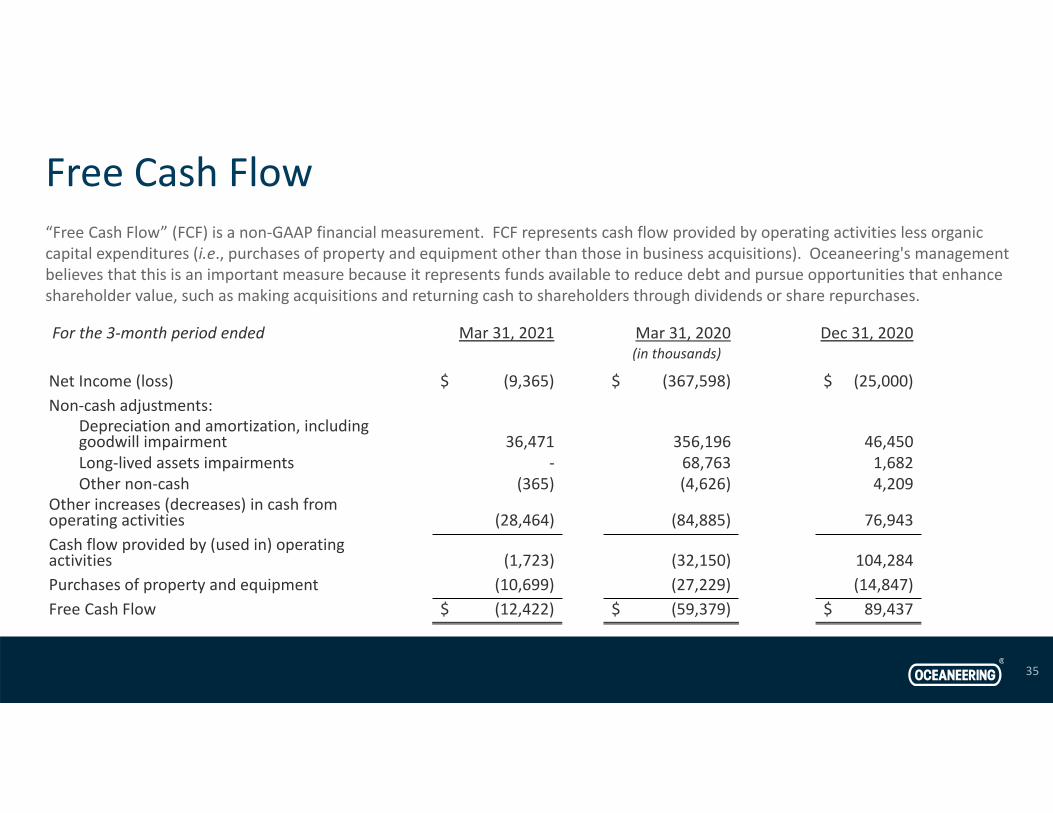
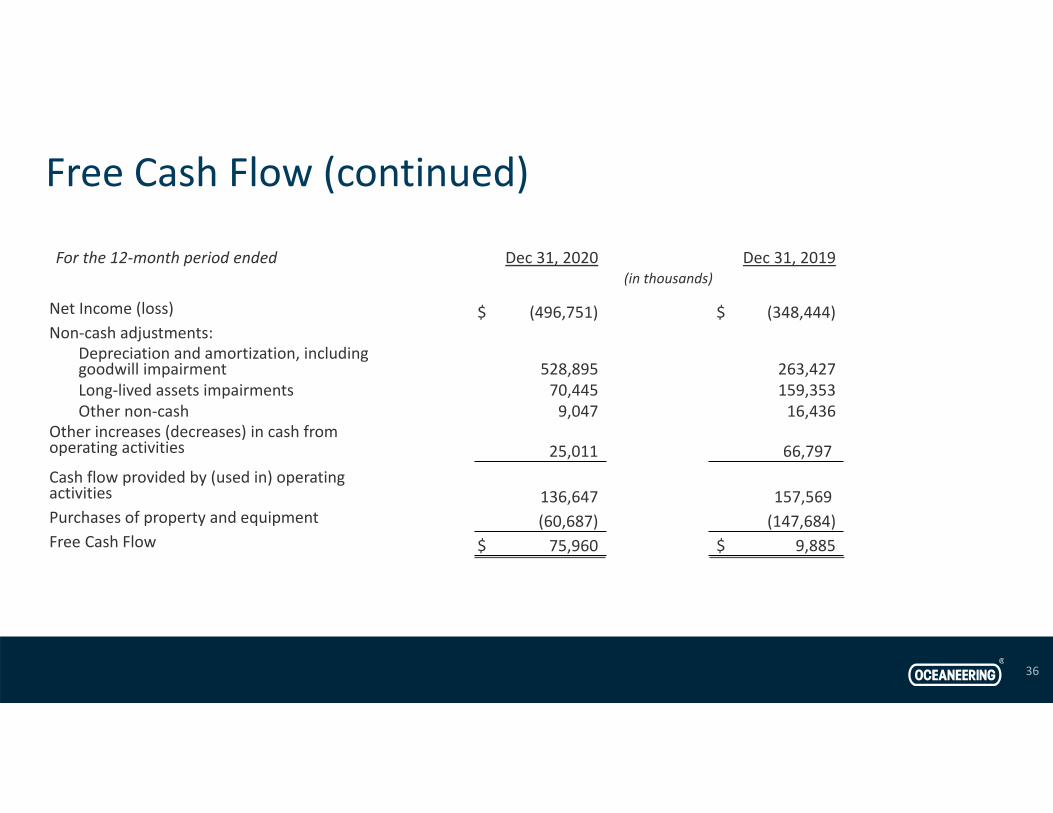
Free Cash Flow“Free Cash Flow” (FCF) is a non‐GAAP financial measurement. FCF represents cash flow provided by operating activities less organic capital expenditures (i.e., purchases of property and equipment other than those in business acquisitions). Oceaneering's management believes that this is an important measure because it represents funds available to reduce debt and pursue opportunities that enhance shareholder value, such as making acquisitions and returning cash to shareholders through dividends or share repurchases.
35
For the 3‐month period ended Mar 31, 2021 Mar 31, 2020 Dec 31, 2020(in thousands)
Net Income (loss) $ (9,365) $ (367,598) $ (25,000)Non‐cash adjustments:
Depreciation and amortization, including goodwill impairment 36,471 356,196 46,450Long‐lived assets impairments ‐ 68,763 1,682 Other non‐cash (365) (4,626) 4,209
Other increases (decreases) in cash from operating activities (28,464) (84,885) 76,943Cash flow provided by (used in) operating activities (1,723) (32,150) 104,284Purchases of property and equipment (10,699) (27,229) (14,847)Free Cash Flow $ (12,422) $ (59,379) $ 89,437
Free Cash Flow (continued)
36
For the 12‐month period ended Dec 31, 2020 Dec 31, 2019(in thousands)
Net Income (loss) $ (496,751) $ (348,444)Non‐cash adjustments:
Depreciation and amortization, including goodwill impairment 528,895 263,427Long‐lived assets impairments 70,445 159,353Other non‐cash 9,047 16,436
Other increases (decreases) in cash from operating activities 25,011 66,797Cash flow provided by (used in) operating activities 136,647 157,569Purchases of property and equipment (60,687) (147,684)Free Cash Flow $ 75,960 $ 9,885
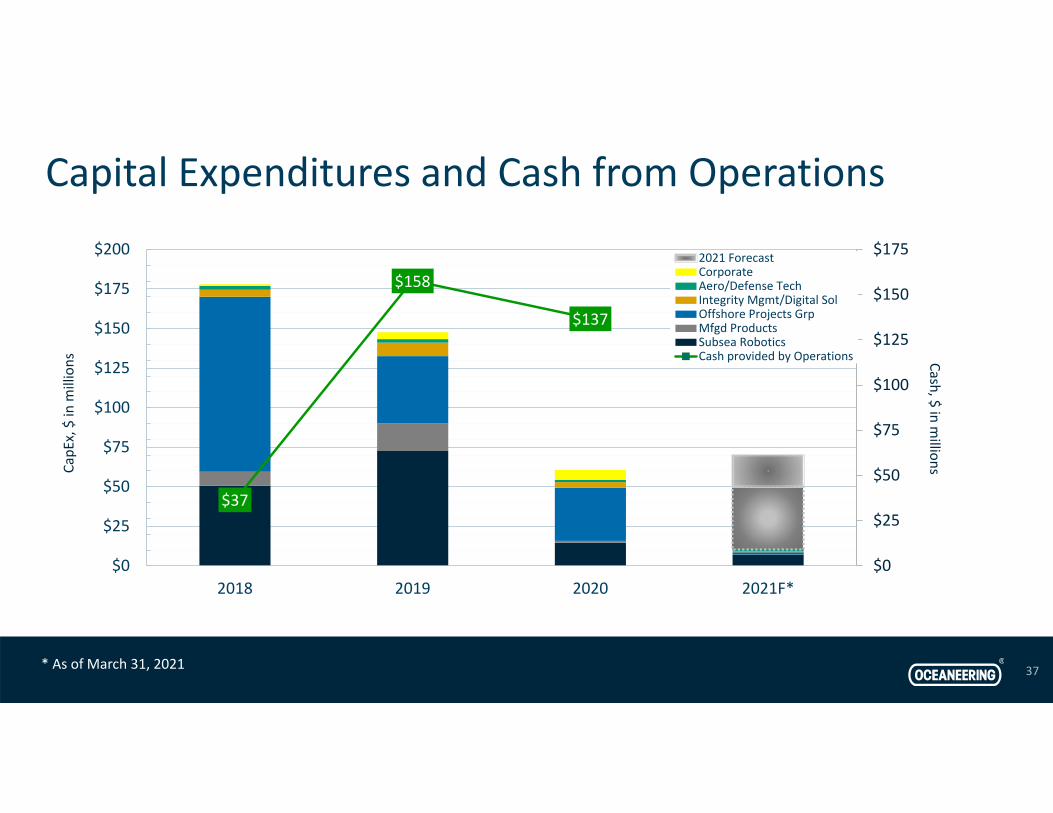
Capital Expenditures and Cash from Operations
37
$37
$158
$137
$0
$25
$50
$75
$100
$125
$150
$175
$0
$25
$50
$75
$100
$125
$150
$175
$200
2018 2019 2020 2021F*
Cash, $ in millionsCa
pEx, $ in
millions
2021 ForecastCorporateAero/Defense TechIntegrity Mgmt/Digital SolOffshore Projects GrpMfgd ProductsSubsea RoboticsCash provided by Operations
* As of March 31, 2021
55% 53%
45% 47%
65% 73%
35% 27%
84% 81%
16% 19%
0%
25%
50%
75%
100%
International United States Services Products Energy Segments Non‐energy Segment
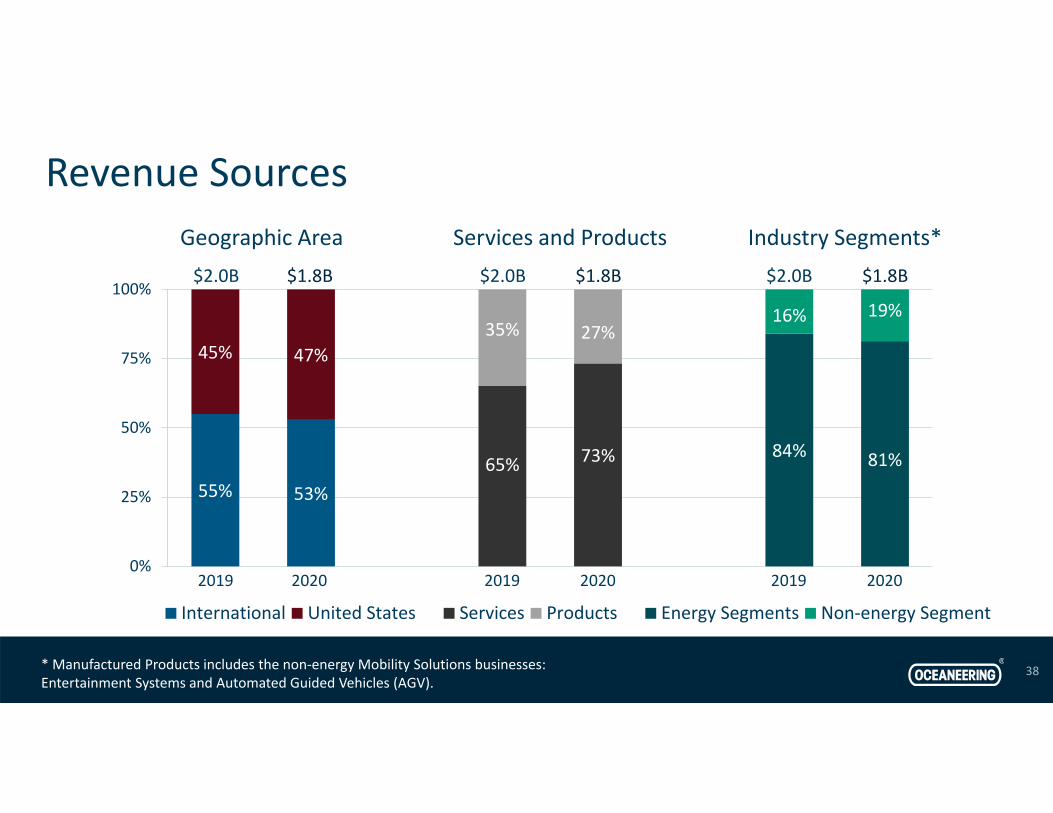
Revenue Sources
38
Geographic Area Services and Products$2.0B $1.8B
2019 2020
$2.0B $1.8B
2019 2020
Industry Segments*$2.0B $1.8B
2019 2020
* Manufactured Products includes the non‐energy Mobility Solutions businesses: Entertainment Systems and Automated Guided Vehicles (AGV).

Financial Overview, by Year
39
28% 27%
24% 26%
19% 16%
13% 12%
16% 19%
0%
25%
50%
75%
100%
2019 2020
Revenue Adjusted Operating EBITDA*
59% 53%
10% 14%
13% 9%
2% 4%
16% 20%
0%
25%
50%
75%
100%
2019 2020
$184.3M$164.8M$2.0B $1.8B
Aerospace/Defense Tech
Manufactured Products
Integrity Mgmt/Digital Sol
Offshore Projects Group
Subsea Robotics
* Percentages exclude Unallocated Expenses and the effects of certain specified items. For reconciliations of Adjusted Operating EBITDA to Operating Income for the periods presented, see the Supplemental Information slides.
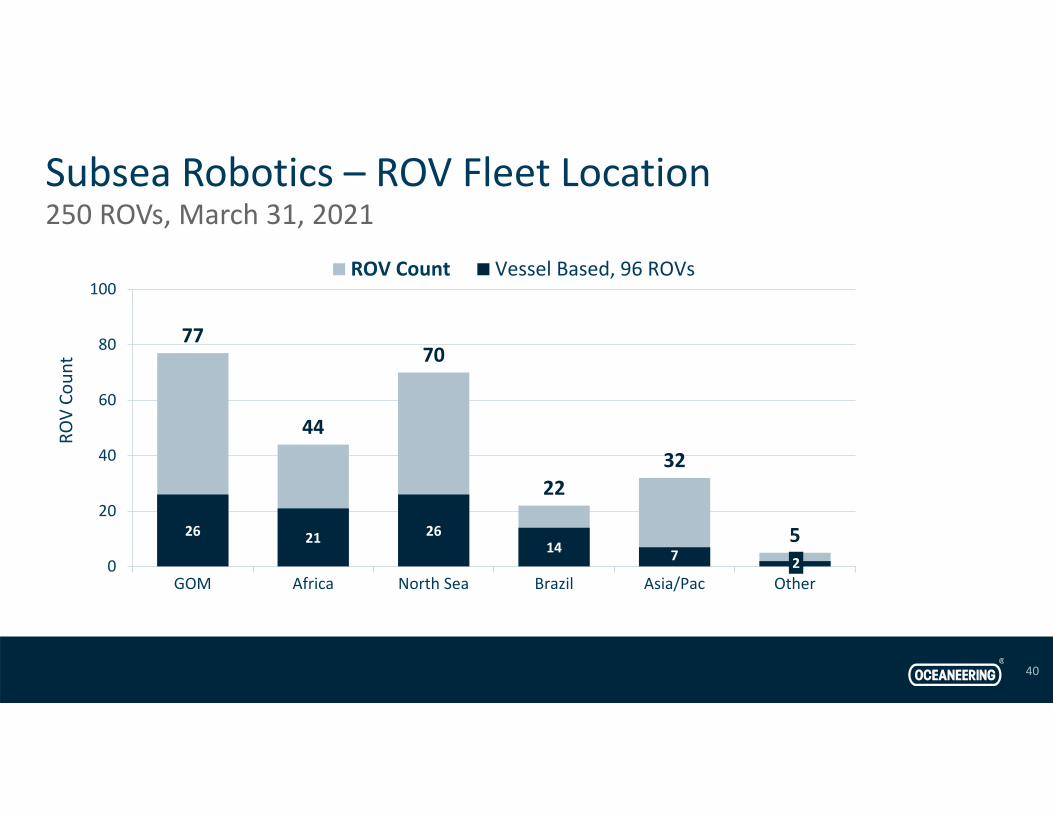
Subsea Robotics – ROV Fleet Location250 ROVs, March 31, 2021
40
77
44
70
2232
526 21 2614 7 20
20
40
60
80
100
GOM Africa North Sea Brazil Asia/Pac Other
ROV Co
unt
ROV Count Vessel Based, 96 ROVs
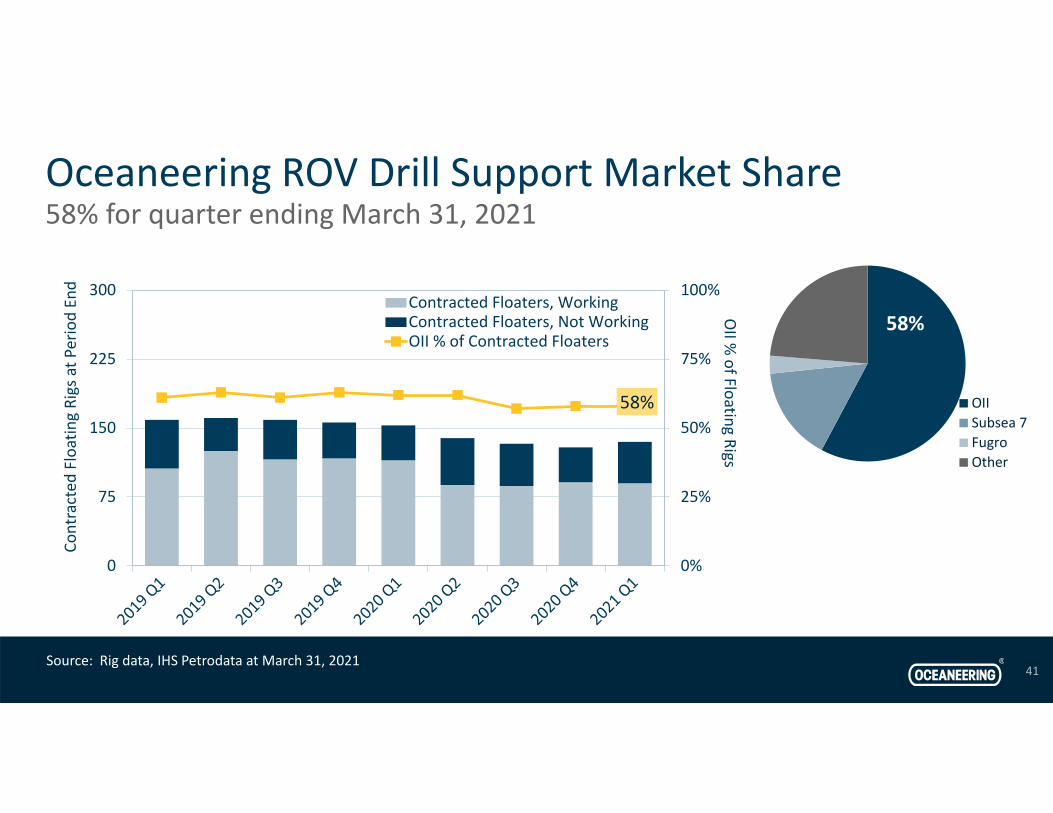
Oceaneering ROV Drill Support Market Share 58% for quarter ending March 31, 2021
41
58%
0%
25%
50%
75%
100%
0
75
150
225
300
OII %
of Floating Rigs
Contracted
Floating Rigs at P
eriod En
d
Contracted Floaters, WorkingContracted Floaters, Not WorkingOII % of Contracted Floaters
58%
OIISubsea 7FugroOther
Source: Rig data, IHS Petrodata at March 31, 2021
42
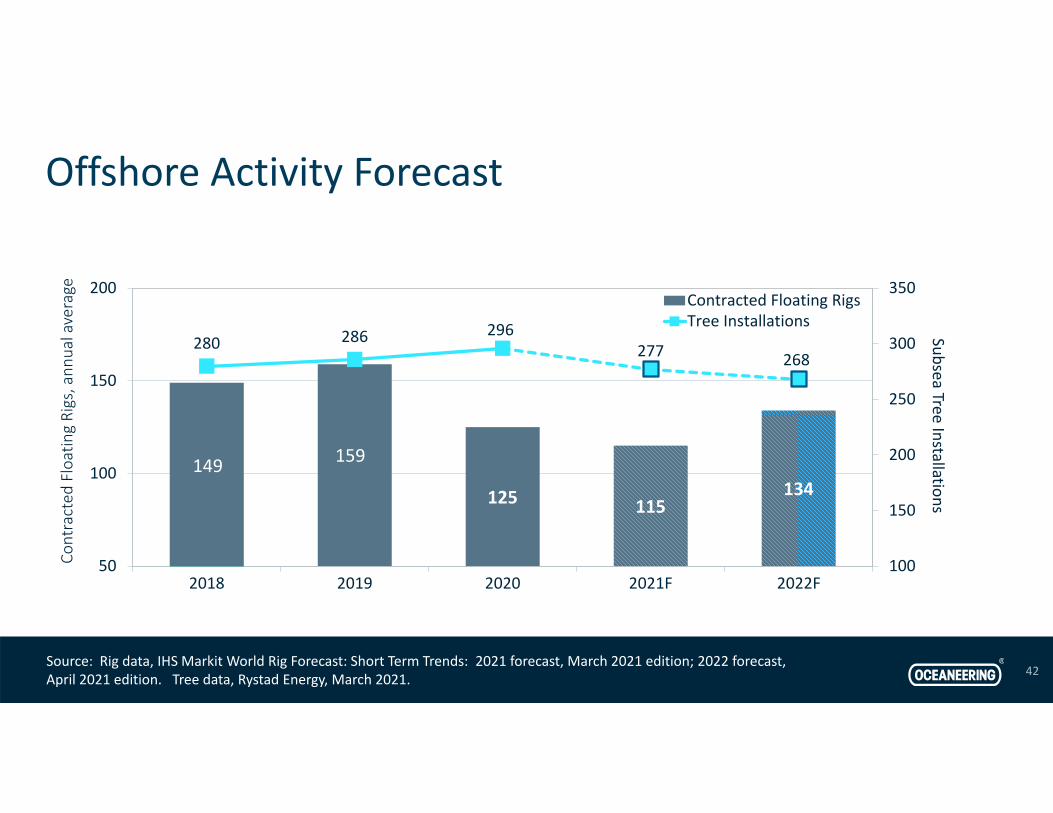
149 159
125 115134
280 286 296277 268
100
150
200
250
300
350
50
100
150
200
2018 2019 2020 2021F 2022F
Subsea Tree Installations
Contracted
Floating Rigs, ann
ual average Contracted Floating Rigs
Tree Installations
Offshore Activity Forecast
Source: Rig data, IHS Markit World Rig Forecast: Short Term Trends: 2021 forecast, March 2021 edition; 2022 forecast, April 2021 edition. Tree data, Rystad Energy, March 2021.
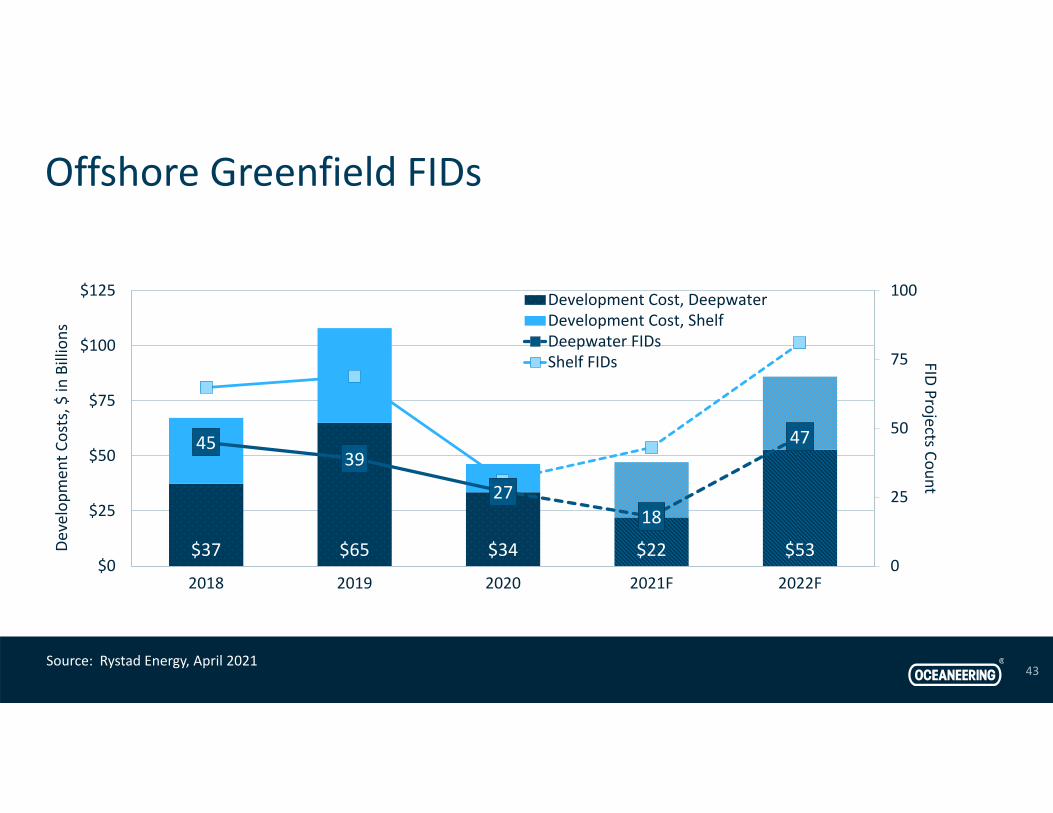
$37 $65 $34 $22 $53
4539
2718
47
0
25
50
75
100
$0
$25
$50
$75
$100
$125
2018 2019 2020 2021F 2022F
FID Projects Count
Developm
ent C
osts, $
in Billions
Development Cost, DeepwaterDevelopment Cost, ShelfDeepwater FIDsShelf FIDs
43
Offshore Greenfield FIDs
Source: Rystad Energy, April 2021


