No part of it may be circulated, quoted, or reproduced for distribution outside the organization without prior written approval from Fullerton India Home Finance Co. Ltd. Fullerton India Home Finance Co. Ltd. Investor Presentation Quarter ended March 31 st 2020
Transcript
No part of it may be circulated, quoted, or reproduced for distribution outside the organization without prior written approval from
Fullerton India Home Finance Co. Ltd.
Fullerton India Home Finance Co. Ltd.
Investor Presentation
Quarter ended March 31st 2020
AGENDA
Industry Landscape
About Grihashakti
Business Highlights
Risk Management
Liquidity Management
Financial Performance
2
Industry Landscape
3
4
‘We always over-estimate the Change that will occur in the next two years & underestimate the Change that will occur in the nextten.’ – Bill Gates
36%
48%51%
64%69%
2015 2019 2020 2025 2027
India's Millennial as % of Workforce**
Incremental demand
198
164 150 137
56
-
50
100
150
200
1980 1990 2000 2010 2015 2019
Credit-to-GDP ratio*
KR UK US MY IN
Underpenetrated Market
Source –** Morgan Stanley ^PwC – GDP at purchasing power parity (PPP) adjusts for price level differences providing a better measure of the volume of goods and services produced. *BIS (KR: Korea UK: United Kingdom US: United States MY: Malaysia IN: India)
India's economy is poised to become third-largest by 2027 with $6 trillion GDP**
8.7
11.8
15.7
2016 2020 2025
GDP in PPP^ (US$ trillion)
Growth potential
Housing FinanceBuoyed by demographics, unmet demand
Segment Opportunity
Total Household Population
~110 Mio
~140 Mio
~1,100 Mio
Per Capita Income
$ 8,800
$ 3,000
$ 1,200
• Indian mortgage market is significantly
underpenetrated. Mortgage to GDP Ratio at 10%
• Rising trend of urbanization (at 34%) resulting in
increasing GDP per capital ($) 2019 at US$ 2,242
• Improving affordability, nuclearisation of families,
emergence of tier-II and tier-III cities, ease of
financing, tax incentives to support growth
• Government measures continue to help the sector.
Extending Small Ticket Loans in Tier 1 peripherals, Tier 2 & 3 towns
NHB Refinance Diversifies funding mix and
supplements bank borrowings
Risk Weighted Assets
Lower risk weightage for Home Loans
SARFAESI Applicable across ticket sizes for
Housing Finance Cos.
Valuation premium
100% secured business enhances valuation multiplier of the group
Consumer Benefit
Tax incentives
Government subsidies & schemes
HFCs’ average loan life is ~7-8 years
Annuity Income
Consumer
• Housing for all (Pradhan Mantri Awas Yojana) scheme to address urban housing shortage, CLSS to push affordable housing extended till Mar-21
• Home buyers recognized as financial creditors under IBC
• RERA implementation – protecting interests of buyers
• Union Budget 2020 has continued its focus on affordable housing segment. It has favoured both home buyers and developers in terms of tax incentives
Developer • Tax holiday for real estate cos. involved in affordable projects
• GST rates slashed for under-construction flats to 5% and affordable homes to 1%, effective from April 1, 2019
• Smart City Project - plan to build 100 smart cities
• RERA regulation to enhance developer performance & transparency
Regulatory / Government Support
• Relaxation in LTV norms and risk weight guidelines
• Grant of infrastructure status to affordable housing
• Better access to funds with revised ECB regulation
• Enhanced Home Loan limit under Priority Sector Lending (PSL)
• NHB refinancing limit for HFCs increased to INR 300 billion
• Reduction in the minimum holding period for assets to be securitised
• Asset purchase under government guarantee scheme
HFC vs. NBFCs
The HFC Advantage
Impetus for Long-term growth
6
About Us – The Group
7
8
Fullerton Financial Holdings, Singapore (FFH) is a wholly
owned subsidiary of Temasek Holdings
• Temasek is a global investment company, headquartered in
Singapore
• FFH invests in and operates financial institutions in
emerging markets
Fullerton India Credit Co. Ltd. (FICCL) is a wholly-owned
subsidiary of FFH
• FICCL was acquired by FFH in December 2005
• Launched Commercial Operations in January 2007
• Pan-India presence established across 22 states and 3
union territories
• Retail finance products for urban and rural households as
well as SMEs
Grihashakti, Fullerton India Home Finance Co. Ltd. is a
wholly-owned subsidiary of FICCL
• Commenced operations in December 2015
About UsHousing Finance arm of Fullerton India
Temasek Holdings (Private) Ltd.
Fullerton Financial Holdings Pte Ltd
Fullerton India Credit Company Ltd.
Fullerton India Home Finance Company Ltd.
Wholly owned subsidiary
Wholly owned subsidiary
Wholly owned subsidiary
Fullerton Management Pte Ltd
Angelica Investments Pte Ltd
Wholly owned subsidiary
96.15%
3.85%
DUBAI, UAE6 outlets34k Cust
INDIA648 Branches3,200k Cust
Central CHINA4 Provinces,41 Outlets100k Cust
CHINA127 Community Banks2400k Customers
MYANMAR51 Branches223k Cust
CAMBODIA POST BANK103 Branches129k Cust
MALAYSIA82 Branches957 k Cust
Fullerton Financial Holdings (FFH) has 8 operating financial services entities located across 6countries.
9
INDIADigital MSME
55K Cust
FFH operates financial institutions in emerging marketsFocused on SME and mass market customer segments
*FFH is a wholly owned subsidiary of Temasek ^Fullerton Home Finance is a wholly owned subsidiary of Fullerton India
Fullerton Home Finance^
Multi-product offerings support a range of customer needs
Consumer
Urban MSME
Rural
Cross-Sell
Personal Loans, Loans Against Property
Commercial Vehicle Loans, Business Loans, Loans Against Property
Personal / Group Loans, Loans Against Property, Vehicle Loans
Life / General Insurance
Established Customer Connect across Urban and Rural India
24,805 Cr
AUM (INR)
> 3.6 MioCustomers
648
Branches
14,264Employees
58,000
Villages
AAARating*
Data as at FY 20. *Rating CRISIL, ICRA, CARE. (Temasek rated 'AAA/Stable' by S&P Global)
Fullerton India Credit CompanyA wholly-owned subsidiary of Fullerton Financial Holdings
Digital Tapping expanded (newer & wider) segment of customers
10
The Foundation For our Strategy and Culture
VisionBe the Company of choice in financial services for our customers, employees, communities and
stakeholders, recognized for innovation and high ethical standards.
Values
Agility
Diversity
Collaboration
Integrity
Innovation
Excellence
11
Board & Management TeamStrong Oversight and Guidance
12
Anindo MukherjeeChairman – Grihashakti,
Non-Executive Director - Fullerton India Credit Co. Ltd
Rakesh MakkarCEO - Grihashakti,
Whole-time Director
Milan ShusterIndependent Director
Rajashree NambiarNon-Executive Director,
MD & CEO – Fullerton India Credit Co, Ltd
Board of Directors
Management Team
Pankaj MalikChief Financial Officer
Parag ShahChief Risk Officer
Ram KolliGM – Head Business & Product
Rakesh MakkarCEO - Grihashakti,
Whole-time Director
FFH has senior level representation on the Board and various committees of Board
Sudha PillaiIndependent Director
About Us - Our Journey
13
14
Jul-15
Dec-15
Nov-16
Sep-17
Mar-19
Jan-18Rated AA+ by CARE
Received HFC license with equity infusion of INR 1
Bio
Started operations with 20
branches
Sep-16
Crossed AUM of INR 10 Bio
Team size of 425
Nov-17SARFAESI Approval
Crossed AUM of INR 15 Bio
Crossed AUM of INR 30 Bio
Expanded – Added 20 more branches
Expanded network to 60 Branches Jun-19
Crossed AUM of INR 35 Bio
Enhanced network of 78 branches
Jul-19
Equity infusion of INR 2 Bio
Aug-19
CRISIL ‘AAA’ Rated
Closed securitization deal worth INR 2 Bio
Mar-20
Rated ‘AAA’ by CARE
Our Journey So FarSteady asset growth, geographical expansion
Nov-19 Crossed AUM of INR 43 Bio
Grihashakti Overview Deepening presence in underserved segments
15
AUM
INR 43,016 Mio
Customer Acc.
~23,000
Average Yield
12.7%
Avg. Ticket Size
2.0 Mio
Home Loan AUM
58%
Salaried (Units)
38%
Sales: Credit
3:1
No. of branches
78
Net Revenue
INR 2,369 Mio
Working Profit
INR 1,065 Mio
Net NPA
2.0%
C/I
55.1%
Financial Performance as of Mar-20
16
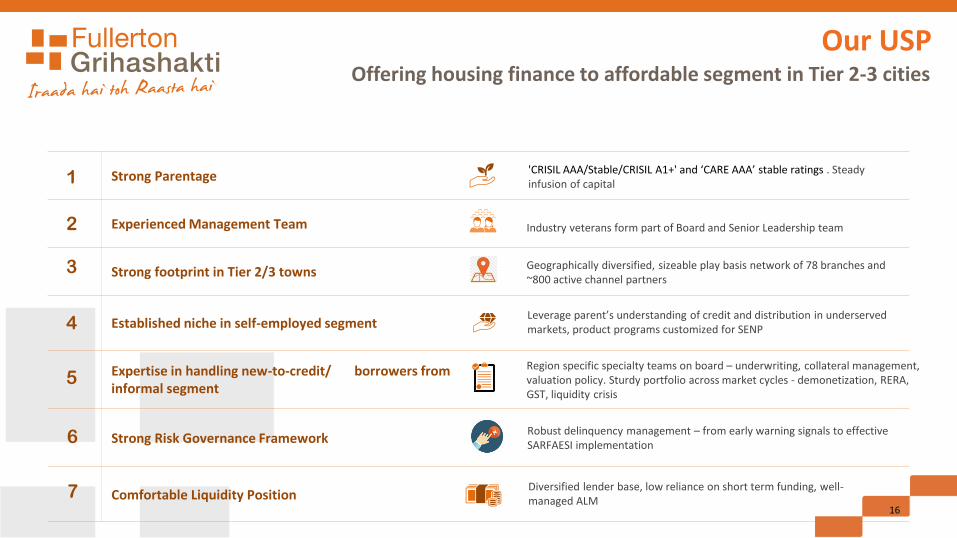
Strong Parentage
Experienced Management Team
Strong footprint in Tier 2/3 towns
Established niche in self-employed segment
Expertise in handling new-to-credit/ borrowers from informal segment
Strong Risk Governance Framework
Comfortable Liquidity Position
'CRISIL AAA/Stable/CRISIL A1+' and ‘CARE AAA’ stable ratings . Steady infusion of capital
Industry veterans form part of Board and Senior Leadership team
1
2
3
4
5
6
Geographically diversified, sizeable play basis network of 78 branches and ~800 active channel partners
Leverage parent’s understanding of credit and distribution in underserved markets, product programs customized for SENP
Robust delinquency management – from early warning signals to effective SARFAESI implementation
7 Diversified lender base, low reliance on short term funding, well-managed ALM
Region specific specialty teams on board – underwriting, collateral management, valuation policy. Sturdy portfolio across market cycles - demonetization, RERA, GST, liquidity crisis
Offering housing finance to affordable segment in Tier 2-3 cities
Our USP
Business Highlights
17
311.7%
141.1%
68.1% 68.2% 55.1%
FY16 FY17 FY18 FY19 FY20
Cost/Income Ratio
-49 -74
246465
1,065
FY16 FY17 FY18 FY19 FY20
Operating Profit (INR Mio)
23 180
770
1,459
2,369
FY16 FY17 FY18 FY19 FY20
Net Revenue(INR Mio)
137267
517774 805
FY16 FY17 FY18 FY19 FY20
People strength
18
Building Strong FranchiseSince inception performance
Note - FY16 and FY17 nos. are as per IGAAP while, FY18 and FY19 are as per IndAS
2424,735
19,022
30,654
43,016
FY16 FY17 FY18 FY19 FY20
AUM (INR Mio)
1472,348
9,664
16,519
22,892
FY16 FY17 FY18 FY19 FY20
Customer Base
19
Meeting Diverse Customer NeedsTrusted partner for customers, DSA channels
Product ShareProduct Suite
Fulfil dream of owning a home
• Home Loans (HL) –Purchase of New and Resale
• Home Improvement• Home Construction • Residential Plot and
Home Construction Loans
• Home Extension Loans
Expand Business /Working Capital
• Loan against Property (LAP)
• Lease Rental Discounting
• Loans for commercial property - New and Resale
• Loans for construction of commercial property
Access to developers• Approved Project
Financing• Construction
Finance (CF)
Programs customized for self-employed segment
• Liquid Income Program
• Gross Turnover Program
• Income Multiplier Program
• Banking Product• High Equity Program• EMI Equalizer
Program
59%
40%
1%
Closing AUM (March-20)
HL LAP CF
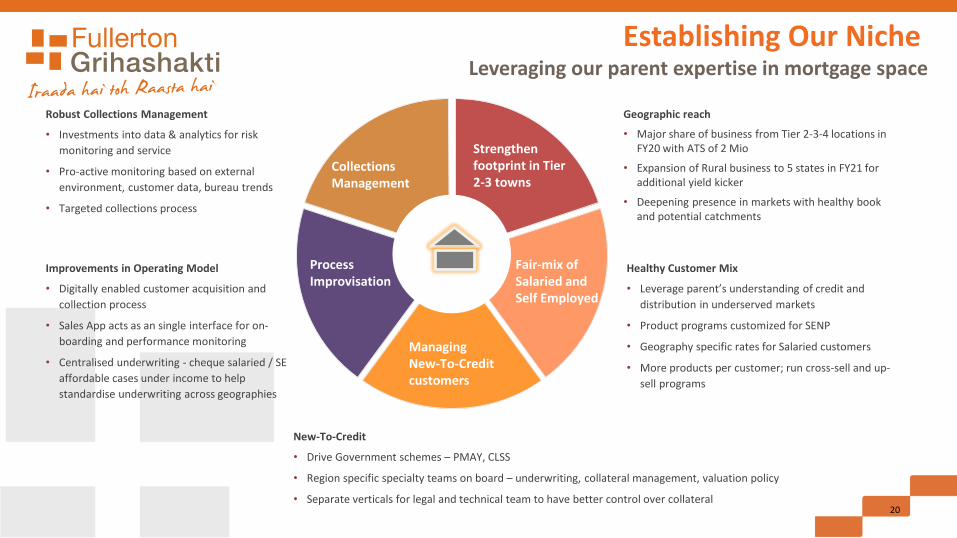
Geographic reach
• Major share of business from Tier 2-3-4 locations in FY20 with ATS of 2 Mio
• Expansion of Rural business to 5 states in FY21 for additional yield kicker
• Deepening presence in markets with healthy book and potential catchments
Collections Management
Strengthen footprint in Tier 2-3 towns
Fair-mix of Salaried and Self Employed
Managing New-To-Credit customers
Process Improvisation
Healthy Customer Mix
• Leverage parent’s understanding of credit and
distribution in underserved markets
• Product programs customized for SENP
• Geography specific rates for Salaried customers
• More products per customer; run cross-sell and up-
sell programs
New-To-Credit
• Drive Government schemes – PMAY, CLSS
• Region specific specialty teams on board – underwriting, collateral management, valuation policy
• Separate verticals for legal and technical team to have better control over collateral
Improvements in Operating Model
• Digitally enabled customer acquisition and
collection process
• Sales App acts as an single interface for on-
boarding and performance monitoring
• Centralised underwriting - cheque salaried / SE
affordable cases under income to help
standardise underwriting across geographies
Robust Collections Management
• Investments into data & analytics for risk
monitoring and service
• Pro-active monitoring based on external
environment, customer data, bureau trends
• Targeted collections process
20
Establishing Our NicheLeveraging our parent expertise in mortgage space
21
Build local scale; depth over breadth
Smart Usage of Analytics
AnalyticsProductivity
• Build business rule engine for reducing human
bias and faster processing
• Scorecard-based underwriting for HL
• Analytics driven up-sell and cross-sell program
• Usage of bureau data and analytics to identify
low-risk target segments
• Early allocation of high risk accounts through risk
segmentation of customers (based on bounce
and off us) on field to improve customer contact
ratio and conversion
Systems• Leveraging on-ground expertise and resources
sharing with FICC branches
• Policy trainings for frontline team
• Maintain healthy mix of DSA and Direct sourcing
• Enhance partnerships with banks, MFIs, fintech
firms, online alliances and developers
• Considering tough conditions for real estate, no
new cases for developer funding
• Less 10% portfolio is under-construction
• Focus on building a low cost, scalable operating model
• Reduce operating expenses through process enhancements
• Usage of digital assets – customer portal and mobile app for
loan origination
• Digital payment infrastructure for collections
Robust Housing Finance PlatformBuilding strong business franchise on the foundation of risk governance
Covid related activities
Portfolio Protection and Risk Mitigation
Process and Cost Re-engineering
Process improvement and digitization, Rationalizing expenses, Data mining and analysis, Workflows for
new ways of underwriting and risk mitigation
One TEAM approach for Sales, Credit & Collection verticals
Product Policy and Technical Valuation trainings conducted for frontline teams
Up-skilling, team activities to keep team engaged and motivated
This presentation has been prepared by Fullerton India Home Finance Company Limited (the “Company”) solely for your information. This presentation is for information purposes only and should not be deemed to
constitute or form part of any offer or invitation or inducement to sell or issue any securities, or any solicitation of any offer to purchase or subscribe for, any securities of the Company, nor shall it or any part of it or the
fact of its distribution form the basis of, or be relied upon in connection with, any contract or commitment therefor. The financial information in this presentation may have been re-classified and reformatted for the
purposes of this presentation. You may also refer to the financial statements of the Company available at https://www.grihashakti.com/home.aspx, before making any decision on the basis of this information.
This presentation contains statements that may not be based on historical information or facts but that may constitute forward-looking statements. These forward looking statements include descriptions regarding the
intent, belief or current expectations of the Company or its directors and officers with respect to the results of operations and financial condition of the Company. Such forward-looking statements are not guarantees of
future performance and involve risks and uncertainties, and actual results may differ from those in such forward-looking statements as a result of various factors and assumptions which the Company presently believes to
be reasonable in light of its operating experience in recent years but these assumptions may prove to be incorrect. Any opinion, estimate or projection constitutes a judgment as of the date of this presentation, and there
can be no assurance that future results or events will be consistent with any such opinion, estimate or projection. The Company does not undertake to revise any forward-looking statement that may be made from time to
time by or on behalf of the Company.
No representation, warranty, guarantee or undertaking, express or implied, is or will be made as to, and no reliance should be placed on, the accuracy, completeness, correctness or fairness of the information, estimates,
projections and opinions contained in this presentation. Potential investors must make their own assessment of the relevance, accuracy and adequacy of the information contained in this presentation and must make such
independent investigation as they may consider necessary or appropriate for such purpose. This presentation does not constitute and should not be considered as a recommendation by the Company that any investor
should subscribe for, purchase or sell any of Company's securities. By viewing this presentation you acknowledge that you will be solely responsible for your own assessment of the market and the market position of the
Company and that you will conduct your own analysis and be solely responsible for forming your own view of the potential future performance of the business of the Company. None of the Company, book running lead
managers, their affiliates, agents or advisors, the placement agents, promoters or any other persons that may participate in any offering of any securities of the Company shall have any responsibility or liability whatsoever
for any loss howsoever arising from this presentation or its contents or otherwise arising in connection therewith. This presentation and its contents are confidential and should not be distributed, published or reproduced,
in whole or part, or disclosed by recipients directly or indirectly to any other person. Viewing this information may not be lawful in certain jurisdictions. In other jurisdictions only certain categories of person may be
allowed to view this information. Any person who wishes to view this site must first satisfy themselves that they are not subject to any local requirements which prohibit or restrict them from doing so. Please exit this
webpage if you are not permitted to view this presentation on this website or are in any doubt as to whether you are permitted to view these materials.
This presentation has been prepared by the Company based on information and data which the Company considers reliable, but the Company makes no representation or warranty, express or implied, whatsoever, and noreliance shall be placed on, the truth, accuracy, completeness, fairness and reasonableness of the contents of this presentation. This presentation may not be all inclusive and may not contain all of the information that youmay consider material. Any liability in respect of the contents of, or any omission from, this presentation is expressly excluded.