Visit us at www.sharekhan.com Index Stock Update - Maruti Suzuki Stock Update - HCL Technologies Stock Update - ICICI Bank Stock Update - Supreme Industries Viewpoint - L&T Finance Holdings Viewpoint - Aditya Birla Fashion & Retail IPO Flash - Cochin Shipyard Limited Investor’s Eye July 27, 2017
Transcript
Visit us at www.sharekhan.com
IndexStock Update - Maruti Suzuki
Stock Update - HCL Technologies
Stock Update - ICICI Bank
Stock Update - Supreme Industries
Viewpoint - L&T Finance Holdings
Viewpoint - Aditya Birla Fashion & Retail
IPO Flash - Cochin Shipyard Limited
Investor’s EyeJuly 27, 2017
July 27, 2017 2
Company details
Price target: Rs8,500
Market cap: Rs229,348 cr
52-week high/low: Rs7,679/4,513
NSE volume: (No of shares) 4.64 lakh
BSE code: 532500
NSE code: MARUTI
Sharekhan code: MARUTI
Free float: (No of shares) 13.2 cr
Price chart
Shareholding pattern
Price performance
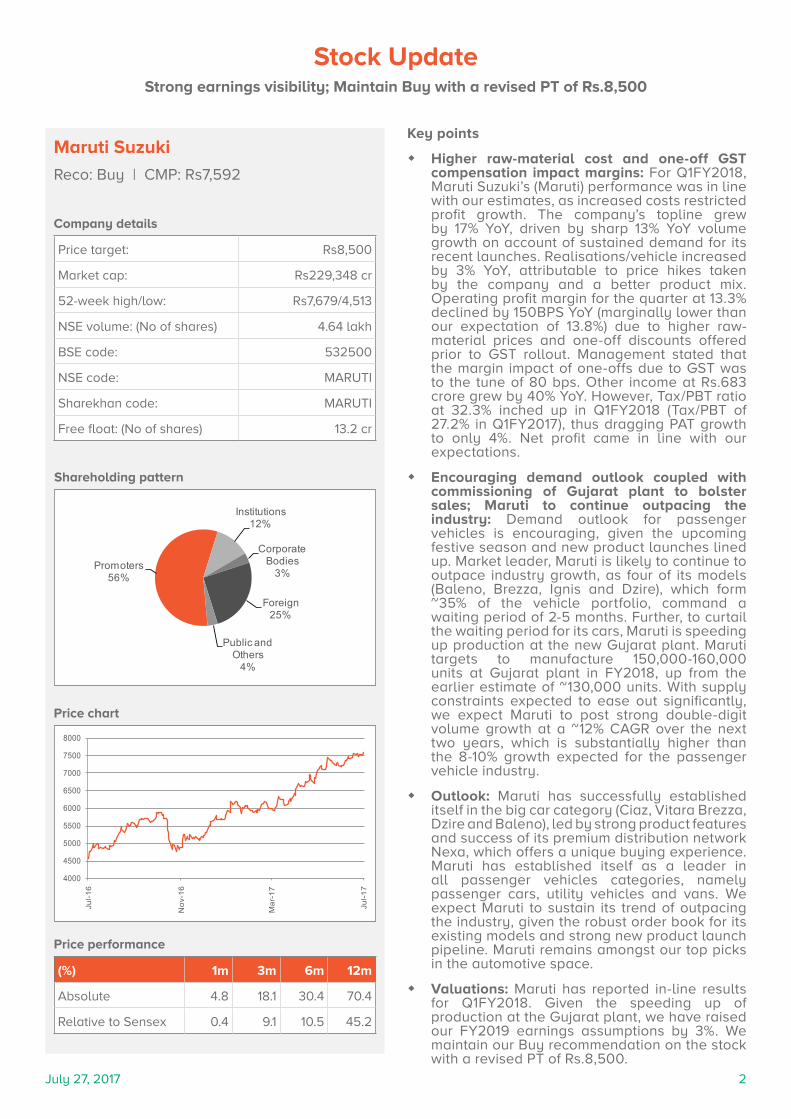
Maruti Suzuki
Reco: Buy | CMP: Rs7,592
Key points
� Higher raw-material cost and one-off GST compensation impact margins: For Q1FY2018, Maruti Suzuki’s (Maruti) performance was in line with our estimates, as increased costs restricted profit growth. The company’s topline grew by 17% YoY, driven by sharp 13% YoY volume growth on account of sustained demand for its recent launches. Realisations/vehicle increased by 3% YoY, attributable to price hikes taken by the company and a better product mix. Operating profit margin for the quarter at 13.3% declined by 150BPS YoY (marginally lower than our expectation of 13.8%) due to higher raw-material prices and one-off discounts offered prior to GST rollout. Management stated that the margin impact of one-offs due to GST was to the tune of 80 bps. Other income at Rs.683 crore grew by 40% YoY. However, Tax/PBT ratio at 32.3% inched up in Q1FY2018 (Tax/PBT of 27.2% in Q1FY2017), thus dragging PAT growth to only 4%. Net profit came in line with our expectations.
� Encouraging demand outlook coupled with commissioning of Gujarat plant to bolster sales; Maruti to continue outpacing the industry: Demand outlook for passenger vehicles is encouraging, given the upcoming festive season and new product launches lined up. Market leader, Maruti is likely to continue to outpace industry growth, as four of its models (Baleno, Brezza, Ignis and Dzire), which form ~35% of the vehicle portfolio, command a waiting period of 2-5 months. Further, to curtail the waiting period for its cars, Maruti is speeding up production at the new Gujarat plant. Maruti targets to manufacture 150,000-160,000 units at Gujarat plant in FY2018, up from the earlier estimate of ~130,000 units. With supply constraints expected to ease out significantly, we expect Maruti to post strong double-digit volume growth at a ~12% CAGR over the next two years, which is substantially higher than the 8-10% growth expected for the passenger vehicle industry.
� Outlook: Maruti has successfully established itself in the big car category (Ciaz, Vitara Brezza, Dzire and Baleno), led by strong product features and success of its premium distribution network Nexa, which offers a unique buying experience. Maruti has established itself as a leader in all passenger vehicles categories, namely passenger cars, utility vehicles and vans. We expect Maruti to sustain its trend of outpacing the industry, given the robust order book for its existing models and strong new product launch pipeline. Maruti remains amongst our top picks in the automotive space.
� Valuations: Maruti has reported in-line results for Q1FY2018. Given the speeding up of production at the Gujarat plant, we have raised our FY2019 earnings assumptions by 3%. We maintain our Buy recommendation on the stock with a revised PT of Rs.8,500.
Stock UpdateStrong earnings visibility; Maintain Buy with a revised PT of Rs.8,500
Sharekhan Limited, its analyst or dependant(s) of the analyst might be holding or having a position in the companies mentioned in the article.
July 27, 2017 4
Company details
Price target: Rs965
Market cap: Rs123,831 cr
52-week high/low: Rs926/731
NSE volume: (No of shares) 14.8 lakh
BSE code: 532281
NSE code: HCLTECH
Sharekhan code: HCLTECH
Free float: (No of shares) 55.9 cr
Price chart
Shareholding pattern
Price performance
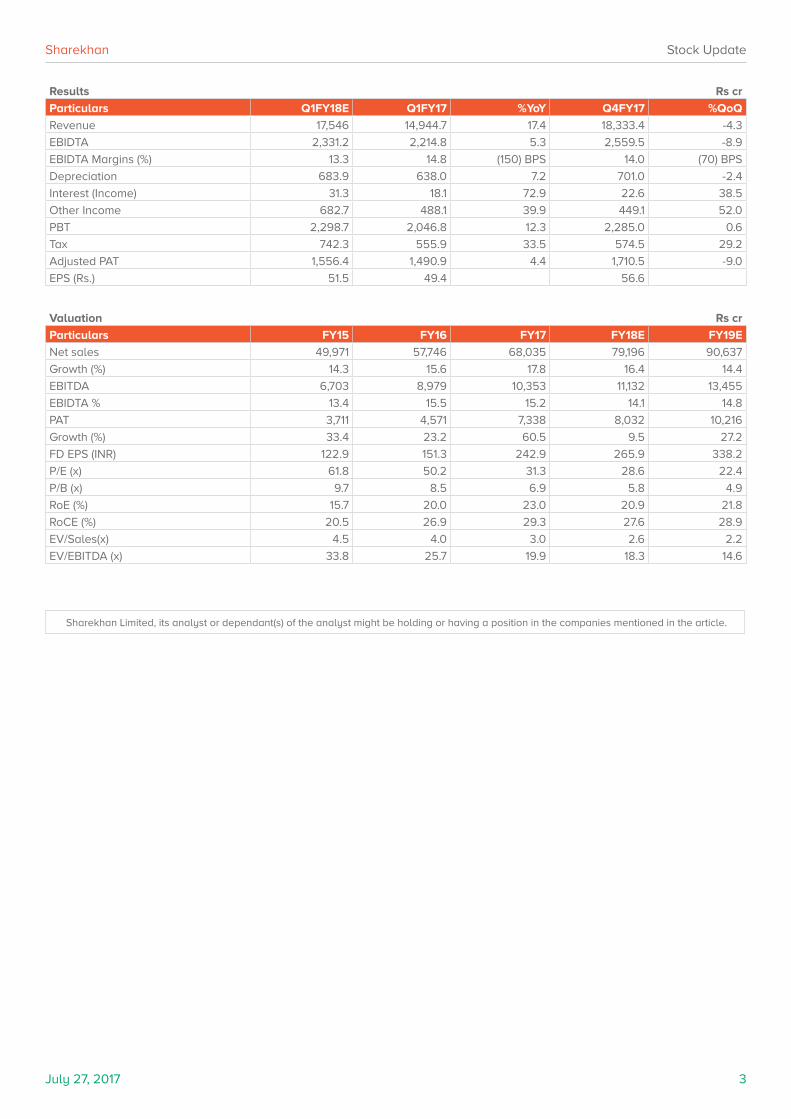
HCL Technologies
Reco: Buy | CMP: Rs890
Key points
� Strong operating performance: HCL Technologies (HCL Tech) reported yet another good quarter, with constant currency (CC) revenue growth of 2.6% QoQ. This was driven by a CC growth of 7.9% QoQ in Engineering and R&D Services (ERD) services (includes inorganic revenue from Geometric consolidation). On a reported basis, Q1FY2018 revenue grew by 3.7% QoQ to $1,884.2 million, broadly in-line with our estimates. EBIT margin improved by ~10BPS QoQ to 20.1%, above our expectation, led by operational efficiencies (improved utilisation), partially offset by rupee appreciation (40BPS impact, up 3.2% QoQ against USD and Geometric full quarter consolidation). The improvement in margin is also driven by the automation initiatives through its DRYiCE platform in the application and IMS services. Higher-than-expected forex gains (123% QoQ) offset by absence reversal of tax reversal benefit in Q4FY2017 ($45.5 million, up ~850BPS QoQ) resulted in 6.6% QoQ decline in net profit to Rs2,171 crore in Q1FY18. During the quarter, the company signed 13 transformational deals (vs eight deals in Q4FY2017) primarily in the USA and Europe.
� Short-term hiccups in IMS, but Mode 2 & 3 to drive growth trajectory: HCL Tech’s management remains hopeful for delivering revenue for FY2018 in the targeted guidance range. The confidence stems from the overall demand environment for Mode 2 (Digital, Next Gen & Cloud) and Mode 3 (Product & Platform) services, despite reducing deal sizes in Mode 1 services (traditional services) and intense pricing pressure in renewals of contracts due to change in the business model. The management indicated that it foresees the slowdown in IMS services (38.6% of total revenues) to continue for the near-term owing to ongoing delays in decision-making process. However, it expects higher acceleration of revenues due to a healthy order book and strong pipeline in the Mode 2 and Mode 3 services and . Further, the company has extended the Intellectual Property (IP) agreement with IBM by investing ~$140 million during the quarter to cover the products in the area of marketing and mainframe area, which complements the company’s digital and analytics practice. Till date, the company has made total investment of $780 million in IBM IP partnership till date.
� Scaling-up capabilities ; maintain Buy with a price target of Rs965: We have tweaked our revenue estimates for FY2018/FY2019 on account of currency reset to Rs 64.5 and management’s commentary on slowdown on demand of IMS services (38.6% of total revenues). We believe, HCL Tech is investing in the right areas of digital technologies and products & Platforms for a
more future sustainable growth. However, street is bit concerned on big investments in IBM deal ($780 mn) and its successful execution in terms of earnings. Given the reasonable valuation and best in class earning performance among the top tier IT companies, we have maintained our ‘Buy’ rating on the stock with a price target of Rs965.
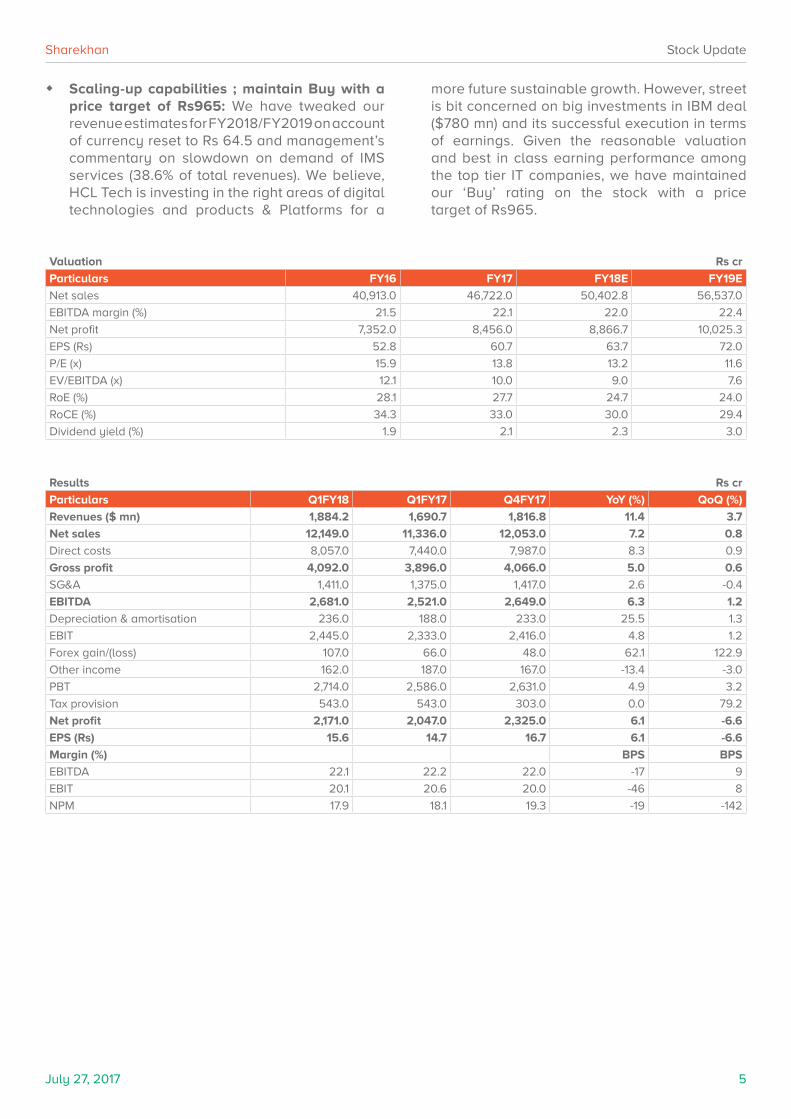
Valuation Rs cr
Particulars FY16 FY17 FY18E FY19E
Net sales 40,913.0 46,722.0 50,402.8 56,537.0
EBITDA margin (%) 21.5 22.1 22.0 22.4
Net profit 7,352.0 8,456.0 8,866.7 10,025.3
EPS (Rs) 52.8 60.7 63.7 72.0
P/E (x) 15.9 13.8 13.2 11.6
EV/EBITDA (x) 12.1 10.0 9.0 7.6
RoE (%) 28.1 27.7 24.7 24.0
RoCE (%) 34.3 33.0 30.0 29.4
Dividend yield (%) 1.9 2.1 2.3 3.0
July 27, 2017 6
Sharekhan Stock Update
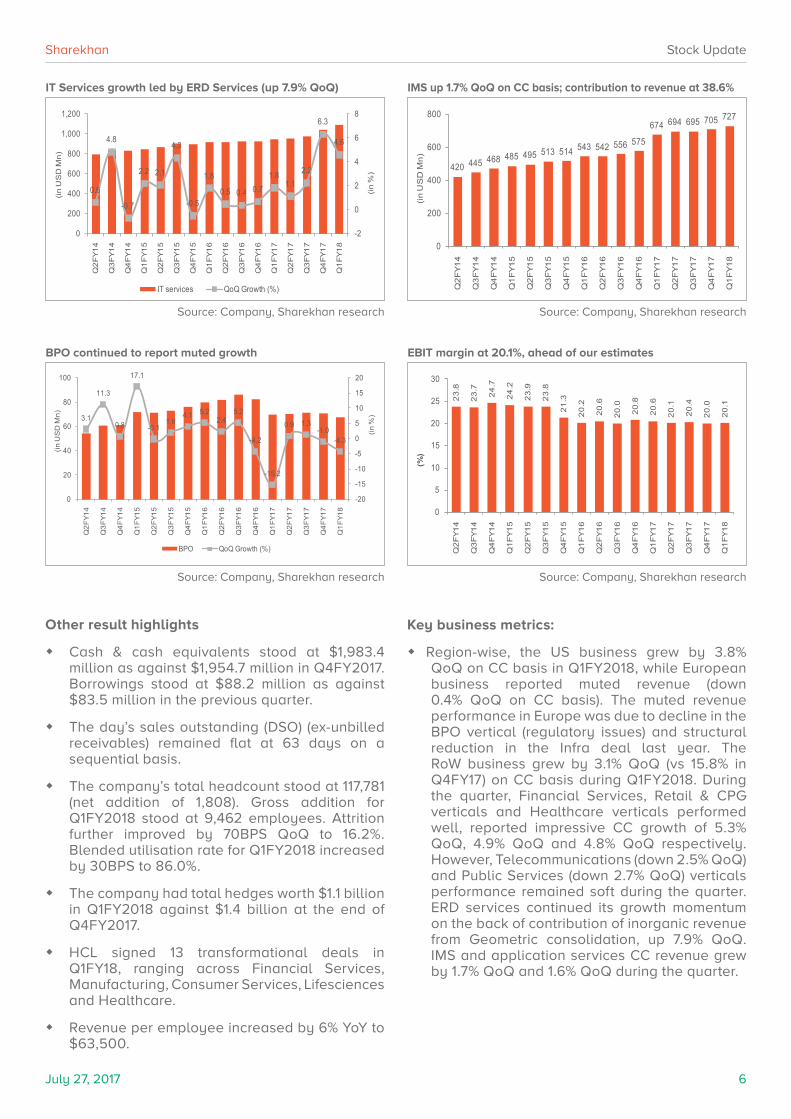
IT Services growth led by ERD Services (up 7.9% QoQ)
Source: Company, Sharekhan research
IMS up 1.7% QoQ on CC basis; contribution to revenue at 38.6%
Source: Company, Sharekhan research
BPO continued to report muted growth
Source: Company, Sharekhan research
EBIT margin at 20.1%, ahead of our estimates
Source: Company, Sharekhan research
0.6
4.8
-0.7
2.2 2.1
4.3
-0.5
1.8
0.5 0.4 0.71.8
1.12.2
6.3
4.6
-2
0
2
4
6
8
0
200
400
600
800
1,000
1,200
Q2
FY
14
Q3
FY
14
Q4
FY
14
Q1
FY
15
Q2
FY
15
Q3
FY
15
Q4
FY
15
Q1
FY
16
Q2
FY
16
Q3
FY
16
Q4
FY
16
Q1
FY
17
Q2
FY
17
Q3
FY
17
Q4
FY
17
Q1
FY
18
(in
%)
(in
US
D M
n)
IT services QoQ Growth (%)
420 445 468 485 495 513 514 543 542 556 575
674 694 695 705 727
0
200
400
600
800
Q2
FY
14
Q3
FY
14
Q4
FY
14
Q1
FY
15
Q2
FY
15
Q3
FY
15
Q4
FY
15
Q1
FY
16
Q2
FY
16
Q3
FY
16
Q4
FY
16
Q1
FY
17
Q2
FY
17
Q3
FY
17
Q4
FY
17
Q1
FY
18
(in
US
D M
n)
3.1
11.3
0.8
17.1
-0.11.9
4.1 5.22.4
5.2
-4.2
-15.2
0.9 1.3-1.0
-4.3
-20
-15
-10
-5
0
5
10
15
20
0
20
40
60
80
100
Q2F
Y14
Q3F
Y14
Q4F
Y14
Q1F
Y15
Q2F
Y15
Q3F
Y15
Q4F
Y15
Q1F
Y16
Q2F
Y16
Q3F
Y16
Q4F
Y16
Q1F
Y17
Q2F
Y17
Q3F
Y17
Q4F
Y17
Q1F
Y18
(in %
)
(in U
SD
Mn)
BPO QoQ Growth (%)
23
.8
23
.7
24
.7
24
.2
23
.9
23
.8
21
.3
20
.2
20
.6
20
.0
20
.8
20
.6
20
.1
20
.4
20
.0
20
.1
0
5
10
15
20
25
30
Q2
FY
14
Q3
FY
14
Q4
FY
14
Q1
FY
15
Q2
FY
15
Q3
FY
15
Q4
FY
15
Q1
FY
16
Q2
FY
16
Q3
FY
16
Q4
FY
16
Q1
FY
17
Q2
FY
17
Q3
FY
17
Q4
FY
17
Q1
FY
18
(%)
Other result highlights
� Cash & cash equivalents stood at $1,983.4 million as against $1,954.7 million in Q4FY2017. Borrowings stood at $88.2 million as against $83.5 million in the previous quarter.
� The day’s sales outstanding (DSO) (ex-unbilled receivables) remained flat at 63 days on a sequential basis.
� The company’s total headcount stood at 117,781 (net addition of 1,808). Gross addition for Q1FY2018 stood at 9,462 employees. Attrition further improved by 70BPS QoQ to 16.2%. Blended utilisation rate for Q1FY2018 increased by 30BPS to 86.0%.
� The company had total hedges worth $1.1 billion in Q1FY2018 against $1.4 billion at the end of Q4FY2017.
� HCL signed 13 transformational deals in Q1FY18, ranging across Financial Services, Manufacturing, Consumer Services, Lifesciences and Healthcare.
� Revenue per employee increased by 6% YoY to $63,500.
Key business metrics:
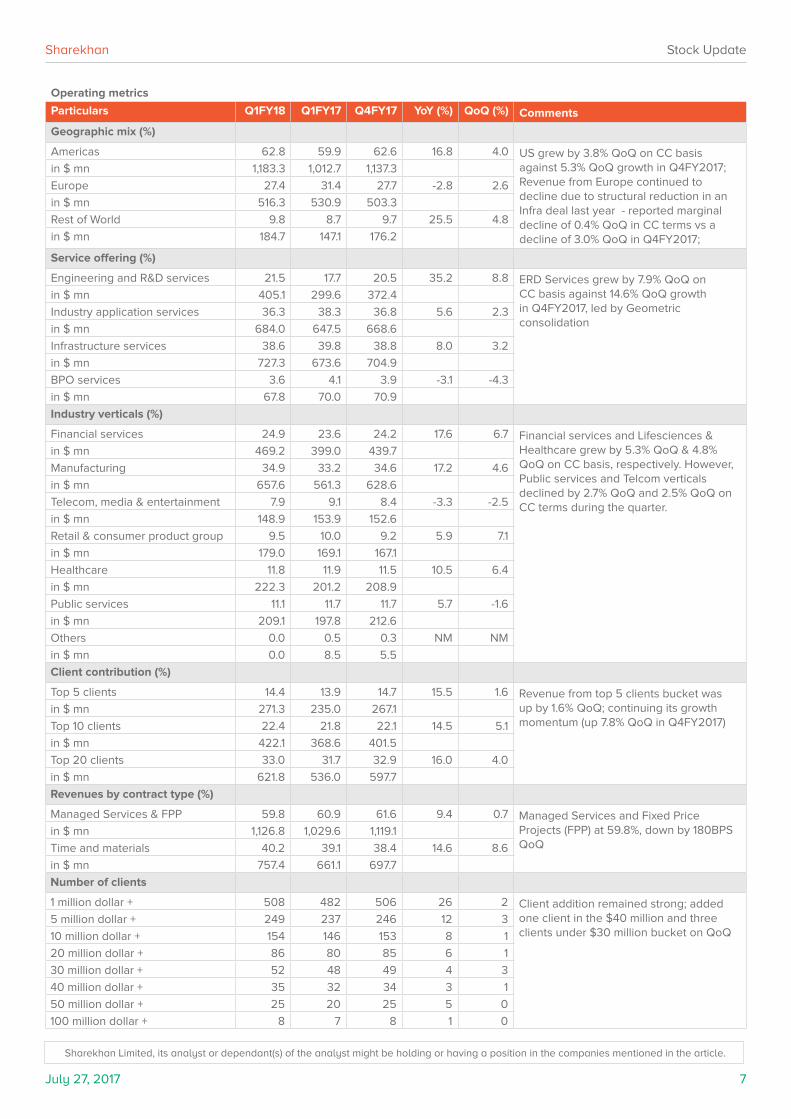
� Region-wise, the US business grew by 3.8% QoQ on CC basis in Q1FY2018, while European business reported muted revenue (down 0.4% QoQ on CC basis). The muted revenue performance in Europe was due to decline in the BPO vertical (regulatory issues) and structural reduction in the Infra deal last year. The RoW business grew by 3.1% QoQ (vs 15.8% in Q4FY17) on CC basis during Q1FY2018. During the quarter, Financial Services, Retail & CPG verticals and Healthcare verticals performed well, reported impressive CC growth of 5.3% QoQ, 4.9% QoQ and 4.8% QoQ respectively. However, Telecommunications (down 2.5% QoQ) and Public Services (down 2.7% QoQ) verticals performance remained soft during the quarter. ERD services continued its growth momentum on the back of contribution of inorganic revenue from Geometric consolidation, up 7.9% QoQ. IMS and application services CC revenue grew by 1.7% QoQ and 1.6% QoQ during the quarter.
Americas 62.8 59.9 62.6 16.8 4.0 US grew by 3.8% QoQ on CC basis against 5.3% QoQ growth in Q4FY2017; Revenue from Europe continued to decline due to structural reduction in an Infra deal last year - reported marginal decline of 0.4% QoQ in CC terms vs a decline of 3.0% QoQ in Q4FY2017;
in $ mn 1,183.3 1,012.7 1,137.3
Europe 27.4 31.4 27.7 -2.8 2.6
in $ mn 516.3 530.9 503.3
Rest of World 9.8 8.7 9.7 25.5 4.8
in $ mn 184.7 147.1 176.2
Service offering (%)
Engineering and R&D services 21.5 17.7 20.5 35.2 8.8 ERD Services grew by 7.9% QoQ on CC basis against 14.6% QoQ growth in Q4FY2017, led by Geometric consolidation
in $ mn 405.1 299.6 372.4
Industry application services 36.3 38.3 36.8 5.6 2.3
in $ mn 684.0 647.5 668.6
Infrastructure services 38.6 39.8 38.8 8.0 3.2
in $ mn 727.3 673.6 704.9
BPO services 3.6 4.1 3.9 -3.1 -4.3
in $ mn 67.8 70.0 70.9
Industry verticals (%)
Financial services 24.9 23.6 24.2 17.6 6.7 Financial services and Lifesciences & Healthcare grew by 5.3% QoQ & 4.8% QoQ on CC basis, respectively. However, Public services and Telcom verticals declined by 2.7% QoQ and 2.5% QoQ on CC terms during the quarter.
in $ mn 469.2 399.0 439.7
Manufacturing 34.9 33.2 34.6 17.2 4.6
in $ mn 657.6 561.3 628.6
Telecom, media & entertainment 7.9 9.1 8.4 -3.3 -2.5
in $ mn 148.9 153.9 152.6
Retail & consumer product group 9.5 10.0 9.2 5.9 7.1
in $ mn 179.0 169.1 167.1
Healthcare 11.8 11.9 11.5 10.5 6.4
in $ mn 222.3 201.2 208.9
Public services 11.1 11.7 11.7 5.7 -1.6
in $ mn 209.1 197.8 212.6
Others 0.0 0.5 0.3 NM NM
in $ mn 0.0 8.5 5.5
Client contribution (%)
Top 5 clients 14.4 13.9 14.7 15.5 1.6 Revenue from top 5 clients bucket was up by 1.6% QoQ; continuing its growth momentum (up 7.8% QoQ in Q4FY2017)
in $ mn 271.3 235.0 267.1
Top 10 clients 22.4 21.8 22.1 14.5 5.1
in $ mn 422.1 368.6 401.5
Top 20 clients 33.0 31.7 32.9 16.0 4.0
in $ mn 621.8 536.0 597.7
Revenues by contract type (%)
Managed Services & FPP 59.8 60.9 61.6 9.4 0.7 Managed Services and Fixed Price Projects (FPP) at 59.8%, down by 180BPS QoQ
in $ mn 1,126.8 1,029.6 1,119.1
Time and materials 40.2 39.1 38.4 14.6 8.6
in $ mn 757.4 661.1 697.7
Number of clients
1 million dollar + 508 482 506 26 2 Client addition remained strong; added one client in the $40 million and three clients under $30 million bucket on QoQ
5 million dollar + 249 237 246 12 3
10 million dollar + 154 146 153 8 1
20 million dollar + 86 80 85 6 1
30 million dollar + 52 48 49 4 3
40 million dollar + 35 32 34 3 1
50 million dollar + 25 20 25 5 0
100 million dollar + 8 7 8 1 0
Sharekhan Limited, its analyst or dependant(s) of the analyst might be holding or having a position in the companies mentioned in the article.
July 27, 2017 8
Company details
Price target: Rs330
Market cap: Rs196,916 cr
52-week high/low: Rs314/215
NSE volume: (No of shares) 160.5 lakh
BSE code: 532174
NSE code: ICICIBANK
Sharekhan code: ICICIBANK
Free float: (No of shares) 641.28 cr
Price chart
Shareholding pattern
Price performance
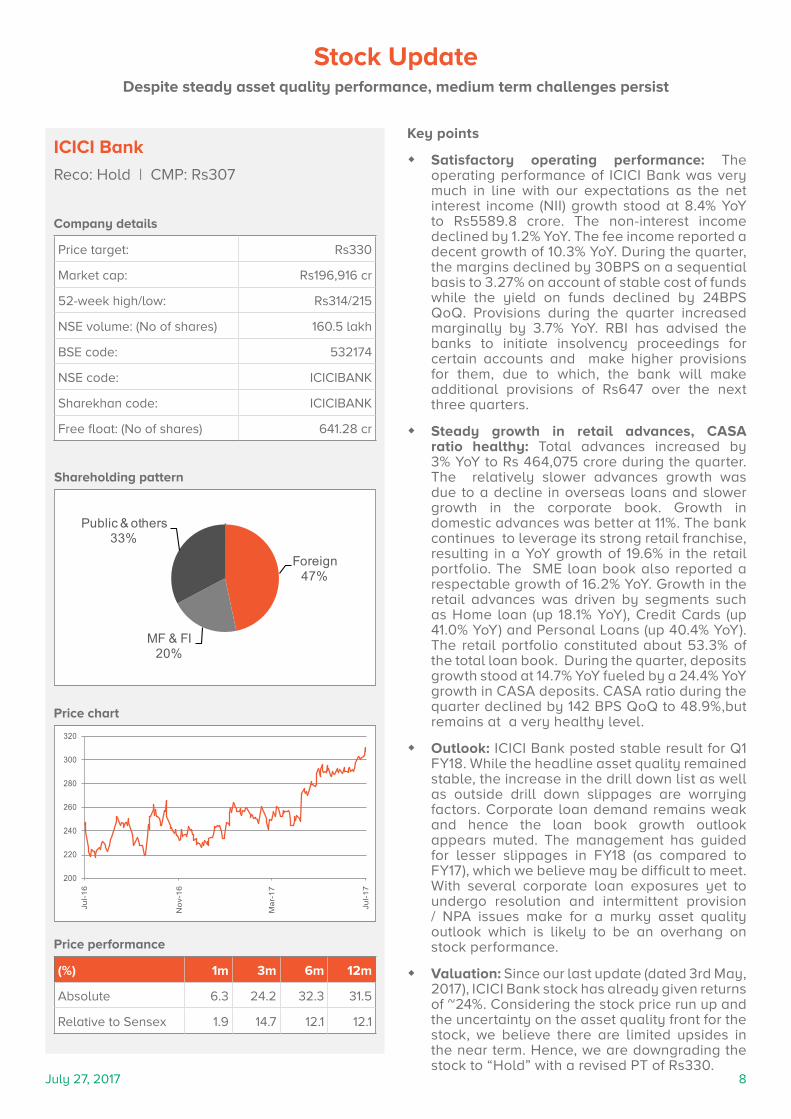
ICICI Bank
Reco: Hold | CMP: Rs307
Key points
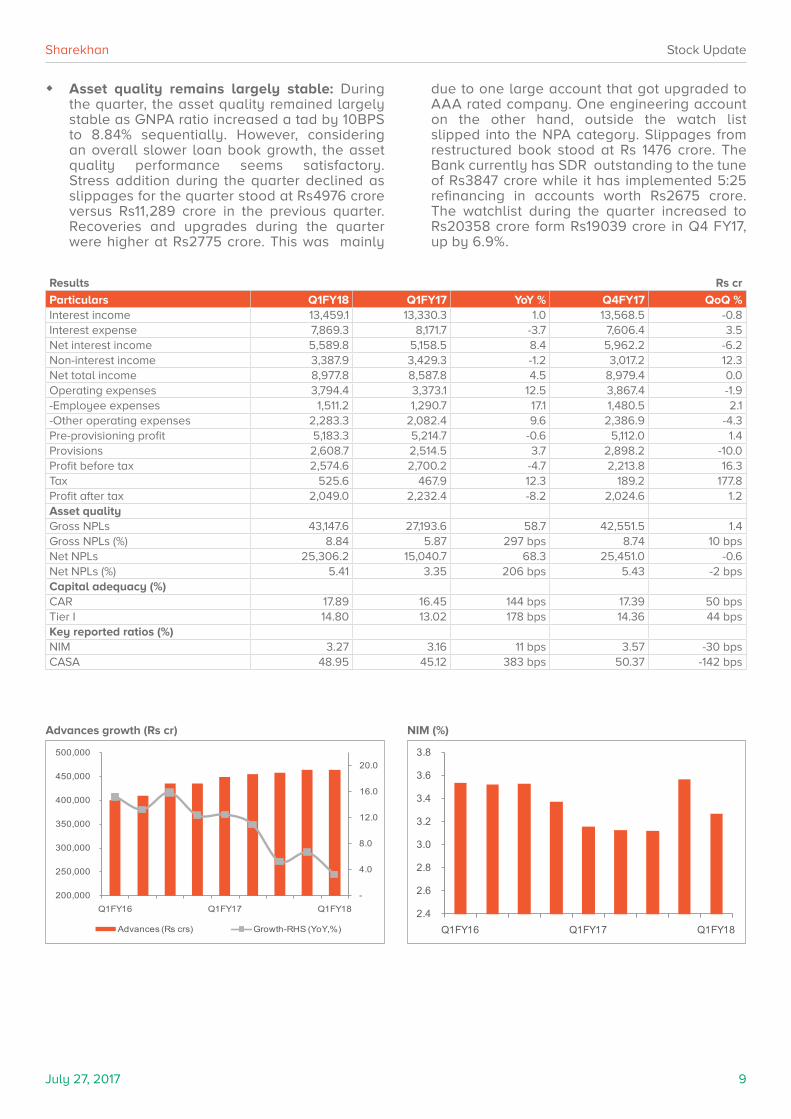
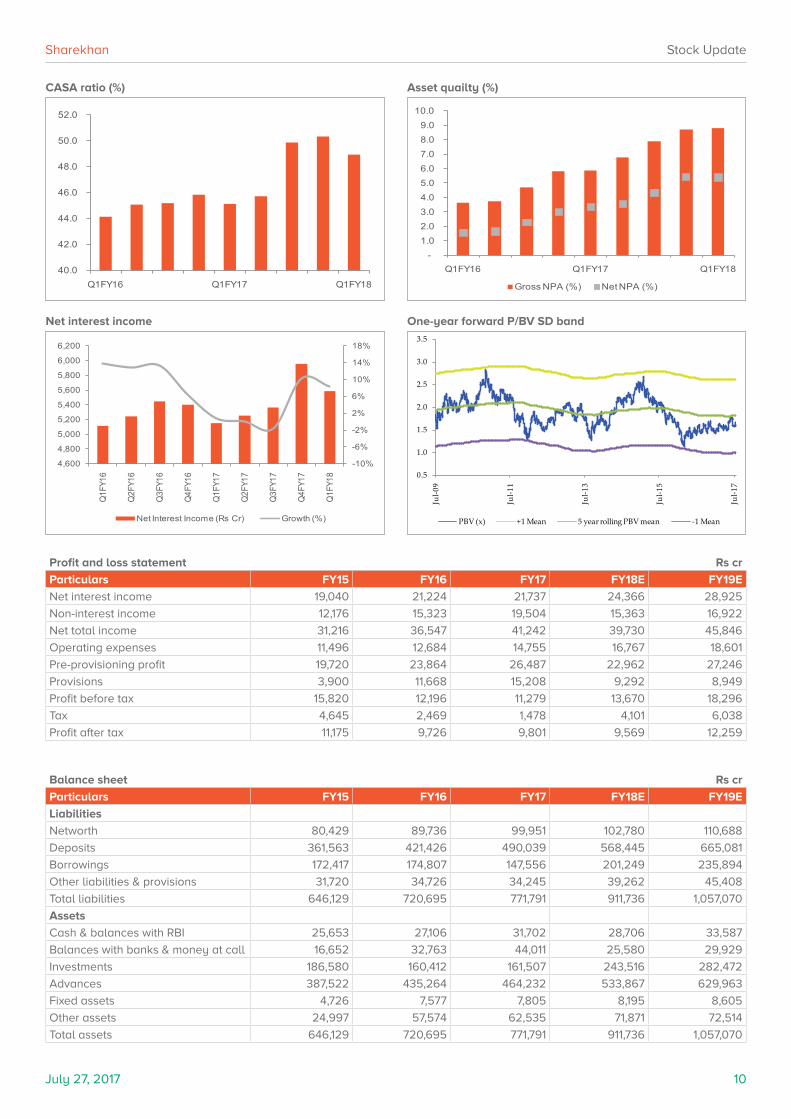
� Satisfactory operating performance: The operating performance of ICICI Bank was very much in line with our expectations as the net interest income (NII) growth stood at 8.4% YoY to Rs5589.8 crore. The non-interest income declined by 1.2% YoY. The fee income reported a decent growth of 10.3% YoY. During the quarter, the margins declined by 30BPS on a sequential basis to 3.27% on account of stable cost of funds while the yield on funds declined by 24BPS QoQ. Provisions during the quarter increased marginally by 3.7% YoY. RBI has advised the banks to initiate insolvency proceedings for certain accounts and make higher provisions for them, due to which, the bank will make additional provisions of Rs647 over the next three quarters.
� Steady growth in retail advances, CASA ratio healthy: Total advances increased by 3% YoY to Rs 464,075 crore during the quarter. The relatively slower advances growth was due to a decline in overseas loans and slower growth in the corporate book. Growth in domestic advances was better at 11%. The bank continues to leverage its strong retail franchise, resulting in a YoY growth of 19.6% in the retail portfolio. The SME loan book also reported a respectable growth of 16.2% YoY. Growth in the retail advances was driven by segments such as Home loan (up 18.1% YoY), Credit Cards (up 41.0% YoY) and Personal Loans (up 40.4% YoY). The retail portfolio constituted about 53.3% of the total loan book. During the quarter, deposits growth stood at 14.7% YoY fueled by a 24.4% YoY growth in CASA deposits. CASA ratio during the quarter declined by 142 BPS QoQ to 48.9%,but remains at a very healthy level.
� Outlook: ICICI Bank posted stable result for Q1 FY18. While the headline asset quality remained stable, the increase in the drill down list as well as outside drill down slippages are worrying factors. Corporate loan demand remains weak and hence the loan book growth outlook appears muted. The management has guided for lesser slippages in FY18 (as compared to FY17), which we believe may be difficult to meet. With several corporate loan exposures yet to undergo resolution and intermittent provision / NPA issues make for a murky asset quality outlook which is likely to be an overhang on stock performance.
� Valuation: Since our last update (dated 3rd May, 2017), ICICI Bank stock has already given returns of ~24%. Considering the stock price run up and the uncertainty on the asset quality front for the stock, we believe there are limited upsides in the near term. Hence, we are downgrading the stock to “Hold” with a revised PT of Rs330.
Stock UpdateDespite steady asset quality performance, medium term challenges persist
� Asset quality remains largely stable: During the quarter, the asset quality remained largely stable as GNPA ratio increased a tad by 10BPS to 8.84% sequentially. However, considering an overall slower loan book growth, the asset quality performance seems satisfactory. Stress addition during the quarter declined as slippages for the quarter stood at Rs4976 crore versus Rs11,289 crore in the previous quarter. Recoveries and upgrades during the quarter were higher at Rs2775 crore. This was mainly
due to one large account that got upgraded to AAA rated company. One engineering account on the other hand, outside the watch list slipped into the NPA category. Slippages from restructured book stood at Rs 1476 crore. The Bank currently has SDR outstanding to the tune of Rs3847 crore while it has implemented 5:25 refinancing in accounts worth Rs2675 crore. The watchlist during the quarter increased to Rs20358 crore form Rs19039 crore in Q4 FY17, up by 6.9%.
Advances growth (Rs cr) NIM (%)
-
4.0
8.0
12.0
16.0
20.0
200,000
250,000
300,000
350,000
400,000
450,000
500,000
Q1FY16 Q1FY17 Q1FY18
Advances (Rs crs) Growth-RHS (YoY,%)
2.4
2.6
2.8
3.0
3.2
3.4
3.6
3.8
Q1FY16 Q1FY17 Q1FY18
July 27, 2017 10
Sharekhan Stock Update
Profit and loss statement Rs cr
Particulars FY15 FY16 FY17 FY18E FY19E
Net interest income 19,040 21,224 21,737 24,366 28,925
Non-interest income 12,176 15,323 19,504 15,363 16,922
Net total income 31,216 36,547 41,242 39,730 45,846
Total assets 646,129 720,695 771,791 911,736 1,057,070
CASA ratio (%) Asset quailty (%)
Net interest income One-year forward P/BV SD band
40.0
42.0
44.0
46.0
48.0
50.0
52.0
Q1FY16 Q1FY17 Q1FY18
-1.0 2.0 3.0 4.0 5.0 6.0 7.0 8.0 9.0
10.0
Q1FY16 Q1FY17 Q1FY18
Gross NPA (%) Net NPA (%)
-10%
-6%
-2%
2%
6%
10%
14%
18%
4,600
4,800
5,000
5,200
5,400
5,600
5,800
6,000
6,200
Q1F
Y16
Q2F
Y16
Q3F
Y16
Q4F
Y16
Q1F
Y17
Q2F
Y17
Q3F
Y17
Q4F
Y17
Q1F
Y18
Net Interest Income (Rs Cr) Growth (%)
0.5
1.0
1.5
2.0
2.5
3.0
3.5
Jul-0
9
Jul-1
1
Jul-1
3
Jul-1
5
Jul-1
7
PBV (x) +1 Mean 5 year rolling PBV mean -1 Mean
July 27, 2017 11
Sharekhan Stock Update
Key ratios
Particulars FY15 FY16 FY17 FY18E FY19E
Per share Data (Rs)
Earnings 19.3 16.7 16.8 14.9 21.0
Dividend 5.0 5.0 0.0 4.2 5.9
Book value 130.1 146.4 164.6 153.9 183.0
Adj. book value 108.0 113.0 110.6 105.8 126.7
Spreads (%)
Yield on Advances 9.8 9.5 8.8 8.3 8.3
Cost of Deposits 5.9 5.5 5.0 4.7 4.6
Net interest margins 3.3 3.4 3.1 3.2 3.2
Operating ratios (%)
Credit to Deposit 107.2 103.3 94.7 93.9 94.7
Cost to income 36.8 34.7 35.8 42.2 40.6
CASA 45.5 45.8 50.4 50.4 49.9
Non interest income / Total income 39.0 41.9 47.3 38.7 36.9
Assets/Equity (x) 8.1 8.0 7.9 8.3 9.2
Return ratios (%)
RoE 14.5 11.4 10.3 9.4 11.5
RoA 1.8 1.4 1.3 1.1 1.2
Asset Quality ratios (%)
Gross NPA 3.8 5.8 8.8 7.4 6.4
Net NPA 1.6 3.0 5.4 4.6 4.2
Growth Ratios (%)
Net interest income 15.6 11.5 2.4 12.1 18.7
Pre-provisioning profit 18.8 21.0 11.0 -13.3 18.7
Profit after tax 13.9 -13.0 0.8 -2.4 28.1
Advances 14.4 12.3 6.7 15.0 18.0
Deposits 8.9 16.6 16.3 16.0 17.0
Valuation ratios (x)
P/E 15.9 18.4 18.3 20.6 14.6
P/BV 2.4 2.1 1.9 2.0 1.7
P/ABV 2.8 2.7 2.8 2.9 2.4
Sharekhan Limited, its analyst or dependant(s) of the analyst might be holding or having a position in the companies mentioned in the article.
July 27, 2017 12
Company details
Price target: Rs1,250
Market cap: Rs14,301 cr
52-week high/low: Rs1,250/780
NSE volume: (No of shares) 0.61 lakh
BSE code: 509930
NSE code: SUPREMEIND
Sharekhan code: SUPREMEIND
Free float: (No of shares) 6.4 cr
Price chart
Shareholding pattern
Price performance
Supreme Industries
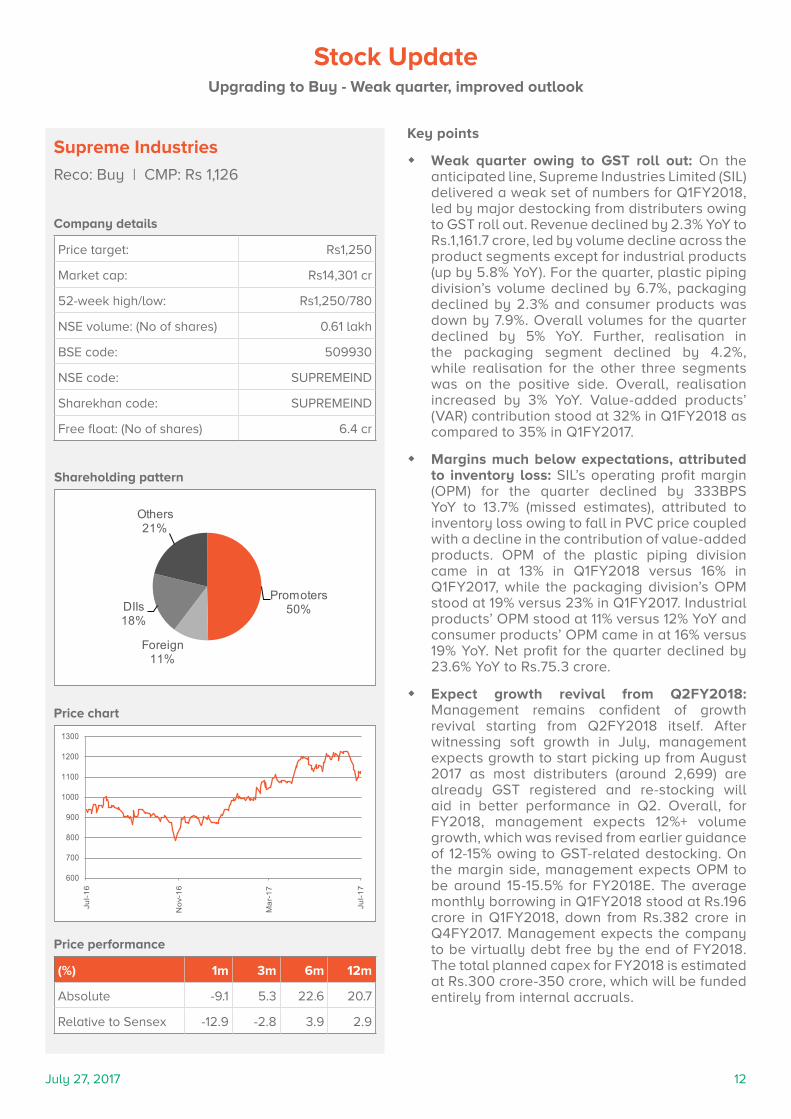
Reco: Buy | CMP: Rs 1,126
Key points
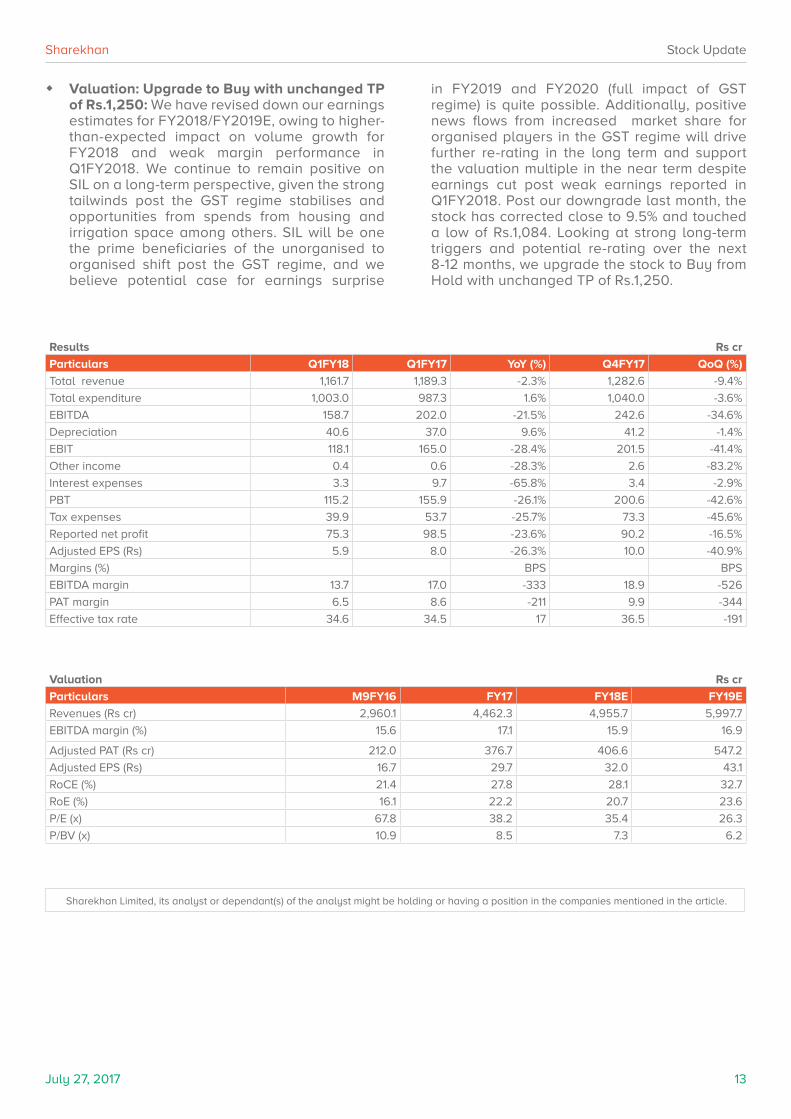
� Weak quarter owing to GST roll out: On the anticipated line, Supreme Industries Limited (SIL) delivered a weak set of numbers for Q1FY2018, led by major destocking from distributers owing to GST roll out. Revenue declined by 2.3% YoY to Rs.1,161.7 crore, led by volume decline across the product segments except for industrial products (up by 5.8% YoY). For the quarter, plastic piping division’s volume declined by 6.7%, packaging declined by 2.3% and consumer products was down by 7.9%. Overall volumes for the quarter declined by 5% YoY. Further, realisation in the packaging segment declined by 4.2%, while realisation for the other three segments was on the positive side. Overall, realisation increased by 3% YoY. Value-added products’ (VAR) contribution stood at 32% in Q1FY2018 as compared to 35% in Q1FY2017.
� Margins much below expectations, attributed to inventory loss: SIL’s operating profit margin (OPM) for the quarter declined by 333BPS YoY to 13.7% (missed estimates), attributed to inventory loss owing to fall in PVC price coupled with a decline in the contribution of value-added products. OPM of the plastic piping division came in at 13% in Q1FY2018 versus 16% in Q1FY2017, while the packaging division’s OPM stood at 19% versus 23% in Q1FY2017. Industrial products’ OPM stood at 11% versus 12% YoY and consumer products’ OPM came in at 16% versus 19% YoY. Net profit for the quarter declined by 23.6% YoY to Rs.75.3 crore.
� Expect growth revival from Q2FY2018: Management remains confident of growth revival starting from Q2FY2018 itself. After witnessing soft growth in July, management expects growth to start picking up from August 2017 as most distributers (around 2,699) are already GST registered and re-stocking will aid in better performance in Q2. Overall, for FY2018, management expects 12%+ volume growth, which was revised from earlier guidance of 12-15% owing to GST-related destocking. On the margin side, management expects OPM to be around 15-15.5% for FY2018E. The average monthly borrowing in Q1FY2018 stood at Rs.196 crore in Q1FY2018, down from Rs.382 crore in Q4FY2017. Management expects the company to be virtually debt free by the end of FY2018. The total planned capex for FY2018 is estimated at Rs.300 crore-350 crore, which will be funded entirely from internal accruals.
Stock UpdateUpgrading to Buy - Weak quarter, improved outlook
(%) 1m 3m 6m 12m
Absolute -9.1 5.3 22.6 20.7
Relative to Sensex -12.9 -2.8 3.9 2.9
Promoters50%
Foreign11%
DIIs18%
Others21%
600
700
800
900
1000
1100
1200
1300
Jul-1
6
Nov
-16
Mar
-17
Jul-1
7
July 27, 2017 13
Sharekhan Stock Update
Results Rs cr
Particulars Q1FY18 Q1FY17 YoY (%) Q4FY17 QoQ (%)
Total revenue 1,161.7 1,189.3 -2.3% 1,282.6 -9.4%
Total expenditure 1,003.0 987.3 1.6% 1,040.0 -3.6%
EBITDA 158.7 202.0 -21.5% 242.6 -34.6%
Depreciation 40.6 37.0 9.6% 41.2 -1.4%
EBIT 118.1 165.0 -28.4% 201.5 -41.4%
Other income 0.4 0.6 -28.3% 2.6 -83.2%
Interest expenses 3.3 9.7 -65.8% 3.4 -2.9%
PBT 115.2 155.9 -26.1% 200.6 -42.6%
Tax expenses 39.9 53.7 -25.7% 73.3 -45.6%
Reported net profit 75.3 98.5 -23.6% 90.2 -16.5%
Adjusted EPS (Rs) 5.9 8.0 -26.3% 10.0 -40.9%
Margins (%) BPS BPS
EBITDA margin 13.7 17.0 -333 18.9 -526
PAT margin 6.5 8.6 -211 9.9 -344
Effective tax rate 34.6 34.5 17 36.5 -191
� Valuation: Upgrade to Buy with unchanged TP of Rs.1,250: We have revised down our earnings estimates for FY2018/FY2019E, owing to higher-than-expected impact on volume growth for FY2018 and weak margin performance in Q1FY2018. We continue to remain positive on SIL on a long-term perspective, given the strong tailwinds post the GST regime stabilises and opportunities from spends from housing and irrigation space among others. SIL will be one the prime beneficiaries of the unorganised to organised shift post the GST regime, and we believe potential case for earnings surprise
in FY2019 and FY2020 (full impact of GST regime) is quite possible. Additionally, positive news flows from increased market share for organised players in the GST regime will drive further re-rating in the long term and support the valuation multiple in the near term despite earnings cut post weak earnings reported in Q1FY2018. Post our downgrade last month, the stock has corrected close to 9.5% and touched a low of Rs.1,084. Looking at strong long-term triggers and potential re-rating over the next 8-12 months, we upgrade the stock to Buy from Hold with unchanged TP of Rs.1,250.
Valuation Rs cr
Particulars M9FY16 FY17 FY18E FY19E
Revenues (Rs cr) 2,960.1 4,462.3 4,955.7 5,997.7
EBITDA margin (%) 15.6 17.1 15.9 16.9
Adjusted PAT (Rs cr) 212.0 376.7 406.6 547.2
Adjusted EPS (Rs) 16.7 29.7 32.0 43.1
RoCE (%) 21.4 27.8 28.1 32.7
RoE (%) 16.1 22.2 20.7 23.6
P/E (x) 67.8 38.2 35.4 26.3
P/BV (x) 10.9 8.5 7.3 6.2
Sharekhan Limited, its analyst or dependant(s) of the analyst might be holding or having a position in the companies mentioned in the article.
July 27, 2017 14
Company details
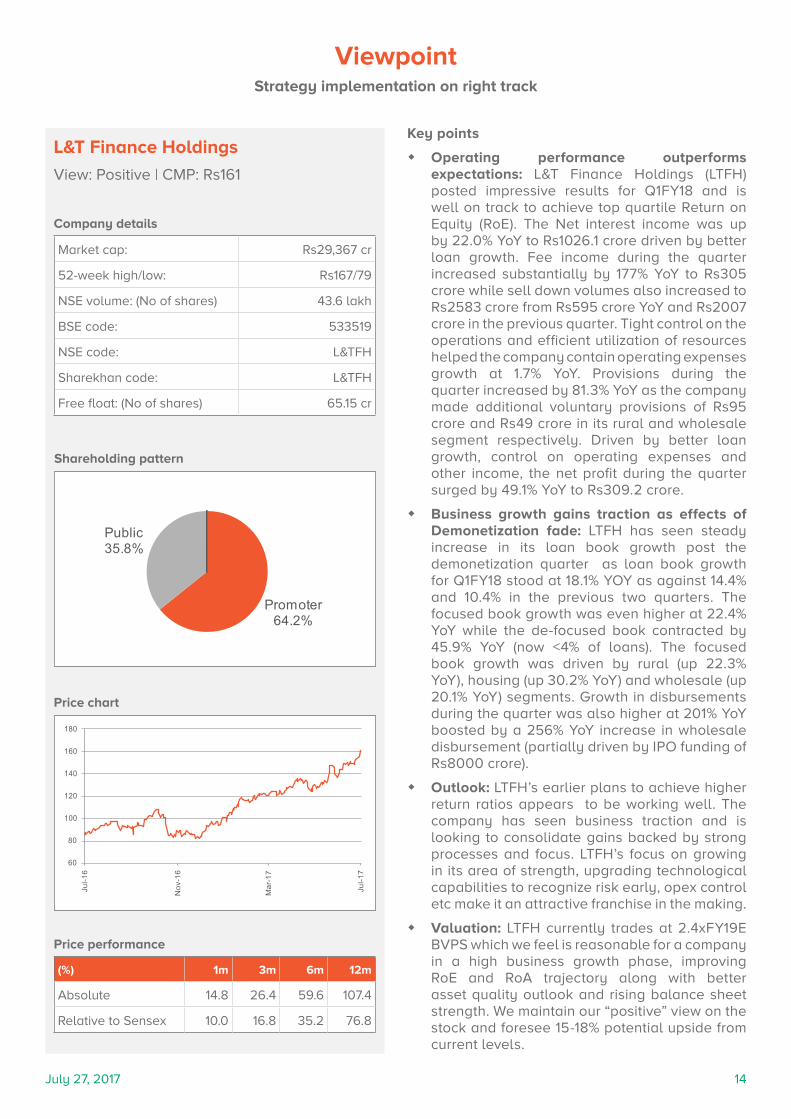
Market cap: Rs29,367 cr
52-week high/low: Rs167/79
NSE volume: (No of shares) 43.6 lakh
BSE code: 533519
NSE code: L&TFH
Sharekhan code: L&TFH
Free float: (No of shares) 65.15 cr
Price chart
Shareholding pattern
(%) 1m 3m 6m 12m
Absolute 14.8 26.4 59.6 107.4
Relative to Sensex 10.0 16.8 35.2 76.8
Price performance
Key points
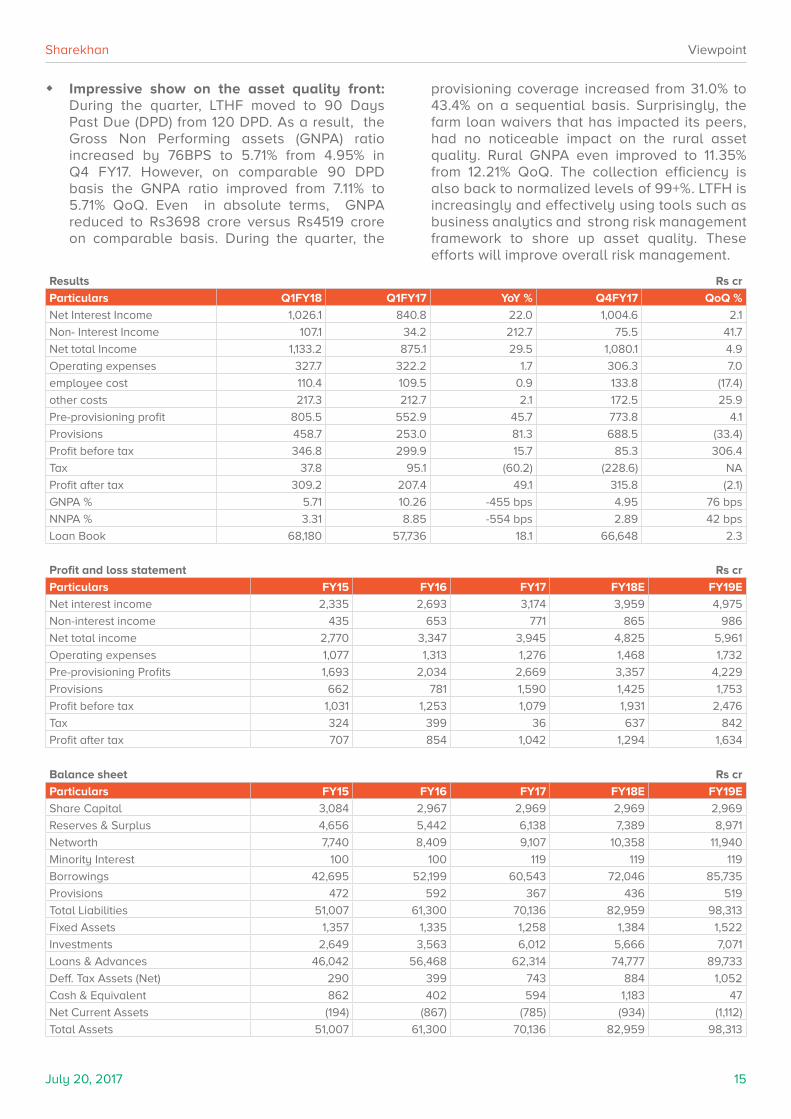
� Operating performance outperforms expectations: L&T Finance Holdings (LTFH) posted impressive results for Q1FY18 and is well on track to achieve top quartile Return on Equity (RoE). The Net interest income was up by 22.0% YoY to Rs1026.1 crore driven by better loan growth. Fee income during the quarter increased substantially by 177% YoY to Rs305 crore while sell down volumes also increased to Rs2583 crore from Rs595 crore YoY and Rs2007 crore in the previous quarter. Tight control on the operations and efficient utilization of resources helped the company contain operating expenses growth at 1.7% YoY. Provisions during the quarter increased by 81.3% YoY as the company made additional voluntary provisions of Rs95 crore and Rs49 crore in its rural and wholesale segment respectively. Driven by better loan growth, control on operating expenses and other income, the net profit during the quarter surged by 49.1% YoY to Rs309.2 crore.
� Business growth gains traction as effects of Demonetization fade: LTFH has seen steady increase in its loan book growth post the demonetization quarter as loan book growth for Q1FY18 stood at 18.1% YOY as against 14.4% and 10.4% in the previous two quarters. The focused book growth was even higher at 22.4% YoY while the de-focused book contracted by 45.9% YoY (now <4% of loans). The focused book growth was driven by rural (up 22.3% YoY), housing (up 30.2% YoY) and wholesale (up 20.1% YoY) segments. Growth in disbursements during the quarter was also higher at 201% YoY boosted by a 256% YoY increase in wholesale disbursement (partially driven by IPO funding of Rs8000 crore).
� Outlook: LTFH’s earlier plans to achieve higher return ratios appears to be working well. The company has seen business traction and is looking to consolidate gains backed by strong processes and focus. LTFH’s focus on growing in its area of strength, upgrading technological capabilities to recognize risk early, opex control etc make it an attractive franchise in the making.
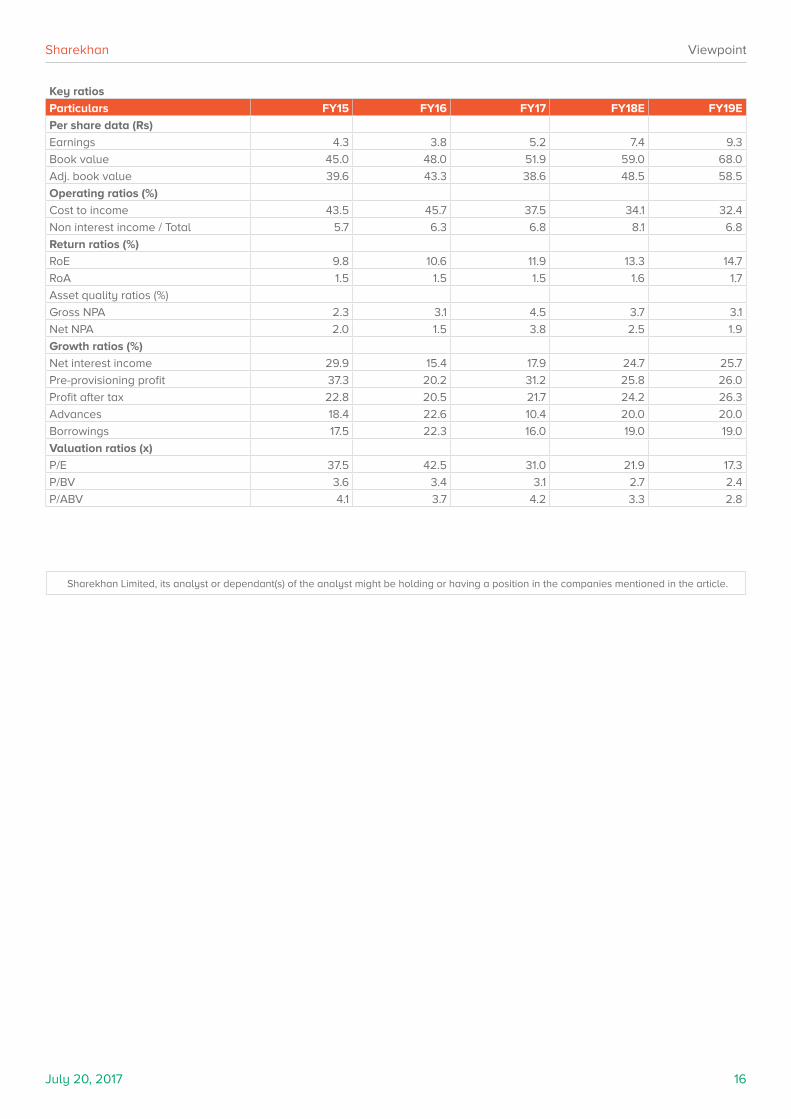
� Valuation: LTFH currently trades at 2.4xFY19E BVPS which we feel is reasonable for a company in a high business growth phase, improving RoE and RoA trajectory along with better asset quality outlook and rising balance sheet strength. We maintain our “positive” view on the stock and foresee 15-18% potential upside from current levels.
ViewpointStrategy implementation on right track
L&T Finance Holdings
View: Positive | CMP: Rs161
Promoter64.2%
Public35.8%
60
80
100
120
140
160
180
Jul-1
6
Nov
-16
Mar
-17
Jul-1
7
July 20, 2017 15
Sharekhan Viewpoint
Results Rs cr
Particulars Q1FY18 Q1FY17 YoY % Q4FY17 QoQ %
Net Interest Income 1,026.1 840.8 22.0 1,004.6 2.1
� Impressive show on the asset quality front: During the quarter, LTHF moved to 90 Days Past Due (DPD) from 120 DPD. As a result, the Gross Non Performing assets (GNPA) ratio increased by 76BPS to 5.71% from 4.95% in Q4 FY17. However, on comparable 90 DPD basis the GNPA ratio improved from 7.11% to 5.71% QoQ. Even in absolute terms, GNPA reduced to Rs3698 crore versus Rs4519 crore on comparable basis. During the quarter, the
provisioning coverage increased from 31.0% to 43.4% on a sequential basis. Surprisingly, the farm loan waivers that has impacted its peers, had no noticeable impact on the rural asset quality. Rural GNPA even improved to 11.35% from 12.21% QoQ. The collection efficiency is also back to normalized levels of 99+%. LTFH is increasingly and effectively using tools such as business analytics and strong risk management framework to shore up asset quality. These efforts will improve overall risk management.
Net Current Assets (194) (867) (785) (934) (1,112)
Total Assets 51,007 61,300 70,136 82,959 98,313
July 20, 2017 16
Sharekhan Viewpoint
Key ratios
Particulars FY15 FY16 FY17 FY18E FY19E
Per share data (Rs)
Earnings 4.3 3.8 5.2 7.4 9.3
Book value 45.0 48.0 51.9 59.0 68.0
Adj. book value 39.6 43.3 38.6 48.5 58.5
Operating ratios (%)
Cost to income 43.5 45.7 37.5 34.1 32.4
Non interest income / Total 5.7 6.3 6.8 8.1 6.8
Return ratios (%)
RoE 9.8 10.6 11.9 13.3 14.7
RoA 1.5 1.5 1.5 1.6 1.7
Asset quality ratios (%)
Gross NPA 2.3 3.1 4.5 3.7 3.1
Net NPA 2.0 1.5 3.8 2.5 1.9
Growth ratios (%)
Net interest income 29.9 15.4 17.9 24.7 25.7
Pre-provisioning profit 37.3 20.2 31.2 25.8 26.0
Profit after tax 22.8 20.5 21.7 24.2 26.3
Advances 18.4 22.6 10.4 20.0 20.0
Borrowings 17.5 22.3 16.0 19.0 19.0
Valuation ratios (x)
P/E 37.5 42.5 31.0 21.9 17.3
P/BV 3.6 3.4 3.1 2.7 2.4
P/ABV 4.1 3.7 4.2 3.3 2.8
Sharekhan Limited, its analyst or dependant(s) of the analyst might be holding or having a position in the companies mentioned in the article.
July 27, 2017 17
Company details
Market cap: Rs13,093 cr
52-week high/low: Rs188/127
NSE volume: (No of shares) 5.8 lakh
BSE code: 535755
NSE code: ABFRL
Sharekhan code: ABFRL
Free float: (No of shares) 31.4 cr
Price chart
Shareholding pattern
(%) 1m 3m 6m 12m
Absolute 1.9 4.4 18.9 19.2
Relative to Sensex -2.4 -3.6 0.7 1.6
Price performance
Key points
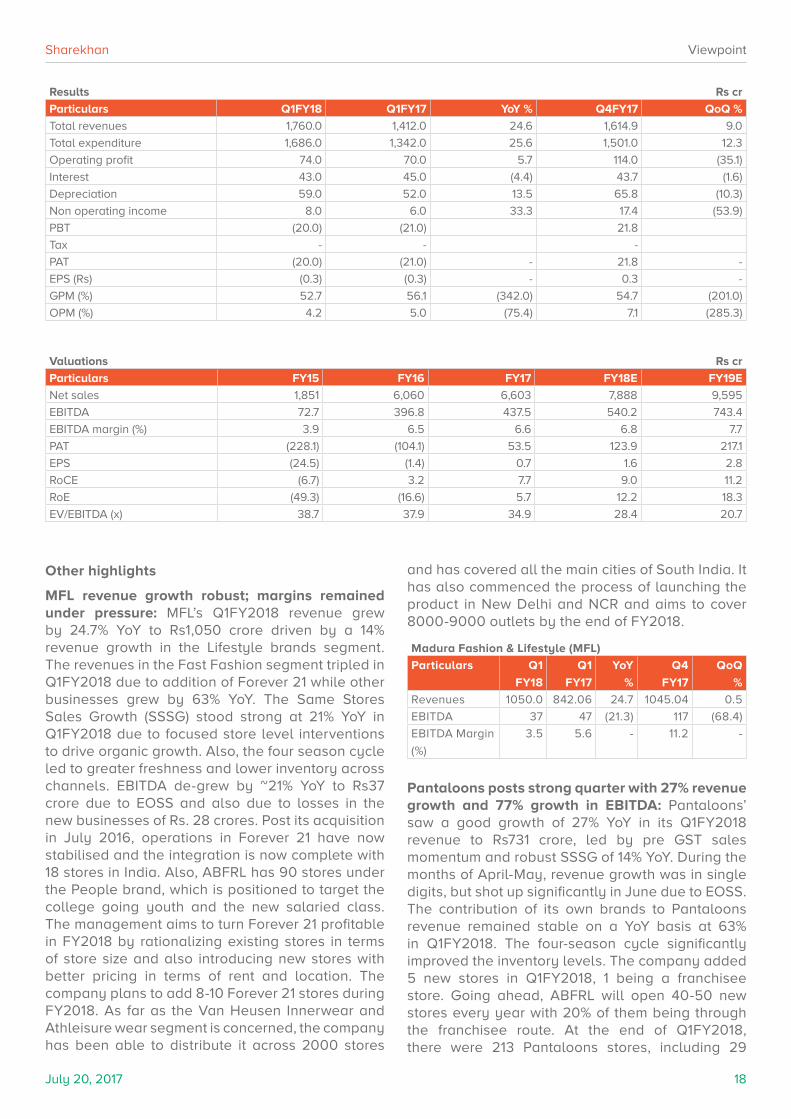
� Strong double digit growth in revenue, margins under pressure due to early EOSS: Aditya Birla Fashion & Retail’s (ABFRL) revenue for Q1FY2018 grew strongly by 24.6% YoY to Rs1,760 crore, ahead of our expectation of Rs1,600.6 crore. The revenue growth was led by a strong ~25% YoY expansion in Madura Fashion & Lifestyle (MFL) and 27% YoY growth in Pantaloons. Wedding season during April-May and an early End of Season Sale (EOSS) spurred the growth momentum. The company reported decline of ~340BPS YoY in gross margins at 52.7%, due to the increase in input prices (cotton prices up by ~15% YoY in Q1FY2018) and sustained losses in the new businesses. Lower realization from sales because of the discounts offered during EOSS had a negative impact on margins. However, the operational efficiencies of the company arrested the significant fall in Operating Profit Margin (OPM) by ~75BPS YoY at 4.2% while the operating profit grew by ~6% YoY to Rs74 crore. The other income was higher by 33% YoY but higher depreciation resulted loss at bottom line to Rs. 20 crore as against loss of Rs. 21 crore in Q1FY2017.
� Double digit revenue growth to sustain; margins likely to remain muted in near term: Q1FY2018 performance was positively impacted by EOSS/wedding season resulting in strong double-digit revenue growth in MFL and Pantaloons. Going ahead we expect the double-digit revenue growth momentum to sustain over the forthcoming quarters. Higher sales (led by festive/wedding season) and enhanced brand presence in the domestic market will augment growth. However, revenue growth in Q2FY2018 will be lower than that the first quarter as the benefits of EOSS won’t spill on to Q2FY2018. Further, the sustenance of losses in the Forever 21(though expected to break even by end of FY2018) and Van Heusen inner wear/athleisure segment along with transition effect of GST implementation will keep margins under pressure in the near term. Hence, we expect margins expansion to be better in FY2019. In view of near term pressure on the margins, we downgrade our FY2018 and FY2019 earnings estimates by 6.5% and 5% respectively.
� Valuation – retain positive view with 12-13% upside: ABFRL has a strong portfolio of brands in the space of branded apparels. With the scaling up of Forever 21 and inner wear business, we expect strong revenue growth momentum to sustain and a gradual improvement in the margins over the medium term. We maintain our positive view on the stock with an upside of 12-13%. The upside is lower than our earlier expectation of 15-18% mainly due to the lowering of margin expectation.
ViewpointDouble-digit revenue growth though early EOSS dents margins in Q1FY2018
Aditya Birla Fashion & Retail
View: Positive | CMP: Rs170
Foreign12%
Institutions15%
Non-promoter corporate
3%Promoters
59%
Public and others11%
100
110
120
130
140
150
160
170
180
190
Jul-1
6
Nov
-16
Mar
-17
Jul-1
7
July 20, 2017 18
Sharekhan Viewpoint
Valuations Rs cr
Particulars FY15 FY16 FY17 FY18E FY19E
Net sales 1,851 6,060 6,603 7,888 9,595
EBITDA 72.7 396.8 437.5 540.2 743.4
EBITDA margin (%) 3.9 6.5 6.6 6.8 7.7
PAT (228.1) (104.1) 53.5 123.9 217.1
EPS (24.5) (1.4) 0.7 1.6 2.8
RoCE (6.7) 3.2 7.7 9.0 11.2
RoE (49.3) (16.6) 5.7 12.2 18.3
EV/EBITDA (x) 38.7 37.9 34.9 28.4 20.7
Results Rs cr
Particulars Q1FY18 Q1FY17 YoY % Q4FY17 QoQ %
Total revenues 1,760.0 1,412.0 24.6 1,614.9 9.0
Total expenditure 1,686.0 1,342.0 25.6 1,501.0 12.3
Operating profit 74.0 70.0 5.7 114.0 (35.1)
Interest 43.0 45.0 (4.4) 43.7 (1.6)
Depreciation 59.0 52.0 13.5 65.8 (10.3)
Non operating income 8.0 6.0 33.3 17.4 (53.9)
PBT (20.0) (21.0) 21.8
Tax - - -
PAT (20.0) (21.0) - 21.8 -
EPS (Rs) (0.3) (0.3) - 0.3 -
GPM (%) 52.7 56.1 (342.0) 54.7 (201.0)
OPM (%) 4.2 5.0 (75.4) 7.1 (285.3)
Other highlights
MFL revenue growth robust; margins remained under pressure: MFL’s Q1FY2018 revenue grew by 24.7% YoY to Rs1,050 crore driven by a 14% revenue growth in the Lifestyle brands segment. The revenues in the Fast Fashion segment tripled in Q1FY2018 due to addition of Forever 21 while other businesses grew by 63% YoY. The Same Stores Sales Growth (SSSG) stood strong at 21% YoY in Q1FY2018 due to focused store level interventions to drive organic growth. Also, the four season cycle led to greater freshness and lower inventory across channels. EBITDA de-grew by ~21% YoY to Rs37 crore due to EOSS and also due to losses in the new businesses of Rs. 28 crores. Post its acquisition in July 2016, operations in Forever 21 have now stabilised and the integration is now complete with 18 stores in India. Also, ABFRL has 90 stores under the People brand, which is positioned to target the college going youth and the new salaried class. The management aims to turn Forever 21 profitable in FY2018 by rationalizing existing stores in terms of store size and also introducing new stores with better pricing in terms of rent and location. The company plans to add 8-10 Forever 21 stores during FY2018. As far as the Van Heusen Innerwear and Athleisure wear segment is concerned, the company has been able to distribute it across 2000 stores
and has covered all the main cities of South India. It has also commenced the process of launching the product in New Delhi and NCR and aims to cover 8000-9000 outlets by the end of FY2018.
Madura Fashion & Lifestyle (MFL)
Particulars Q1
FY18
Q1
FY17
YoY
%
Q4
FY17
QoQ
%
Revenues 1050.0 842.06 24.7 1045.04 0.5
EBITDA 37 47 (21.3) 117 (68.4)
EBITDA Margin
(%)
3.5 5.6 - 11.2 -
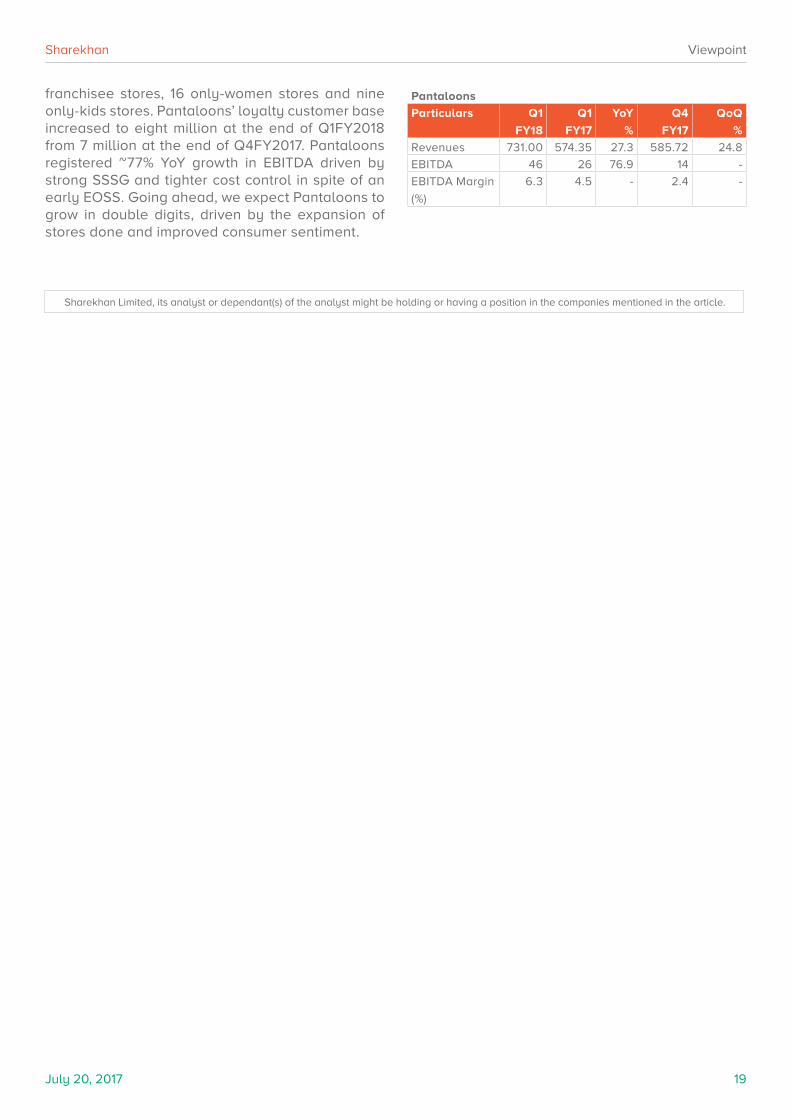
Pantaloons posts strong quarter with 27% revenue growth and 77% growth in EBITDA: Pantaloons’ saw a good growth of 27% YoY in its Q1FY2018 revenue to Rs731 crore, led by pre GST sales momentum and robust SSSG of 14% YoY. During the months of April-May, revenue growth was in single digits, but shot up significantly in June due to EOSS. The contribution of its own brands to Pantaloons revenue remained stable on a YoY basis at 63% in Q1FY2018. The four-season cycle significantly improved the inventory levels. The company added 5 new stores in Q1FY2018, 1 being a franchisee store. Going ahead, ABFRL will open 40-50 new stores every year with 20% of them being through the franchisee route. At the end of Q1FY2018, there were 213 Pantaloons stores, including 29
July 20, 2017 19
Sharekhan Viewpoint
Sharekhan Limited, its analyst or dependant(s) of the analyst might be holding or having a position in the companies mentioned in the article.
franchisee stores, 16 only-women stores and nine only-kids stores. Pantaloons’ loyalty customer base increased to eight million at the end of Q1FY2018 from 7 million at the end of Q4FY2017. Pantaloons registered ~77% YoY growth in EBITDA driven by strong SSSG and tighter cost control in spite of an early EOSS. Going ahead, we expect Pantaloons to grow in double digits, driven by the expansion of stores done and improved consumer sentiment.
Pantaloons
Particulars Q1
FY18
Q1
FY17
YoY
%
Q4
FY17
QoQ
%
Revenues 731.00 574.35 27.3 585.72 24.8
EBITDA 46 26 76.9 14 -
EBITDA Margin
(%)
6.3 4.5 - 2.4 -
July 27, 2017 20
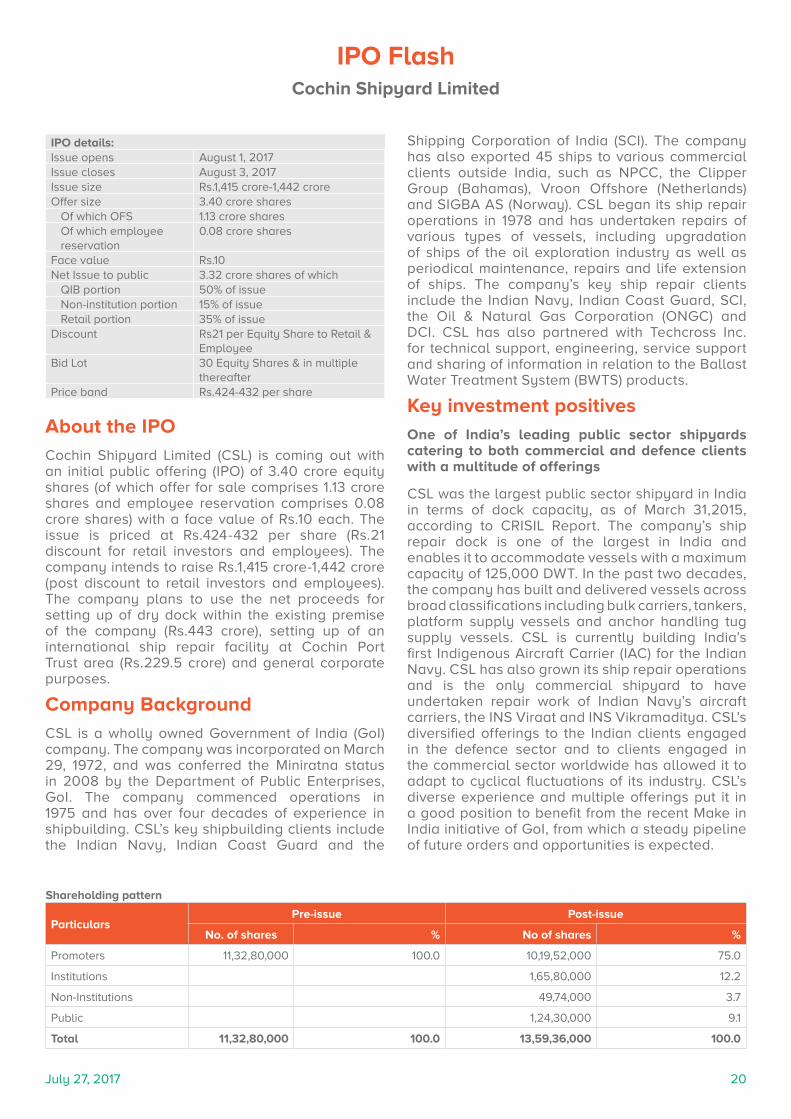
About the IPOCochin Shipyard Limited (CSL) is coming out with an initial public offering (IPO) of 3.40 crore equity shares (of which offer for sale comprises 1.13 crore shares and employee reservation comprises 0.08 crore shares) with a face value of Rs.10 each. The issue is priced at Rs.424-432 per share (Rs.21 discount for retail investors and employees). The company intends to raise Rs.1,415 crore-1,442 crore (post discount to retail investors and employees). The company plans to use the net proceeds for setting up of dry dock within the existing premise of the company (Rs.443 crore), setting up of an international ship repair facility at Cochin Port Trust area (Rs.229.5 crore) and general corporate purposes.
Company BackgroundCSL is a wholly owned Government of India (GoI) company. The company was incorporated on March 29, 1972, and was conferred the Miniratna status in 2008 by the Department of Public Enterprises, GoI. The company commenced operations in 1975 and has over four decades of experience in shipbuilding. CSL’s key shipbuilding clients include the Indian Navy, Indian Coast Guard and the
IPO details:Issue opens August 1, 2017Issue closes August 3, 2017Issue size Rs.1,415 crore-1,442 croreOffer size 3.40 crore shares
Of which OFS 1.13 crore sharesOf which employee reservation
0.08 crore shares
Face value Rs.10Net Issue to public 3.32 crore shares of which
QIB portion 50% of issueNon-institution portion 15% of issueRetail portion 35% of issue
Discount Rs21 per Equity Share to Retail & Employee
Bid Lot 30 Equity Shares & in multiple thereafter
Price band Rs.424-432 per share
Shipping Corporation of India (SCI). The company has also exported 45 ships to various commercial clients outside India, such as NPCC, the Clipper Group (Bahamas), Vroon Offshore (Netherlands) and SIGBA AS (Norway). CSL began its ship repair operations in 1978 and has undertaken repairs of various types of vessels, including upgradation of ships of the oil exploration industry as well as periodical maintenance, repairs and life extension of ships. The company’s key ship repair clients include the Indian Navy, Indian Coast Guard, SCI, the Oil & Natural Gas Corporation (ONGC) and DCI. CSL has also partnered with Techcross Inc. for technical support, engineering, service support and sharing of information in relation to the Ballast Water Treatment System (BWTS) products.
Key investment positivesOne of India’s leading public sector shipyards catering to both commercial and defence clients with a multitude of offerings
CSL was the largest public sector shipyard in India in terms of dock capacity, as of March 31,2015, according to CRISIL Report. The company’s ship repair dock is one of the largest in India and enables it to accommodate vessels with a maximum capacity of 125,000 DWT. In the past two decades, the company has built and delivered vessels across broad classifications including bulk carriers, tankers, platform supply vessels and anchor handling tug supply vessels. CSL is currently building India’s first Indigenous Aircraft Carrier (IAC) for the Indian Navy. CSL has also grown its ship repair operations and is the only commercial shipyard to have undertaken repair work of Indian Navy’s aircraft carriers, the INS Viraat and INS Vikramaditya. CSL’s diversified offerings to the Indian clients engaged in the defence sector and to clients engaged in the commercial sector worldwide has allowed it to adapt to cyclical fluctuations of its industry. CSL’s diverse experience and multiple offerings put it in a good position to benefit from the recent Make in India initiative of GoI, from which a steady pipeline of future orders and opportunities is expected.
Shareholding pattern
ParticularsPre-issue Post-issue
No. of shares % No of shares %
Promoters 11,32,80,000 100.0 10,19,52,000 75.0
Institutions 1,65,80,000 12.2
Non-Institutions 49,74,000 3.7
Public 1,24,30,000 9.1
Total 11,32,80,000 100.0 13,59,36,000 100.0
IPO FlashCochin Shipyard Limited
July 27, 2017 21
Sharekhan IPO Flash
Breakdown of average operating revenue of the past five fiscals
Activity Defence sector clients (%)
Commercial clients (%)
Shipbuilding 69.44 12.68
Ship repair 10.42 6.94
Other operating revenue 0.48 0.04
Source: RHP
Expansion of capabilities through proposed dry dock and international ship repair facility
CSL is building a dry dock at an estimated cost of Rs.1,799 crore. The length of the dry dock will be greater than the length of the company’s existing docks. The large size of its proposed dry dock will enable it to build and repair ships of higher capacity and large naval vessels such as aircraft carriers. CSL has entered into an agreement for development and operation of an international ship repair facility (ISRF) with Cochin Port Trust. The ISRF is to be built at an estimated investment of Rs.969 crore. For the ISRF, it has leased ~8.12 hectares of land and 15 hectares of water body from CoPT for a period of 30 years. Once development of dry dock and ISRF is complete, CSL believes the new facilities will expand its existing capacities significantly and help it to build and repair a broader variety of vessels.
GoI’s policy initiatives to help build a strong order book
GoI’s policy initiatives such as granting infrastructure status to shipbuilding, granting right of first refusal to Indian shipyards for shipbuilding and ship repair work of the Indian PSUs and support through the new financial assistance scheme are expected to provide a steady pipeline of orders and become key growth drivers. The GoI also plans to promote inland water transportation and coastal shipping. This will present several opportunities, including building high-speed ferry crafts, dredgers, ropax vessels and large capacity passenger ships. This will create demand for shipbuilding and ship repair services, which CSL believes is well equipped to deliver. CSL is also well positioned to take advantage of future orders placed by the Indian Navy and other Indian PSUs, being one of the few commercial shipyards to have won defence orders and deliver successfully on those mandates.
Continuous profits leading to robust financial performance
CSL is a profitable and dividend paying shipyard. CSL’s total income and PAT have increased at CAGRs of 15.3% and 112.3%, respectively, during FY2015-FY2017. Additionally, it has continuously delivered positive RoE margins over the past five fiscals. The company has paid dividends to its shareholders at rates of 15%, 15%, 15% and 76.5% in FY2013, FY2014, FY2015 and FY2016, respectively, and has declared dividend of 89.7% for FY2017. As of June 30, 2017, its total cash and bank balance stood at Rs.2,003 crore, while it had fund-based indebtedness in the form of tax-free infrastructure bonds amounting to Rs.123 crore. The strength in terms of liquidity and indebtedness provides it to stay invested in its business and to consistently pay its suppliers on time and benefit from supplier goodwill.
Led by dedicated board and long serving and experienced senior management
CSL’s key management staff has, on an average, more than 25 years experience in the industry and has been with the company for an average of two decades. The organisational culture, experienced board and senior management have been instrumental in helping CSL to achieve a low-cost structure, continuous profit margins, efficient operations, short delivery schedules, relatively lower attrition and fewer employee disputes. The company has a large pool of experienced naval architects, engineers and draftsmen.
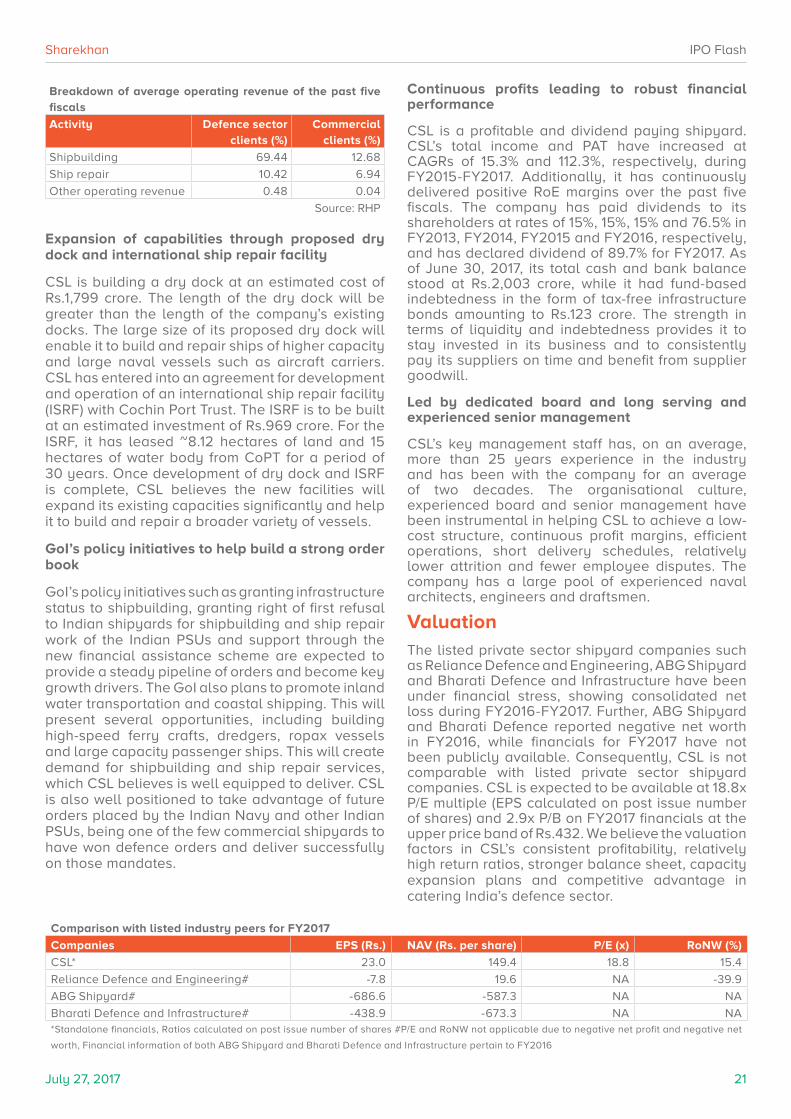
ValuationThe listed private sector shipyard companies such as Reliance Defence and Engineering, ABG Shipyard and Bharati Defence and Infrastructure have been under financial stress, showing consolidated net loss during FY2016-FY2017. Further, ABG Shipyard and Bharati Defence reported negative net worth in FY2016, while financials for FY2017 have not been publicly available. Consequently, CSL is not comparable with listed private sector shipyard companies. CSL is expected to be available at 18.8x P/E multiple (EPS calculated on post issue number of shares) and 2.9x P/B on FY2017 financials at the upper price band of Rs.432. We believe the valuation factors in CSL’s consistent profitability, relatively high return ratios, stronger balance sheet, capacity expansion plans and competitive advantage in catering India’s defence sector.
Comparison with listed industry peers for FY2017
Companies EPS (Rs.) NAV (Rs. per share) P/E (x) RoNW (%)
CSL* 23.0 149.4 18.8 15.4
Reliance Defence and Engineering# -7.8 19.6 NA -39.9
ABG Shipyard# -686.6 -587.3 NA NA
Bharati Defence and Infrastructure# -438.9 -673.3 NA NA*Standalone financials, Ratios calculated on post issue number of shares #P/E and RoNW not applicable due to negative net profit and negative net
worth, Financial information of both ABG Shipyard and Bharati Defence and Infrastructure pertain to FY2016
July 27, 2017 22
Sharekhan IPO Flash
Key riskDependency on global economic conditions
The commercial shipbuilding industry is highly cyclical in nature and is sensitive to industries such as oil, natural gas, shipping, transportation and other trade-related industries. Any deterioration in global economic conditions as well as downward trends in trade-related industries could have material, adverse effect on its business, financial condition, results of operations and prospects.
Dependency on few of its major customers
CSL’s top two customers accounted for 82.4%, 89.9% and 84.6% of its revenue in FY2015, FY2016 and FY2017, respectively. If any of CSL’s major customers ceases to have business dealings with it and it is unable to secure new orders from other sources, the company’s business and prospects will be adversely affected.
Delay or cost overrun in expansion
Any delay or cost overruns in its proposed dry dock or international ship repair facility may have a detrimental impact on CSL’s growth prospects.
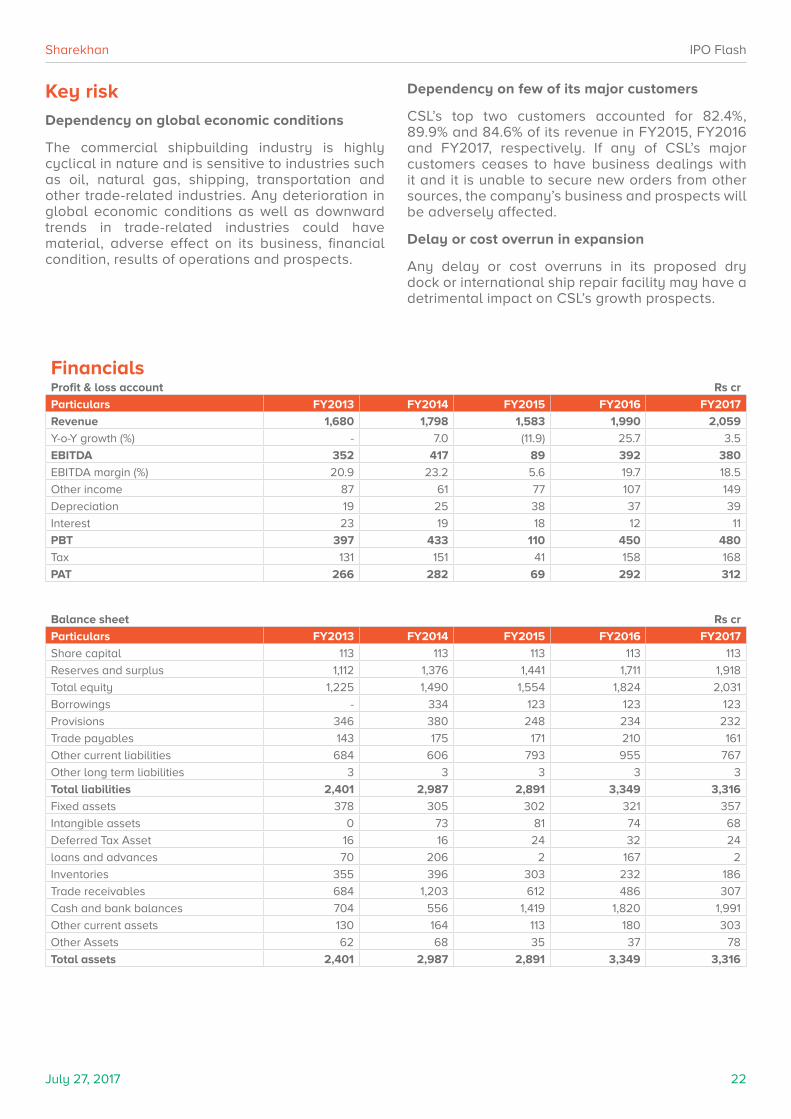
FinancialsProfit & loss account Rs cr
Particulars FY2013 FY2014 FY2015 FY2016 FY2017
Revenue 1,680 1,798 1,583 1,990 2,059
Y-o-Y growth (%) - 7.0 (11.9) 25.7 3.5
EBITDA 352 417 89 392 380
EBITDA margin (%) 20.9 23.2 5.6 19.7 18.5
Other income 87 61 77 107 149
Depreciation 19 25 38 37 39
Interest 23 19 18 12 11
PBT 397 433 110 450 480
Tax 131 151 41 158 168
PAT 266 282 69 292 312
Balance sheet Rs cr
Particulars FY2013 FY2014 FY2015 FY2016 FY2017
Share capital 113 113 113 113 113
Reserves and surplus 1,112 1,376 1,441 1,711 1,918
Total equity 1,225 1,490 1,554 1,824 2,031
Borrowings - 334 123 123 123
Provisions 346 380 248 234 232
Trade payables 143 175 171 210 161
Other current liabilities 684 606 793 955 767
Other long term liabilities 3 3 3 3 3
Total liabilities 2,401 2,987 2,891 3,349 3,316
Fixed assets 378 305 302 321 357
Intangible assets 0 73 81 74 68
Deferred Tax Asset 16 16 24 32 24
loans and advances 70 206 2 167 2
Inventories 355 396 303 232 186
Trade receivables 684 1,203 612 486 307
Cash and bank balances 704 556 1,419 1,820 1,991
Other current assets 130 164 113 180 303
Other Assets 62 68 35 37 78
Total assets 2,401 2,987 2,891 3,349 3,316
July 27, 2017 23
Sharekhan IPO Flash
About the industry
Indian shipbuilding industry
The Indian shipbuilding industry can be divided into three segments.
� Public sector shipyards: CSL, Hooghly Dock and Port Engineers, which primarily build merchant class ships and naval vessels.
� Defence shipyards: Hindustan Shipyard, Mazagon Dock, Goa Shipyard and Garden Reach Shipbuilders and Engineers, which come under the purview of the Indian Ministry of Defence.
� Private sector shipyards: Bharati Defence and Infrastructure, ABG Shipyard and Reliance Defence and Engineering are publicly listed. Larsen and Toubro (L&T) is another major private sector shipyard. In addition, there are a number of smaller private shipyards building smaller ships and vessels.
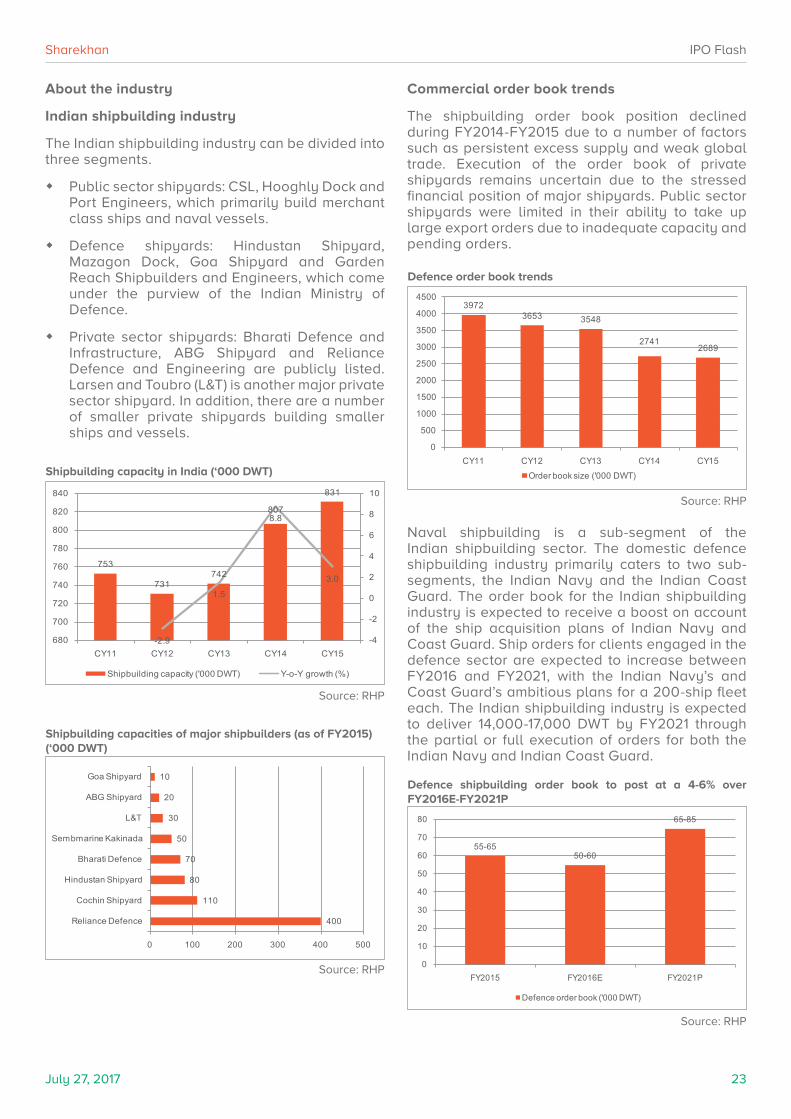
Shipbuilding capacity in India (‘000 DWT)
753
731742
807
831
-2.9
1.5
8.8
3.0
-4
-2
0
2
4
6
8
10
680
700
720
740
760
780
800
820
840
CY11 CY12 CY13 CY14 CY15
Shipbuilding capacity ('000 DWT) Y-o-Y growth (%)
Source: RHP
Defence order book trends
39723653 3548
27412689
0
500
1000
1500
2000
2500
3000
3500
4000
4500
CY11 CY12 CY13 CY14 CY15
Order book size ('000 DWT)
Shipbuilding capacities of major shipbuilders (as of FY2015) (‘000 DWT)
400
110
80
70
50
30
20
10
0 100 200 300 400 500
Reliance Defence
Cochin Shipyard
Hindustan Shipyard
Bharati Defence
Sembmarine Kakinada
L&T
ABG Shipyard
Goa Shipyard
Source: RHP
Commercial order book trends
The shipbuilding order book position declined during FY2014-FY2015 due to a number of factors such as persistent excess supply and weak global trade. Execution of the order book of private shipyards remains uncertain due to the stressed financial position of major shipyards. Public sector shipyards were limited in their ability to take up large export orders due to inadequate capacity and pending orders.
Source: RHP
Naval shipbuilding is a sub-segment of the Indian shipbuilding sector. The domestic defence shipbuilding industry primarily caters to two sub-segments, the Indian Navy and the Indian Coast Guard. The order book for the Indian shipbuilding industry is expected to receive a boost on account of the ship acquisition plans of Indian Navy and Coast Guard. Ship orders for clients engaged in the defence sector are expected to increase between FY2016 and FY2021, with the Indian Navy’s and Coast Guard’s ambitious plans for a 200-ship fleet each. The Indian shipbuilding industry is expected to deliver 14,000-17,000 DWT by FY2021 through the partial or full execution of orders for both the Indian Navy and Indian Coast Guard.
Defence shipbuilding order book to post at a 4-6% over FY2016E-FY2021P
55-6550-60
65-85
0
10
20
30
40
50
60
70
80
FY2015 FY2016E FY2021P
Defence order book ('000 DWT)
Source: RHP
July 27, 2017 24
Sharekhan IPO Flash
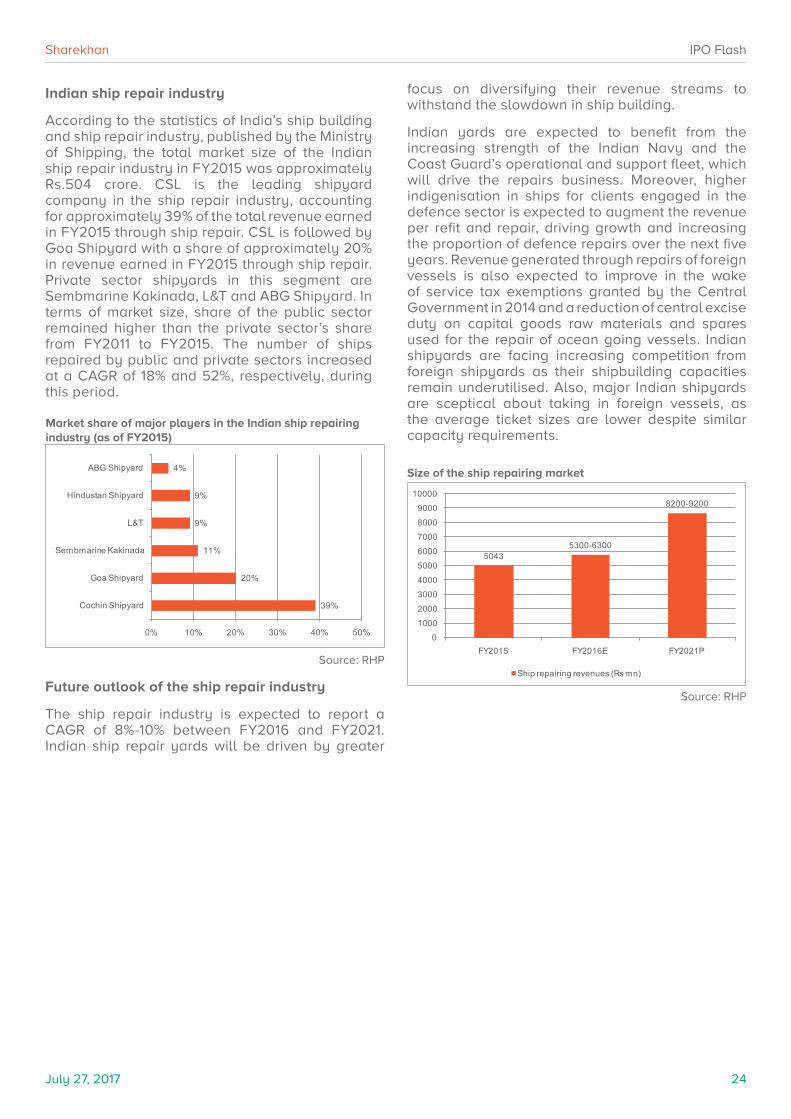
Market share of major players in the Indian ship repairing industry (as of FY2015)
Size of the ship repairing market
39%
20%
11%
9%
9%
4%
0% 10% 20% 30% 40% 50%
Cochin Shipyard
Goa Shipyard
Sembmarine Kakinada
L&T
Hindustan Shipyard
ABG Shipyard
50435300-6300
8200-9200
0
1000
2000
3000
4000
5000
6000
7000
8000
9000
10000
FY2015 FY2016E FY2021P
Ship repairing revenues (Rs mn)
Indian ship repair industry
According to the statistics of India’s ship building and ship repair industry, published by the Ministry of Shipping, the total market size of the Indian ship repair industry in FY2015 was approximately Rs.504 crore. CSL is the leading shipyard company in the ship repair industry, accounting for approximately 39% of the total revenue earned in FY2015 through ship repair. CSL is followed by Goa Shipyard with a share of approximately 20% in revenue earned in FY2015 through ship repair. Private sector shipyards in this segment are Sembmarine Kakinada, L&T and ABG Shipyard. In terms of market size, share of the public sector remained higher than the private sector’s share from FY2011 to FY2015. The number of ships repaired by public and private sectors increased at a CAGR of 18% and 52%, respectively, during this period.
Future outlook of the ship repair industry
The ship repair industry is expected to report a CAGR of 8%-10% between FY2016 and FY2021. Indian ship repair yards will be driven by greater
focus on diversifying their revenue streams to withstand the slowdown in ship building.
Indian yards are expected to benefit from the increasing strength of the Indian Navy and the Coast Guard’s operational and support fleet, which will drive the repairs business. Moreover, higher indigenisation in ships for clients engaged in the defence sector is expected to augment the revenue per refit and repair, driving growth and increasing the proportion of defence repairs over the next five years. Revenue generated through repairs of foreign vessels is also expected to improve in the wake of service tax exemptions granted by the Central Government in 2014 and a reduction of central excise duty on capital goods raw materials and spares used for the repair of ocean going vessels. Indian shipyards are facing increasing competition from foreign shipyards as their shipbuilding capacities remain underutilised. Also, major Indian shipyards are sceptical about taking in foreign vessels, as the average ticket sizes are lower despite similar capacity requirements.
Source: RHP
Source: RHP
AutomobilesApollo TyresAshok Leyland Bajaj AutoGabriel IndustriesHero MotoCorpM&MMaruti Suzuki Rico Auto IndustriesTVS Motor
Banks & FinanceAxis (UTI) BankBajaj Finance Bajaj FinservBank of BarodaBank of IndiaCapital FirstFederal BankHDFCHDFC BankICICI BankLIC Housing FinancePTC India Financial ServicesPunjab National BankSBIUnion Bank of IndiaYes Bank
IT / IT servicesFirstsource SoluationHCL TechnologiesInfosysPersistent SystemsTata Consultancy Services Wipro
Capital goods / PowerBharat Heavy ElectricalsCESCCG Power & Industrial SolutionsFinolex CableGreaves CottonKalpataru Power TransmissionKEC InternationalPTC IndiaSkipperThermaxTriveni TurbineV-Guard IndustriesVa Tech Wabag
Building materialsGrasimThe Ramco Cements Shree CementUltraTech Cement
Discretionary consumptionArvind LtdCentury Plyboards (India)Cox and Kings Inox Leisure Info Edge (India)KKCLOrbit ExportsRelaxo Footwear Thomas Cook IndiaWonderla HolidaysZee Entertainment
Diversified / MiscellaneousAditya Birla NuvoBajaj HoldingsBharti AirtelBharat ElectronicsGateway DistriparksMax Financial ServicesPI IndustriesRatnamani Metals and TubesSupreme Industries United Phosphorus
Disclaimer: This document has been prepared by Sharekhan Ltd. (SHAREKHAN) and is intended for use only by the person or entity to which it is addressed to. This Document may contain confidential and/or privileged material and is not for any type of circulation and any review, retransmission, or any other use is strictly prohibited. This Document is subject to changes without prior notice. This document does not constitute an offer to sell or solicitation for the purchase or sale of any financial instrument or as an official confirmation of any transaction. Though disseminated to all customers who are due to receive the same, not all customers may receive this report at the same time. SHAREKHAN will not treat recipients as customers by virtue of their receiving this report.
The information contained herein is obtained from publicly available data or other sources believed to be reliable and SHAREKHAN has not independently verified the accuracy and completeness of the said data and hence it should not be relied upon as such. While we would endeavour to update the information herein on reasonable basis, SHAREKHAN, its subsidiaries and associated companies, their directors and employees (“SHAREKHAN and affiliates”) are under no obligation to update or keep the information current. Also, there may be regulatory, compliance, or other reasons that may prevent SHAREKHAN and affiliates from doing so. This document is prepared for assistance only and is not intended to be and must not alone be taken as the basis for an investment decision. Recipients of this report should also be aware that past performance is not necessarily a guide to future performance and value of investments can go down as well. The user assumes the entire risk of any use made of this information. Each recipient of this document should make such investigations as it deems necessary to arrive at an independent evaluation of an investment in the securities of companies referred to in this document (including the merits and risks involved), and should consult its own advisors to determine the merits and risks of such an investment. The investment discussed or views expressed may not be suitable for all investors. We do not undertake to advise you as to any change of our views. Affiliates of Sharekhan may have issued other reports that are inconsistent with and reach different conclusion from the information presented in this report.
This report is not directed or intended for distribution to, or use by, any person or entity who is a citizen or resident of or located in any locality, state, country or other jurisdiction, where such distribution, publication, availability or use would be contrary to law, regulation or which would subject SHAREKHAN and affiliates to any registration or licencing requirement within such jurisdiction. The securities described herein may or may not be eligible for sale in all jurisdictions or to certain category of investors. Persons in whose possession this document may come are required to inform themselves of and to observe such restriction.
The analyst certifies that the analyst has not dealt or traded directly or indirectly in securities of the company and that all of the views expressed in this document accurately reflect his or her personal views about the subject company or companies and its or their securities and do not necessarily reflect those of SHAREKHAN. The analyst further certifies that neither he nor his relatives has any direct or indirect financial interest nor have actual or beneficial ownership of 1% or more in the securities of the company nor have any material conflict of interest nor has served as officer, director or employee or engaged in market making activity of the company. Further, the analyst has also not been a part of the team which has managed or co-managed the public offerings of the company and no part of the analyst’s compensation was, is or will be, directly or indirectly related to specific recommendations or views expressed in this document.
Either SHAREKHAN or its affiliates or its directors or employees / representatives / clients or their relatives may have position(s), make market, act as principal or engage in transactions of purchase or sell of securities, from time to time or may be materially interested in any of the securities or related securities referred to in this report and they may have used the information set forth herein before publication. SHAREKHAN may from time to time solicit from, or perform investment banking, or other services for, any company mentioned herein. Without limiting any of the foregoing, in no event shall SHAREKHAN, any of its affiliates or any third party involved in, or related to, computing or compiling the information have any liability for any damages of any kind.
Compliance Officer: Ms. Namita Amod Godbole; Tel: 022-61150000; For any queries or grievances kindly email [email protected] or contact: [email protected]
Registered Office: Sharekhan Limited, 10th Floor, Beta Building, Lodha iThink Techno Campus, Off. JVLR, Opp. Kanjurmarg Railway Station, Kanjurmarg (East), Mumbai – 400042, Maharashtra. Tel: 022 - 61150000. Sharekhan Ltd.: SEBI Regn. Nos.: BSE: INB/INF011073351 / BSE-CD; NSE: INB/INF/INE231073330 ; MSEI: INB/INF261073333 / INE261073330 ; DP: NSDL-IN-DP-NSDL-233-2003 ; CDSL-IN-DP-CDSL-271-2004; PMS-INP000000662 ; Mutual Fund-ARN 20669 ; Research Analyst: INH000000370; For any complaints email at [email protected] ; Disclaimer: Client should read the Risk Disclosure Document issued by SEBI & relevant exchanges and the T & C on www.sharekhan.com ; Investment in securities market are subject to market risks, read all the related documents carefully before investing.