Page 1
All prices are those of the end of the trading session unless otherwise indicated. For important Disclosure and Disclaimer go to the second last page.
Millennium investment banking 05 September 2013
Inditex Company update
Benefiting from a strong strategy
João Flores, Equity Analyst +351 21 003 7830
[email protected]
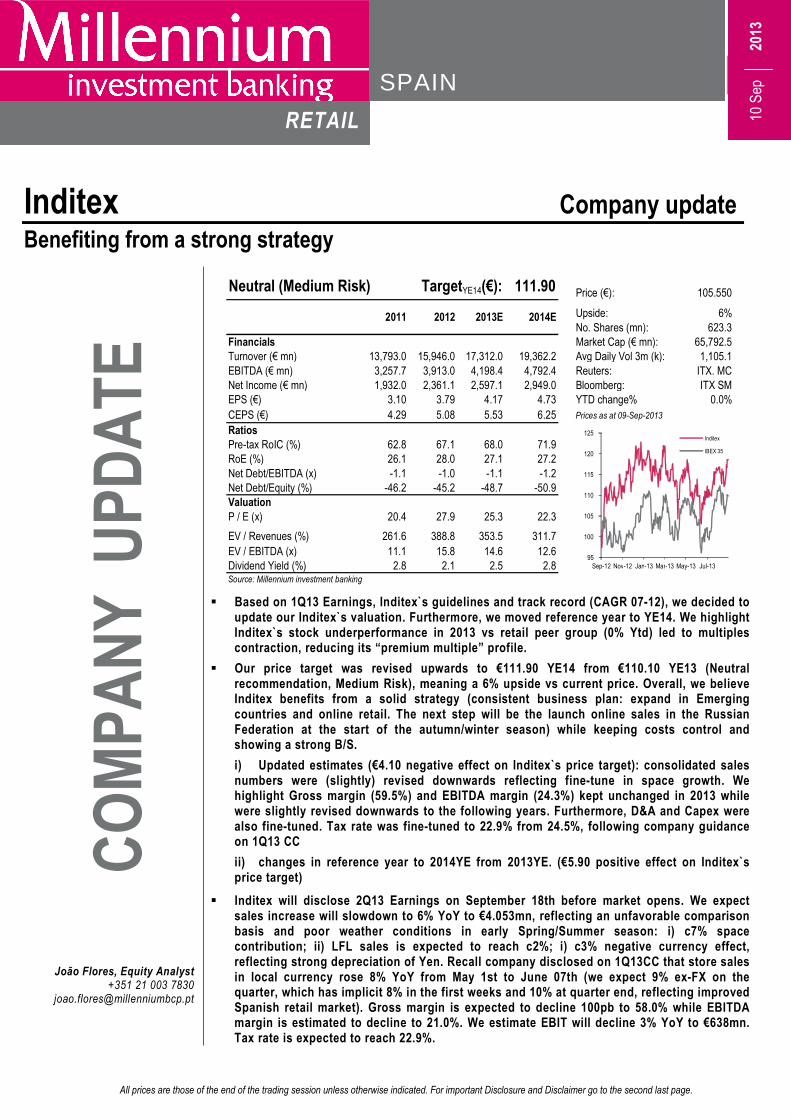
Neutral (Medium Risk) TargetYE14(€): 111.90 Price (€): 105.550
Upside: 6%
No. Shares (mn): 623.3Financials Market Cap (€ mn): 65,792.5Turnover (€ mn) 13,793.0 15,946.0 17,312.0 19,362.2 Avg Daily Vol 3m (k): 1,105.1
EBITDA (€ mn) 3,257.7 3,913.0 4,198.4 4,792.4 Reuters: ITX. MCNet Income (€ mn) 1,932.0 2,361.1 2,597.1 2,949.0 Bloomberg: ITX SMEPS (€) 3.10 3.79 4.17 4.73 YTD change% 0.0%
CEPS (€) 4.29 5.08 5.53 6.25 Prices as at 09-Sep-2013
Ratios
Pre-tax RoIC (%) 62.8 67.1 68.0 71.9RoE (%) 26.1 28.0 27.1 27.2
Net Debt/EBITDA (x) -1.1 -1.0 -1.1 -1.2Net Debt/Equity (%) -46.2 -45.2 -48.7 -50.9Valuation
P / E (x) 20.4 27.9 25.3 22.3
EV / Revenues (%) 261.6 388.8 353.5 311.7
EV / EBITDA (x) 11.1 15.8 14.6 12.6Dividend Yield (%) 2.8 2.1 2.5 2.8Source: Millennium investment banking
2014E2012 2013E2011
95
100
105
110
115
120
125
Sep-12 Nov-12 Jan-13 Mar-13 May-13 Jul-13
Inditex
IBEX 35
� Based on 1Q13 Earnings, Inditex`s guidelines and track record (CAGR 07-12), we decided to update our Inditex`s valuation. Furthermore, we moved reference year to YE14. We highlight Inditex`s stock underperformance in 2013 vs retail peer group (0% Ytd) led to multiples contraction, reducing its “premium multiple” profile.
� Our price target was revised upwards to €111.90 YE14 from €110.10 YE13 (Neutral recommendation, Medium Risk), meaning a 6% upside vs current price. Overall, we believe Inditex benefits from a solid strategy (consistent business plan: expand in Emerging countries and online retail. The next step will be the launch online sales in the Russian Federation at the start of the autumn/winter season) while keeping costs control and showing a strong B/S.
i) Updated estimates (€4.10 negative effect on Inditex`s price target): consolidated sales numbers were (slightly) revised downwards reflecting fine-tune in space growth. We highlight Gross margin (59.5%) and EBITDA margin (24.3%) kept unchanged in 2013 while were slightly revised downwards to the following years. Furthermore, D&A and Capex were also fine-tuned. Tax rate was fine-tuned to 22.9% from 24.5%, following company guidance on 1Q13 CC
ii) changes in reference year to 2014YE from 2013YE. (€5.90 positive effect on Inditex`s price target)
� Inditex will disclose 2Q13 Earnings on September 18th before market opens. We expect sales increase will slowdown to 6% YoY to €4.053mn, reflecting an unfavorable comparison basis and poor weather conditions in early Spring/Summer season: i) c7% space contribution; ii) LFL sales is expected to reach c2%; i) c3% negative currency effect, reflecting strong depreciation of Yen. Recall company disclosed on 1Q13CC that store sales in local currency rose 8% YoY from May 1st to June 07th (we expect 9% ex-FX on the quarter, which has implicit 8% in the first weeks and 10% at quarter end, reflecting improved Spanish retail market). Gross margin is expected to decline 100pb to 58.0% while EBITDA margin is estimated to decline to 21.0%. We estimate EBIT will decline 3% YoY to €638mn. Tax rate is expected to reach 22.9%.
10 Sep 2
013
C
OM
PA
NY
UP
DA
TE
RETAIL
SPAIN
Page 2
2
Millennium investment banking 10 September 2013
Index
Executive Summary 3
Valuation 4
KPI 5
Sales estimates 9
Stores divisional estimates 10
Net sales, Gross margin evolution 13
Share Price charts 14
Peer Multiples 17
Historical Multiples 18
Consolidated Estimates 21
Quarter Evolution 23
Disclosures 26
Page 3
3
Millennium investment banking 10 September 2013
Executive Summary
Updated valuation
Based on 1Q13 Earnings, Inditex`s guidelines and track record (CAGR 07-12), we decided to update our Inditex`s
valuation. Furthermore, we moved reference year to YE14. Our price target was revised upwards to €111.90
YE14 from €110.10 YE13 (Neutral recommendation, Medium Risk), meaning a 6% upside vs current price.
Overall, we believe Inditex benefits from a solid strategy (consistent business plan: expand in Emerging countries
and online retail. The next step will be the launch online sales in the Russian Federation at the start of the
autumn/winter season) while keeping costs control and showing a strong B/S. Furthermore, Inditex`s stock
underperformance in 2013 vs retail peer group (0% Ytd, page 14) led to multiples contraction, reducing its
“premium multiple” profile (page 17).
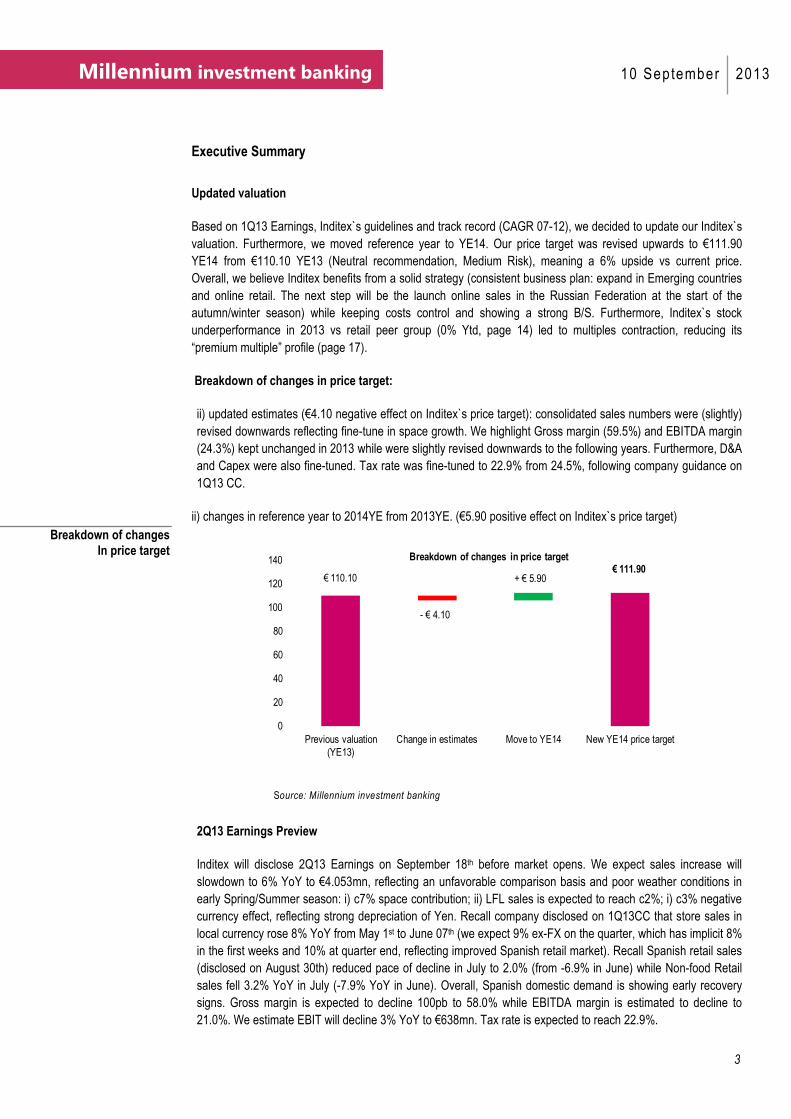
Breakdown of changes in price target:
ii) updated estimates (€4.10 negative effect on Inditex`s price target): consolidated sales numbers were (slightly)
revised downwards reflecting fine-tune in space growth. We highlight Gross margin (59.5%) and EBITDA margin
(24.3%) kept unchanged in 2013 while were slightly revised downwards to the following years. Furthermore, D&A
and Capex were also fine-tuned. Tax rate was fine-tuned to 22.9% from 24.5%, following company guidance on
1Q13 CC.
ii) changes in reference year to 2014YE from 2013YE. (€5.90 positive effect on Inditex`s price target)
- € 4.10
0
20
40
60
80
100
120
140
Previous valuation (YE13)
Change in estimates Move to YE14 New YE14 price target
€ 110.10€ 111.90
Breakdown of changes in price target
+ € 5.90
Source: Millennium investment banking
2Q13 Earnings Preview
Inditex will disclose 2Q13 Earnings on September 18th before market opens. We expect sales increase will
slowdown to 6% YoY to €4.053mn, reflecting an unfavorable comparison basis and poor weather conditions in
early Spring/Summer season: i) c7% space contribution; ii) LFL sales is expected to reach c2%; i) c3% negative
currency effect, reflecting strong depreciation of Yen. Recall company disclosed on 1Q13CC that store sales in
local currency rose 8% YoY from May 1st to June 07th (we expect 9% ex-FX on the quarter, which has implicit 8%
in the first weeks and 10% at quarter end, reflecting improved Spanish retail market). Recall Spanish retail sales
(disclosed on August 30th) reduced pace of decline in July to 2.0% (from -6.9% in June) while Non-food Retail
sales fell 3.2% YoY in July (-7.9% YoY in June). Overall, Spanish domestic demand is showing early recovery
signs. Gross margin is expected to decline 100pb to 58.0% while EBITDA margin is estimated to decline to
21.0%. We estimate EBIT will decline 3% YoY to €638mn. Tax rate is expected to reach 22.9%.
Breakdown of changes In price target
Page 4
4
Millennium investment banking 10 September 2013
Valuation
� Overall, our estimates are based on 1Q13 Earnings, Inditex guidelines and track record (CAGR 07-
12).
� We are assuming a CAGR 12-15 for consolidated sales of 10.4%, based on an estimated 2% LfL sales
(2013-15). Recall CAGR 07-12 was 11.1% while it is estimated CAGR 15-23 9.2%. We highlight Inditex
expects LfL sales will be below 4% in 2013, probably reflecting an increasing tough market in Spain (21% of
total sales in 2012 from 25% in 2011). Zara is expected to keep as Inditex`s growth driver. The contribution
of the franchises represents around 15% of total sales.
� Openings: We estimate Inditex will open 450 stores in 2013 (440-480 Inditex guidance). We highlight
estimated space growth in 2013 is 8.3%, in line with company guidance (8%-10%) which is a more
important number than stores openings. Recall company expects space growth to increase 8%-10% up to
3-5 years in line with our estimates (8.6%). Recall CAGR 07-12 was 10.6% while it is estimated CAGR 15-
23 6.2%. Following 1Q13 numbers, Inditex disclosed space growth and store openings for FY2013 are on
track, since it will accelerate stores openings on next quarters.
� Gross Margins: Following strong numbers in 2012 (59.8%, + 0.5pp), benefiting from positive sales
performance flexible business model, sustained commercial policies) we estimate Gross Margin in 2013 will
slightly decline to 59.5%, penalized by lower estimated LfL sales numbers. We expect higher margins to the
following years (page 5), benefiting from higher scale and efficient management and costs control. Gross
Margin is a global figure with many different elements involved (markups, markdowns, fashion trends,
currencies,...) which it`s very much helped by the LfL sales growth evolution. Following 1Q13 number
(59.6%) Inditex reiterated it expects stable gross margin for the year (± 50bp vs FY2012).
� EBITDA Margins: number is estimated to decline in 2013, penalized by lower Gross Margin, costs linked to
new store openings and slower growth in Spain. Recall the main driver in operating expenses is space
growth, including all the start-up costs for new openings and the roll-out of online sales. Production comes
50% from Iberia, 15% from Turkey and 35% from Asia (mainly China) thus Inditex is less exposed to rising
costs in Asia. We highlight Inditex's net margins level is robust and comparable to H&M's numbers. The
high level of margins of the two groups should ensure that they are in a position to continue investing in
network expansion at a rapid pace. We highlight EBITDA CAGR 07-12 12.7%; 12-15 11.2% and 15-23
9.6%.
� Net financials: We highlight Inditex is cash positive, in order to be more flexible in its strategy and take
advantage of good opportunities (recall company strategy to have flagship stores in major cities which is
only possible whit a strong B/S) while it is not expected it will pay a huge special dividend (conservative
dividend`s policy).
Inditex has a natural match, since its source in euros around 65% of total and sell in euros more or less
70% of total. So, there is not a significant currency impact in the Gross Margin over the year. The higher
revenues coming from non-euro countries (America and Asia) will probably reduce net short position in
dollars and increase the natural match (via reducing percentage sales in euros).
� Capex: We estimate ordinary Capex will reach €1.2Bn in 2013 (in line with Inditex`s guidance). Recall 2012
Capex number (€1.6Bn) includes €245mn from a major flagship store in London. We expect Capex to Sales
(excluding extraordinary Capex) will be c.6.8% in 2013.
� Tax Rate: We estimate Effective tax rate will reach 22.9%, in line with 1Q13 numbers and Inditex guidance.
� Dividends: We estimate a 50.5% ordinary payout (Inditex`s guidance c50%) while we expect company will
keep distributing special dividends (6.55% pay-out) given its strong B/S. Dividend yield 2013 is 2.5%.
Page 5
5
Millennium investment banking 10 September 2013
% 2007 2008 2009 2010 2011 2012 2013E 2014E 2015E 2016E 2017E 2018E 2019E 2020E 2023ECAGR
07-12
CAGR
12-15
CAGR
15-23Consolidated Sales 9435 10407 11084 12527 13793 15946 17312 19362 21456 23712 26148 28699 31371 34165 43325 11.1% 10.4% 9.2% Zara sales 6264 6824 7077 8088 8938 10541 11326 12628 14082 15651 17282 18996 20798 22690 28953 11.0% 10.1% 9.4% Zara (% total sales) 66% 66% 64% 65% 65% 66% 65% 65% 66% 66% 66% 66% 66% 66% 67% Non-Zara sales 3171 3583 4007 4439 4855 5405 5986 6734 7374 8061 8866 9703 10573 11474 14372 11.3% 10.9% 8.7%Consolidated Sales Growth % 15.1% 10.3% 6.5% 13.0% 10.1% 15.6% 8.6% 11.8% 10.8% 10.5% 10.3% 9.8% 9.3% 8.9% 7.9%
LfL sales 5.0% 0% 0% 3% 4% 6% 2% 2% 2% 3% 3% 2% 2% 2% 2%
Space (sqm) 1,914,494 2,180,889 2,348,708 2,587,647 2,838,980 3,161,448 3,424,645 3,724,098 4,044,064 4,357,530 4,670,996 4,985,369 5,299,742 5,614,114 6,557,232 10.6% 8.6% 6.2%
Space Growth % 15.5% 13.9% 7.7% 10.2% 9.7% 11.4% 8.3% 8.7% 8.6% 7.8% 7.2% 6.7% 6.3% 5.9% 5.0%
Sales / Sqm (€/m2) 4.928 4.772 4.719 4.841 4.858 5.044 5.055 5.199 5.305 5.442 5.598 5.757 5.919 6.085 6.607 0.5% 1.7% 2.8%
€/m2 Growth % 0.1% -3.2% -1.1% 2.6% 0.4% 3.8% 0.2% 2.8% 2.0% 2.6% 2.9% 2.8% 2.8% 2.8% 2.8%
# Stores 3691 4264 4607 5044 5527 6009 6459 6941 7447 7948 8449 8960 9471 9982 11515 10.2% 7.4% 5.6%
Stores Openings 560 573 343 437 483 482 450 482 506 501 501 511 511 511 511 -3.0% 1.6% 0.1%
Number of countries with stores 68 73 74 79 82 86
Gross Profit 5349 5914 6328 7422 8180 9529 10301 11540 12831 14204 15689 17219 18823 20499 25995 12.2% 10.4% 9.2%
Gross Margin % 56.7% 56.8% 57.1% 59.2% 59.3% 59.8% 59.5% 59.6% 59.8% 59.9% 60.0% 60.0% 60.0% 60.0% 60.0%
Gross Margin Dif 0.1pp 0.3pp 2.2pp 0.1pp 0.5pp -0.3pp 0.1pp 0.2pp 0.1pp 0.1pp 0.0pp 0.0pp 0.0pp 0.0pp
EBITDA 2149 2187 2374 2966 3258 3913 4198 4792 5375 6011 6707 7419 8110 8832 11200 12.7% 11.2% 9.6%
EBITDA Growth % 20.1% 1.8% 8.6% 24.9% 9.8% 20.1% 7.3% 14.1% 12.2% 11.8% 11.6% 10.6% 9.3% 8.9% 7.9%
EBITDA Margin 22.8% 21.0% 21.4% 23.7% 23.6% 24.5% 24.3% 24.8% 25.1% 25.4% 25.7% 25.9% 25.9% 25.9% 25.9%
EBITDA Margin Dif 1.0pp -1.8pp 0.4pp 2.3pp -0.1pp 0.9pp -0.3pp 0.5pp 0.3pp 0.3pp 0.3pp 0.2pp 0.0pp 0.0pp 0.0pp
D&A -497 -578 -646 -676 -736 -796 -848 -949 -1051 -1162 -1281 -1349 -1255 -1367 -1560 9.9% 9.7% 5.1% D&A % Sales -5.3% -5.6% -5.8% -5.4% -5.3% -5.0% -4.9% -4.9% -4.9% -4.9% -4.9% -4.7% -4.0% -4.0% -3.6%EBIT 1652 1609 1729 2290 2522 3117 3350 3844 4324 4850 5426 6070 6855 7465 9640 13.5% 11.5% 10.5%Net Financials 1 -22 4 31 37 14 27 21 26 30 34 39 44 48 63 71.1% 22.2% 11.9%EBT 1646 1587 1732 2322 2559 3131 3377 3865 4349 4880 5461 6109 6899 7514 9704 13.7% 11.6% 10.6%Taxes -388 -325 -411 -580 -613 -764 -773 -908 -1044 -1171 -1311 -1466 -1656 -1803 -2329 14.5% 11.0% 10.6% Effective tax rate (%) -23.6% -20.5% -23.7% -25.0% -24.0% -24.4% -22.9% -23.5% -24.0% -24.0% -24.0% -24.0% -24.0% -24.0% -24.0%EBM 1258 1262 1322 1741 1946 2367 2604 2956 3306 3708 4150 4643 5243 5710 7375 13.5% 11.8% 10.6%Minorities 7 8 8 9 13 6 6 7 8 9 10 12 13 14 19 -3.0% 11.5% 10.5%Net Income 1250 1253 1314 1732 1932 2361 2597 2949 3297 3699 4140 4631 5230 5696 7356 13.6% 11.8% 10.6%
EPS 2.01 2.01 2.11 2.78 3.10 3.79 4.17 4.73 5.29 5.94 6.64 7.43 8.39 9.14 11.81 13.5% 11.8% 10.6%Capex 942 937 510 754 1349 1599 1170 1289 1385 1400 1434 1472 1506 1541 1733 11.2% -4.7% 2.8%Capex / sales 10.0% 9.0% 4.6% 6.0% 9.8% 10.0% 6.8% 6.7% 6.5% 5.9% 5.5% 5.1% 4.8% 4.5% 4.0%EBITDA - Capex 1207 1250 1864 2212 1909 2314 3029 3503 3990 4611 5273 5948 6604 7291 9467 13.9% 19.9% 11.4%EBITDA - Capex % sales 13% 12% 17% 18% 14% 15% 17% 18% 19% 19% 20% 21% 21% 21% 22%
Ordinary Dividend per Share 1.05 1.05 1.10 1.40 1.60 1.90 2.38 2.70 3.02 3.38 3.79 4.24 4.78 5.21 6.73 12.6% 16.7% 10.6% Ordinary Pay Out 52.2% 52.2% 52.2% 50.4% 51.6% 50.1% 50.5% 50.5% 50.5% 50.5% 50.5% 50.5% 50.5% 50.5% 50.5%Special Dividend per Share 0.00 0.00 0.10 0.20 0.20 0.30 0.27 0.31 0.34 0.39 0.43 0.48 0.55 0.59 0.77 nm 4.7% 10.6% Special Pay Out 0.0% 0.0% 4.7% 7.2% 6.5% 7.9% 6.5% 6.5% 6.5% 6.5% 6.5% 6.5% 6.5% 6.5% 6.5%Total Dividend (€/share) 1.05 1.05 1.20 1.60 1.80 2.20 2.65 3.01 3.36 3.77 4.22 4.72 5.33 5.80 7.50 15.9% 15.2% 10.6% Total Pay Out 52.2% 52.2% 56.9% 57.6% 58.1% 58.1% 3.0% 57.0% 57.0% 57.0% 57.0% 57.0% 57.0% 57.0% 57.0%Dvd Yield 1.8% 1.7% 2.0% 2.6% 2.8% 2.1% 2.5% 2.8% nm nm nm nm nm nm nm
Recall there are 193 United Nations (UN) member states
Source: Company data and Millennium investment banking
KPI
Page 6
6
Millennium investment banking 10 September 2013
% 2007 2008 2009 2010 2011 2012 2013E 2014E 2015E 2016E 2017E 2018E 2019E 2020E 2023ECAGR
07-12
CAGR
12-15
CAGR
15-23Consolidated Sales 9435 10407 11084 12527 13793 15946 17696 19608 21690 23961 26474 29109 31845 34699 43889 11.1% 10.8% 9.2%
Zara sales 6264 6824 7077 8088 8938 10541 11749 13103 14613 16247 18012 19867 21818 23868 30546 11.0% 11.5% 9.7%
Zara (% total sales) 66% 66% 64% 65% 65% 66% 66% 67% 67% 68% 68% 68% 69% 69% 70% Non-Zara sales 3171 3583 4007 4439 4855 5405 5947 6505 7076 7714 8463 9242 10028 10832 13344 11.3% 9.4% 8.3%
Consolidated Sales Growth % 15.1% 10.3% 6.5% 13.0% 10.1% 15.6% 11.0% 10.8% 10.6% 10.5% 10.5% 10.0% 9.4% 9.0% 7.8%
LfL sales 5.0% 0% 0% 3% 4% 6% 2% 2% 2% 3% 3% 2% 2% 2% 2%
Space (sqm) 1,914,494 2,180,889 2,348,708 2,587,647 2,838,980 3,161,448 3,446,736 3,748,553 4,068,519 4,395,985 4,730,951 5,066,233 5,396,740 5,725,458 6,681,458 10.6% 8.8% 6.4%
Space Growth % 15.5% 13.9% 7.7% 10.2% 9.7% 11.4% 9.0% 8.8% 8.5% 8.0% 7.6% 7.1% 6.5% 6.1% 4.9%
Sales / Sqm (€/m2) 4.928 4.772 4.719 4.841 4.858 5.044 5.134 5.231 5.331 5.451 5.596 5.746 5.901 6.061 6.569 0.5% 1.9% 2.6%
€/m2 Growth % 0.1% -3.2% -1.1% 2.6% 0.4% 3.8% 1.8% 1.9% 1.9% 2.2% 2.7% 2.7% 2.7% 2.7% 2.7%
# Stores 3691 4264 4607 5044 5527 6009 6460 6923 7409 7900 8396 8900 9389 9871 11249 10.2% 7.2% 5.4%
Stores Openings 560 573 343 437 483 482 451 463 486 491 496 504 489 482 452 -3.0% 0.3% -0.9%
Number of countries with stores 68 73 74 79 82 86
Gross Profit 5349 5914 6328 7422 8180 9529 10529 11686 12970 14377 15911 17524 19203 20958 26641 12.2% 10.8% 9.4%
Gross Margin % 56.7% 56.8% 57.1% 59.2% 59.3% 59.8% 59.5% 59.6% 59.8% 60.0% 60.1% 60.2% 60.3% 60.4% 60.7%
Gross Margin Dif 0.1pp 0.3pp 2.2pp 0.1pp 0.5pp -0.3pp 0.1pp 0.2pp 0.2pp 0.1pp 0.1pp 0.1pp 0.1pp 0.1pp
EBITDA 2149 2187 2374 2966 3258 3913 4292 4853 5477 6170 6897 7671 8424 9213 11785 12.7% 11.9% 10.1%
EBITDA Growth % 20.1% 1.8% 8.6% 24.9% 9.8% 20.1% 9.7% 13.1% 12.9% 12.7% 11.8% 11.2% 9.8% 9.4% 8.2%
EBITDA Margin 22.8% 21.0% 21.4% 23.7% 23.6% 24.5% 24.3% 24.8% 25.3% 25.8% 26.1% 26.4% 26.5% 26.6% 26.9%
EBITDA Margin Dif 1.0pp -1.8pp 0.4pp 2.3pp -0.1pp 0.9pp -0.3pp 0.5pp 0.5pp 0.5pp 0.3pp 0.3pp 0.1pp 0.1pp 0.1pp
D&A -497 -578 -646 -676 -736 -796 -805 -873 -944 -1018 -1099 -1150 -1194 -1232 -1339 9.9% 5.8% 4.5%
D&A % Sales -5.3% -5.6% -5.8% -5.4% -5.3% -5.0% -4.6% -4.5% -4.4% -4.3% -4.2% -4.0% -3.8% -3.6% -3.1%EBIT 1652 1609 1729 2290 2522 3117 3486 3981 4533 5152 5798 6521 7229 7981 10446 13.5% 13.3% 11.0%
Net Financials 1 -22 4 31 37 14 26 17 20 23 26 30 33 37 49 71.1% 12.0% 12.0%EBT 1646 1587 1732 2322 2559 3131 3512 3998 4553 5175 5824 6551 7263 8018 10495 13.7% 13.3% 11.0%
Taxes -388 -325 -411 -580 -613 -764 -860 -980 -1116 -1268 -1427 -1605 -1779 -1965 -2571 14.5% 13.4% 11.0%
Effective tax rate (%) -23.6% -20.5% -23.7% -25.0% -24.0% -24.4% -24.5% -24.5% -24.5% -24.5% -24.5% -24.5% -24.5% -24.5% -24.5%EBM 1258 1262 1322 1741 1946 2367 2652 3019 3438 3907 4397 4946 5483 6054 7924 13.5% 13.2% 11.0%
Minorities 7 8 8 9 13 6 7 8 9 10 11 13 14 15 20 -3.0% 13.3% 11.0%
Net Income 1250 1253 1314 1732 1932 2361 2645 3011 3429 3897 4386 4933 5469 6039 7904 13.6% 13.2% 11.0%
EPS 2.01 2.01 2.11 2.78 3.10 3.79 4.24 4.83 5.50 6.25 7.04 7.92 8.78 9.69 12.68 13.5% 13.2% 11.0%Capex 942 937 510 754 1349 1599 1163 1236 1315 1363 1412 1438 1449 1468 1492 11.2% -6.3% 1.6%
Capex / sales 10.0% 9.0% 4.6% 6.0% 9.8% 10.0% 6.6% 6.3% 6.1% 5.7% 5.3% 4.9% 4.6% 4.2% 3.4%
EBITDA - Capex 1207 1250 1864 2212 1909 2314 3129 3617 4162 4807 5485 6232 6975 7745 10293 13.9% 21.6% 12.0%EBITDA - Capex % sales 13% 12% 17% 18% 14% 15% 18% 18% 19% 20% 21% 21% 22% 22% 23%
Ordinary Dividend per Share 1.05 1.05 1.10 1.40 1.60 1.90 2.36 2.68 3.05 3.47 3.91 4.39 4.87 5.38 7.04 12.6% 17.1% 11.0% Ordinary Pay Out 52.2% 52.2% 52.2% 50.4% 51.6% 50.1% 50.5% 50.5% 50.5% 50.5% 50.5% 50.5% 50.5% 50.5% 50.5%
Special Dividend per Share 0.00 0.00 0.10 0.20 0.20 0.30 0.21 0.24 0.28 0.31 0.35 0.40 0.44 0.48 0.63 nm -2.8% 11.0% Special Pay Out 0.0% 0.0% 4.7% 7.2% 6.5% 7.9% 5.0% 5.0% 5.0% 5.0% 5.0% 5.0% 5.0% 5.0% 5.0%
Total Dividend (€/share) 1.05 1.05 1.20 1.60 1.80 2.20 2.57 2.92 3.33 3.78 4.26 4.79 5.31 5.86 7.67 15.9% 14.8% 11.0%
Total Pay Out 52.2% 52.2% 56.9% 57.6% 58.1% 58.1% 55.5% 55.5% 55.5% 55.5% 55.5% 55.5% 55.5% 55.5% 55.5%Dvd Yield 1.8% 1.7% 2.0% 2.6% 2.8% 2.1% 2.6% 2.9% 3.3% 3.8% 4.3% 4.8% 5.3% 5.9% 7.7%
Recall there are 193 United Nations (UN) member states
Source: Company data and Millennium investment banking
KPI – Before
Page 7
7
Millennium investment banking 10 September 2013
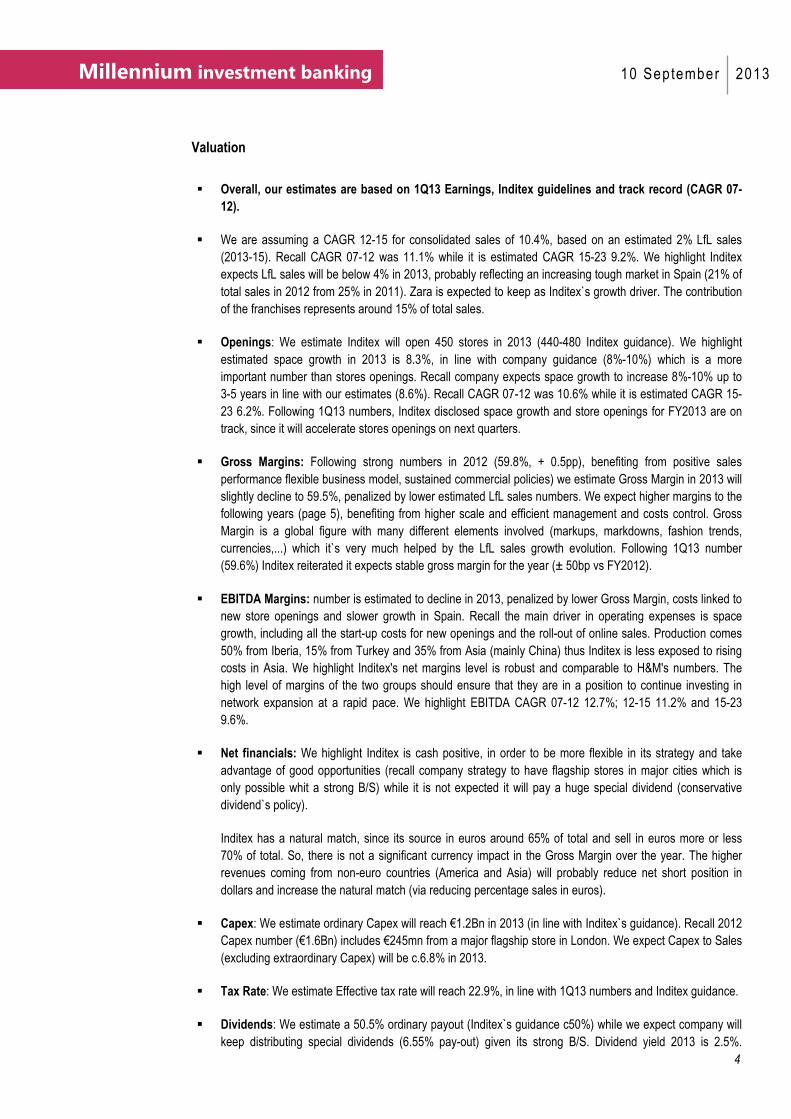
2011YE 2012YE 2013E
Zara 125 130 107 -21 125 130 95 -33 110 115 110 -3
Pull & Bear 45 50 65 18 50 55 69 17 40 45 43 1
Massimo Dutti 40 45 43 1 55 60 57 -1 45 50 47 -1
Berska 70 75 91 19 70 75 74 2 75 80 77 -1
Stradivarius 80 85 91 9 90 95 96 4 95 100 97 -1
Oysho 40 45 51 9 45 50 41 -7 35 40 37 -1
Zara Home 35 40 26 -12 40 45 47 5 35 40 35 -3
Uterque 25 30 9 -19 5 10 3 -5 5 10 4 -4
Total Stores 460 500 483 3 480 520 482 -18 440 480 450 -10
Inditex 2013
Guidance Range
Dif. vs guidance
(Avg.)
Inditex 2011
Guidance Range
Dif. vs guidance
(Avg.)
Inditex 2012
Guidance Range
Dif. vs guidance
(Avg.)
Source: Company data and Millennium investment banking
€ million EV Stake Attrib. Method Previous Valuation Revision
Retail 66,605.6 100% 66,605.6 DCF 13.9x EV/EBITDA 14 17.3x EV/EBIT 14 65,925.0 1.0%
Enterprise Value 66,605.6 65,925.0 1.0%
YE13 Net Debt & Adjustments -3,152.5 -2,685.7 17.4%
YE13 Net Debt -4,683.0 -4,096.8 14.3%
Dividends to be paid out in 2014 1,480.3 1,370.8 8.0%
Minorities 50.2 40.3 24.7%
Equity Value 69,758.1 68,610.7 1.7%
Number of Shares (mn) 623.3 623.3 0.0%
Price target YE13 (€ / share) 111.90 110.10 1.6%
Implied Multiples
Source: Millennium investment banking
€ million 2011 2012 2013E 2014E 2015E 2016E 2017E 2018E 2019E 2020E 2023ECAGR
12-15
CAGR
15-23EBIT 2,522 3,117 3,350 3,844 4,324 4,850 5,426 6,070 6,855 7,465 9,640 11.5% 10.5%
Depreciation & Amortisation 736 796 848 949 1,051 1,162 1,281 1,349 1,255 1,367 1,560 9.7% 5.1%
Cash Flow from Op. Act 3,258 3,913 4,198 4,792 5,375 6,011 6,707 7,419 8,110 8,832 11,200 11.2% 9.6%
Income Taxes -757 -935 -1,005 -1,153 -1,297 -1,455 -1,628 -1,821 -2,056 -2,240 -2,892 11.5% 10.5%
Capital Expenditure -1,349 -1,599 -1,170 -1,289 -1,385 -1,400 -1,434 -1,472 -1,506 -1,541 -1,733 -4.7% 2.8%
Working Capital Changes -50 280 -255 113 74 -232 -304 -467 -717 -846 -1,338 -35.7% #NUM!
Free Cash Flow 1,102 1,658 1,769 2,463 2,768 2,925 3,342 3,660 3,830 4,206 5,238 18.6% 8.3%
Discount Factor 0.00 1.00 0.92 0.84 0.77 0.71 0.65 0.60 0.47
Discounted Cash Flow 0 2463 2540 2463 2582 2595 2492 2511 2439
PV of Cash Flows 25,124
Terminal Value 41,482
Enterprise Value 66,606
Source: Millennium investment banking
€ million 2011 2012 2013E 2014E 2015E 2016E 2017E 2018E 2019E 2020E 2023ECAGR
12-15
CAGR
15-23EBIT 2,522 3,117 3,486 3,981 4,533 5,152 5,798 6,521 7,229 7,981 10,446 13.3% 11.0%
Depreciation & Amortisation 736 796 805 873 944 1,018 1,099 1,150 1,194 1,232 1,339 5.8% 4.5%
Cash Flow from Op. Act 3,258 3,913 4,292 4,853 5,477 6,170 6,897 7,671 8,424 9,213 11,785 11.9% 10.1%
Income Taxes -757 -935 -1,046 -1,194 -1,360 -1,546 -1,739 -1,956 -2,169 -2,394 -3,134 13.3% 11.0%
Capital Expenditure -1,349 -1,599 -1,163 -1,236 -1,315 -1,363 -1,412 -1,438 -1,449 -1,468 -1,492 -6.3% 1.6%
Working Capital Changes -50 280 -123 -163 -244 -335 -405 -574 -750 -930 -1,564 -195.6% 26.1%
Free Cash Flow 1,102 1,658 1,960 2,260 2,558 2,926 3,341 3,702 4,056 4,421 5,595 15.5% 10.3%
Discount Factor 1.00 0.92 0.84 0.77 0.71 0.65 0.60 0.55 0.43
Discounted Cash Flow 1960 2074 2154 2261 2369 2409 2422 2422 2391
PV of Cash Flows 25,259
Terminal Value 40,666
Enterprise Value 65,925 Source: Millennium investment banking
Price target
Inditex Stores Openings Guidance
vs Estimated
DCF
DCF – Before
Page 8
8
Millennium investment banking 10 September 2013
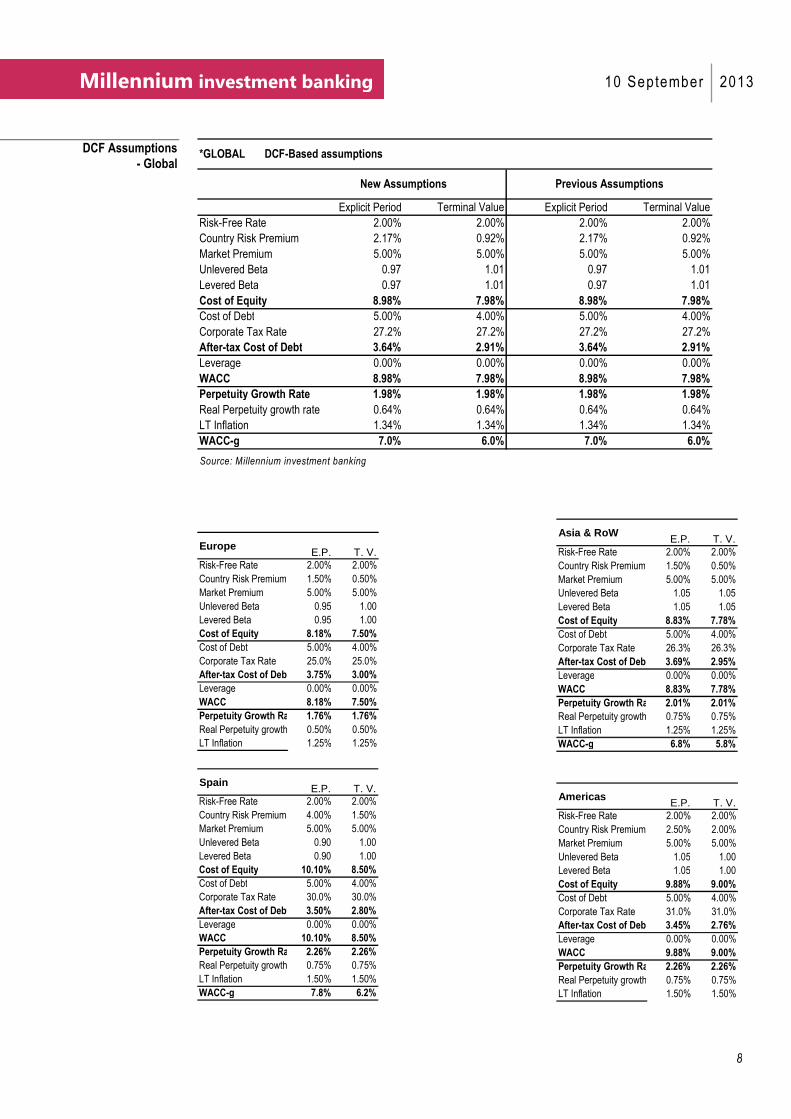
Risk-Free Rate 2.00% 2.00% 2.00% 2.00%
Country Risk Premium 2.17% 0.92% 2.17% 0.92%
Market Premium 5.00% 5.00% 5.00% 5.00%
Unlevered Beta 0.97 1.01 0.97 1.01
Levered Beta 0.97 1.01 0.97 1.01
Cost of Equity 8.98% 7.98% 8.98% 7.98%
Cost of Debt 5.00% 4.00% 5.00% 4.00%
Corporate Tax Rate 27.2% 27.2% 27.2% 27.2%
After-tax Cost of Debt 3.64% 2.91% 3.64% 2.91%
Leverage 0.00% 0.00% 0.00% 0.00%
WACC 8.98% 7.98% 8.98% 7.98%
Perpetuity Growth Rate 1.98% 1.98% 1.98% 1.98%
Real Perpetuity growth rate 0.64% 0.64% 0.64% 0.64%
LT Inflation 1.34% 1.34% 1.34% 1.34%
WACC-g 7.0% 6.0% 7.0% 6.0%
Explicit Period
*GLOBAL DCF-Based assumptions
Terminal Value
New Assumptions
Explicit Period Terminal Value
Previous Assumptions
Source: Millennium investment banking
EuropeE.P. T. V.
Risk-Free Rate 2.00% 2.00%
Country Risk Premium 1.50% 0.50%
Market Premium 5.00% 5.00%
Unlevered Beta 0.95 1.00
Levered Beta 0.95 1.00
Cost of Equity 8.18% 7.50%
Cost of Debt 5.00% 4.00%
Corporate Tax Rate 25.0% 25.0%
After-tax Cost of Debt 3.75% 3.00%
Leverage 0.00% 0.00%
WACC 8.18% 7.50%
Perpetuity Growth Rate 1.76% 1.76%
Real Perpetuity growth rate 0.50% 0.50%
LT Inflation 1.25% 1.25%
SpainE.P. T. V.
Risk-Free Rate 2.00% 2.00%
Country Risk Premium 4.00% 1.50%
Market Premium 5.00% 5.00%
Unlevered Beta 0.90 1.00
Levered Beta 0.90 1.00
Cost of Equity 10.10% 8.50%
Cost of Debt 5.00% 4.00%
Corporate Tax Rate 30.0% 30.0%
After-tax Cost of Debt 3.50% 2.80%
Leverage 0.00% 0.00%
WACC 10.10% 8.50%
Perpetuity Growth Rate 2.26% 2.26%
Real Perpetuity growth rate 0.75% 0.75%
LT Inflation 1.50% 1.50%
WACC-g 7.8% 6.2%
Asia & RoWE.P. T. V.
Risk-Free Rate 2.00% 2.00%
Country Risk Premium 1.50% 0.50%
Market Premium 5.00% 5.00%
Unlevered Beta 1.05 1.05
Levered Beta 1.05 1.05
Cost of Equity 8.83% 7.78%
Cost of Debt 5.00% 4.00%
Corporate Tax Rate 26.3% 26.3%
After-tax Cost of Debt 3.69% 2.95%
Leverage 0.00% 0.00%
WACC 8.83% 7.78%
Perpetuity Growth Rate 2.01% 2.01%
Real Perpetuity growth rate 0.75% 0.75%
LT Inflation 1.25% 1.25%
WACC-g 6.8% 5.8%
Americas E.P. T. V.
Risk-Free Rate 2.00% 2.00%
Country Risk Premium 2.50% 2.00%
Market Premium 5.00% 5.00%
Unlevered Beta 1.05 1.00
Levered Beta 1.05 1.00
Cost of Equity 9.88% 9.00%
Cost of Debt 5.00% 4.00%
Corporate Tax Rate 31.0% 31.0%
After-tax Cost of Debt 3.45% 2.76%
Leverage 0.00% 0.00%
WACC 9.88% 9.00%
Perpetuity Growth Rate 2.26% 2.26%
Real Perpetuity growth rate 0.75% 0.75%
LT Inflation 1.50% 1.50%
DCF Assumptions - Global
Page 9
9
Millennium investment banking 10 September 2013
Sales Estimates
2011 2012 2013E 2014E 2015E 2016E 2017E 2018E 2019E 2020E 2023ECAGR
12-15
CAGR
15-23Zara 8938 10541 11326 12628 14082 15651 17282 18996 20798 22690 28953 10.1% 9.4%Pull & Bear 957 1086 1205 1331 1445 1559 1706 1859 2017 2181 2708 10.0% 8.2%Massimo Dutti 1013 1134 1264 1416 1543 1672 1821 1975 2135 2300 2832 10.8% 7.9%Berska 1316 1485 1641 1859 2045 2252 2488 2732 2986 3248 4091 11.2% 9.1%Stradivarius 871 961 1070 1234 1376 1532 1709 1892 2082 2278 2911 12.7% 9.8%Oysho 313 314 331 363 389 416 452 489 528 568 696 7.4% 7.6%Zara Home 317 350 400 450 490 535 587 641 697 754 940 11.9% 8.5%Uterque 68 74 76 81 87 95 103 114 129 144 194 5.5% 10.6%Total 13793 15946 17312 19362 21456 23712 26148 28699 31371 34165 43325 10.4% 9.2%
Source: Company data and Millennium investment banking
2011 2012 2013E 2014E 2015E 2016E 2017E 2018E 2019E 2020E 2023ECAGR
12-15
CAGR
15-23Zara 8938 10541 11749 13103 14613 16247 18012 19867 21818 23868 30546 11.5% 9.7%
Pull & Bear 957 1086 1168 1263 1367 1472 1608 1749 1885 2025 2477 8.0% 7.7%
Massimo Dutti 1013 1134 1240 1341 1443 1559 1695 1835 1981 2131 2614 8.4% 7.7%
Berska 1316 1485 1659 1833 2007 2203 2426 2657 2897 3145 3943 10.6% 8.8%
Stradivarius 871 961 1094 1228 1361 1509 1676 1847 2017 2185 2685 12.3% 8.9%
Oysho 313 314 318 331 344 367 398 430 462 493 583 3.1% 6.8%
Zara Home 317 350 390 426 462 503 551 600 648 698 836 9.7% 7.7%
Uterque 68 74 79 84 93 101 109 124 139 155 206 7.8% 10.5%
Total 13793 15946 17696 19608 21690 23961 26474 29109 31845 34699 43889 10.8% 9.2%
% 2011 2012 2013E 2014E 2015E 2016E 2017E 2018E 2019E 2020E 2023E
Zara 10.5% 17.9% 7.4% 11.5% 11.5% 11.1% 10.4% 9.9% 9.5% 9.1% 8.2%Pull & Bear 11.7% 13.5% 10.9% 10.5% 8.6% 7.9% 9.5% 9.0% 8.5% 8.1% 7.2%Massimo Dutti 12.9% 11.9% 11.4% 12.1% 8.9% 8.4% 8.9% 8.5% 8.1% 7.8% 6.9%Berska 5.5% 12.8% 10.5% 13.3% 10.0% 10.2% 10.5% 9.8% 9.3% 8.8% 7.7%Stradivarius 11.7% 10.3% 11.4% 15.3% 11.5% 11.4% 11.5% 10.7% 10.0% 9.4% 8.1%Oysho 3.0% 0.3% 5.3% 9.6% 7.2% 7.0% 8.7% 8.3% 7.9% 7.6% 6.8%Zara Home 7.8% 10.4% 14.3% 12.5% 8.9% 9.2% 9.7% 9.2% 8.7% 8.3% 7.3%Uterque 15.3% 8.8% 2.6% 7.1% 7.0% 8.8% 8.4% 11.0% 13.1% 12.0% 9.7%Total 10.1% 15.6% 8.6% 11.8% 10.8% 10.5% 10.3% 9.8% 9.3% 8.9% 7.9%LfL Sales 4% 6% 2% 2% 2% 3% 3% 2% 2% 2% 2% % store sales 80%
Source: Company data and Millennium investment banking
2011 2012 2013E 2014E 2015E 2016E 2017E 2018E 2019E 2020E 2023E
Zara 64.8% 66.1% 65.4% 65.2% 65.6% 66.0% 66.1% 66.2% 66.3% 66.4% 66.8%Pull & Bear 6.9% 6.8% 7.0% 6.9% 6.7% 6.6% 6.5% 6.5% 6.4% 6.4% 6.2%Massimo Dutti 7.3% 7.1% 7.3% 7.3% 7.2% 7.0% 7.0% 6.9% 6.8% 6.7% 6.5%Berska 9.5% 9.3% 9.5% 9.6% 9.5% 9.5% 9.5% 9.5% 9.5% 9.5% 9.4%Stradivarius 6.3% 6.0% 6.2% 6.4% 6.4% 6.5% 6.5% 6.6% 6.6% 6.7% 6.7%Oysho 2.3% 2.0% 1.9% 1.9% 1.8% 1.8% 1.7% 1.7% 1.7% 1.7% 1.6%Zara Home 2.3% 2.2% 2.3% 2.3% 2.3% 2.3% 2.2% 2.2% 2.2% 2.2% 2.2%Uterque 0.5% 0.5% 0.4% 0.4% 0.4% 0.4% 0.4% 0.4% 0.4% 0.4% 0.4%Total 100% 100% 100% 100% 100% 100% 100% 100% 100% 100% 100%
Source: Company data and Millennium investment banking
% 2011 2012 2013E 2014E 2015E 2016E 2017E 2018E 2019E 2020E 2023E
Sales area growth 9.7% 11.4% 8.3% 8.7% 8.6% 7.8% 7.2% 6.7% 6.3% 5.9% 5.0% Sales growth 10.1% 15.6% 8.6% 11.8% 10.8% 10.5% 10.3% 9.8% 9.3% 8.9% 7.9%
Source: Company data and Millennium investment banking
Consolidated Sales
Sales Growth by format %
Sales area growth x sales growth
Sales breakdown by format %
Consolidated Sales – Before
Page 10
10
Millennium investment banking 10 September 2013
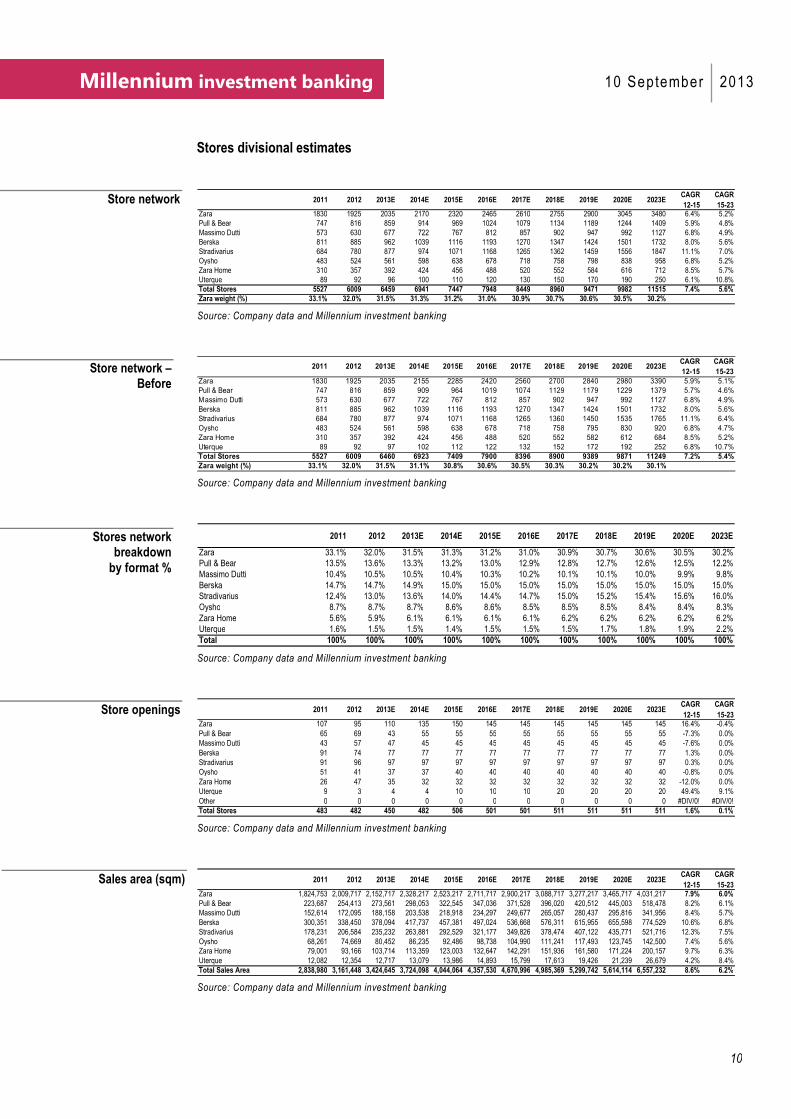
Stores divisional estimates
2011 2012 2013E 2014E 2015E 2016E 2017E 2018E 2019E 2020E 2023ECAGR
12-15
CAGR
15-23Zara 1830 1925 2035 2170 2320 2465 2610 2755 2900 3045 3480 6.4% 5.2%Pull & Bear 747 816 859 914 969 1024 1079 1134 1189 1244 1409 5.9% 4.8%Massimo Dutti 573 630 677 722 767 812 857 902 947 992 1127 6.8% 4.9%Berska 811 885 962 1039 1116 1193 1270 1347 1424 1501 1732 8.0% 5.6%Stradivarius 684 780 877 974 1071 1168 1265 1362 1459 1556 1847 11.1% 7.0%Oysho 483 524 561 598 638 678 718 758 798 838 958 6.8% 5.2%Zara Home 310 357 392 424 456 488 520 552 584 616 712 8.5% 5.7%Uterque 89 92 96 100 110 120 130 150 170 190 250 6.1% 10.8%Total Stores 5527 6009 6459 6941 7447 7948 8449 8960 9471 9982 11515 7.4% 5.6%Zara weight (%) 33.1% 32.0% 31.5% 31.3% 31.2% 31.0% 30.9% 30.7% 30.6% 30.5% 30.2%
Source: Company data and Millennium investment banking
2011 2012 2013E 2014E 2015E 2016E 2017E 2018E 2019E 2020E 2023ECAGR
12-15
CAGR
15-23
Zara 1830 1925 2035 2155 2285 2420 2560 2700 2840 2980 3390 5.9% 5.1%Pull & Bear 747 816 859 909 964 1019 1074 1129 1179 1229 1379 5.7% 4.6%Massimo Dutti 573 630 677 722 767 812 857 902 947 992 1127 6.8% 4.9%Berska 811 885 962 1039 1116 1193 1270 1347 1424 1501 1732 8.0% 5.6%Stradivarius 684 780 877 974 1071 1168 1265 1360 1450 1535 1765 11.1% 6.4%Oysho 483 524 561 598 638 678 718 758 795 830 920 6.8% 4.7%Zara Home 310 357 392 424 456 488 520 552 582 612 684 8.5% 5.2%Uterque 89 92 97 102 112 122 132 152 172 192 252 6.8% 10.7%Total Stores 5527 6009 6460 6923 7409 7900 8396 8900 9389 9871 11249 7.2% 5.4%
Zara weight (%) 33.1% 32.0% 31.5% 31.1% 30.8% 30.6% 30.5% 30.3% 30.2% 30.2% 30.1%
Source: Company data and Millennium investment banking
2011 2012 2013E 2014E 2015E 2016E 2017E 2018E 2019E 2020E 2023E
Zara 33.1% 32.0% 31.5% 31.3% 31.2% 31.0% 30.9% 30.7% 30.6% 30.5% 30.2%Pull & Bear 13.5% 13.6% 13.3% 13.2% 13.0% 12.9% 12.8% 12.7% 12.6% 12.5% 12.2%Massimo Dutti 10.4% 10.5% 10.5% 10.4% 10.3% 10.2% 10.1% 10.1% 10.0% 9.9% 9.8%Berska 14.7% 14.7% 14.9% 15.0% 15.0% 15.0% 15.0% 15.0% 15.0% 15.0% 15.0%Stradivarius 12.4% 13.0% 13.6% 14.0% 14.4% 14.7% 15.0% 15.2% 15.4% 15.6% 16.0%Oysho 8.7% 8.7% 8.7% 8.6% 8.6% 8.5% 8.5% 8.5% 8.4% 8.4% 8.3%Zara Home 5.6% 5.9% 6.1% 6.1% 6.1% 6.1% 6.2% 6.2% 6.2% 6.2% 6.2%Uterque 1.6% 1.5% 1.5% 1.4% 1.5% 1.5% 1.5% 1.7% 1.8% 1.9% 2.2%Total 100% 100% 100% 100% 100% 100% 100% 100% 100% 100% 100%
Source: Company data and Millennium investment banking
2011 2012 2013E 2014E 2015E 2016E 2017E 2018E 2019E 2020E 2023ECAGR
12-15
CAGR
15-23Zara 107 95 110 135 150 145 145 145 145 145 145 16.4% -0.4%Pull & Bear 65 69 43 55 55 55 55 55 55 55 55 -7.3% 0.0%Massimo Dutti 43 57 47 45 45 45 45 45 45 45 45 -7.6% 0.0%Berska 91 74 77 77 77 77 77 77 77 77 77 1.3% 0.0%Stradivarius 91 96 97 97 97 97 97 97 97 97 97 0.3% 0.0%Oysho 51 41 37 37 40 40 40 40 40 40 40 -0.8% 0.0%Zara Home 26 47 35 32 32 32 32 32 32 32 32 -12.0% 0.0%Uterque 9 3 4 4 10 10 10 20 20 20 20 49.4% 9.1%Other 0 0 0 0 0 0 0 0 0 0 0 #DIV/0! #DIV/0!Total Stores 483 482 450 482 506 501 501 511 511 511 511 1.6% 0.1%
Source: Company data and Millennium investment banking
2011 2012 2013E 2014E 2015E 2016E 2017E 2018E 2019E 2020E 2023ECAGR
12-15
CAGR
15-23Zara 1,824,753 2,009,717 2,152,717 2,328,217 2,523,217 2,711,717 2,900,217 3,088,717 3,277,217 3,465,717 4,031,217 7.9% 6.0%Pull & Bear 223,687 254,413 273,561 298,053 322,545 347,036 371,528 396,020 420,512 445,003 518,478 8.2% 6.1%Massimo Dutti 152,614 172,095 188,158 203,538 218,918 234,297 249,677 265,057 280,437 295,816 341,956 8.4% 5.7%Berska 300,351 338,450 378,094 417,737 457,381 497,024 536,668 576,311 615,955 655,598 774,529 10.6% 6.8%Stradivarius 178,231 206,584 235,232 263,881 292,529 321,177 349,826 378,474 407,122 435,771 521,716 12.3% 7.5%Oysho 68,261 74,669 80,452 86,235 92,486 98,738 104,990 111,241 117,493 123,745 142,500 7.4% 5.6%Zara Home 79,001 93,166 103,714 113,359 123,003 132,647 142,291 151,936 161,580 171,224 200,157 9.7% 6.3%Uterque 12,082 12,354 12,717 13,079 13,986 14,893 15,799 17,613 19,426 21,239 26,679 4.2% 8.4%Total Sales Area 2,838,980 3,161,448 3,424,645 3,724,098 4,044,064 4,357,530 4,670,996 4,985,369 5,299,742 5,614,114 6,557,232 8.6% 6.2%
Source: Company data and Millennium investment banking
Store network
Store openings
Sales area (sqm)
Stores network breakdown
by format %
Store network – Before
Page 11
11
Millennium investment banking 10 September 2013
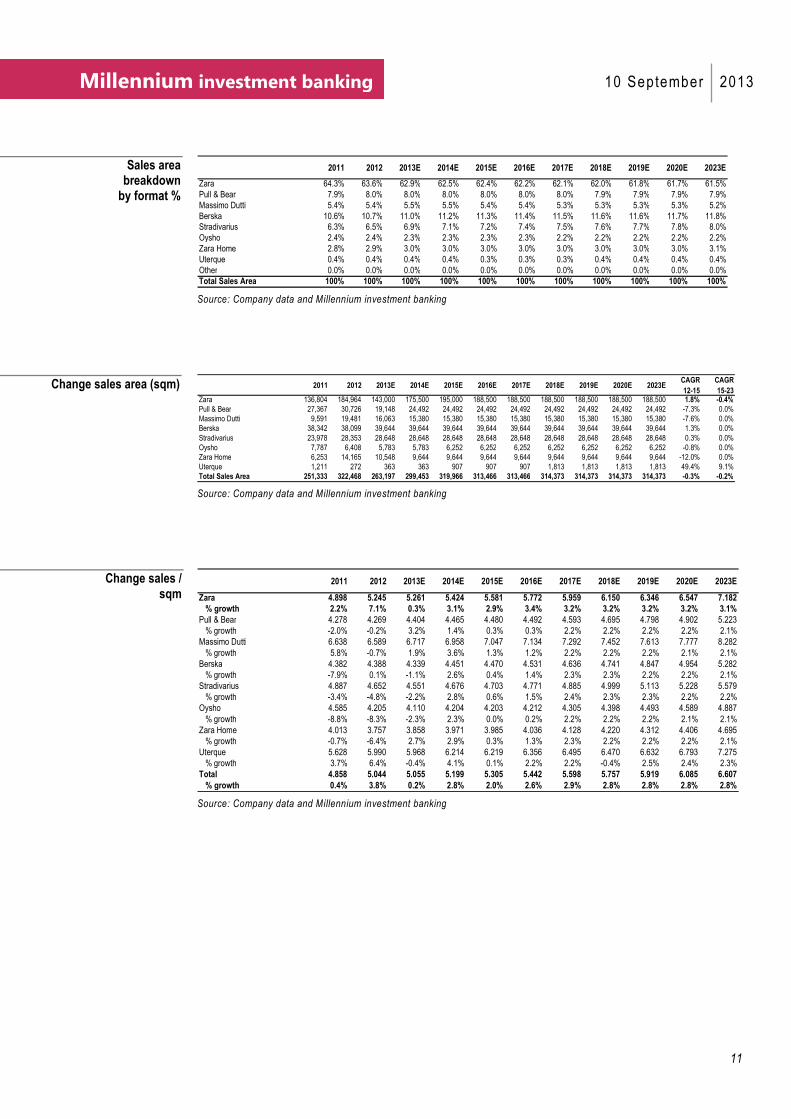
2011 2012 2013E 2014E 2015E 2016E 2017E 2018E 2019E 2020E 2023E
Zara 64.3% 63.6% 62.9% 62.5% 62.4% 62.2% 62.1% 62.0% 61.8% 61.7% 61.5%Pull & Bear 7.9% 8.0% 8.0% 8.0% 8.0% 8.0% 8.0% 7.9% 7.9% 7.9% 7.9%Massimo Dutti 5.4% 5.4% 5.5% 5.5% 5.4% 5.4% 5.3% 5.3% 5.3% 5.3% 5.2%Berska 10.6% 10.7% 11.0% 11.2% 11.3% 11.4% 11.5% 11.6% 11.6% 11.7% 11.8%Stradivarius 6.3% 6.5% 6.9% 7.1% 7.2% 7.4% 7.5% 7.6% 7.7% 7.8% 8.0%Oysho 2.4% 2.4% 2.3% 2.3% 2.3% 2.3% 2.2% 2.2% 2.2% 2.2% 2.2%Zara Home 2.8% 2.9% 3.0% 3.0% 3.0% 3.0% 3.0% 3.0% 3.0% 3.0% 3.1%Uterque 0.4% 0.4% 0.4% 0.4% 0.3% 0.3% 0.3% 0.4% 0.4% 0.4% 0.4%Other 0.0% 0.0% 0.0% 0.0% 0.0% 0.0% 0.0% 0.0% 0.0% 0.0% 0.0%Total Sales Area 100% 100% 100% 100% 100% 100% 100% 100% 100% 100% 100%
Source: Company data and Millennium investment banking
2011 2012 2013E 2014E 2015E 2016E 2017E 2018E 2019E 2020E 2023ECAGR
12-15
CAGR
15-23Zara 136,804 184,964 143,000 175,500 195,000 188,500 188,500 188,500 188,500 188,500 188,500 1.8% -0.4%Pull & Bear 27,367 30,726 19,148 24,492 24,492 24,492 24,492 24,492 24,492 24,492 24,492 -7.3% 0.0%Massimo Dutti 9,591 19,481 16,063 15,380 15,380 15,380 15,380 15,380 15,380 15,380 15,380 -7.6% 0.0%Berska 38,342 38,099 39,644 39,644 39,644 39,644 39,644 39,644 39,644 39,644 39,644 1.3% 0.0%Stradivarius 23,978 28,353 28,648 28,648 28,648 28,648 28,648 28,648 28,648 28,648 28,648 0.3% 0.0%Oysho 7,787 6,408 5,783 5,783 6,252 6,252 6,252 6,252 6,252 6,252 6,252 -0.8% 0.0%Zara Home 6,253 14,165 10,548 9,644 9,644 9,644 9,644 9,644 9,644 9,644 9,644 -12.0% 0.0%Uterque 1,211 272 363 363 907 907 907 1,813 1,813 1,813 1,813 49.4% 9.1%Total Sales Area 251,333 322,468 263,197 299,453 319,966 313,466 313,466 314,373 314,373 314,373 314,373 -0.3% -0.2%
Source: Company data and Millennium investment banking
2011 2012 2013E 2014E 2015E 2016E 2017E 2018E 2019E 2020E 2023E
Zara 4.898 5.245 5.261 5.424 5.581 5.772 5.959 6.150 6.346 6.547 7.182 % growth 2.2% 7.1% 0.3% 3.1% 2.9% 3.4% 3.2% 3.2% 3.2% 3.2% 3.1%Pull & Bear 4.278 4.269 4.404 4.465 4.480 4.492 4.593 4.695 4.798 4.902 5.223 % growth -2.0% -0.2% 3.2% 1.4% 0.3% 0.3% 2.2% 2.2% 2.2% 2.2% 2.1%Massimo Dutti 6.638 6.589 6.717 6.958 7.047 7.134 7.292 7.452 7.613 7.777 8.282 % growth 5.8% -0.7% 1.9% 3.6% 1.3% 1.2% 2.2% 2.2% 2.2% 2.1% 2.1%Berska 4.382 4.388 4.339 4.451 4.470 4.531 4.636 4.741 4.847 4.954 5.282 % growth -7.9% 0.1% -1.1% 2.6% 0.4% 1.4% 2.3% 2.3% 2.2% 2.2% 2.1%Stradivarius 4.887 4.652 4.551 4.676 4.703 4.771 4.885 4.999 5.113 5.228 5.579 % growth -3.4% -4.8% -2.2% 2.8% 0.6% 1.5% 2.4% 2.3% 2.3% 2.2% 2.2%Oysho 4.585 4.205 4.110 4.204 4.203 4.212 4.305 4.398 4.493 4.589 4.887 % growth -8.8% -8.3% -2.3% 2.3% 0.0% 0.2% 2.2% 2.2% 2.2% 2.1% 2.1%Zara Home 4.013 3.757 3.858 3.971 3.985 4.036 4.128 4.220 4.312 4.406 4.695 % growth -0.7% -6.4% 2.7% 2.9% 0.3% 1.3% 2.3% 2.2% 2.2% 2.2% 2.1%Uterque 5.628 5.990 5.968 6.214 6.219 6.356 6.495 6.470 6.632 6.793 7.275 % growth 3.7% 6.4% -0.4% 4.1% 0.1% 2.2% 2.2% -0.4% 2.5% 2.4% 2.3%Total 4.858 5.044 5.055 5.199 5.305 5.442 5.598 5.757 5.919 6.085 6.607 % growth 0.4% 3.8% 0.2% 2.8% 2.0% 2.6% 2.9% 2.8% 2.8% 2.8% 2.8%
Source: Company data and Millennium investment banking
Change sales area (sqm)
Change sales / sqm
Sales area breakdown
by format %
Page 12
12
Millennium investment banking 10 September 2013
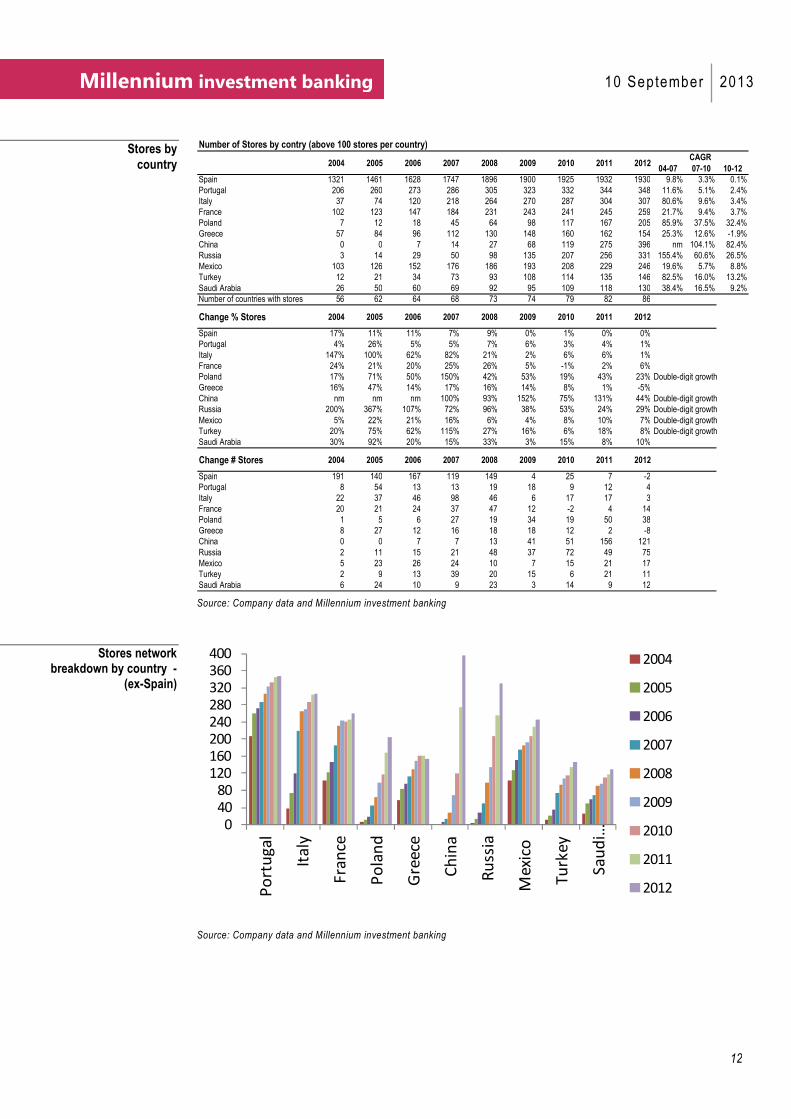
Number of Stores by contry (above 100 stores per country)
2004 2005 2006 2007 2008 2009 2010 2011 2012
Spain 1321 1461 1628 1747 1896 1900 1925 1932 1930 9.8% 3.3% 0.1%Portugal 206 260 273 286 305 323 332 344 348 11.6% 5.1% 2.4%Italy 37 74 120 218 264 270 287 304 307 80.6% 9.6% 3.4%France 102 123 147 184 231 243 241 245 259 21.7% 9.4% 3.7%Poland 7 12 18 45 64 98 117 167 205 85.9% 37.5% 32.4%Greece 57 84 96 112 130 148 160 162 154 25.3% 12.6% -1.9%China 0 0 7 14 27 68 119 275 396 nm 104.1% 82.4%Russia 3 14 29 50 98 135 207 256 331 155.4% 60.6% 26.5%Mexico 103 126 152 176 186 193 208 229 246 19.6% 5.7% 8.8%Turkey 12 21 34 73 93 108 114 135 146 82.5% 16.0% 13.2%Saudi Arabia 26 50 60 69 92 95 109 118 130 38.4% 16.5% 9.2%Number of countries with stores 56 62 64 68 73 74 79 82 86
Change % Stores 2004 2005 2006 2007 2008 2009 2010 2011 2012
Spain 17% 11% 11% 7% 9% 0% 1% 0% 0%Portugal 4% 26% 5% 5% 7% 6% 3% 4% 1%Italy 147% 100% 62% 82% 21% 2% 6% 6% 1%France 24% 21% 20% 25% 26% 5% -1% 2% 6%Poland 17% 71% 50% 150% 42% 53% 19% 43% 23% Double-digit growthGreece 16% 47% 14% 17% 16% 14% 8% 1% -5%China nm nm nm 100% 93% 152% 75% 131% 44% Double-digit growthRussia 200% 367% 107% 72% 96% 38% 53% 24% 29% Double-digit growthMexico 5% 22% 21% 16% 6% 4% 8% 10% 7% Double-digit growthTurkey 20% 75% 62% 115% 27% 16% 6% 18% 8% Double-digit growthSaudi Arabia 30% 92% 20% 15% 33% 3% 15% 8% 10%
Change # Stores 2004 2005 2006 2007 2008 2009 2010 2011 2012
Spain 191 140 167 119 149 4 25 7 -2Portugal 8 54 13 13 19 18 9 12 4Italy 22 37 46 98 46 6 17 17 3France 20 21 24 37 47 12 -2 4 14Poland 1 5 6 27 19 34 19 50 38Greece 8 27 12 16 18 18 12 2 -8China 0 0 7 7 13 41 51 156 121Russia 2 11 15 21 48 37 72 49 75Mexico 5 23 26 24 10 7 15 21 17Turkey 2 9 13 39 20 15 6 21 11Saudi Arabia 6 24 10 9 23 3 14 9 12
CAGR
04-07 07-10 10-12
Source: Company data and Millennium investment banking
0
40
80
120
160
200
240
280
320
360
400
Po
rtu
ga
l
Ita
ly
Fra
nce
Po
lan
d
Gre
ece
Ch
ina
Ru
ssia
Me
xico
Tu
rke
y
Sa
ud
i …
2004
2005
2006
2007
2008
2009
2010
2011
2012
Source: Company data and Millennium investment banking
Stores by country
Stores network breakdown by country -
(ex-Spain)
Page 13
13
Millennium investment banking 10 September 2013
Net sales, Gross margin evolution
-16%
-12%
-8%
-4%
0%
4%
8%
12%
4%
7%
10%
13%
16%
19%
1Q
09
2H
09
3H
09
20
09
1Q
10
2H
10
3H
10
20
10
1Q
11
2H
11
3H
11
20
11
1Q
12
2H
12
3H
12
20
12
1Q
13
€/$ change YoY (rhs) Net Sales (lhs) Net sales local currencies (lhs)
Source: Company data and Millennium investment banking
-1.1%
-0.8%
1.0%
0.9%
1.4%1.0%
0.4%
-0.8%
-0.7%
-2%
-1%
0%
1%
2%
3%
4%
5%
6%
54.0%
56.0%
58.0%
60.0%
62.0%
64.0%
1Q
09
2Q
09
3Q
09
4Q
09
1Q
10
2Q
10
3Q
10
4Q
10
1Q
11
2Q
11
3Q
11
4Q
11
1Q
12
2Q
12
3Q
12
4Q
12
1Q
13
Gross margin (lhs) Var Gross margin YoY (rhs) Linear (Gross margin (lhs))
Source: Company data and Millennium investment banking
-2%
2%
5%
2%
6%
3%
7%
6%
-3.0%
-1.0%
1.0%
3.0%
5.0%
7.0%
55%
56%
57%
58%
59%
60%
61%
1H09 2H09 1H10 2H10 1H11 2H11 1H12 2H12
Gross margin (lhs) LfL Sales (rhs) Var Gross margin YoY (rhs)
Source: Company data and Millennium investment banking
$/€ evolution vs Net Sales
Gross Margin
Gross margin vs LfL Sales
Page 14
14
Millennium investment banking 10 September 2013
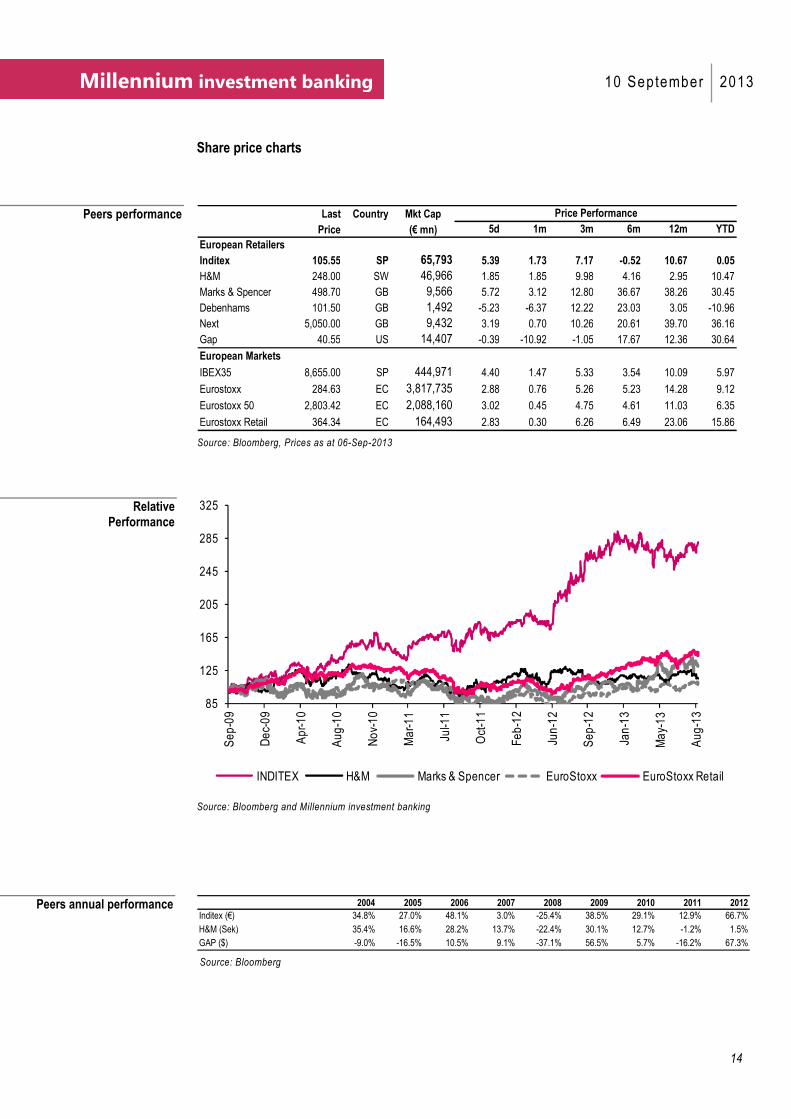
Share price charts
Last Country Mkt Cap Price Performance
Price (€ mn) 5d 1m 3m 6m 12m YTD
European Retailers
Inditex 105.55 SP 65,793 5.39 1.73 7.17 -0.52 10.67 0.05
H&M 248.00 SW 46,966 1.85 1.85 9.98 4.16 2.95 10.47
Marks & Spencer 498.70 GB 9,566 5.72 3.12 12.80 36.67 38.26 30.45
Debenhams 101.50 GB 1,492 -5.23 -6.37 12.22 23.03 3.05 -10.96
Next 5,050.00 GB 9,432 3.19 0.70 10.26 20.61 39.70 36.16
Gap 40.55 US 14,407 -0.39 -10.92 -1.05 17.67 12.36 30.64
European Markets
IBEX35 8,655.00 SP 444,971 4.40 1.47 5.33 3.54 10.09 5.97
Eurostoxx 284.63 EC 3,817,735 2.88 0.76 5.26 5.23 14.28 9.12
Eurostoxx 50 2,803.42 EC 2,088,160 3.02 0.45 4.75 4.61 11.03 6.35
Eurostoxx Retail 364.34 EC 164,493 2.83 0.30 6.26 6.49 23.06 15.86
Source: Bloomberg, Prices as at 06-Sep-2013
85
125
165
205
245
285
325
Sep-09
Dec-09
Apr-10
Aug-10
Nov-10
Mar-11
Jul-11
Oct-11
Feb-12
Jun-12
Sep-12
Jan-13
May-13
Aug-13
INDITEX H&M Marks & Spencer EuroStoxx EuroStoxx Retail
Source: Bloomberg and Millennium investment banking
2004 2005 2006 2007 2008 2009 2010 2011 2012
Inditex (€) 34.8% 27.0% 48.1% 3.0% -25.4% 38.5% 29.1% 12.9% 66.7%
H&M (Sek) 35.4% 16.6% 28.2% 13.7% -22.4% 30.1% 12.7% -1.2% 1.5%
GAP ($) -9.0% -16.5% 10.5% 9.1% -37.1% 56.5% 5.7% -16.2% 67.3%
Source: Bloomberg
Peers performance
Peers annual performance
Relative Performance
Page 15
15
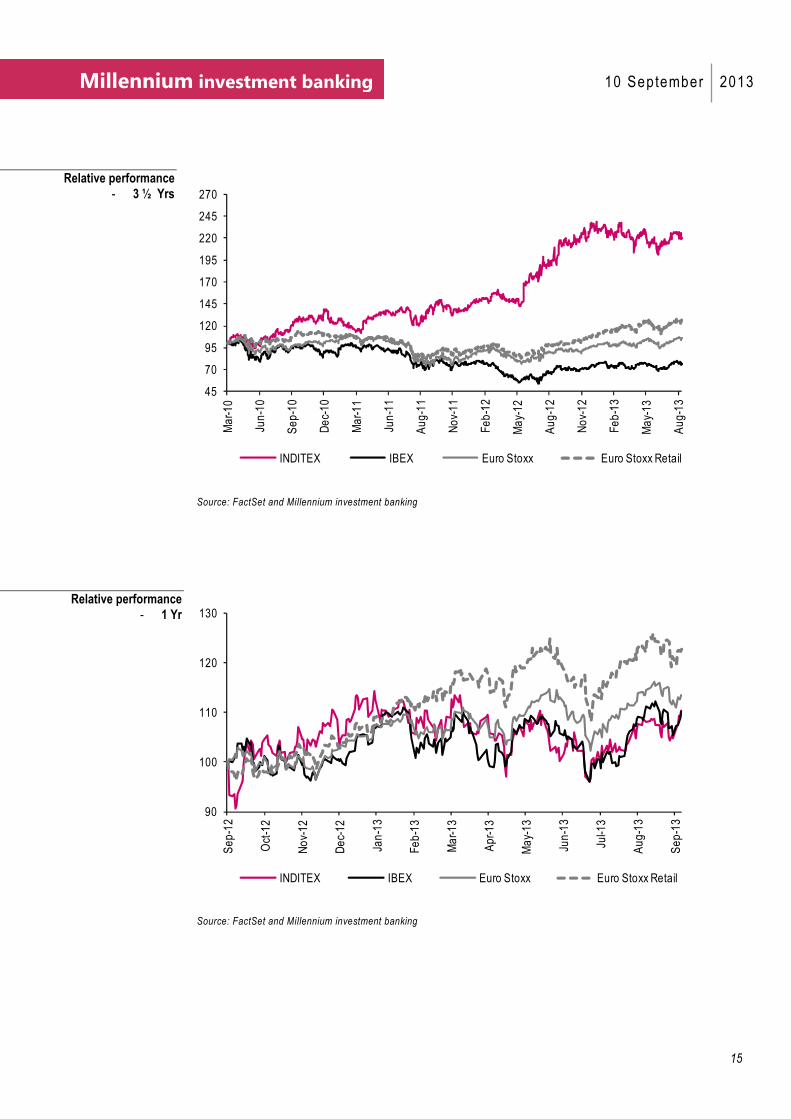
Millennium investment banking 10 September 2013
45
70
95
120
145
170
195
220
245
270
Mar-1
0
Jun-10
Sep-10
Dec-10
Mar-1
1
Jun-11
Aug-11
Nov-11
Feb-12
May-12
Aug-12
Nov-12
Feb-13
May-13
Aug-13
INDITEX IBEX Euro Stoxx Euro Stoxx Retail
Source: FactSet and Millennium investment banking
90
100
110
120
130
Sep-12
Oct-12
Nov-12
Dec-12
Jan-13
Feb-13
Mar-1
3
Apr-13
May-13
Jun-13
Jul-1
3
Aug-13
Sep-13
INDITEX IBEX Euro Stoxx Euro Stoxx Retail
Source: FactSet and Millennium investment banking
Relative performance - 3 ½ Yrs
Relative performance - 1 Yr
Page 16
16
Millennium investment banking 10 September 2013
80
95
110
125
Sep-12
Oct-12
Nov
-12
Dec
-12
Jan-13
Feb-13
Mar-1
3
Apr-13
May-13
Jun-13
Jul-1
3
Aug-13
Sep-13
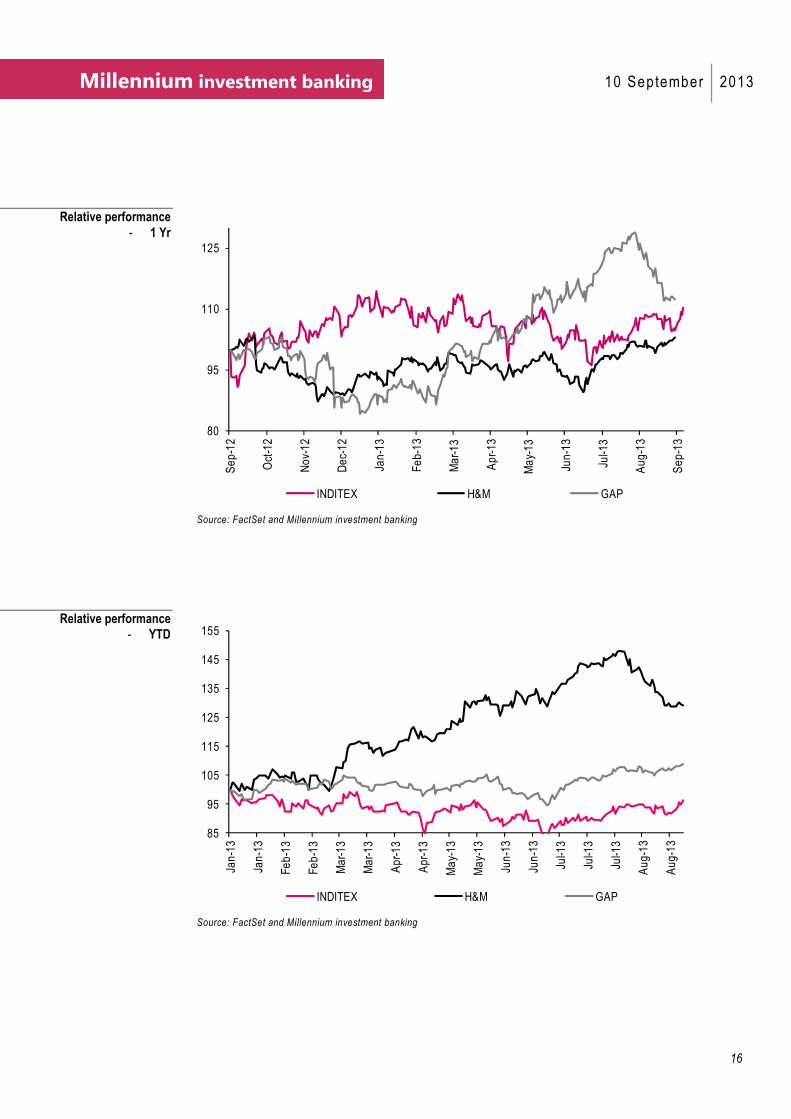
INDITEX H&M GAP
Source: FactSet and Millennium investment banking
85
95
105
115
125
135
145
155
Jan-13
Jan-13
Feb-13
Feb-13
Mar-13
Mar-13
Apr-13
Apr-13
May-13
May-13
Jun-13
Jun-13
Jul-1
3
Jul-1
3
Jul-1
3
Aug-13
Aug-13
INDITEX H&M GAP
Source: FactSet and Millennium investment banking
Relative performance - 1 Yr
Relative performance - YTD
Page 17
17
Millennium investment banking 10 September 2013
Peer multiples
Company Country 2011 2012 2013E 2014E 2011 2012E 2013E 2014E 2011 2012E 2013E 2014EInditex SPAIN 4.4 3.8 3.5 3.1 18.8 15.5 14.3 12.6 -1.1 -1.0 -1.2 -1.2H&M SWEDEN 3.5 3.2 3.1 2.7 16.4 15.4 15.1 13.3 -0.9 -0.7 -0.6 -0.5Douglas GERMANY 0.5 0.5 na na 5.6 7.2 na na 0.3 0.6 na naMarks & Spencer UNITED KINGDOM 0.0 0.0 0.0 0.0 0.1 0.1 0.1 0.1 1.5 2.1 2.0 1.7Debenhams UNITED KINGDOM 0.0 0.0 0.0 0.0 0.1 0.1 0.1 0.1 1.4 1.4 1.4 1.3Next UNITED KINGDOM 0.0 0.0 0.0 0.0 0.1 0.1 0.1 0.1 0.8 0.6 0.6 0.5Sports Direct UNITED KINGDOM 0.0 0.0 0.0 0.0 0.2 0.2 0.1 0.1 0.7 0.6 0.1 -0.1Brown Group UNITED KINGDOM 0.0 0.0 0.0 0.0 0.1 0.1 0.1 0.1 1.6 1.6 1.4 1.2Mulberry UNITED KINGDOM 0.0 0.0 0.0 0.0 0.1 0.2 0.2 0.1 -0.7 -0.7 -0.6 -0.7TJX USA 1.6 1.5 1.4 1.3 12.7 10.4 9.6 8.7 -0.2 -0.3 -0.3 -0.3GAP USA 1.3 1.2 1.1 1.0 9.7 7.7 7.0 6.2 -0.1 -0.1 -0.2 -0.4Coach USA 3.5 3.0 2.7 2.7 9.9 8.4 8.1 8.0 -0.5 -0.5 -0.7 -0.6Limited Brands USA 1.8 1.9 1.8 1.7 10.0 9.8 9.1 8.3 1.3 1.8 1.6 1.4Ross Stores USA 1.7 1.5 1.4 1.3 12.0 10.1 9.4 8.6 -0.4 -0.3 -0.2 -0.2Fast Retailing JAPAN 4.2 3.6 3.0 2.6 25.4 22.4 20.2 17.3 -1.3 -1.7 -1.9 -1.9Esprit HONG KONG 0.6 0.8 0.8 0.8 9.2 18.5 na 16.5 -1.1 -1.2 -28.6 -2.3Sonae 0.7 0.7 0.6 0.6 6.6 6.0 5.7 5.2 3.9 3.1 2.8 2.4 *Sonae Retail 0.7 9.7 4.4 3.3 3.0 2.7 *Sonae SR (non-Food) 0.5 na
EV/Sales EV/EBITDA (x) Net Debt /EBITDA
Source: FactSet and Millennium investment banking
Company 2011 2012E 2013E 2014E 2011 2012E 2013E 2014E 2011 2012E 2013E 2014EInditex 3.1 3.8 4.1 4.6 33.5 27.4 25.1 22.5 1.7% 2.1% 2.4% 2.7%H&M 1.1 1.2 1.2 1.3 25.9 24.3 24.0 21.3 3.8% 3.8% 3.8% 4.0%Douglas 2.2 -2.8 2.2 na 17.9 na 18.3 na 2.8% 0.0% na naMarks & Spencer 0.4 0.4 0.4 0.5 14.3 15.2 14.7 13.2 3.4% 3.4% 3.6% 3.8%Debenhams 0.1 0.1 0.1 0.1 11.2 10.4 10.5 10.2 2.9% 3.2% 3.2% 3.5%Next 3.0 3.6 4.0 4.4 20.5 17.6 15.8 14.5 1.8% 2.1% 2.3% 2.5%Sports Direct 0.2 0.3 0.4 0.5 38.1 27.7 23.0 19.4 0.0% 0.0% 0.0% 1.0%Brown Group 0.3 0.4 0.4 0.4 19.1 19.6 18.6 17.9 2.4% 2.5% 2.6% 2.8%Mulberry 0.5 0.4 0.5 0.5 23.0 31.2 26.9 24.0 0.5% 0.5% 0.7% 0.7%TJX 1.5 1.9 2.2 2.4 27.2 21.2 19.1 16.9 0.7% 0.9% 1.1% 1.2%GAP 1.2 1.8 2.1 2.3 26.1 17.4 14.7 13.3 1.1% 1.2% 1.4% 1.5%Coach 2.3 2.7 2.8 2.9 18.3 15.1 14.3 14.1 1.3% 1.7% 2.2% 2.5%Limited Brands 2.0 2.2 2.4 2.7 21.9 19.5 17.7 15.8 6.7% 8.8% 2.1% 2.2%Ross Stores 2.2 2.7 3.0 3.4 24.3 19.7 17.6 15.7 0.6% 0.8% 1.0% 1.0%Fast Retailing 5.4 6.4 8.3 8.9 64.1 48.6 37.4 34.8 na na na naEsprit 0.0 0.1 0.0 0.0 226.0 20.4 na 74.7 7.3% 3.0% 0.0% 0.8%Sonae 0.1 0.0 0.0 0.1 17.1 53.6 26.7 17.5 3.8% 3.8% 3.8% 3.8%
EPS P/E Div. Yield
Source: FactSet and Millennium investment banking
Company Country Sector 2008 2009 2010 2011 2012 2013E 2014E 2015EInditex SPAIN Apparel/Footwear Retail 21.0% 21.4% 23.7% 23.6% 24.5% 24.3% 24.5% 24.4%H&M SWEDEN Apparel/Footwear Retail 25.2% 24.1% 25.6% 21.5% 21.1% 20.4% 20.7% 21.2%Douglas GERMANY Specialty Stores 8.8% 8.0% 8.6% 8.7% 6.8% na na naMarks & Spencer UNITED KINGDOM Department Stores 13.0% 12.7% 13.3% 13.0% 12.5% 12.7% 13.3% 13.5%Debenhams UNITED KINGDOM Department Stores 11.6% 11.9% 13.6% 12.5% 12.0% 9.5% 9.6% 9.7%Next UNITED KINGDOM Department Stores 18.2% 19.2% 20.1% 20.9% 21.5% 22.2% 22.3% 22.1%Sports Direct UNITED KINGDOM Apparel/Footwear Retail 10.0% 11.3% 12.5% 11.7% 12.1% 11.6% 12.3% naBrown Group UNITED KINGDOM Catalog/Specialty Distribution 16.3% 16.2% 16.3% 15.7% 15.4% 15.7% 15.9% 16.1%Mulberry UNITED KINGDOM Apparel/Footwear 10.1% 12.3% 21.5% 23.7% 19.3% 19.9% 20.0% naTJX UNITED STATES Apparel/Footwear Retail 9.7% 12.0% 12.7% 12.9% 14.0% 14.3% 14.7% 15.0%GAP UNITED STATES Apparel/Footwear Retail 14.6% 16.8% 17.3% 13.4% 15.5% 16.2% 16.7% 17.1%Coach UNITED STATES Apparel/Footwear Retail 40.2% 34.8% 35.4% 35.0% 35.3% 34.1% 33.1% 32.7%Limited Brands UNITED STATES Apparel/Footwear Retail 11.7% 14.1% 17.2% 18.4% 19.7% 20.0% 20.6% 21.1%Ross Stores UNITED STATES Apparel/Footwear Retail 9.8% 12.3% 13.6% 14.2% 15.0% 15.2% 15.7% 16.2%Fast Retailing JAPAN Apparel/Footwear Retail 16.4% 17.4% 18.2% 16.6% 16.2% 14.7% 14.9% 15.1%Esprit HONG KONG Apparel/Footwear Retail 22.8% 18.9% 14.8% 7.1% 4.2% 0.5% 5.1% 8.0%Sonae PORTUGAL Conglomerate 11.3% 11.8% 11.9% 11.3% 11.1% 11.3% 11.5% 11.7% *Sonae SR Portugal Non-Food Retail 5.6% 4.2% 3.5% 0.0% -2.1% -2.0% -1.0% 0.0%
EBITDA Margins
Source: FactSet and Millennium investment banking
Multiples
Multiples
Peer EBITDA Margins
Page 18
18
Millennium investment banking 10 September 2013
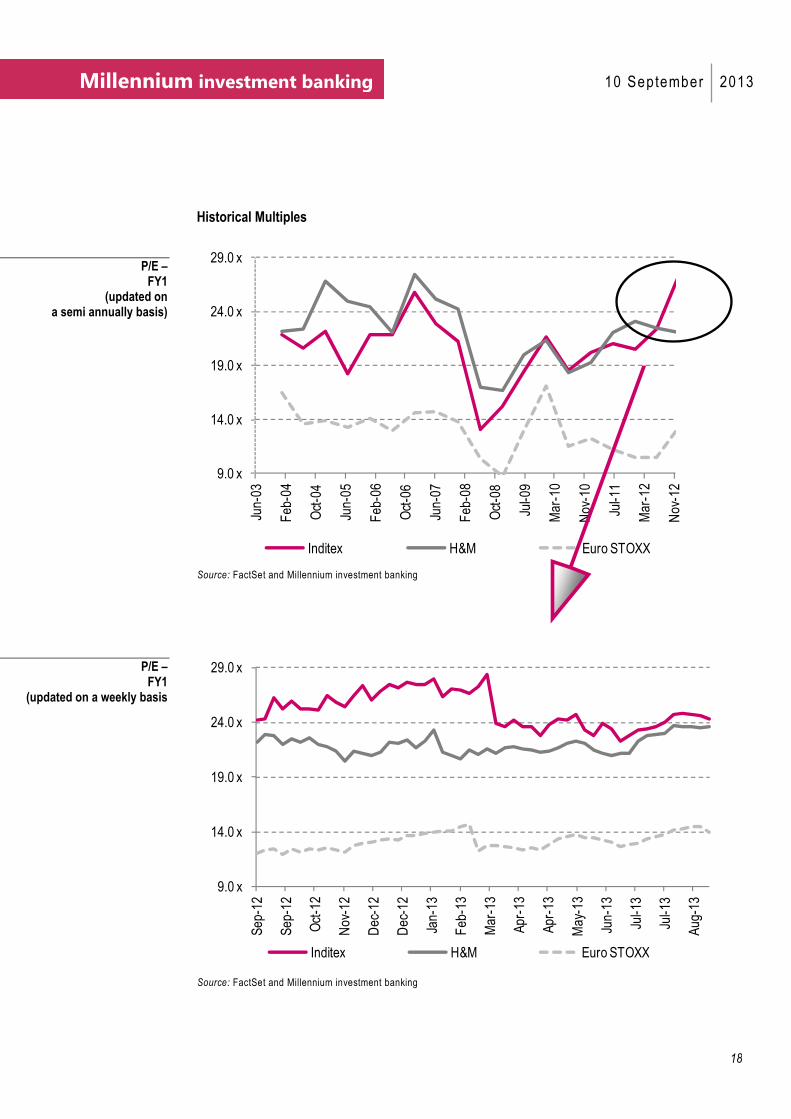
Historical Multiples
9.0 x
14.0 x
19.0 x
24.0 x
29.0 xJun-03
Feb
-04
Oct-04
Jun-05
Feb
-06
Oct-06
Jun-07
Feb
-08
Oct-08
Jul-0
9
Mar-10
Nov-10
Jul-1
1
Mar-12
Nov-12
Inditex H&M Euro STOXX
Source: FactSet and Millennium investment banking
9.0 x
14.0 x
19.0 x
24.0 x
29.0 x
Sep
-12
Sep
-12
Oct-12
Nov-12
Dec-12
Dec-12
Jan-13
Feb
-13
Mar-13
Apr-13
Apr-13
May-13
Jun-13
Jul-1
3
Jul-1
3
Aug
-13
Inditex H&M Euro STOXX
Source: FactSet and Millennium investment banking
P/E – FY1
(updated on a semi annually basis)
P/E – FY1
(updated on a weekly basis
Page 19
19
Millennium investment banking 10 September 2013
10
30
50
70
90
110
13.0 x
18.0 x
23.0 x
28.0 x
Dec-03
Aug
-04
Apr-05
Dec-05
Aug
-06
Apr-07
Dec-07
Aug
-08
Apr-09
Dec-09
Aug
-10
Apr-11
Dec-11
Aug
-12
Apr-13
Inditex P/E (lhs) Stock Px (rhs)
Source: FactSet and Millennium investment banking
64
79
94
109
21.0 x
23.0 x
25.0 x
27.0 x
29.0 x
31.0 x
Sep
-12
Sep
-12
Oct-12
Nov-12
Nov-12
Dec-12
Jan-13
Feb
-13
Feb
-13
Mar-13
Apr-13
Apr-13
May-13
Jun-13
Jun-13
Jul-1
3
Aug
-13
Aug
-13
Inditex P/E (lhs) Stock Px (rhs)
Source: FactSet and Millennium investment banking
P/E – FY1
(updated on a semi annually basis)
P/E – FY1
(updated on a weekly basis)
Page 20
20
Millennium investment banking 10 September 2013
8.0 x
10.0 x
12.0 x
14.0 x
16.0 x
Dec-09 Oct-10 Aug-11 Jun-12 Apr-13
Inditex H&M
Source: FactSet and Millennium investment banking
11.0 x
12.0 x
13.0 x
14.0 x
15.0 x
16.0 x
Sep
-12
Sep
-12
Oct-12
Nov-12
Dec-12
Dec-12
Jan-13
Feb
-13
Mar-13
Apr-13
Apr-13
May-13
Jun-13
Jul-1
3
Jul-1
3
Aug
-13
Inditex H&M
Source: FactSet and Millennium investment banking
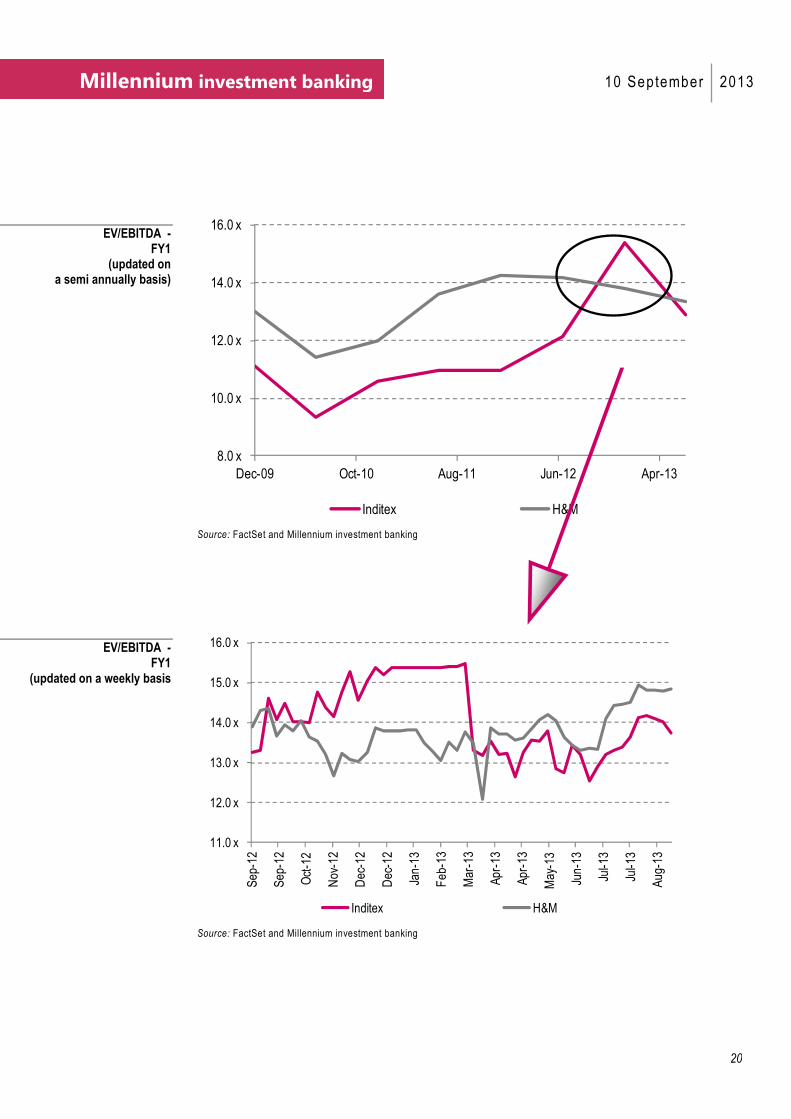
EV/EBITDA - FY1
(updated on a weekly basis
EV/EBITDA - FY1
(updated on a semi annually basis)
Page 21
21
Millennium investment banking 10 September 2013
Consolidated estimates
2011 2012 2013E 2014E 2015E 2016E 2017E 2018E 2019E 2020E 2023ECAGR
12-15
CAGR
15-23Sales 13793 15946 17312 19362 21456 23712 26148 28699 31371 34165 43325 10.4% 9.2%EBITDA 3258 3913 4198 4792 5375 6011 6707 7419 8110 8832 11200 11.2% 9.6%Depreciation & Amortisation -736 -796 -848 -949 -1051 -1162 -1281 -1349 -1255 -1367 -1560 9.7% 5.1%EBIT 2522 3117 3350 3844 4324 4850 5426 6070 6855 7465 9640 11.5% 10.5%Net Financials 37 14 27 21 26 30 34 39 44 48 63 22.2% 11.9%EBT 2559 3131 3377 3865 4349 4880 5461 6109 6899 7514 9704 11.6% 10.6%Taxes -613 -764 -773 -908 -1044 -1171 -1311 -1466 -1656 -1803 -2329 11.0% 10.6%EBM 1946 2367 2604 2956 3306 3708 4150 4643 5243 5710 7375 11.8% 10.6%Minorities 13 6 6 7 8 9 10 12 13 14 19 11.5% 10.5%Net Income 1932 2361 2597 2949 3297 3699 4140 4631 5230 5696 7356 11.8% 10.6%EBITDA margin (%) 23.6% 24.5% 24.3% 24.8% 25.1% 25.4% 25.7% 25.9% 25.9% 25.9% 25.9%EBIT margin (%) 18.3% 19.5% 19.4% 19.9% 20.2% 20.5% 20.8% 21.2% 21.9% 21.9% 22.3%Effective tax rate (%) 24.0% 24.4% 22.9% 23.5% 24.0% 24.0% 24.0% 24.0% 24.0% 24.0% 24.0%Net margin (%) 14.0% 14.8% 15.0% 15.2% 15.4% 15.6% 15.8% 16.1% 16.7% 16.7% 17.0%
Source: Company data and Millennium investment banking
2011 2012 2013E 2014E 2015E 2016E 2017E 2018E 2019E 2020E 2023ECAGR
12-15
CAGR
15-23Sales 13793 15946 17696 19608 21690 23961 26474 29109 31845 34699 43889 10.8% 9.2%EBITDA 3258 3913 4292 4853 5477 6170 6897 7671 8424 9213 11785 11.9% 10.1%Depreciation & Amortisation -736 -796 -805 -873 -944 -1018 -1099 -1150 -1194 -1232 -1339 5.8% 4.5%EBIT 2522 3117 3486 3981 4533 5152 5798 6521 7229 7981 10446 13.3% 11.0%Net Financials 37 14 26 17 20 23 26 30 33 37 49 12.0% 12.0%EBT 2559 3131 3512 3998 4553 5175 5824 6551 7263 8018 10495 13.3% 11.0%Taxes -613 -764 -860 -980 -1116 -1268 -1427 -1605 -1779 -1965 -2571 13.4% 11.0%EBM 1946 2367 2652 3019 3438 3907 4397 4946 5483 6054 7924 13.2% 11.0%Minorities 13 6 7 8 9 10 11 13 14 15 20 13.3% 11.0%Net Income 1932 2361 2645 3011 3429 3897 4386 4933 5469 6039 7904 13.2% 11.0%EBITDA margin (%) 23.6% 24.5% 24.3% 24.8% 25.3% 25.8% 26.1% 26.4% 26.5% 26.6% 26.9%EBIT margin (%) 18.3% 19.5% 19.7% 20.3% 20.9% 21.5% 21.9% 22.4% 22.7% 23.0% 23.8%Effective tax rate (%) 24.0% 24.4% 24.5% 24.5% 24.5% 24.5% 24.5% 24.5% 24.5% 24.5% 24.5%Net margin (%) 14.0% 14.8% 14.9% 15.4% 15.8% 16.3% 16.6% 16.9% 17.2% 17.4% 18.0%
Source: Company data and Millennium investment banking
2011 2012E 2013E 2014E 2015E 2016E 2017E 2018E 2019E 2020E 2022E
Sales 10.1% 15.6% 8.6% 11.8% 10.8% 10.5% 10.3% 9.8% 9.3% 8.9% 7.9%EBITDA 9.8% 20.1% 7.3% 14.1% 12.2% 11.8% 11.6% 10.6% 9.3% 8.9% 7.9%Depreciation & Amortisation 8.9% 8.2% 6.6% 11.8% 10.8% 10.5% 10.3% 5.3% -7.0% 8.9% -2.9%EBIT 10.1% 23.6% 7.5% 14.7% 12.5% 12.2% 11.9% 11.9% 12.9% 8.9% 9.9%Net Financials 18.9% -61.8% 88.8% -21.9% 23.7% 16.6% 14.8% 13.5% 11.3% 10.7% 9.1%EBT 10.2% 22.4% 7.8% 14.4% 12.5% 12.2% 11.9% 11.9% 12.9% 8.9% 9.9%Taxes 5.7% 24.6% 1.2% 17.4% 14.9% 12.2% 11.9% 11.9% 12.9% 8.9% 9.9%EBM 11.8% 21.7% 10.0% 13.6% 11.8% 12.2% 11.9% 11.9% 12.9% 8.9% 9.9%Minorities 44.4% -53.8% 7.5% 14.7% 12.5% 12.2% 11.9% 11.9% 12.9% 8.9% 9.9%Net Income 11.5% 22.2% 10.0% 13.5% 11.8% 12.2% 11.9% 11.9% 12.9% 8.9% 9.9%
Source: Company data and Millennium investment banking
Fixed Assets 5,521.9 6,198.2 6,577.5 7,165.0 7,782.6 8,448.3 9,166.8 9,919.4 10,707.6 11,531.7 14,234.1
Working Capital -1,508.0 -1,552.5 -1,647.6 -1,820.3 -1,960.1 -2,111.3 -2,274.4 -2,446.2 -2,626.1 -2,814.1 -3,430.8
Invested Capital 4,013.9 4,645.7 4,930.0 5,344.7 5,822.6 6,337.0 6,892.4 7,473.2 8,081.5 8,717.6 10,803.3
Net Debt -3,441.6 -3,836.2 -4,683.0 -5,550.1 -6,504.7 -7,597.1 -8,839.8 -10,270.5 -11,934.4 -13,770.0 -20,463.9
Minority Interests 40.8 35.9 43.9 50.2 56.5 63.4 71.0 79.4 89.7 97.7 126.2
Equity 7,414.8 8,445.9 9,569.1 10,844.6 12,270.7 13,870.7 15,661.1 17,664.3 19,926.3 22,390.0 31,141.0
Capital Employed 4,013.9 4,645.7 4,930.0 5,344.7 5,822.6 6,337.0 6,892.4 7,473.2 8,081.5 8,717.6 10,803.3
2018E 2019E 2020E 2023E2016E 2017E€ million 2011 2012 2013E 2014E 2015E
Source: Company data and Millennium investment banking
P & L
Financial Balance Sheet
Growth %
P & L - Before
Page 22
22
Millennium investment banking 10 September 2013
Fixed Assets 5,521.9 6,198.2 6,846.3 7,552.1 8,318.2 9,151.6 10,071.2 11,031.4 12,024.0 13,055.1 16,346.2
Working Capital -1,558.6 -1,813.1 -2,030.7 -2,197.1 -2,357.4 -2,524.1 -2,718.4 -2,911.7 -3,101.2 -3,287.8 -3,814.5
Invested Capital 3,963.3 4,385.1 4,815.5 5,354.9 5,960.8 6,627.5 7,352.9 8,119.7 8,922.8 9,767.4 12,531.7
Net Debt -3,492.3 -4,096.8 -4,854.4 -5,668.1 -6,603.2 -7,687.8 -8,933.0 -10,382.3 -12,035.1 -13,901.8 -20,929.2
Minority Interests 40.8 35.9 40.3 45.9 52.2 59.4 66.8 75.2 83.3 92.0 120.4
Equity 7,414.8 8,445.9 9,629.6 10,977.2 12,511.8 14,256.0 16,219.0 18,426.8 20,874.6 23,577.1 33,340.5
Capital Employed 3,963.3 4,385.1 4,815.5 5,354.9 5,960.8 6,627.5 7,352.9 8,119.7 8,922.8 9,767.4 12,531.7
2018E 2019E 2020E 2023E2016E 2017E€ million 2011 2012 2013E 2014E 2015E
Source: Company data and Millennium investment banking
Cash Flow from Operations* 2,631.2 3,442.6 3,257.6 4,074.1 4,451.6 4,661.1 5,152.0 5,551.6 5,808.0 6,260.0 7,630.0
Cash Flow from Investing -1,348.7 -1,599.0 -1,169.6 -1,289.2 -1,384.7 -1,400.0 -1,434.4 -1,471.6 -1,506.1 -1,540.6 -1,733.0
Cash Flow from Financing -1,144.4 -1,483.5 -2,003.1 -1,787.8 -2,118.7 -2,660.7 -3,023.5 -3,494.7 -4,120.7 -4,584.8 -5,991.4
EBITDA - Operating Capex 1,908.9 2,314.0 3,028.8 3,503.2 3,990.3 4,611.4 5,272.9 5,947.5 6,603.7 7,291.4 9,467.2
2018E 2019E 2020E 2023E2016E 2017E2014E 2015E€ million 2011 2012 2013E
Source: Company data and Millennium investment banking
EBITDA 3,257.7 3,913.0 4,198.4 4,792.4 5,375.0 6,011.4 6,707.3 7,419.1 8,109.8 8,832.0 11,200.2
Capex -1,348.7 -1,599.0 -1,169.6 -1,289.2 -1,384.7 -1,400.0 -1,434.4 -1,471.6 -1,506.1 -1,540.6 -1,733.0
EBITDA-Capex 1,908.9 2,314.0 3,028.8 3,503.2 3,990.3 4,611.4 5,272.9 5,947.5 6,603.7 7,291.4 9,467.2
Dividends 997.3 1,121.6 1,370.8 1,480.3 1,680.9 1,879.4 2,108.5 2,359.6 2,639.9 2,980.9 3,814.9
Payout Ratio 52% 48% 53% 50% 51% 51% 51% 51% 50% 52% 52%
EBITDA-Capex-Dividends 911.6 1,192.4 1,658.0 2,022.8 2,309.4 2,732.0 3,164.4 3,588.0 3,963.8 4,310.5 5,652.3
Financial Costs, Net 37.0 14.1 26.7 20.8 25.8 30.1 34.5 39.1 43.5 48.2 63.4
Net Debt -3,441.6 -3,836.2 -4,683.0 -5,550.1 -6,504.7 -7,597.1 -8,839.8 -10,270.5 -11,934.4 -13,770.0 -20,463.9
Net Debt / EBITDA (x) -1.1 -1.0 -1.1 -1.2 -1.2 -1.3 -1.3 -1.4 -1.5 -1.6 -1.8
Net Debt / Equity (x) -0.5 -0.5 -0.5 -0.5 -0.5 -0.5 -0.6 -0.6 -0.6 -0.6 -0.7
Net Debt / Capital Employed (x) -0.9 -0.8 -0.9 -1.0 -1.1 -1.2 -1.3 -1.4 -1.5 -1.6 -1.9
EBITDA / Financial Costs (x) 88.0 276.9 157.4 230.0 208.6 200.0 194.5 189.6 186.2 183.3 176.7
2018E 2019E 2020E 2023E2016E 2017E€ million 2011 2012 2013E 2014E 2015E
Source: Company data and Millennium investment bank
EBITDA 3,257.7 3,913.0 4,291.6 4,853.2 5,477.0 6,170.4 6,897.0 7,670.7 8,423.6 9,213.2 11,785.0
Capex -1,348.7 -1,599.0 -1,162.5 -1,236.0 -1,315.3 -1,363.5 -1,411.7 -1,438.3 -1,449.0 -1,467.8 -1,492.2
EBITDA-Capex 1,908.9 2,314.0 3,129.0 3,617.3 4,161.7 4,806.9 5,485.3 6,232.4 6,974.6 7,745.5 10,292.7
Dividends 997.3 1,121.6 1,370.8 1,467.9 1,671.1 1,903.1 2,162.9 2,434.4 2,737.9 3,035.5 4,035.0
Payout Ratio 52% 48% 52% 49% 49% 49% 49% 49% 50% 50% 51%
EBITDA-Capex-Dividends 911.6 1,192.4 1,758.2 2,149.3 2,490.6 2,903.8 3,322.3 3,798.0 4,236.7 4,710.0 6,257.7
Financial Costs, Net 37.0 14.1 25.7 17.4 19.8 23.0 26.2 29.7 33.2 37.0 49.1
Net Debt -3,492.3 -4,096.8 -4,854.4 -5,668.1 -6,603.2 -7,687.8 -8,933.0 -10,382.3 -12,035.1 -13,901.8 -20,929.2
Net Debt / EBITDA (x) -1.1 -1.0 -1.1 -1.2 -1.2 -1.2 -1.3 -1.4 -1.4 -1.5 -1.8
Net Debt / Equity (x) -0.5 -0.5 -0.5 -0.5 -0.5 -0.5 -0.6 -0.6 -0.6 -0.6 -0.6
Net Debt / Capital Employed (x) -0.9 -0.9 -1.0 -1.1 -1.1 -1.2 -1.2 -1.3 -1.3 -1.4 -1.7
EBITDA / Financial Costs (x) 88.0 276.9 166.9 278.7 276.2 268.7 263.4 258.4 253.3 249.0 240.3
2018E 2019E 2020E 2023E2016E 2017E€ million 2011 2012 2013E 2014E 2015E
Source: Company data and Millennium investment bank
Cash-flow Statement
Debt Ratio
Financial Balance Sheet – Before
Debt Ratio – Before
Page 23
23
Millennium investment banking 10 September 2013
Quarterly evolution
€ million 1Q12 2Q12 3Q12 4Q12 1Q13 2Q13E 3Q13E 4Q13E1Q12
YoY
2Q12
YoY
3Q12
YoY
4Q12
YoY
1Q13
YoY
2Q13
YoYE
3Q13
YoYE
4Q13
YoYENet sales 3,416 3,823 4,123 4,583 3,593 4,053 4,515 5,151 15% 18% 18% 12% 5% 6.0% 10% 12%
Cost of sales -1,358 -1,568 -1,562 -1,929 -1,453 -1,702 -1,720 -2,136 11% 15% 16% 14% 7% 9% 10% 11%
Gross profit 2,058 2,255 2,561 2,654 2,140 2,351 2,795 3,015 18% 20% 19% 11% 4% 4% 9% 14%
Gross margin 60.2% 59.0% 62.1% 57.9% 59.6% 58.0% 61.9% 58.5% 1.4pp 1.0pp 0.4pp -0.8pp -0.7pp -1.0pp -0.2pp 0.6pp
Operating expenses -1,294 -1,398 -1,405 -1,520 -1,391 -1,502 -1,535 -1,674 14% 14% 17% 12% 7.5% 7.4% 9.3% 10.2%
Cash Costs -2,652 -2,966 -2,967 -3,449 -2,844 -3,204 -3,255 -3,810 12% 15% 17% 13% 7% 8% 10% 10%
EBITDA 764 857 1,156 1,134 749 849 1,260 1,341 27% 30% 21% 9% -2% -1% 9% 18%
EBITDA Margin 22.4% 22.4% 28.0% 24.8% 20.8% 21.0% 27.9% 26.0% 2.1pp 2.1pp 0.7pp -0.7pp -1.5pp -1.5pp -0.1pp 1.3pp
Depreciation -187 -196 -210 -203 -190 -211 -226 -222 10% 11% 10% 3% 2% 7.5% 7.6% 9.2%
EBIT 577 661 946 931 559 638 1,034 1,119 34% 37% 24% 10% -3% -3.4% 9% 20%
Margin 16.9% 17.3% 22.9% 20.3% 15.6% 15.8% 22.9% 21.7% 2.3pp 2.4pp 1.1pp -0.3pp -1.3pp -1.5pp 0.0pp 1.4pp
Net Financials 2 26 -12 -2 12 -6 5 16 -71% nm nm nm nm nm nm nm
EBT 579 687 934 930 571 632 1,039 1,135 32% 39% 22% 8% -1% -8% 11% 22%
Taxes -146 -174 -224 -220 -131 -145 -238 -259 39% 63% 25% -1% -10% -17% 6% 18%
Effective tax rate (%) -25.2% -25.3% -24.0% -23.7% -22.9% -22.9% -22.9% -22.8% -1.2pp -3.7pp -0.7pp 2.2pp 2.3pp 2.4pp 1.0pp 0.9pp
EBM 433 513 710 710 440 487 800 876 30% 32% 21% 11% 2% -5% 13% 23%
Minority Interests 0 2 0 4 2 1 1 2 nm -50% nm -20% #DIV/0! -50% #DIV/0! -39%
Net Income 433 511 710 706 438 486 799 873 30% 30% 20% 10% 1% -4.8% 13% 24%
Source: Company data and Millennium investment banking.
€ million 1Q12 1H12 9M12 2012 1Q13 1H13E 9M13E 2013E1Q12
YoY
1H12
YoY
9M12
YoY
2012
YoY
1Q13
YoY
1H13
YoYE
9M13
YoYE
2013
YoYE
Net sales 3,416 7,239 11,362 15,945 3,593 7,646 12,161 17,312 15% 17% 17% 16% 5% 6% 7% 9%
Zara na 4,835 na 10,541 na 5,048 na 11,326 na 20% na 18% na 4% na 7%
Pull & Bear na 468 na 1,086 na 503 na 1,205 na 14% na 13% na 7% na 11%
Massimo Dutti na 490 na 1,134 na 524 na 1,264 na 7% na 12% na 7% na 11%
Bershka na 666 na 1,485 na 714 na 1,641 na 11% na 13% na 7% na 10%
Stradivarius na 455 na 961 na 506 na 1,070 na 15% na 10% na 11% na 11%
Oysho na 143 na 314 na 146 na 331 na 2% na 0% na 2% na 5%
Zara Home na 150 na 350 na 173 na 400 na 12% na 10% na 15% na 14%
Uterque na 33 na 74 na 34 na 76 na 6% na 9% na 2% na 3%
Cost of sales -1,358 -2,926 -4,488 -6,417 -1,453 -3,155 -4,876 -7,011 11% 13% 14% 14% 7% 8% 9% 9%
Gross profit 2,058 4,313 6,874 9,528 2,140 4,491 7,286 10,301 18% 19% 19% 16% 4% 4% 6% 8%
Gross margin 60.2% 59.6% 60.5% 59.8% 59.6% 58.7% 59.9% 59.5% 1.4pp 1.2pp 0.9pp 0.4pp -0.7pp -0.8pp -0.6pp -0.3pp
Operating expenses -1,294 -2,692 -4,097 -5,617 -1,391 -2,893 -4,428 -6,102 14% 14% 15% 14% 7% 7% 8% 9%
Cash Costs -2,652 -5,618 -8,584 -12,032 -2,844 -6,048 -9,303 -13,114 12% 14% 15% 14% 7% 8% 8% 9%
EBITDA 764 1,621 2,778 3,913 749 1,598 2,858 4,198 27% 29% 25% 20% -2% -1% 3% 7%
EBITDA Margin 22.4% 22.4% 24.4% 24.5% 20.8% 20.9% 23.5% 24.3% nm nm nm nm nm nm nm nm
Depreciation -187 -383 -593 -796 -190 -401 -627 -848 10% 10% 10% 8% 2% 5% 6% 7%
EBIT 577 1,238 2,185 3,117 559 1,197 2,231 3,350 34% 35% 30% 24% -3% -3% 2% 7%
Margin 16.9% 17.1% 19.2% 19.5% 15.6% 15.7% 18.3% 19.4% 2.3pp 2.4pp 1.9pp 1.3pp -1.3pp -1.4pp -0.9pp -0.2pp
Net Financials 2 28 16 14 12 6 11 27 nm nm nm nm nm nm nm nm
EBT 579 1,266 2,201 3,131 571 1,203 2,242 3,377 32% 36% 29% 22% -1% -5% 2% 8%
Taxes -146 -320 -544 -764 -131 -276 -514 -773 39% 51% 39% 25% -10% -14% -5% 1%
Effective tax rate (%) -25.2% -25.3% -24.7% -24.4% -22.9% -22.9% -22.9% -22.9% -1.2pp -2.6pp -1.7pp -0.4pp 2.3pp 2.3pp 1.8pp 1.5pp
EBM 433 946 1,657 2,367 440 927 1,728 2,604 30% 31% 26% 22% 2% -2% 4% 10%
Minority Interests 0 2 2 6 2 3 4 6 nm -60% -75% -54% #DIV/0! 50% nm 7%
Net Income 433 944 1,655 2,361 438 924 1,724 2,597 nm nm nm nm nm nm nm nm
Source: Company data and Millennium investment banking.
1Q11 2Q11 3Q11 4Q11 1Q12 2Q12 3Q12 4Q12 1Q13 2Q13E 3Q13E 4Q13E
Zara 1745 1759 1804 1830 1855 1863 1908 1925 1934 1945 1990 2035Pull & Bear 693 704 728 747 757 770 794 816 817 827 844 859Massimo Dutti 542 545 568 573 584 592 616 630 630 635 655 677Berska 736 751 785 811 827 839 871 885 899 913 947 962Stradivarius 617 633 659 684 699 716 748 780 794 812 844 877Oysho 443 449 468 483 492 498 520 524 529 534 555 561Zara Home 291 293 303 310 315 325 339 357 364 371 380 392Uterque 87 87 87 89 89 90 91 92 91 92 93 96Total Stores 5154 5221 5402 5527 5618 5693 5887 6009 6058 6129 6308 6459
Source: Company data and Millennium investment banking.
Quarterly preview - YoY
Quarterly preview – Breakdown by concepts
– ACC YoY
Store network
Page 24
24
Millennium investment banking 10 September 2013
1Q11 2Q11 3Q11 4Q11 1Q12 2Q12 3Q12 4Q12 1Q13 2Q13E 3Q13E 4Q13E
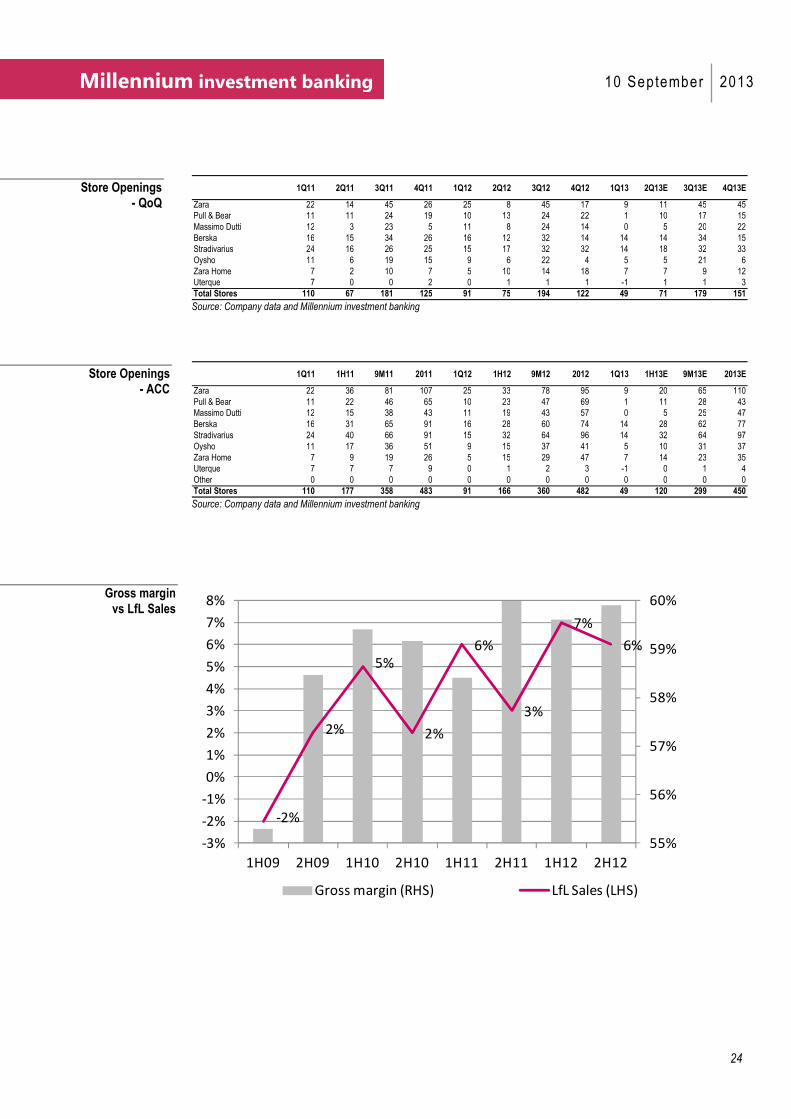
Zara 22 14 45 26 25 8 45 17 9 11 45 45Pull & Bear 11 11 24 19 10 13 24 22 1 10 17 15Massimo Dutti 12 3 23 5 11 8 24 14 0 5 20 22Berska 16 15 34 26 16 12 32 14 14 14 34 15Stradivarius 24 16 26 25 15 17 32 32 14 18 32 33Oysho 11 6 19 15 9 6 22 4 5 5 21 6Zara Home 7 2 10 7 5 10 14 18 7 7 9 12Uterque 7 0 0 2 0 1 1 1 -1 1 1 3Total Stores 110 67 181 125 91 75 194 122 49 71 179 151
Source: Company data and Millennium investment banking
1Q11 1H11 9M11 2011 1Q12 1H12 9M12 2012 1Q13 1H13E 9M13E 2013E
Zara 22 36 81 107 25 33 78 95 9 20 65 110Pull & Bear 11 22 46 65 10 23 47 69 1 11 28 43Massimo Dutti 12 15 38 43 11 19 43 57 0 5 25 47Berska 16 31 65 91 16 28 60 74 14 28 62 77Stradivarius 24 40 66 91 15 32 64 96 14 32 64 97Oysho 11 17 36 51 9 15 37 41 5 10 31 37Zara Home 7 9 19 26 5 15 29 47 7 14 23 35Uterque 7 7 7 9 0 1 2 3 -1 0 1 4Other 0 0 0 0 0 0 0 0 0 0 0 0Total Stores 110 177 358 483 91 166 360 482 49 120 299 450
Source: Company data and Millennium investment banking
-2%
2%
5%
2%
6%
3%
7%
6%
55%
56%
57%
58%
59%
60%
-3%
-2%
-1%
0%
1%
2%
3%
4%
5%
6%
7%
8%
1H09 2H09 1H10 2H10 1H11 2H11 1H12 2H12
Gross margin (RHS) LfL Sales (LHS)
Store Openings - ACC
Store Openings - QoQ
Gross margin vs LfL Sales
Page 25
25
Millennium investment banking 10 September 2013
Income Statements
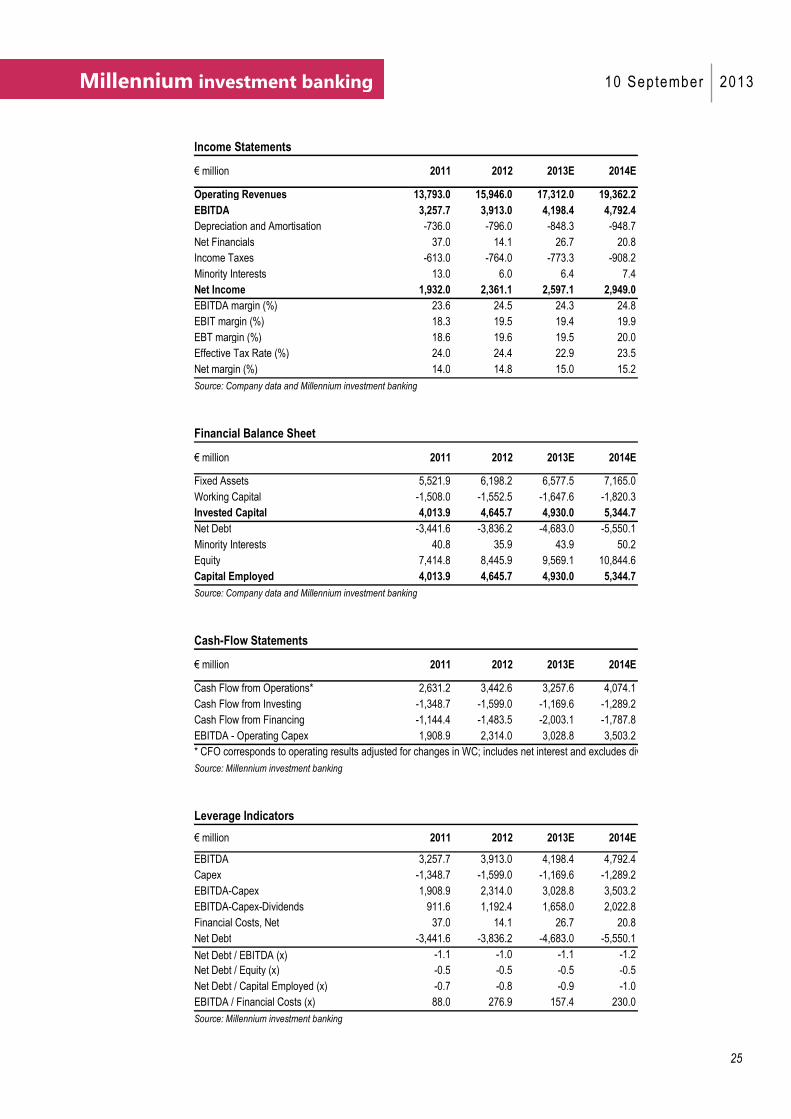
Operating Revenues 13,793.0 15,946.0 17,312.0 19,362.2
EBITDA 3,257.7 3,913.0 4,198.4 4,792.4
Depreciation and Amortisation -736.0 -796.0 -848.3 -948.7
Net Financials 37.0 14.1 26.7 20.8
Income Taxes -613.0 -764.0 -773.3 -908.2
Minority Interests 13.0 6.0 6.4 7.4
Net Income 1,932.0 2,361.1 2,597.1 2,949.0
EBITDA margin (%) 23.6 24.5 24.3 24.8
EBIT margin (%) 18.3 19.5 19.4 19.9
EBT margin (%) 18.6 19.6 19.5 20.0
Effective Tax Rate (%) 24.0 24.4 22.9 23.5
Net margin (%) 14.0 14.8 15.0 15.2
Source: Company data and Millennium investment banking
Financial Balance Sheet
Fixed Assets 5,521.9 6,198.2 6,577.5 7,165.0
Working Capital -1,508.0 -1,552.5 -1,647.6 -1,820.3
Invested Capital 4,013.9 4,645.7 4,930.0 5,344.7
Net Debt -3,441.6 -3,836.2 -4,683.0 -5,550.1
Minority Interests 40.8 35.9 43.9 50.2
Equity 7,414.8 8,445.9 9,569.1 10,844.6
Capital Employed 4,013.9 4,645.7 4,930.0 5,344.7
Source: Company data and Millennium investment banking
Cash-Flow Statements
Cash Flow from Operations* 2,631.2 3,442.6 3,257.6 4,074.1
Cash Flow from Investing -1,348.7 -1,599.0 -1,169.6 -1,289.2
Cash Flow from Financing -1,144.4 -1,483.5 -2,003.1 -1,787.8
EBITDA - Operating Capex 1,908.9 2,314.0 3,028.8 3,503.2
* CFO corresponds to operating results adjusted for changes in WC; includes net interest and excludes div.
Source: Millennium investment banking
Leverage Indicators
EBITDA 3,257.7 3,913.0 4,198.4 4,792.4
Capex -1,348.7 -1,599.0 -1,169.6 -1,289.2
EBITDA-Capex 1,908.9 2,314.0 3,028.8 3,503.2
EBITDA-Capex-Dividends 911.6 1,192.4 1,658.0 2,022.8
Financial Costs, Net 37.0 14.1 26.7 20.8
Net Debt -3,441.6 -3,836.2 -4,683.0 -5,550.1
Net Debt / EBITDA (x) -1.1 -1.0 -1.1 -1.2
Net Debt / Equity (x) -0.5 -0.5 -0.5 -0.5
Net Debt / Capital Employed (x) -0.7 -0.8 -0.9 -1.0
EBITDA / Financial Costs (x) 88.0 276.9 157.4 230.0
Source: Millennium investment banking
2013E 2014E
2013E 2014E
2013E 2014E
2013E 2014E
2012€ million 2011
2012€ million 2011
2012
€ million 2011 2012
€ million 2011
Page 26
26
Millennium investment banking 10 September 2013
Disclosures
� This report has been prepared by Banco Millennium bcp Investimento, S.A., a subsidiary of Millennium bcp, also known
as Millennium investment banking (Mib).
� Mib is regulated by Comissão de Mercado de Valores Mobiliários.
� Recommendations:
� Buy means more than 10% absolute return;
� Neutral means between 0% and +10% absolute return;
� Reduce means between -10% and 0% absolute return;
� Sell means less than -10% absolute return.
� Unless otherwise specified, the time frame for price targets included in this report is current year-end or next year-end.
� Risk is defined by the analyst’s view in a qualitative way.
� Usually we update our models and price targets in between 6 and 18 months.
� Mib prohibits its analysts and members of their households to own any shares of the companies covered by them. §
Millennium group may have business relationships with the companies mentioned in this report.
� Mib, expects to receive or intends to seek compensation s for investment banking services from the companies
mentioned in this report.
� The views expressed above, accurately reflect personal views of the authors. They have not and will not receive any
compensation for providing a specific recommendation or view in this report. There were not any agreements between
the companies covered and the analysts regarding the recommendation.
� Analysts are paid in part based on the profitability of Millennium group, which includes investment bank revenues.
(Unrated)Sell
ReduceNeutral
Buy
92.72
95.12
97.52
99.91
102.31
104.71
107.11
109.50
111.90
Sep
/12
Oct/12
Nov/12
Dec/12
Jan/13
Feb
/13
Mar/13
Apr/13
May/13
Jun/13
Jul/13
Aug
/13
Sep
/13
Oct/13
Inditex
Recommendation Stock Price Price Target
DISCLAIMER
This information is not an offer to sell or a solicitation to enter into any particular deal or contract. It consists of data compiled
by or of opinions or estimates from Banco Millennium bcp Investimento, S.A. and no representation or warranty is made as to
its accuracy or completeness. This information is merely an auxiliary means of analysis to be used by its recipients, who will
be solely responsible for its use, including for any losses or damages that may, directly or indirectly, derive from it. Its
reproduction is not allowed without permission from the Millennium group. The data herein disclosed are merely indicative
and reflect the market conditions prevailing on the date they have been collected. Thus, its accuracy and timing must
absolutely be confirmed before its usage. Any alteration in the market conditions shall imply the introduction of changes in
this report. This information/opinions may be altered without prior notice and may differ or be contrary to opinions expressed
by other business areas of Millennium group as a result of using different assumptions and criteria. The analysis contained
herein is based on numerous assumptions. Different assumptions could result in materially different results.
Page 27
OFFICE LOCATIONS
Millennium investment banking
Av. José Malhoa, Lote 27 - 5
1099-010 Lisboa
Portugal
Telephone +351 21 003 7811
Fax +351 21 003 7819 / 39
Equity Team
Luis Feria - Head of Equities
Equity Research +351 21 003 7820
António Seladas, CFA - Head (Industrials and Small Caps)
Alexandra Delgado, CFA (Telecoms and IT)
João Flores (Media and Retail)
Vanda Mesquita (Banks, Utilities and Oil&Gas)
Ramiro Loureiro (Market Analysis)
Sónia Martins (Market Analysis)
Sónia Primo (Publishing)
Prime Brokerage +351 21 003 7855
Vitor Almeida
Equity Sales/Trading +351 21 003 7850
Paulo Cruz - Head
Gonçalo Lima
Jorge Caldeira
Nuno Sousa
Paulo Santos
Pedro Ferreira Cruz
Pedro Gonçalves
Pedro Lalanda
Equity Derivatives +351 21 003 7890 Maria Cardoso Baptista, CFA - Head
Ana Lagarelhos
Diogo Justino
Marco Barata