Department of Inorganic Chemistry Department of Inorganic ChemistryRoyal Institute of Technology Royal Institute of TechnologyS���� �� Stockholm �Sweden� S���� �� Stockholm �Sweden�
Kastriot SPAHIUSwedish Nuclear Fuel
� Waste Management Co�Box ��S���� �� Stockholm �Sweden�
IX��� Introduction
This chapter describes methods for the estimation of deviations from ideality� e�g�� theactivity coe�cients of reactants and products �usually ions� of chemical reactions in so�lution� usually complex formation� redox and acid�base equilibria� The typical featureof these reactions is that they involve strong interactions between the components ofthe system� where often many di�erent species �complexes� are present simultaneouslyin comparable concentrations� This is a situation that is very different from mixtures ofstrong electrolytes� and these di�erences will be re�ected in the methods used to describethe deviations from ideality�
y This Chapter originates from an internal NEA technical report �TDB���� and from Appendices Bin the published NEA reviews on the thermochemistry of uranium and americium ���GRE�FUG���SIL�BID However� the text has undergone a complete revision and it has been substantiallyexpanded
� Permanent address� Institute of Experimental Mineralogy of the Russian Academy of Sciences�Chernogolovka� Moscow District� � � ��� Russia
Estimations of Medium E�ects on Thermodynamic Data
Compilations of thermodynamic data always contain information referring to stan�dard state conditions� de�ned according to IUPAC �LAF� in Chapter II� Section II����Users of thermodynamic data must therefore recalculate these data to the condi�tions present in the system they are studying� Thermodynamics in combinationwith physico�chemical theories provides the framework for such calculations and wewill brie�y review the theories on which these methods are based� and their relativemerits� We will discuss two types of calculations�
� Those using equilibrium constant data determined in the laboratory� usually inan ionic medium� to determine the corresponding constant at zero ionic strength�the usual standard state in compilations of thermodynamic data�� However� thereis no �standard� ionic medium� or ionic strength� preferred in the experimentaldeterminations of equilibrium constants� Hence� there is a need to recalculate thedata to a common standard state in order to allow a comparison of them� Thestandard state preferred in compilations of thermodynamic data is the in�nite dilutesolution� with pure water as the solvent� The experimental data are usually availableat a few ionic strengths� typically from ��� up to � mol � kg���
� Those using tabulated standard state data to calculate equilibrium constants andproperties of single strong electrolytes and their mixtures over a large ionic strengthrange�
An important aspect of activity coe�cient estimations is related to the possibility ofmeasuring precise thermodynamic data in the laboratory� particularly data for complexformation and other reactions involving ionic species in solution� In order to deduce thestoichiometry and equilibrium constants in such systems� it is always necessary to varythe concentrations of reactants and products over fairly large concentration ranges underconditions where the activity coe�cients of the species are either known� or constant �Only in this way is it possible to use the mass balance equations for the various com�ponents� together with the measurement of one or more free concentrations to obtainthe information desired ��ROS�ROS� ��BEC�NAG�� Activity coe�cients may be esti�mated at very low total concentrations of reactants�products �where they approach unity��However� under these conditions it is not possible to perform the variation in concentra�tions required to establish a proper chemical model�The activity coe�cient of a species i� denoted �i� in an electrolyte mixture composed of
di�erent ionic species depends on the concentrations of all these species and their chemicalcharacteristics �e�g�� size and charge�� on temperature� pressure and solvent properties�If one component of the electrolyte mixture is present in a much larger concentrationthan the others� this component will determine the activity coe�cients of the minorcomponents� which are then called �trace� activity coe�cients�For this reason most experimental studies of solution chemical equilibria are performed
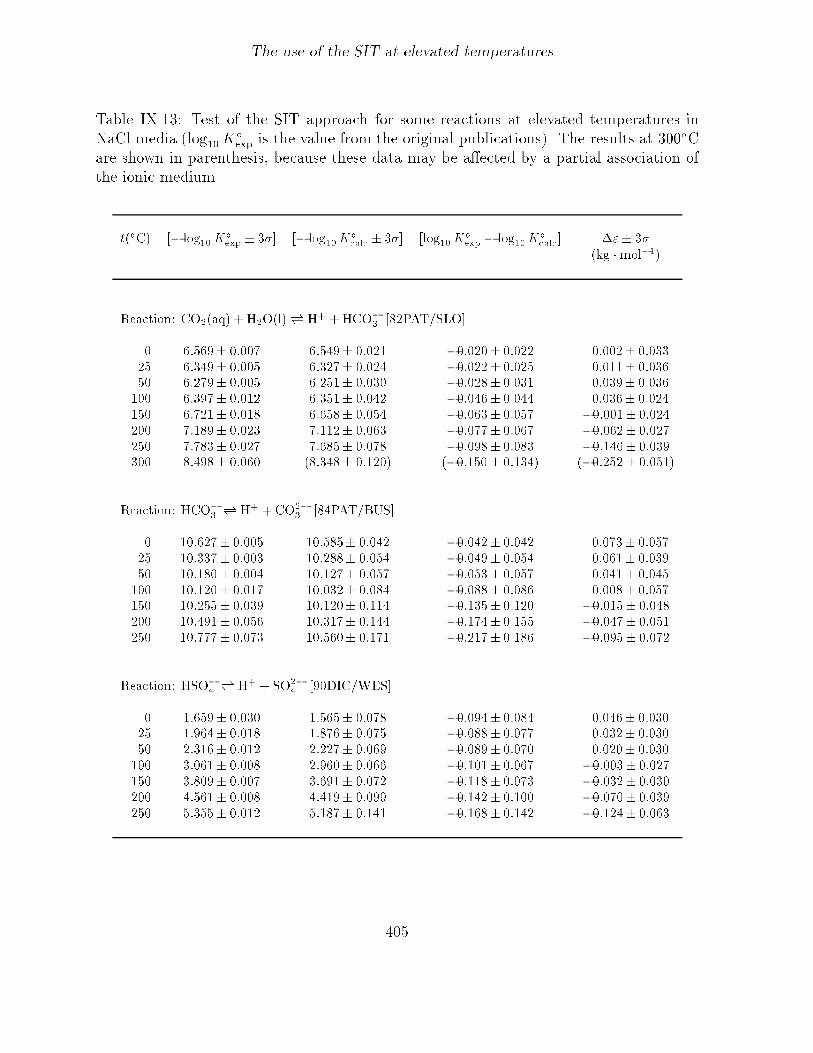
in the presence of an ionic medium� using an inert electrolyte �a strong electrolyte� usu�ally NaClO��� the ions of which do not react with the reactants�products of the reactionsstudied� The concentration of inert electrolyte is usually �� � ��� times larger than the
�
On the estimation of activity coe�cients in electrolyte systems
concentration of the reactants� More details about the use of the ionic medium methodmay be found in �BIE�SIL� ��ROS�ROS� Chapter �� ��BEC�NAG� Chapter �� Byusing an ionic medium one ensures that the �trace� activity coe�cients of reactants andproducts are nearly constant over a large concentration range� and that activities andconcentrations are proportional to one another� It is customary to de�ne the proportion�ality constant as unity in the ionic medium used� This is equivalent to assuming that theactivity coe�cients of reactants and products approach unity when their concentrationsare much lower than the total concentration of the ionic medium� The most importantdi�erence between the ionic medium solvent and the pure water solvent is that the con�centration range where the activity coe�cients are constant is much larger in the formercase�The equilibrium constants deduced from measurements in ionic media are conditional
equilibrium constants� because the activity coe�cients may be de�ned as unity in anyionic medium� In order to compare the magnitude of equilibrium constants obtained indi�erent ionic media it is necessary to have a method for estimating activity coe�cientsof ionic species in mixed electrolyte systems by using one common standard state� The�in�nite dilution� state is the one generally used� This will also be the standard state inthe following discussion�
IX��� On the estimation of activity coe�cients in electrolyte systems
Ionic solutions depart strongly from ideality due to the long�range electrostatic interac�tions� The interaction energy between neutral molecules falls o� as r��� while Coulombinteractions between ions falls o� as r�� �r is the distance between the interacting parti�cles��In most cases it is experimentally straightforward to measure deviations from ideality
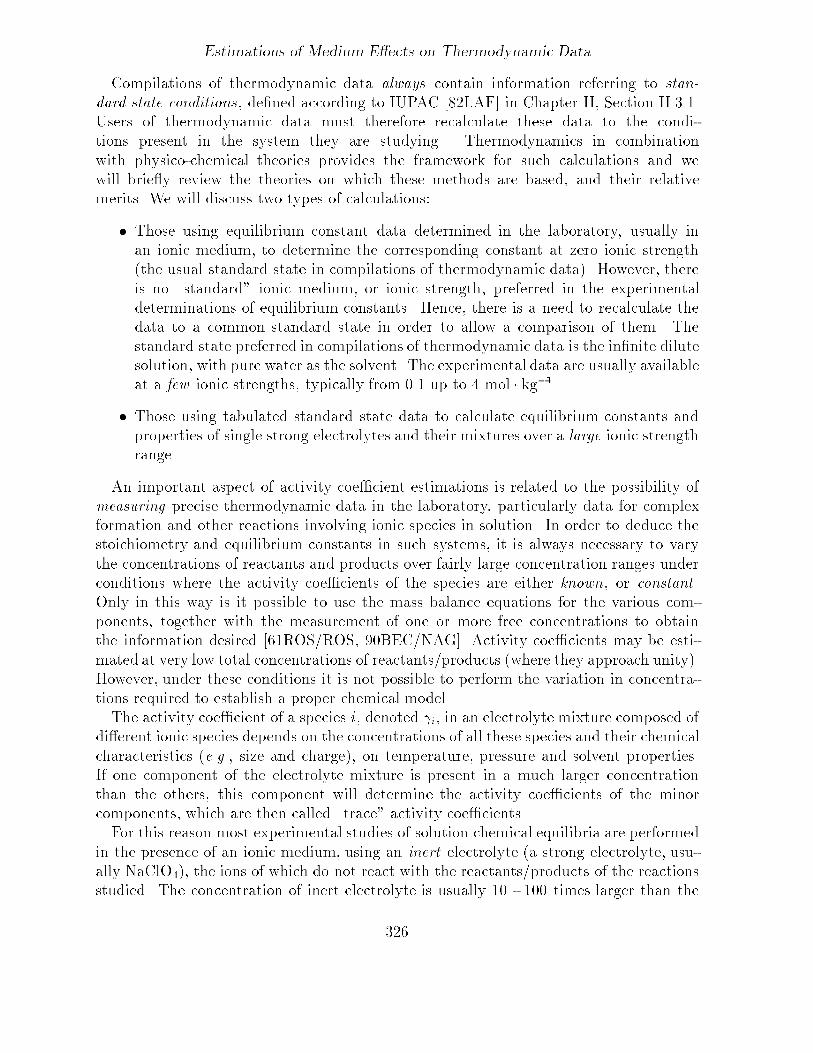
in pure electrolyte and other systems ��HAR�OWE� Chapters � and ��� ��ROB�STO���ATK� Chapter ���� The interpretation of these deviations in terms of theoreticalmodels� is less simple� There exists a number of alternative semi�empirical methodsfor the estimation of activity coe�cients� each with its own advantages and draw�backs�The following �gure shows the variation of the mean�activity coe�cient for some ��� elec�trolytes as a function of the square�root of the ionic strength Im �Im �
��
PmiZ
�i � where
mi and Zi stand for molality and charge of species i��
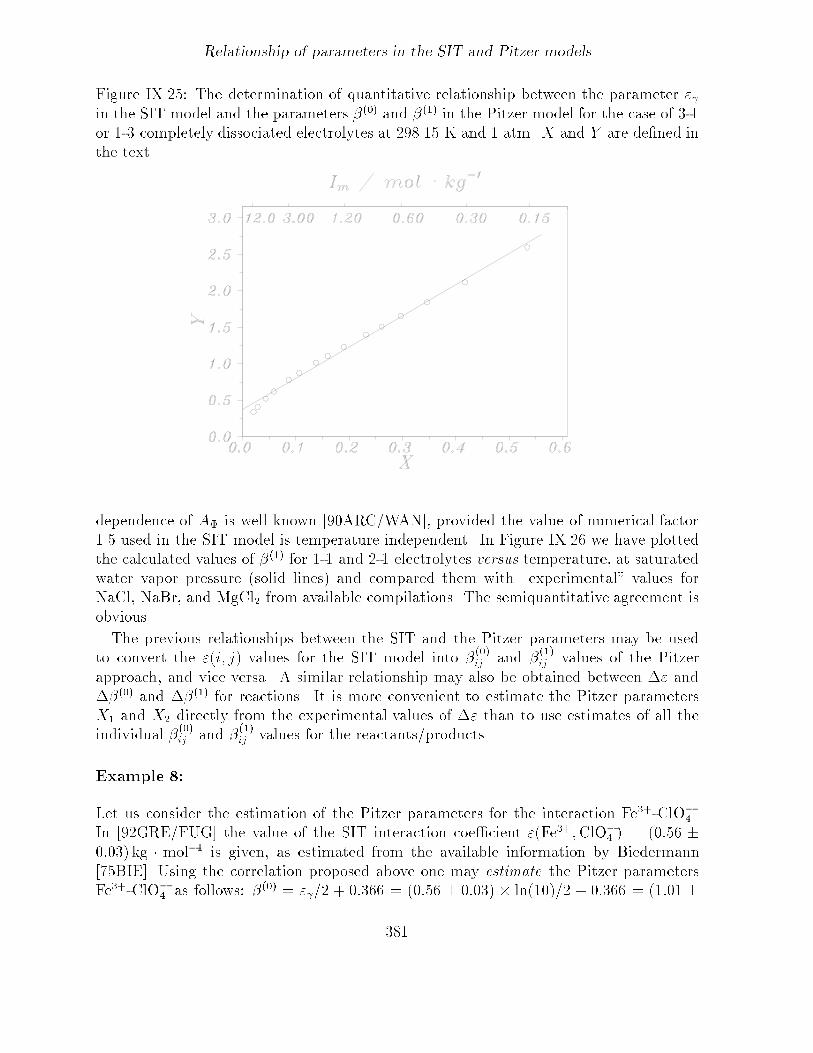
There are four main observations to be made�
� There are large changes in the mean activity coe�cients with concentration�� The slopes of log�� �� vs�
pIm are identical within the experimental error at very
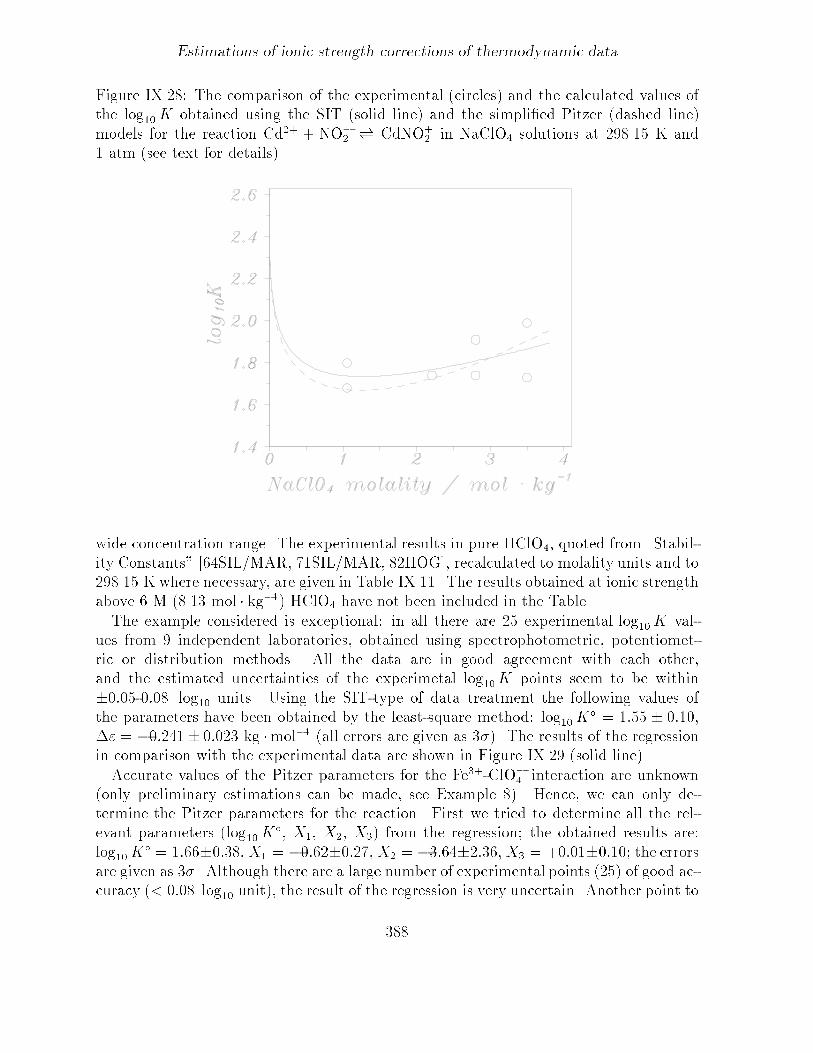
low ionic strengths for a particular valence type� Any theory must be able to explainthis limiting behavior�
� The variations are not the same for di�erent electrolytes� Any theory must be ableto describe their individual characteristics�
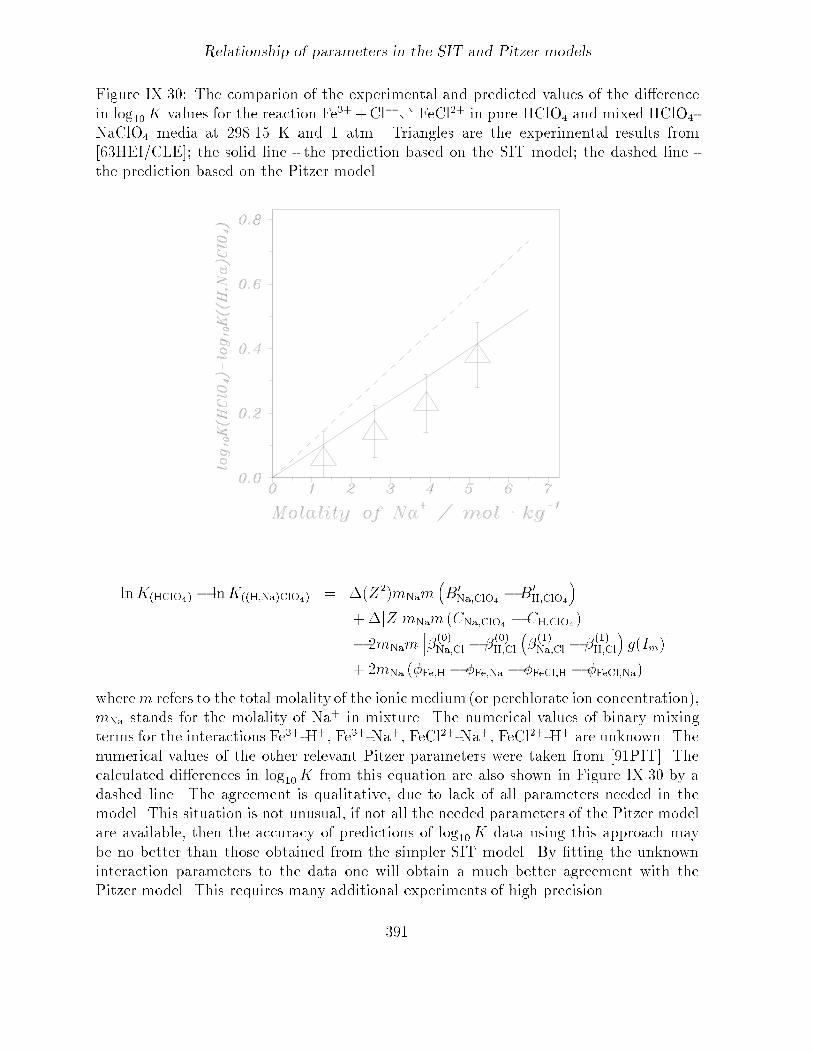
�
Estimations of Medium E�ects on Thermodynamic Data
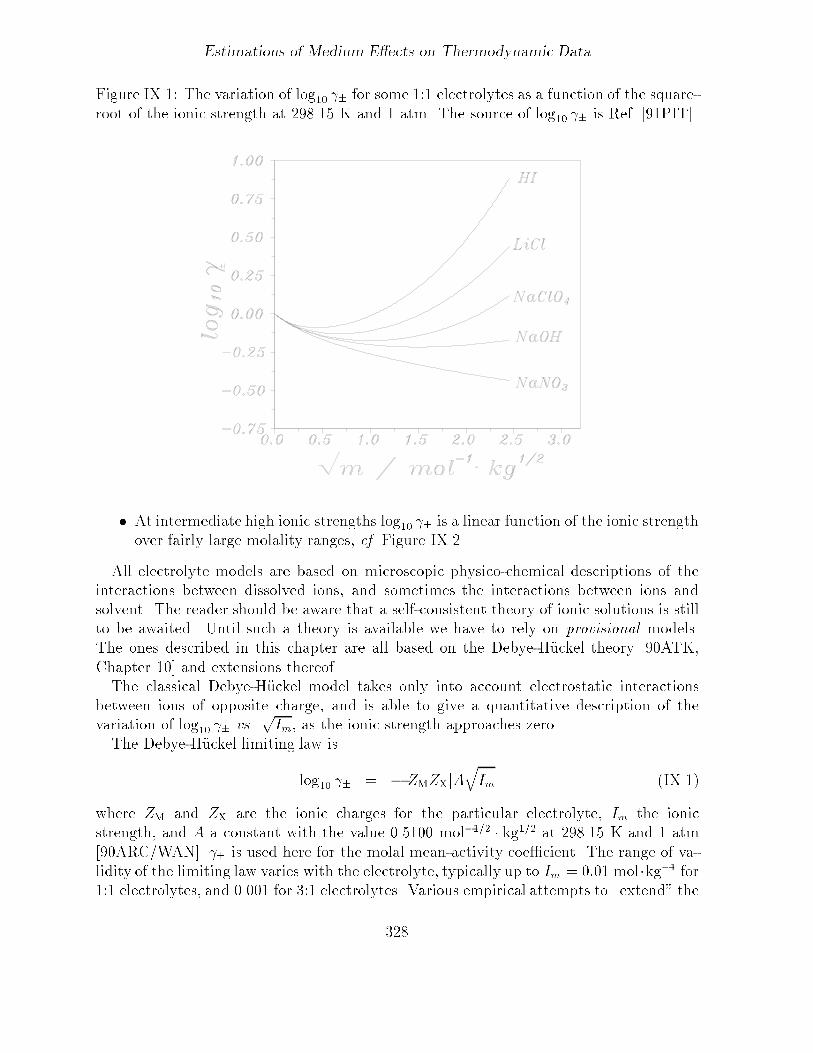
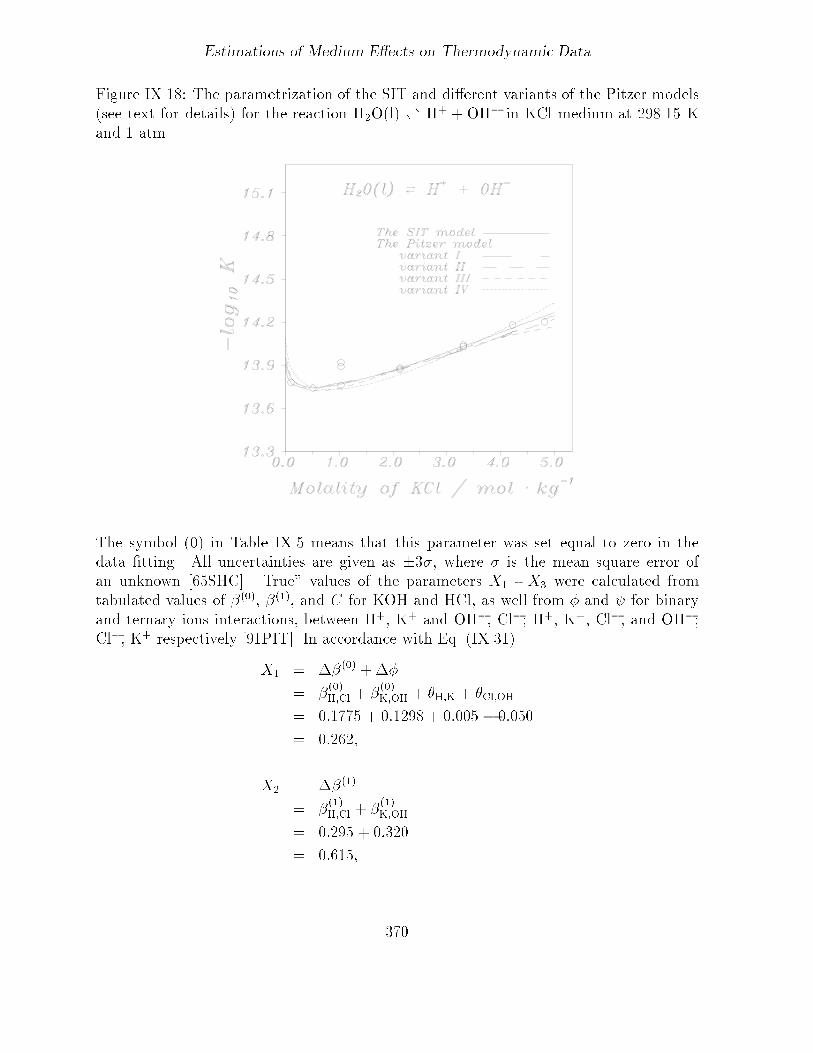
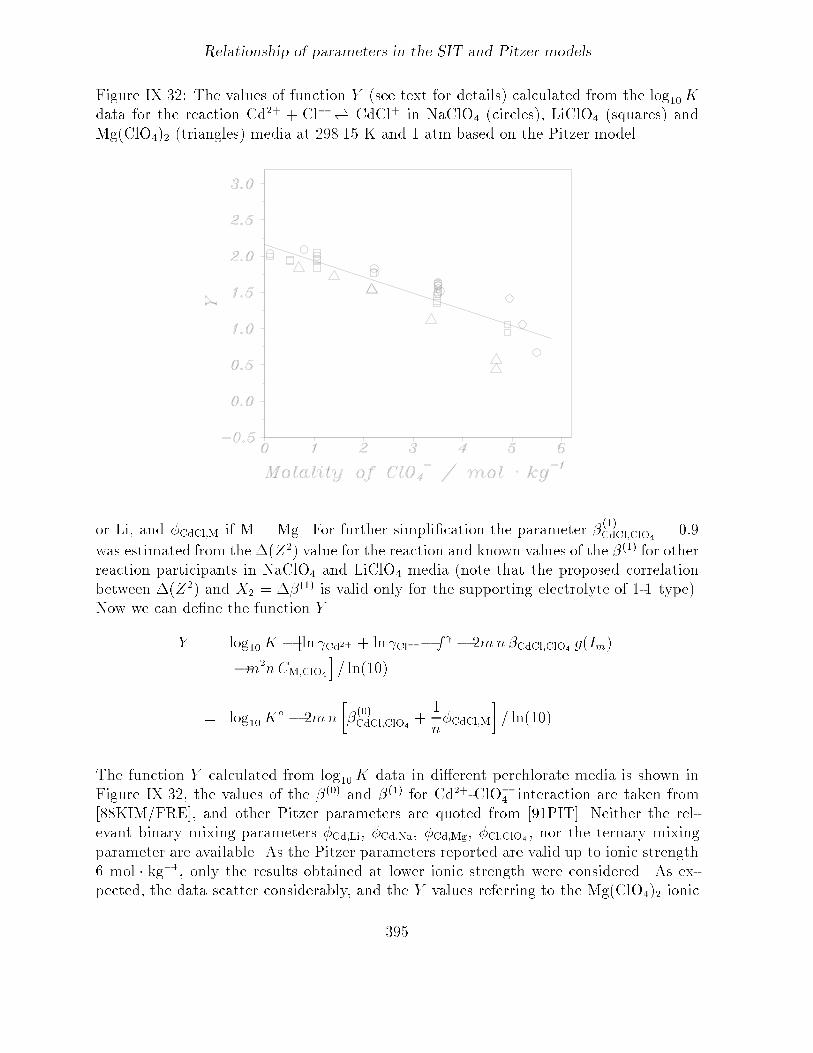
Figure IX��� The variation of log�� �� for some ��� electrolytes as a function of the square�root of the ionic strength at ����� K and � atm� The source of log�� �� is Ref� ��PIT��
� At intermediate high ionic strengths log�� �� is a linear function of the ionic strengthover fairly large molality ranges� cf� Figure IX��
All electrolyte models are based on microscopic physico�chemical descriptions of theinteractions between dissolved ions� and sometimes the interactions between ions andsolvent� The reader should be aware that a self�consistent theory of ionic solutions is stillto be awaited� Until such a theory is available we have to rely on provisional models�The ones described in this chapter are all based on the Debye�H�uckel theory ��ATK�Chapter ��� and extensions thereof�The classical Debye�H�uckel model takes only into account electrostatic interactions
between ions of opposite charge� and is able to give a quantitative description of thevariation of log�� �� vs�
pIm� as the ionic strength approaches zero�
The Debye�H�uckel limiting law is
log�� �� � �jZMZXjAqIm �IX���
where ZM and ZX are the ionic charges for the particular electrolyte� Im the ionicstrength� and A a constant with the value ������ mol���� � kg��� at ����� K and � atm ��ARC�WAN�� �� is used here for the molal mean�activity coe�cient� The range of va�lidity of the limiting law varies with the electrolyte� typically up to Im � ���� mol�kg�� for��� electrolytes� and ����� for �� electrolytes� Various empirical attempts to �extend� the
�
On the estimation of activity coe�cients in electrolyte systems
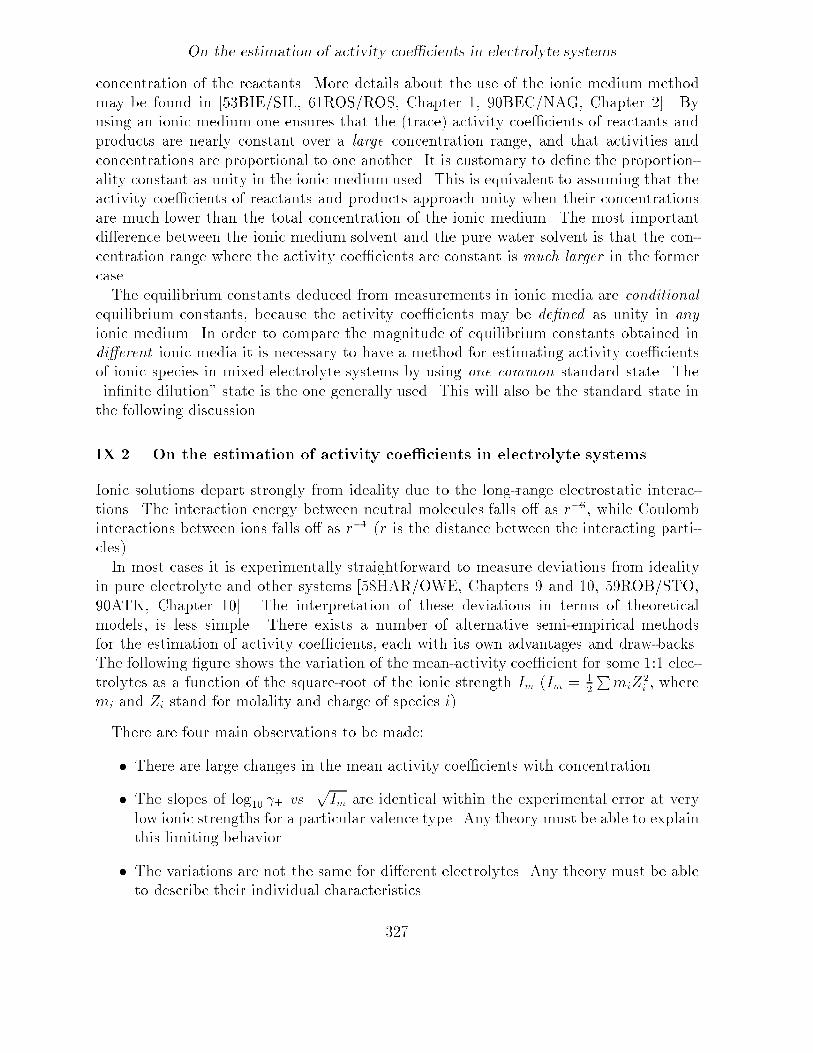
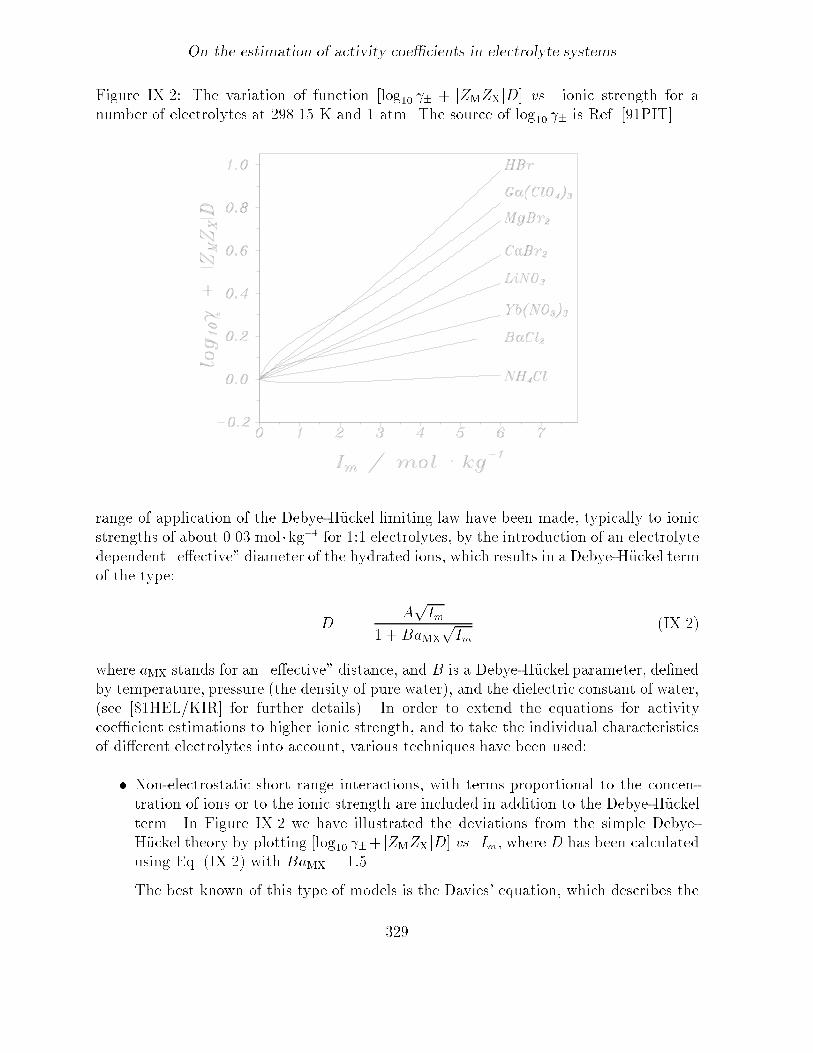
Figure IX�� The variation of function log�� �� � jZMZXjD� vs� ionic strength for anumber of electrolytes at ����� K and � atm� The source of log�� �� is Ref� ��PIT��
range of application of the Debye�H�uckel limiting law have been made� typically to ionicstrengths of about ��� mol �kg�� for ��� electrolytes� by the introduction of an electrolytedependent �e�ective� diameter of the hydrated ions� which results in a Debye�H�uckel termof the type�
D �ApIm
� �BaMX
pIm
�IX��
where aMX stands for an �e�ective� distance� and B is a Debye�H�uckel parameter� de�nedby temperature� pressure �the density of pure water�� and the dielectric constant of water��see ��HEL�KIR� for further details�� In order to extend the equations for activitycoe�cient estimations to higher ionic strength� and to take the individual characteristicsof di�erent electrolytes into account� various techniques have been used�
� Non�electrostatic short range interactions� with terms proportional to the concen�tration of ions or to the ionic strength are included in addition to the Debye�H�uckelterm� In Figure IX� we have illustrated the deviations from the simple Debye�H�uckel theory by plotting log�� ��� jZMZXjD� vs� Im� where D has been calculatedusing Eq� �IX�� with BaMX � ����
The best known of this type of models is the Davies� equation� which describes the
�
Estimations of Medium E�ects on Thermodynamic Data
activity coe�cient of an ion i of charge Zi at ����� K with the expression�
log�� �i � �������Z�i
� pIm
� �pIm
� ��Im�
�IX��
Davies� equation has a formal similarity to the speci�c ion interaction equationsdescribed in the following text� but has no theoretical foundation� It is often foundto work fairly well up to ionic strengths of ��� mol�kg��� Davies� equation takes onlythe charge of the ions into account� not their individual characteristics� In orderto account for these the concept of ionic pairing is introduced� where deviationsbetween measured values of mean�activity coe�cients and those calculated usingEq� �IX�� are assumed to be due to complex formation reactions� e�g�� of the type�
Na� � CO���
�� NaCO��
which are described by equilibrium constants�
Ion association models use the same extended Debye�H�uckel expression to describethe electrostatic interactions between all electrolytes� while the electrolyte spe�ci�c characteristics are described using ion�pair formation between ions of oppositecharge� The equations used vary in complexity from Davies� equation� to the equa�tions developed by Helgeson et al� ��HEL�KIR�� Davies� equation is used in somecodes for the calculation of thermodynamic properties in geochemical systems� butits use at moderate� or high ionic strengths for the calculation of activity coe�cientsof species in trace concentrations is not recommended ��HAR�MOL��
� The individual characteristics of electrolytes may also be described using speci�c ioninteraction models� These semiempirical models contain a number of parameterswhich have a theoretical basis� but must be determined from the experimental data�The precision of the description e�g�� of mean�activity coe�cient data� increaseswith the number of model parameters� These models often describe the activitycoe�cients and their temperature and pressure derivatives fairly well� especially inbinary systems �vide infra Section IX��� p�����
Speci�c ion interaction models also use a Debye�H�uckel term for the descriptionof long range electrostatic forces and a virial series expansion in powers of themolality of the electrolyte�s� to model short�range interactions ��PIT�� with speci�cinteraction terms for each type of pair� or triple interaction�
In the following sections we will outline the basic features of the most important spe�ci�c ion interaction models� always with the emphasis on their use for the modellingof complex geochemical systems at moderate temperatures and pressures� Thesemodels allow the user to�
� extend the equations describing the activity coe�cient variations in simpleelectrolyte systems to more complex systems with many components�
�
The Br�nsted�Guggenheim�Scatchard model �SIT�
� use �single�ion� activity coe�cients� provided that comparisons with experi�mental data are always made on electroneutral combinations of ions�
This chapter is intended to provide a rationale for the selection and use of models for theestimate of the ionic medium�ionic strength dependence of thermodynamic quantities in�multi�electrolytemedia� All such methods have a common theoretical basis in the Debye�H�uckel theory� which is then extended to include various non�electrostatic interactions�These take the form of phenomenological parameters which have to be determined fromexperimental data� The various models di�er mainly in the number of parameters theycontain� and this will in�uence their predictive capacity� We will concentrate on the Pitzerand the Br�nsted�Guggenheim�Scatchard �SIT� models� The main part of the discussionrefers to chemical equilibria in ionic medium systems� where the reactants�products arepresent in low concentration� compared to that of the medium�
The Pitzer method has mainly been applied to strong electrolyte systems� both sin�gle and mixtures at high concentrations� while the SIT model has been used by solutioncoordination chemists for the description of the ionic medium�ionic strength dependenceof concentration equilibrium constants� There is some overlap� but fairly small� betweenthese two areas� In order to use all solution chemical information in an e�cient way� itis necessary to have a common method for estimating deviations from ideality� Such amethod should be based on the most developed theoretical framework� i�e�� the Pitzermodel� However� when treating equilibrium constant data in this way� it is often nec�essary to make a number of approximations� or use procedures for estimating unknowninteraction coe�cients�
By using a number of examples we will demonstrate the characteristics of the models�and how their predictive capacity is in�uenced by the model parameters and their uncer�tainty� We will also describe methods to transform interaction coe�cients between thetwo model structures� and to estimate unknown parameters�
IX��� The Br�nsted�Guggenheim�Scatchard model �SIT y
The Debye�H�uckel term� which is the dominant term in the expression for the activitycoe�cients in dilute solutions� accounts for electrostatic� long�range interactions� Athigher concentrations short�range� non�electrostatic interactions have to be taken intoaccount as well� This is usually done by adding terms to the Debye�H�uckel expression asoutlined by Br�nsted BRO� BRO� and elaborated by Guggenheim �GUG� ��GUG�and Scatchard �SCA�� This approach was successfully used by di�erent groups of solutioncoordination chemists� mainly for the description of the concentration dependence ofcomplex formation equilibria� including the determination of equilibrium constants for
y Note by the Editors� The abbreviation �SIT� stands for Speci�c Ion Interaction Theory Althoughthe name is misleading� the use of this abbreviation is continued because of its wide use in theliterature �it apparently originates fromRef ���BIE�BRU� see also Refs ���RIG�ROB� ��CAP�VIT���CHO�DU� � ERT�MOH� � FAN�KIM� ��CAP�VIT� ��NEC�FAN� etc��
�
Estimations of Medium E�ects on Thermodynamic Data
reactions at in�nite dilution ��BIE� ��CIA� �GRE�FUG�� The two basic assumptionsin the Br�nsted�Guggenheim�Scatchard model are described below�
Assumption �
The activity coe�cient �i of an ion of charge Zi in a solution of ionic strength is equal to�
ln �i � � Z�iA�
pIm
� � ���pIm
�Xk
���i� k�mk �IX���
or
log�� �i � � Z�iApIm
� � ���pIm
�Xk
��i� k�mk
� �Z�iD �
Xk
��i� k�mk �IX���
where D is a particular form of Debye�H�uckel term used in the SIT model� A� and A arethe limiting Debye�H�uckel law slopes for the natural and decadic logarithm of the activitycoe�cient �A� � ln����A�� and ��i� k� �or ���i� k� � ln������i� k�� is an aqueous speciesinteraction coe�cient� which describes the speci�c short�range interactions between aque�ous species i and k� Values of ��i� k� are given in Tables IX�� and IX� �p��� and FiguresIX�� to IX���In the simplest approximation the ion interaction coe�cients are considered to be con�
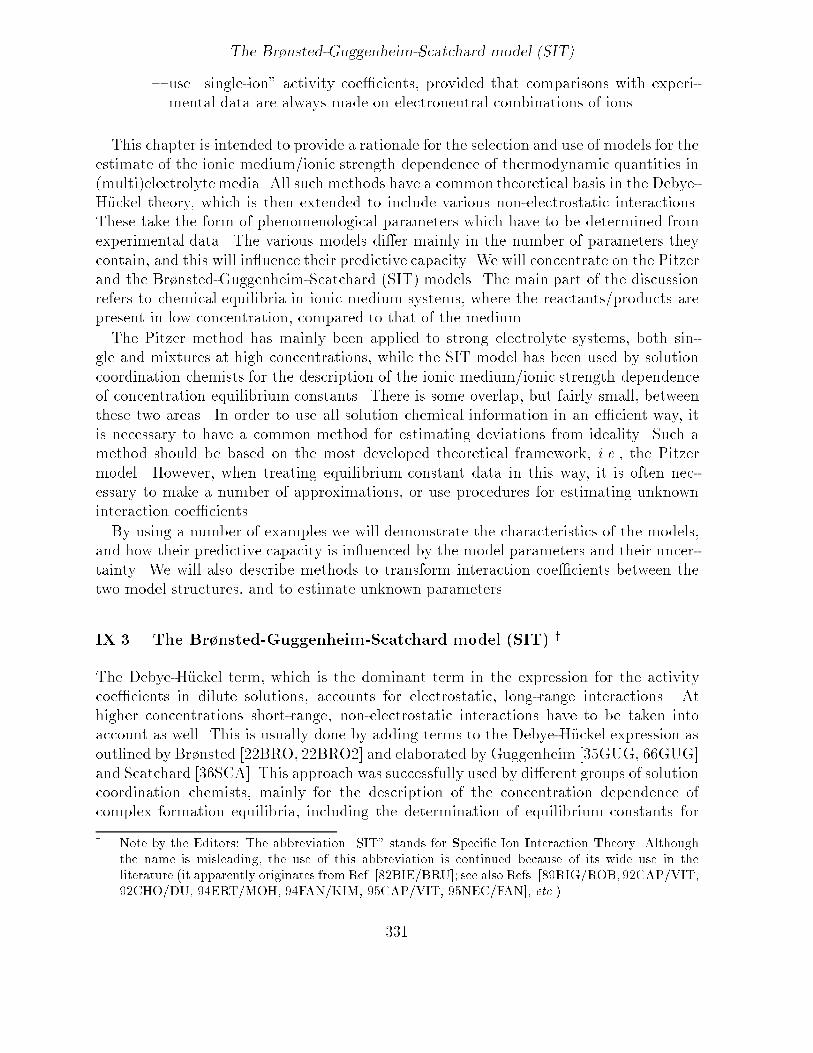
centration independent� The summation extends over all species k� with molality mk�present in solution� The value of ��� kg��� �mol���� in the denominator of the Eqs� �IX�����IX��� is an empirical value of the product ajB in the Debye�H�uckel term �where aj isan �e�ective� ion diameter and B is a constant determined by the temperature and thephysical properties of pure water� cf� p���� The value ��� was proposed by Scatchard ��SCA� in order to minimise the ionic strength dependence of ��i� k� for a number ofelectrolytes at ����� K� cf� Figure IX��It should be mentioned that a small change in the proposed value ���� kg����mol����� has
very little in�uence on the quality of the �t of experimentalmean�activity coe�cients data�presumably due to correlation between ajB and the �tted value of ��i� k�� A constant valueof ajB for all ionic species simpli�es the modelling of both binary and multicomponentaqueous electrolyte systems and makes it easy to give a consistent description of meanactivity coe�cients both in binary and multicomponent solutions ��ROB�STO� p���������The model assumption that the SIT interaction coe�cients ��i� k� are concentration
independent is an oversimpli�cation� There is both theoretical and experimental evidence ��PIT� that they vary at lower molality� cf� Figure IX�� At high molality the value of��i� k� becomes nearly constant� In principle� it is possible to consider the SIT coe�cientto be dependent on concentration� but in this case all required thermodynamic transfor�mations become complex� In the simplest SIT model one does not take this concentration
The Br�nsted�Guggenheim�Scatchard model �SIT�
Figure IX�� The concentration dependence of the SIT coe�cient for a number of elec�trolytes at ����� K and � atm� The source of log�� �� is Ref� ��PIT�� The units of � arekg �mol���
dependence into account� If the available experimental data permit the determination ofmore than one interaction parameter the reader is advised to use the Pitzer approach� Oneshould also observe that the variations of ��i� k� are largest at low molalities where thesecond term makes only a small contribution to the total value of the activity coe�cient�cf� Eq� �IX����
Note� This assumption results in the identity ��i� k� � ��k� i�� i�e�� log�� �� � log�� �� forall strong n�n electrolytes� In the framework of other models these single ion activitiescould be assumed to be rather di�erent from one another� cf� ��BAT�STA��
Assumption �
The ion interaction coe�cients ��i� k� are zero for ions of the same charge sign� accordingto the Br�nsted principle of speci�c ion interaction BRO� BRO�� The rationalebehind this is straightforward� the ions of the same charge sign are far from one anotherdue to electrostatic repulsion� Hence� short�range forces between them are small� Theions of opposite charge are close to one other� and they are therefore strongly a�ected bythe short�range forces� which are speci�c for each pair of co�ions� It is known that theBr�nsted principle is not fully in agreement with the best experimental data� but thesedeviations are usually small �often � �������� in the values of the osmotic coe�cient or
Estimations of Medium E�ects on Thermodynamic Data
ln �� ��PIT��� Thus� Assumption �the Br�nsted principle of speci�c ion interaction� isa good approximation with a sound theoretical basis� In order to compare the SIT modelwith experimental data� one must combine Eq� �IX��� or �IX��� for single ion activitycoe�cients to a measurable quantity� mean�activity coe�cients� osmotic coe�cients� orequilibrium constants� In �GRE�FUG� it was assumed that the interaction coe�cientsfor uncharged species were zero� There is no problem �and it is more correct� withincluding possible interactions between uncharged and ionic species in the SIT model�For uncharged solutes the SIT model is reduced to one term� which is equivalent to the
Setchenow equation �LON�MCD� ��HAR�OWE�� which assumes a linear dependenceof ln �� on electrolyte concentration �where �� is the activity coe�cient of the unchargedmolecule in an aqueous electrolyte solution�� The Setchenow equation has been shown �LON�MCD� ��HAR�OWE� to be a good approximation for the concentration depen�dence of the solubility of many gases �N�O� C�H�� CO�� O�� etc��� liquids �phenol� ethylacetate� etc��� complexes �CdX�� X � Cl�� Br�� I�� and solids �e�g�� SiO��� in electrolytesolutions ��salting�in� or �salting�out� e�ects�� Hence� the SIT equation has the po�tential to describe the activity coe�cients and related properties of neutral species� SITparameters for the interaction between ions and uncharged species can only be determinedfor electroneutral combinations of ions and uncharged species� To handle this problemPitzer ��PIT� p��� proposed to de�ne an arbitrary zero point for the interaction betweensingle ions and neutral molecules� and suggested that the interactions between H� andneutral molecules be de�ned as zero� Other single�ion neutral molecule interactions maythen be calculated from experimental data� A number of SIT interaction coe�cients forneutral species ! electroneutral combination of ions have been tabulated by Ciavatta ��CIA�� ��CdCl��� Na
� � ClO�� � � ����� � ����� ��CdCl��� Li� � ClO�
� � � ��� � ��������CdI��� Na
� � ClO�� � � ���� � ������ ��Hg�OH���� Na
� � ClO�� � � ����� � ������
��HgCl��� Na� �ClO�
� � � ������ ����� ��PbCl��� Li� �ClO�� � � ����� ����� where all
values are given in units of kg �mol���Interactions between uncharged species may be far from negligible due to a so�called
�self�interaction� contribution� Robinson and Stokes ��ROB�STO� give evidence that theactivity coe�cients of sucrose and glycerol are larger than � in an aqueous solution� otherexamples are given by Long and McDevit �LON�MCD�� Interactions of this type mayalso be described using the SIT model� e�g�� the activity coe�cients of the non�electrolytesmentioned above are reproduced better than ����� log�� unit in log�� � up to mol � kg��by using the self�interaction coe�cients ���� for sucrose ���sucrose� sucrose� � ����� and���� for glycerol ���glycerol� glycerol� � ������ However� the deviations from ideality inaqueous solutions of non�electrolytes are in general small�
�
The Br�nsted�Guggenheim�Scatchard model �SIT�
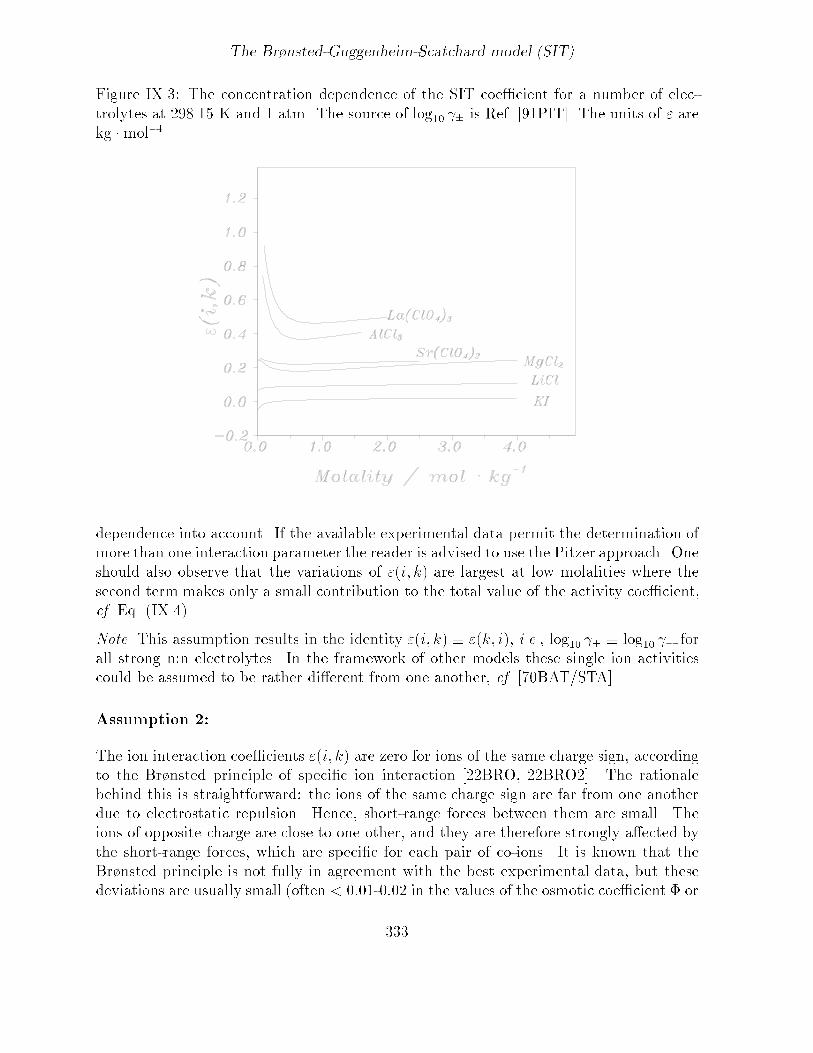
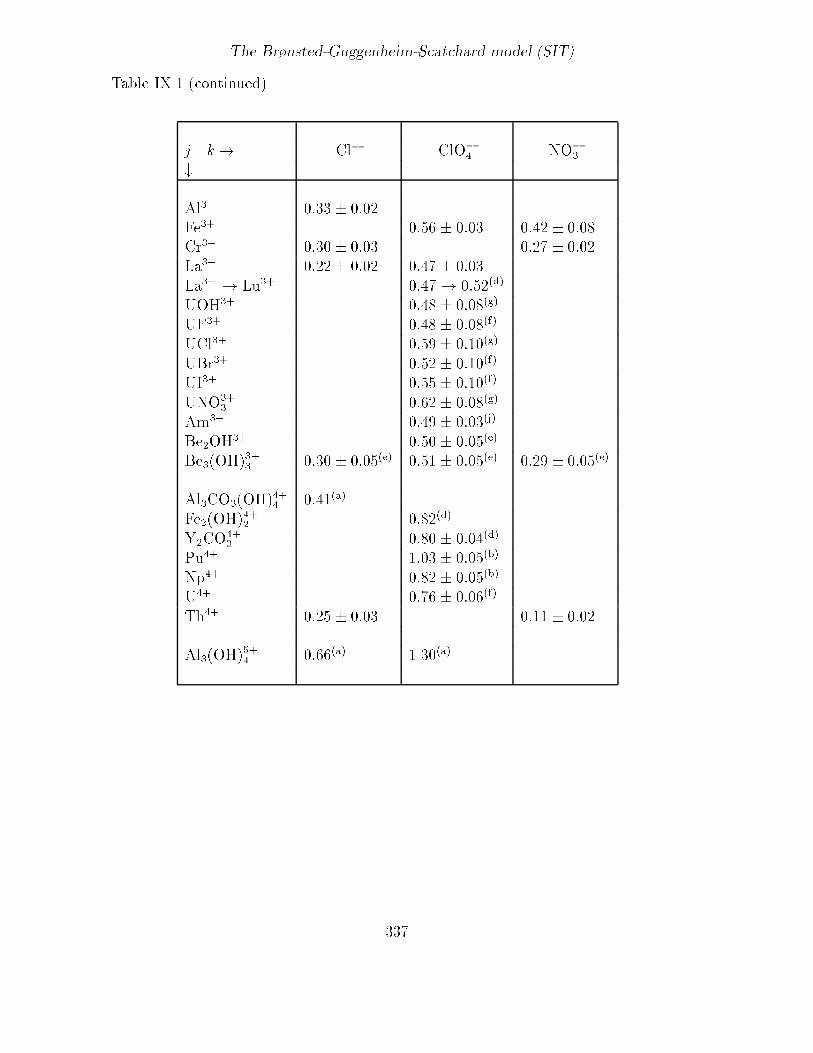
Table IX��� Ion interaction coe�cients �j�k �kg �mol��� at ��C and � bar for cations jwith k � Cl�� ClO�
� and NO�� � taken from Ciavatta ��CIA� unless indicated otherwise�
The uncertainties represent the ��" con�dence level� most of them were estimated by Cia�vatta ��CIA�� Care should be taken when using the coe�cients ��Mn��Cl�� and ��Mn��NO�
��
reported by Ciavatta ��CIA�� which were evaluated without taking chloride and nitratecomplexation into account�
Estimations of Medium E�ects on Thermodynamic Data
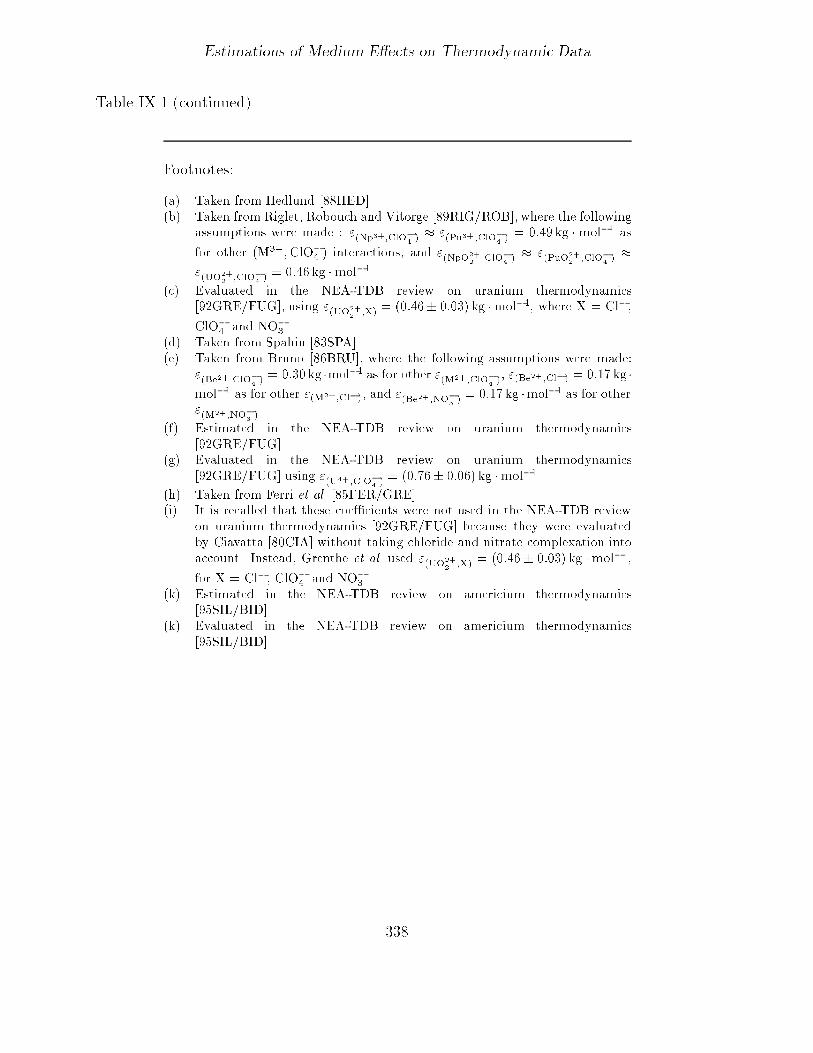
Table IX�� �continued�
Footnotes�
�a� Taken from Hedlund ���HED�b� Taken from Riglet� Robouch and Vitorge ���RIG�ROB� where the following
assumptions were made � ��Np���ClO��� � ��Pu�� �ClO�
�� � �� � kg � mol�� as
for other �M���ClO�� � interactions� and ��NpO��
��ClO�
�� � ��PuO��
��ClO�
�� �
��UO��
��ClO�
�� � �� � kg �mol��
�c� Evaluated in the NEA�TDB review on uranium thermodynamics���GRE�FUG� using ��UO��
��X� � ��� �� ����� kg �mol��� where X � Cl��
ClO�� and NO�
� �d� Taken from Spahiu ���SPA�e� Taken from Bruno ���BRU� where the following assumptions were made�
��Be���ClO��� � ���� kg �mol�� as for other ��M���ClO�
��� ��Be���Cl�� � ���� kg �
mol�� as for other ��M�� �Cl��� and ��Be���NO��� � ���� kg �mol�� as for other
��M�� �NO���
�f� Estimated in the NEA�TDB review on uranium thermodynamics���GRE�FUG
�g� Evaluated in the NEA�TDB review on uranium thermodynamics���GRE�FUG using ��U���ClO�
�� � ������ ����� kg �mol��
�h� Taken from Ferri et al ���FER�GRE�i� It is recalled that these coe�cients were not used in the NEA�TDB review
on uranium thermodynamics ���GRE�FUG because they were evaluatedby Ciavatta ���CIA without taking chloride and nitrate complexation intoaccount Instead� Grenthe et al used ��UO��
��X� � ��� � � ����� kg �mol���
for X � Cl�� ClO�� and NO�
� �k� Estimated in the NEA�TDB review on americium thermodynamics
���SIL�BID�k� Evaluated in the NEA�TDB review on americium thermodynamics
���SIL�BID
�
The Br�nsted�Guggenheim�Scatchard model �SIT�
Table IX�� Ion interaction coe�cients �j�k �kg � mol��� at ��C and � bar for anions jwith k � Li��Na�and K�� taken from Ciavatta ��CIA� unless indicated otherwise� Theuncertainties represent the ��" con�dence level� most of them were estimated by Ciavatta ��CIA��
Estimations of Medium E�ects on Thermodynamic Data
Table IX� �continued�
j k � Li� Na� K�
�
S�O��� ������ ����
HPO��� ������ ���� ������ ����
CO��� ������ ����c� ���� ����
SiO��OH���� ������ �����a�
Si�O��OH���� ������ �����b�
CrO��� ������ ���� ������ ����
UO�F��� ������ �����b�
UO��SO����� ����� �����b�
UO��N����� ����� ����b�
UO��CO����� ����� �����d�
PO��� ����� ��� ������ ���
Si�O��OH���� ����� ����b�
Si�O�OH��� ����� ����b�
Si�O�OH��� ����� ����b�
Am�CO����� ������ �����e�
P�O�� ����� ���� ������ ����
Fe�CN���� ������ ���U�CO��
��� ������ �����b�d�
UO��CO����� ������ �����d�
UO��CO���� ����� �����d�
U�CO���� ����� �����d�
�UO����CO����� ���� �����d�
�a� Evaluated in the NEA�TDB review on uranium thermodynamics ���GRE�FUG�b� Estimated in the NEA�TDB review on uranium thermodynamics ���GRE�FUG�c� From ���CIA These values di�er from those reported in the NEA�TDB uranium
review ���GRE�FUG See the discussion in Appendix D of the NEA�TDB reviewon americium thermodynamics ���SIL�BID
�d� See the discussion in Appendix D of the NEA�TDB review on americium thermo�dynamics ���SIL�BID
�e� Estimated in the NEA�TDB review on americium thermodynamics ���SIL�BID
��
The Br�nsted�Guggenheim�Scatchard model �SIT�
Figure IX��� The determination of the SIT coe�cient from the mean activity coe�cientsfor HCl at ����� K and � atm from ��ROB�STO��
IX����� Determination of ion interaction coe�cients
Example �
Figure IX�� illustrates both the method used to obtain ion interaction coe�cients frommean�activity coe�cient data� and the precision of the SIT method in single electrolytesystems� The mean activity coe�cient �� �HCl� is equal to�
log�� ���HCl � log�� ���H� � log�� ���Cl�
� �D � ��H��Cl��mCl� �D � ��Cl��H��mH�
or
log�� ���HCl � �D � ��H��Cl��mHCl
By plotting log�� ���HCl � D� vs� mHCl a straight line with the slope ��H��Cl�� isobtained� The degree of linearity should in itself indicate the range of validity of thespeci�c ion interaction approach� Osmotic coe�cient data can be treated in an analogousway�
Example �
Figure IX�� illustrates the modelling of equilibrium constant data obtained at di�erent
��
Estimations of Medium E�ects on Thermodynamic Data
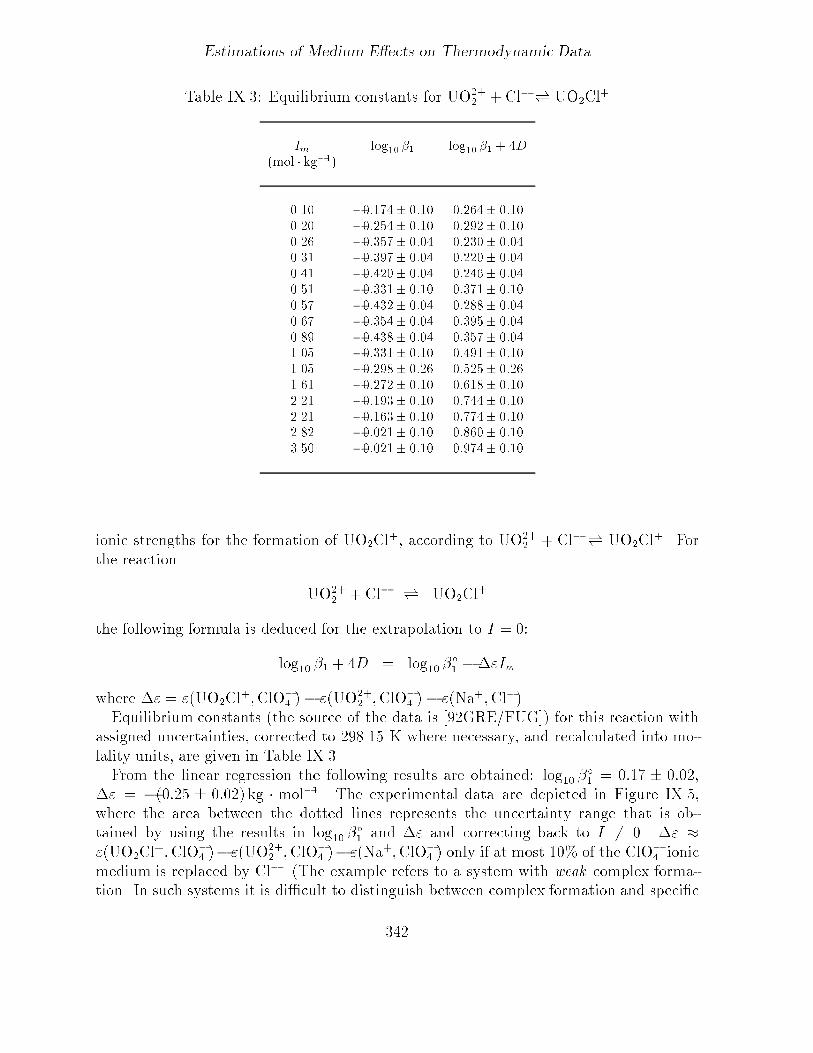
Table IX�� Equilibrium constants for UO��� � Cl� �� UO�Cl�
ionic strengths for the formation of UO�Cl�� according to UO��� � Cl� �� UO�Cl�� For
the reaction
UO��� � Cl� �� UO�Cl
�
the following formula is deduced for the extrapolation to I � ��
log�� �� � �D � log�� ��� �#�Im
where #� � ��UO�Cl��ClO�� �� ��UO��
� �ClO�� �� ��Na��Cl���
Equilibrium constants �the source of the data is �GRE�FUG�� for this reaction withassigned uncertainties� corrected to ����� K where necessary� and recalculated into mo�lality units� are given in Table IX��From the linear regression the following results are obtained� log�� �
�� � ���� � ����
#� � ����� � ���� kg � mol��� The experimental data are depicted in Figure IX���where the area between the dotted lines represents the uncertainty range that is ob�tained by using the results in log�� �
�� and #� and correcting back to I �� �� #� �
��UO�Cl��ClO�
� �� ��UO��� �ClO�
� �� ��Na��ClO�� � only if at most ��" of the ClO�
� ionicmedium is replaced by Cl�� �The example refers to a system with weak complex forma�tion� In such systems it is di�cult to distinguish between complex formation and speci�c
�
The Br�nsted�Guggenheim�Scatchard model �SIT�
Figure IX��� Plot of log�� �� � �D� vs� Im for the reaction UO��� � Cl� �� UO�Cl� at
����� K and � atm� The straight line shows the result of the weighted linear regression�and the dotted lines represent the uncertainty range�
�
��
�
��
��
�
��
�
� �� � �� � �� � ��
log�� �� � �D
Im �mol � kg��
log�� ��� � ����� ����
�� � ������� ����� kg �mol��uu
uuu
u
u
uu
uu
u
uu
u
u
ion interaction of the type used e�g�� in the Pitzer model� vide infra p��� Spectroscopicevidence �GRE�FUG� p�������� indicates that chloride complexes are formed in thissystem��
Example �
When using the speci�c interaction theory� the relationship between the redox potentialof the couple UO��
� �U�� in a medium of ionic strength Im and the corresponding quantity
at I � � should be calculated in the following way� The reaction in the galvanic cell
Pt�s� jH��g� fH�� ���H��aq� aH� � �� kUO��
� �aq� aUO��
�
��U���aq� aU����H��aq� aH�� j Pt�s�
is
UO��� �H��g� � H
� �� U�� � H�O�l�
For this reaction
log��K� � log��
aU�� a�H�OaUO��
� a�H� fH�
�
Estimations of Medium E�ects on Thermodynamic Data
At reasonably low partial pressure of H��g� fH� � pH� � and on the basis of the SIT model�
log�� �U�� � ���D � ��U���ClO�� �mClO�
�
log�� �UO���
� ��D � ��UO��� �ClO�
� �mClO�
�
log�� �H� � �D � ��H��ClO�� �mClO�
�
Hence�
log��K� � log��K � ��D �
���U���ClO�
� �� ��UO��� �ClO�
� �
���H��ClO�� ��mClO�
�� log�� aH�O
The relationship between the equilibrium constant and the redox potential is
lnK �nF
RTE
where E is the redox potential in the particular ion medium� n is the number of transferredelectrons in the reaction considered� Combining and rearranging the required equationthen leads to
E � ��D�RT ln����
nF
�� E� �#�mClO�
�
�RT ln����
nF
�
For n � in the present example and T � ����� K� this equation becomes
E mV�� ����D � E� mV�� ����#�mClO�
�
where
#� � ��U���ClO�� �� ��UO��
� �ClO�� �� ��H��ClO�
� �
The same procedure can be followed when using the Pitzer equations�
The following can be used as auxiliary sources of information on the SIT coe�cients�a� the experimental data on mean activity coe�cients of the electrolyte of interest inits mixture with other electrolytes� b� solubility data in ternary systems with a commonion� where the thermodynamic information �activity product and the SIT coe�cient� isavailable for one component�
��
Other equations� approximately equivalent with the SIT model
IX��� Other equations� approximately equivalent with the SIT model
Vasil�ev �VAS� seems to be the �rst to systematically use an equation of type �IX��� toextrapolate equilibrium constant data to zero ionic strength� The Vasil�ev equation forthe single�ion activity coe�cient has the following form�
log�� �i � � AZ�i
pIm
� � ���BpIm
� bIm �IX���
where the numerical factor ��� is used as a constant value of the �e�ective� diameterfor all ions �in $A�� At ����� K and � atm the value of the Debye�H�uckel parameterB � ��� � ��� kg��� � mol���� � cm�� � ��� kg��� � mol���� � $A��� i�e�� the value ofproduct ���B � ��� kg��� �mol���� as compared with ��� accepted in the SIT model� Asfar as we know� the value of the parameter b in the Vasil�ev equation was consideredto be a purely empirical constant� the value of which had to be determined separatelyin each medium by experiments �in contrast to the SIT� where it was assumed that thevalues of the speci�c interaction coe�cients for pairs of ions could also be evaluated fromindependent sources of thermodynamic information� if available��Pitzer and Brewer ��LEW�RAN� have suggested the following equation� similar to the
SIT equation �the well known Guggenheim equation��
log�� �i ��Z�
i ApIm
� �pIm
�Xj
B�i� j�mj �IX���
where the summation over j covers all anions in the case where i is a cation and vice versa�Tables of B�i� j� are given by Pitzer and Brewer and by Baes and Mesmer ��BAE�MES��The Debye�H�uckel term is di�erent from that used in our version of the SIT model� ThePitzer and Brewer equation has been used by Baes and Mesmer in their monograph onthe hydrolysis of cations ��BAE�MES��The interaction coe�cients and the value of ajB are correlated with one another� and
it is important to use the interaction coe�cients only with the model used to deter�mine them� The equations of Vasil�ev� Pitzer and Brewer and the SIT are all essen�tially equivalent for the extrapolation of laboratory data obtained in di�erent ionic media�I � �� mol � kg��� to in�nite dilution�In ��� Bromley �BRO�� using a trial and error method� proposed the following
empirical equation for mean�activity coe�cients
log�� �� � �AjZMZXjpIm
� �pIm
������ � ���B�jZMZXj Im�
� � ��ImjZMZXj
�� �B Im �IX���
As one can see� the Bromley equation can be considered an empirical extension of thePitzer�Brewer or the SIT equations� However� the complication resulting from the addi�tion of the second term results only in a very slight improvement of the �tting of log�� ��for strong electrolytes� cf� ��COE�� where it was shown that the Bromley and the SIT
��
Estimations of Medium E�ects on Thermodynamic Data
equations give practically the same descriptions of the concentration dependence of equi�librium constants� and almost identical values of log��K
� at in�nite dilution� for sometwo�phase equilibria�Helgeson et al� ��HEL�KIR� have proposed a rather sophisticated semiempirical model
involving ion hydration to describe the temperature and pressure dependence of bothstandard state and excess properties of aqueous ions and electrolytes� The Helgesonmodel postulates the following equation �with some simpli�cations� for the mean�activitycoe�cient of a completely dissociated binary electrolyte� consisting of �M cations and �Xanions per formula unit� with ion charges ZM and ZX respectively�
log�� �� � �AjZMZXjpIm
� � ajBpIm
� log���� � ��������m�� � b�Im �IX���
where b� is
b� ��b�MX � �M �X b
�MX�
�
and � � �M � �X� aj� as earlier� is an �e�ective� ion diameter �particular for each ion orelectrolyte�� B is the Debye�H�uckel parameter� the term � log���� � ��������m�� is themole fraction to molality conversion factor� m� stands for the sum of the ionic molalitiesof all species in solution� the parameter b�MX is a constant at constant temperature foreach particular ion �electrolyte�� b�MX is a short�range interaction parameter due to speci�ccation�anion �or ion�neutral� interactions� The parameters b� are tabulated ��HEL�KIR�for many single electrolytes and ion combinations � ��HEL�KIR�� Table �� � there�� butnot for complex ions� Hence� the Helgeson equation is actually a one�parameter equation�The maximum error between measured and calculated mean�activity coe�cients is within��" in a limited ionic strength range �up to �� mol � kg���� but may increase up to �"at ionic strengths ���� mol � kg�� �Tables � and � in ��HEL�KIR��� This is essentiallythe same accuracy as for the SIT model� However� the validity of the assumptions onwhich the Helgeson model are based is not quite clear� e�g�� the approximation usedfor the concentration dependence of the dielectric constant of an aqueous solution� Anobvious drawback of this model is the need to use di�erent values of the size parameteraj� for di�erent ions and electrolytes� which makes it di�cult to extend the model tomulticomponent solutions� For instance �see ��ROB�STO�� p���� in a mixture of two��� electrolytes B and C the following cross�di�erential relation must be obeyed�
� ln �B mC
�mB
�
� ln �C mB
�mC
and it is impossible to satisfy this equation using di�erent values of the parameter aj foreach electrolyte� In order to circumvent this problem Helgeson et al� proposed that theaverage of the aj values �see Eq� ���� in ��HEL�KIR�� should be used� However� thisis not a strict solution of the problem� although the error introduced is usually less than
��
On the magnitude of the speci�c ion interaction coe�cients
��" in the value of the mean�activity coe�cient of a certain electrolyte in a mixture withother electrolytes �see ��HEL�KIR�� p����������This short survey of the equations proposed for the description of concentration depen�
dence of equilibrium constants in aqueous solutions is rather subjective and incomplete�Many other equations for these purposes have been proposed in literature� see� for in�stance� ��BEC�NAG�� However� most of them are based on the following equation formean activity coe�cients
log�� �� � �AjZMZXjpIm
� � ajBpIm
� CIm �DI���m � EI�m � ���
and merely use di�erent number of terms in an ionic strength expansion and di�erentvalues of the ajB product� We do not recommend procedures that consider ajB as a�tting parameter� even though this leads to a �better� description of the ionic strengthdependence of the equilibrium constants ��AND�KHO� in one particular ionic medium�These �tting parameters cannot be used for predictions in other ionic media�
IX� � On the magnitude of the speci�c ion interaction coe�cients
From the previous text it is obvious that in order to model the p� T � and ionicstrength�medium dependence of chemical equilibria in aqueous electrolyte systems� notonly do we need a proper model to describe deviations from ideality� but also a numberof empirical parameters� An important point for the application of these models is theability to estimate either interaction parameters for which no experimental informationis available� ory #� for reactions� Interaction coe�cients for a large number of strongelectrolytes� and some complexes� have been listed in Tables IX�� and IX�� In the fol�lowing �gures we demonstrate possible internal correlations between these data� and alsocorrelations with size and charge parameters�Figures IX��� IX��� IX�� and IX�� shows correlations between the interaction coe�cients
in chloride and perchlorate media for ions of various charge types� These correlations areuseful for the estimation of unknown interaction parameters� provided that informationin one system is available�
IX���� Correlations among speci�c ion interaction parameters for cations
The speci�c ion interaction coe�cients are known for many cations� they may also beestimated by using correlations where experimental data are lacking� Figs� IX��� toIX��� show correlations between ��i� j� and the ion potential Zr for various cations� Zand r are the charge and crystallographic ionic radius of the cation� respectively� Thescatter indicates that unknown interaction coe�cients for cations of charge �� or less�
y �� �P
i �i��i�Y�� where the sumation is taken over all species i in the reaction� and Y stands forthe cation of the ionic medium electrolyte if i is an anion� but Y stands for the ionic medium anionif i is a cation The reaction stoichiometric coe�cients� �i� are positive for products and negative forreactants� cf Eq �II �
��
Estimations of Medium E�ects on Thermodynamic Data
Figure IX��� The correlations between interaction coe�cients in chloride and perchloratemedia for monovalent cations� The units of � are kg �mol���
Figure IX��� The correlations between interaction coe�cients in chloride and nitratemedia for monovalent cations� The units of � are kg �mol���
��
On the magnitude of the speci�c ion interaction coe�cients
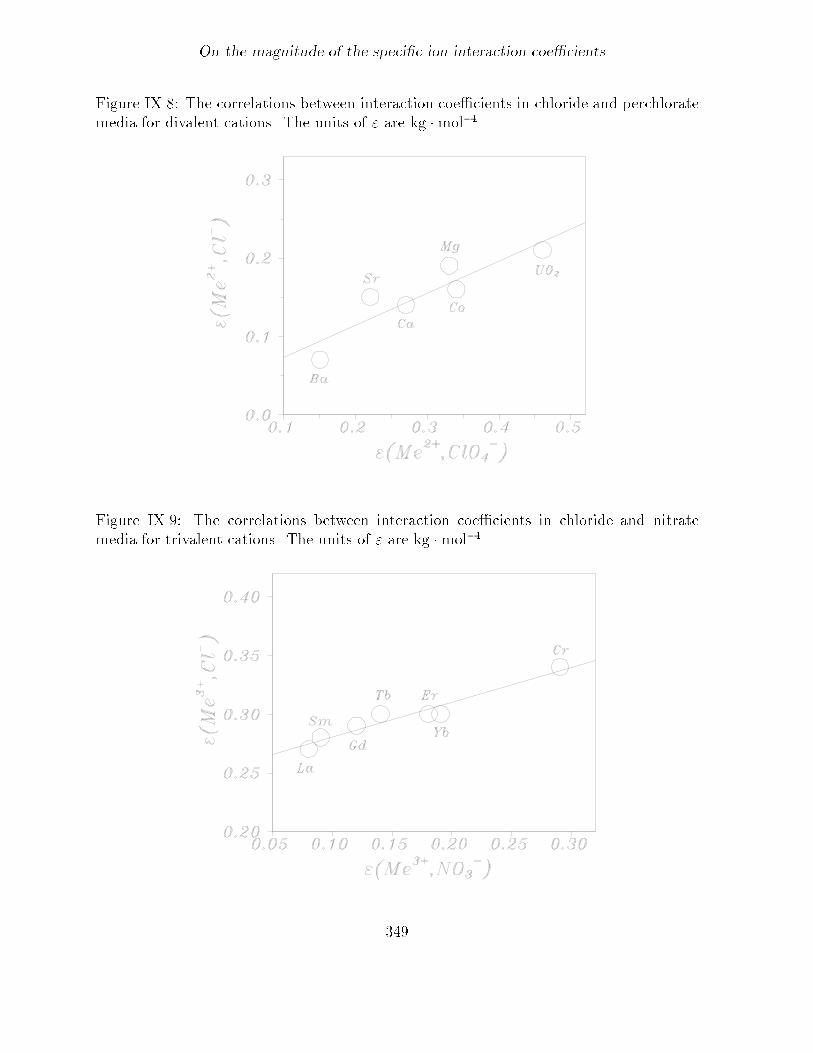
Figure IX��� The correlations between interaction coe�cients in chloride and perchloratemedia for divalent cations� The units of � are kg �mol���
Figure IX��� The correlations between interaction coe�cients in chloride and nitratemedia for trivalent cations� The units of � are kg �mol���
��
Estimations of Medium E�ects on Thermodynamic Data
Figure IX���� The correlations between interaction coe�cients and the ion potential Zr�Z and r stand for the charge and crystallographic ionic radius in $A� respectively� forvarious cations in chloride media� The units of � are kg �mol���
may be estimated with an accuracy of about ���� kg �mol��� The interaction coe�cientsfor several tetravalent actinide ions have been determined experimentally and do not haveto be estimated� Unhydrolysed M�� ions are in general not present in aqueous systemsbecause of very strong hydrolysis� with the exceptions of Zr��� Hf �� and tetravalentactinides which are present in strongly acid �� M� solution�
IX��� Correlations among speci�c ion interaction parameters for complexes
The following general observations might be useful�
� Complexes of high positive charge tend to have interaction parameters close to thosefor simple cations of the same charge� cf� Table IX���
� Complexes with a large negative charge frequently have negative interaction param�eters with M� ions� this may be a result of ion pairing�
Ciavatta ��CIA� has proposed the following method to estimate values of � for thecomplexes ML and ML� in an ionic medium NX�
��ML� NorX� � ��M�X� � ��L�N�
��ML�� NorX� � ��M�X� � ��L�N�
��
On the magnitude of the speci�c ion interaction coe�cients
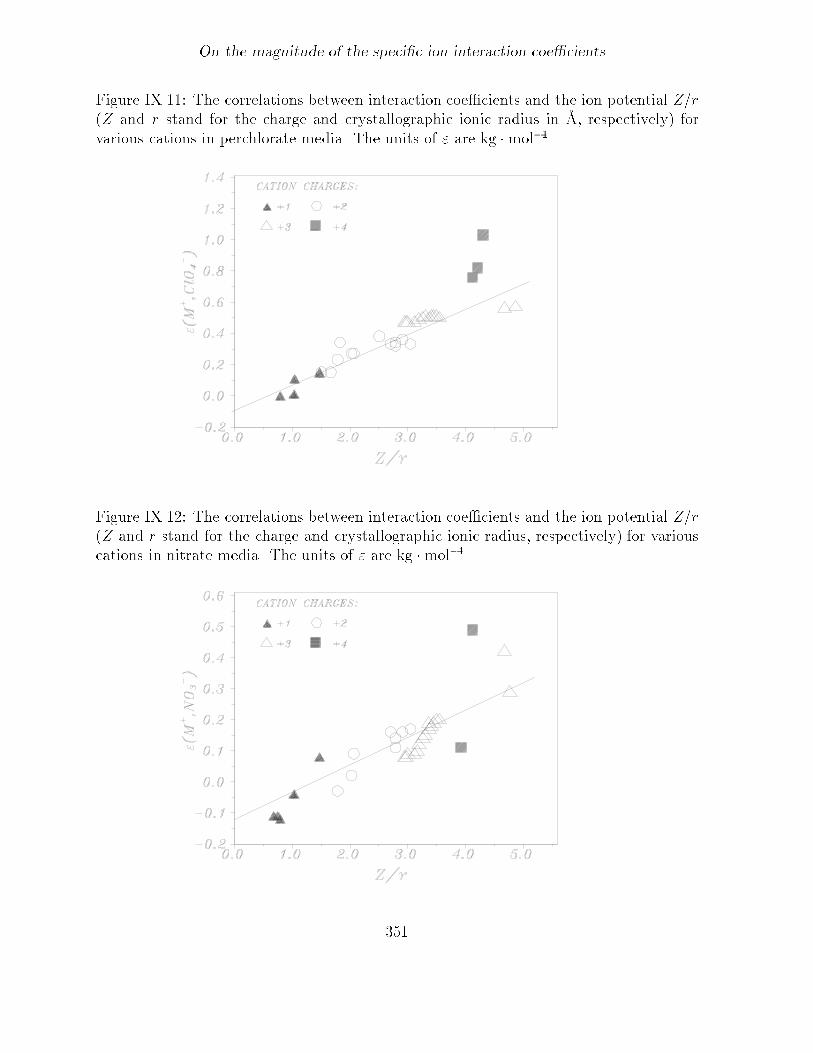
Figure IX���� The correlations between interaction coe�cients and the ion potential Zr�Z and r stand for the charge and crystallographic ionic radius in $A� respectively� forvarious cations in perchlorate media� The units of � are kg �mol���
Figure IX��� The correlations between interaction coe�cients and the ion potential Zr�Z and r stand for the charge and crystallographic ionic radius� respectively� for variouscations in nitrate media� The units of � are kg �mol���
��
Estimations of Medium E�ects on Thermodynamic Data
The average deviations between the estimates based on the equations above and theexperimental values was ����� kg � mol��� However� it is di�cult to know how generalthis estimation method is� because of the few examples�
IX���� Correlations between #��values for chemical reactions
Reactions that involve ions of the same charge type have approximately the same val�ues of #�� and the uncertainty in this estimation is in general equal to� or better than������ to ���� kg �mol���
IX��� The Pitzer equations
The Pitzer model in its original form describes the thermodynamics of electrolyte mixtureswhere ionic pairing and complex formation are relatively weak� The physical theory onwhich the Pitzer model is based takes more interactions between the dissolved speciesinto account than the simpler models� This is essential when describing thermodynamicproperties in mixed electrolyte systems at high ionic strength� However� this requires alarge number of empirical parameters� which must be obtained from experimental data�Many such parameters for various strong electrolytes have been determined� and they canbe used to deduce interaction parameters for complexes by using experimental equilibriumconstants at high ionic strength and extrapolated values of these constants at zero ionicstrength� There is only a marginal gain to use the Pitzer equations when modelling thethermodynamics of complex formation and similar equilibrium reactions at fairly low ionicstrengths� up to �� mol �kg��� The real advantage is apparent in mixtures of electrolytesat high ionic strength�The following text is only intended to provide the reader with a brief outline of the
Pitzer method� The notation is the same as used by Pitzer� e�g�� in ��PIT�� Pitzer�sapproach is based on physical models of the interactions in multicomponent ionic systems�Applying relations based on statistical thermodynamics� and using a number of reasonablesimpli�cations�assumptions �PIT� ��PIT�� he proposed an analytical form of a virialtype equation for the excess Gibbs energy for the system water � an electroneutral mixtureof aqueous ionic species� For the solution of a single electrolyte MX� the mean�activitycoe�cient may be expressed by Eq� �IX����
ln �MX � jZMZXj f� �m� �M�X�
�B�MX �m�
� ��M�X����
�
�C�MX �IX����
and the corresponding equation for the osmotic coe�cient by
� � � jZMZXj f� �m� �M�X�
�B�MX �m�
� ��M�X����
�
�C�MX �IX����
where �M and �X are the number of M and X ions in the formula unit� ZM and ZX their
�
The Pitzer equations
charges� m is the molality of the solution and � � �M � �X�
f� � �A�
� pIm
� � bpIm
�
bln�� � b
qIm�
��IX���
B�MX � �
���MX �
����MX
��Im
��� �� � �
qIm � ��Im
�e��
pIm
��IX���
C�MX �
C�MX �IX����
f� � �A�
pIm
� � bpIm
�IX����
B�MX � �
���MX � �
���MXe
��pIm �IX����
f� and f� are the forms of the Debye�H�uckel term in the Pitzer model for mean ac�tivity coe�cient and osmotic coe�cients respectively� A� � ����� kg��� � mol���� at����� K and � atm is the Debye�H�uckel parameter for the osmotic coe�cient� note thatA� � A�� b and � are �xed parameters �b � �� kg��� �mol����� � � �� kg��� �mol����for all electrolytes� except the ��charge type�� In the case of � electrolytes Pitzer addsan additional virial term� The Pitzer equations have been extended to cover electrolytemixtures by including terms allowing for the interaction of ions of the same charge signand for triplet interactions� This extension results in the following equation for the con�centration dependence of the activity coe�cient of a cation M �the corresponding equationfor an anion L is obtained by interchanging L for M� a for c� and c for a throughout� in amixed solution containing a number of di�erent ions and neutral species �in the simpli�edform without the third virial terms for neutral species ��PIT� Eq� ����
ln �M � Z�MF �
Xa
ma �BMa � ZCMa� �Xc
mc
� Mc �
Xa
ma�Mca
�
�Xa
Xa�mama� �Maa� � jZMj
Xc
Xa
mcmaCca
�Xn
mn�nM �IX����
The subscripts c and a refer to cations and anions in general� n denotes neutral species�ZM is the charge of a speci�c cation� Mc is the second virial coe�cient arising frombinary interaction between a speci�c cation and the other cations� �nM is the second virialcoe�cient representing the interactions between a speci�c cation and neutral species� �ijk
is the third virial coe�cient representing triple interactions between ions i� j� and k�where i and j are di�erent anions� k is a cation� when i and j are di�erent cations� k is
�
Estimations of Medium E�ects on Thermodynamic Data
an anion�� The parameters � and � are assumed to be independent of the ionic strength�The quantity F includes the Debye�H�uckel and other terms as follows�
F � f� �Xc
Xa
mcmaB�ac �
Xc
Xc�
mcmc� �cc� �
Xa
Xa�
mama� �aa� �IX����
� and B� are the ionic strength derivatives of and B respectively �see below�� and
Z �Xi
mijZij �IX����
The ionic strength dependence of BMa is the following�
BMa � ����Ma �
����Ma
��Im
���
�� � �
qIm
�e��
pIm
��IX���
� ����Ma � �
���Ma g�Im�
and
B�Ma � ��
���Ma
��I�m
���
�� � �
qIm �
�
��Im
�e��
pIm
��IX���
� ����Ma
g��Im�Im
where the functions g and g� are de�ned as�
g�Im� �
��Im
���
�� � �
qIm
�e��
pIm
��IX��
g��Im� � �
��Im
���
�� � �
qIm �
�
��Im
�e��
pIm
��IX��
Cca is de�ned as follows�
Cca �C�ca
jZcZaj��� �IX���
The virial coe�cient ij has the following form
ij � �ij �E�ij�Im� �IX���
��
Comparison of the SIT and Pitzer models
where E�ij�Im� is a function of the ionic strength only� it is zero except for unsymmetricalmixing of ions of the same sign� i�e�� when the charges on i and j are di�erent� but have thesame sign �numerical values of this term are given by theory and several equations havebeen proposed that accurately represent the results obtained by numerical integration ��PIT���Therefore� in order to calculate the activity coe�cients for ions the following parameters
are needed� ����� ����� C� for each anion�cation pair� �ij for each unlike cation�cation oranion�anion pair� � for each triple ion interaction where the ions are not all of the samesign� and � for ion�neutral pairs� We should notice that� for the case of interactionsbetween cations and anions with charges or higher� it is preferable to use an additionalparameter ���� �which is strongly correlated with the association constant for these ions��In some cases triple ion�ion�neutral interactions also have to be taken into account� Thefull set of the Pitzer parameters is available for many single electrolytes and electrolytesmixtures ��PIT�� but only in very few cases for complexes�The activity coe�cient of a neutral species N is described by the following equation in
the Pitzer approach� which is consistent with the traditional Setchenov equation�
ln �N �
�Xc
mc�Nc �Xa
ma�Na �Xn
mn�Nn
��IX���
The individual values of neutral�ion interaction coe�cients cannot be determined inany experiment� but only values of electrically neutral combinations� In order to handlethe problem of estimation of neutral�ion interaction coe�cients Pitzer proposed to set allion�neutral parameters involving H� to zero� whereupon the other ion�neutral parametersare determined�
IX��� Comparison of the SIT and the Pitzer models for the description ofconcentration dependence of equilibrium constants of complex forma�tion reactions in ionic media
The Br�nsted�Guggenheim�Scatchard speci�c ion interaction model can be considered asa simpli�ed form of the Pitzer ion interaction approach� neglecting triple interactions�which are important only in very concentrated solutions� and the interactions betweenthe ions of the same signs �they are typically small�� We have already pointed out that thePitzer model o�ers a muchmore precise description of deviations from ideality in mixturesof strong electrolytes at high ionic strength� than the SIT� provided that the necessaryinteraction coe�cients are available� Many users of the Pitzer formalism interpret experi�mental data �for instance� mean activity coe�cients of electrolytes in electrolyte mixtures�without explicit consideration of complex formation� because this many�parameter modelis able to reproduce the measured quantities with high precision without complications ofthis kind� There is no unambiguous thermodynamic method to distinguish between com�plex formation�ion�pairing and other types of short�range interactions between species in
��
Estimations of Medium E�ects on Thermodynamic Data
solution when the extent of complex formation is small or moderate� Most solution coor�dination chemists are aware of the ambiguity which this may cause in systems where weakcomplexes are formed �these are also the systems where large variations in the concentra�tions of the reactants are necessary in order to detect the e�ects of �complex� formation��and require additional non�thermodynamic evidence for the formation of complexes� suchas spectroscopic �uv�vis� NMR�� or kinetic information ��ROS�ROS��� It is up to themodeller to decide if he�she wishes to describe weak interactions between ions in termsof complex formation� or by Pitzer type of ion interactions� However� it is importantnot to mix the two systems� for instance� to use the Pitzer set of parameters for systemscontaining both Mg�� and SO��
� as components� together with an experimental value oflog��K for the reaction Mg�� � SO��
���MgSO��aq��
The Pitzer equations have been used to describe the concentration dependence of stoi�chiometric equilibrium constants for protolytic equilibria involving weak acids and baseswhere the chemical speciation is known� In these systems most of the parameters neededcan be obtained from activity coe�cient measurements of pure solutions of electrolytes� orthe corresponding mixtures� Information of this type is rarely available for complex for�mation reactions� However� the data for complexes can be introduced into the Pitzer�typedatabases� provided that information of concentration equilibrium constants are available�In equilibrium analysis� where the studies are carried out in the presence of an inert elec�trolyte �ionic medium salt NX� and small ��trace�� concentrations of reactants�products�only the terms involving mNX have to be considered in the equations for the activitycoe�cients of reactants�products� while those involving molalities of �trace� componentscan be neglected� For a chemical reaction in the general form
Xi
�iQi � rH�O�l� � � �IX���
we therefore have
lnK� �Xi
�i lnmi �Xi
�i ln �i � r ln aH�O
� lnK �Xi
�i ln�i � r ln aH�O �IX���
where the index i denotes a particular reactant�product� r stands for the number of molesof water participating in the reaction� A correction for water activity can easily be madeusing the available values of the osmotic coe�cients for the ionic medium electrolyte� Attrace concentrations of the reaction participants� the Pitzer model results in the followinganalytical equation for the reaction �IX��� in the ionic medium NX �an ��� electrolyte�
lnK� � lnK � r ln aH�O �Xi
�iZ�i
�f� �m�B�
NX
�� m
Xi
�iBij � m�Xi
�iCij
�mXi
�i ii� �m�Xi
�ii�j �m�Xi
�ijZijCNX �IX���
��
Comparison of the SIT and Pitzer models
where the index i refers to the reaction participants� i� and j stand for the ionic mediumions� having the same and opposite charge sign respectively� to the species i� and m is themolality of the ionic medium electrolyte NX�The corresponding analytical statement for the concentration dependence of log��K
for the reaction �IX��� at trace concentrations of reactants�products in a NX electrolytemedium using the SIT equation is�
log��K� � log��K � r log�� aH�O
�DXi
�iZ�i �m
Xi
�i ��i� j� �IX���
where D is the Debye�H�uckel term� de�ned in Eq� �IX���� index i refers to a reac�tant�product� j stands either for an ionic medium ion with charge sign opposite to thatof i� or for a neutral species� and m is the molality of the ionic medium electrolyte NX�
Example �
The �rst example of an application of both the Pitzer and the SIT methods describes theconcentration dependence of the equilibriumconstant for the reaction CO��aq��H�O�l���H� �HCO�
� in a NaCl medium� In accordance with Eq� �IX��� we have�
lnK� � lnK � ln �H� � ln �HCO�
�� ln �CO��aq� � ln aH�O
The Pitzer approach gives the following statements for the activity coe�cients of thereaction participants at trace concentrations in the NaCl medium�
The ionic strength dependence of BH�Cl and BNa�HCO� is given by Eq� �IX���� the ionicstrength dependence of B�
Na�Cl by Eq� �IX���� and the relation between CM�X and thetabulated Pitzer parameter C�
M�X is given by Eq� �IX����
��
Estimations of Medium E�ects on Thermodynamic Data
As all components are at trace concentrations� except NaCl� the correction for wateractivity can be made using the values of the osmotic coe�cients of pure sodium chloridesolutions from the available tabulation ��ROB�STO�� or calculated on the basis of thePitzer approach� keeping in mind the usual relation between water activity and the osmoticcoe�cient of an electrolyte�
ln aH�O � � �m����
Mw
where Mw is the molar mass of water ������� g �mol��� and � � �The expression for the activity coe�cient of CO��aq� is given by Eq� �IX��� as
ln �CO��aq� � ��CO� �Na � �CO� �Cl�
The required values of all the relevant Pitzer parameters for the system Na��Cl��H��HCO�
� are available in literature from the regression analysis of potentiometric and solu�bility data ��HAR�MOL� ��PIT��
The values of neutral�ion interaction coe�cients involving CO��aq� are given in ��PIT���CO� �Na � ������ �CO� �Cl � ������ However� after recommendation of these values a newstudy on the solubility of CO� in NaCl solutions �HE�MOR� was published� Hence� wedetermined the sum �CO��Na � �CO� �Cl � ����� from all available consistent data on thesolubility of CO� in sodium chloride solutions �HAR�DAV� ��YAS�YOS� �HE�MOR��see Figure IX���The value of K� was taken from the CODATA ��COX�WAG� recommendation�
lnK� � ������ � ����� or log��K� � ����� � ������The calculated values of log��K for the reaction H�O�l� �CO��aq��� H� �HCO�
� us�ing the Pitzer approach �solid lines� are compared with the experimental ones �di�erentsymbols� in Figure IX���� Some experimental data have been reported as log��K for thereaction H�O�l� � CO��g� �� H� � HCO�
� � By combining these values with the Henry�slaw constant for CO� from the CODATA recommendation and the value for the activitycoe�cient of CO��aq� in sodium chloride solutions given above� we obtain a second setof equilibrium constants for the reaction discussed� We should notice that Thurmondand Millero �THU�MIL� have used a quite di�erent equation for the concentration de�pendence of the activity coe�cient of CO��aq�� namely ln �CO� � ��� m � ������ m�
for the interpretation of their potentiometric data� This equation gives a poor �t oflog�� �CO� data above m NaCl� see Figure IX��� Therefore� the equilibrium constantsfrom �THU�MIL� were corrected using the more accurate values of the activity coe��cient of CO��aq� in NaCl solutions�
��
Comparison of the SIT and Pitzer models
Figure IX��� The concentration dependence of log�� � of CO��aq� in NaCl solutions at����� K and � atm� The symbols are the experimental data� the solid line � the regressionusing the sum �CO��Na � �CO� �Cl � ����� �see text�� the dashed line � the approximationused in �THU�MIL��
Many experimental values of log��K refer to the molar concentration scale and theyhave to be converted to the molality scale� The concentrations were converted using thefollowing relationship
mi �����Ci
����� � CiM
where Ci and mi stand for molarity and molality of the dissolved substance i� � is thedensity of the solution and M is the molar mass of the solute� see also Section II��The densities of electrolyte solutions are available in the compilation ��SOH�NOV�� Therelation between equilibrium constants expressed in molarity �Kc� or molality units �Km�is
log��Km � log��Kc �X
� log��m
C
whereP� is here the sum of the stoichiometric coe�cients for the reaction� m and C
stand for molality and molarity of the ionic medium �for the reactions studied at traceconcentrations of the reaction participants�� We will always use the molality concentrationscale and therefore the notation lnK and log��K instead of lnKm and log��Km�
��
Estimations of Medium E�ects on Thermodynamic Data
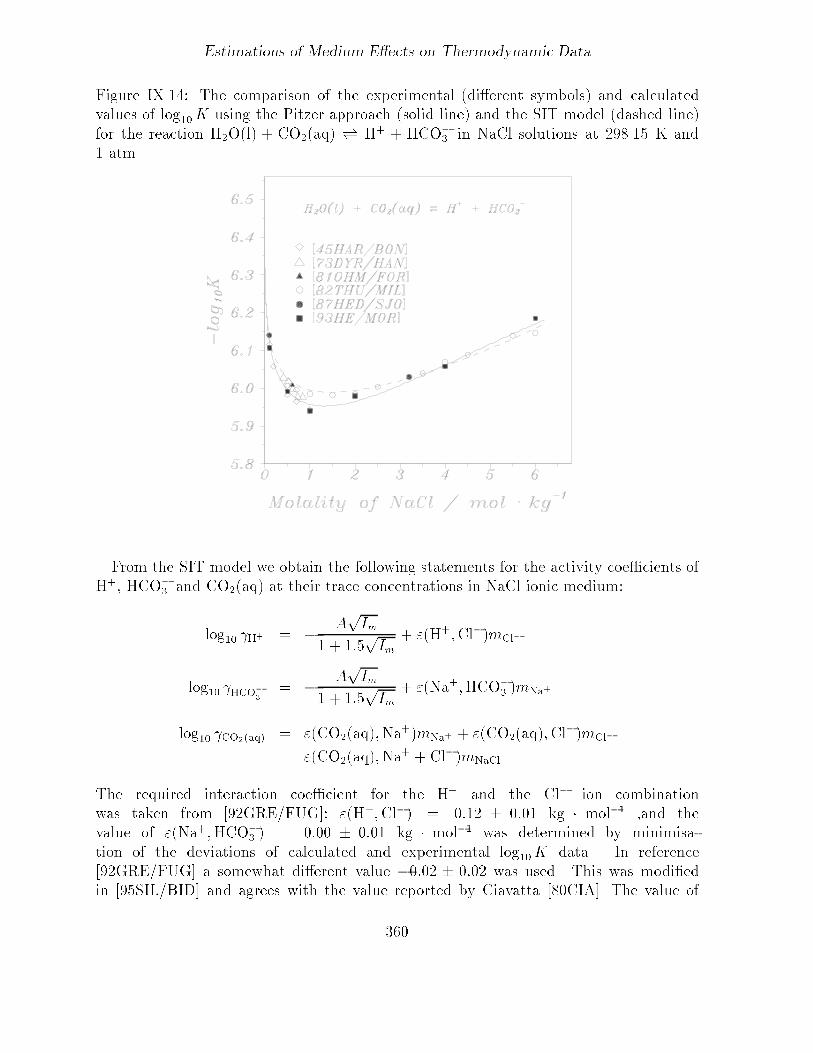
Figure IX���� The comparison of the experimental �di�erent symbols� and calculatedvalues of log��K using the Pitzer approach �solid line� and the SIT model �dashed line�for the reaction H�O�l� � CO��aq� �� H� � HCO�
� in NaCl solutions at ����� K and� atm�
From the SIT model we obtain the following statements for the activity coe�cients ofH�� HCO�
� and CO��aq� at their trace concentrations in NaCl ionic medium�
The required interaction coe�cient for the H� and the Cl� ion combinationwas taken from �GRE�FUG�� ��H��Cl�� � ��� � ���� kg � mol�� �and thevalue of ��Na��HCO�
� � � ���� � ���� kg � mol�� was determined by minimisa�tion of the deviations of calculated and experimental log��K data� In reference �GRE�FUG� a somewhat di�erent value ���� � ��� was used� This was modi�edin ��SIL�BID� and agrees with the value reported by Ciavatta ��CIA�� The value of
��
Comparison of the SIT and Pitzer models
��CO��aq��Na�� � ��CO��aq��Cl�� � ���� kg � mol�� was calculated from the corre�sponding sum �CO��Na � �CO� �Cl values using the relationship ��n� i� � ��n�i� ln����� In �GRE�FUG� this value was assumed to be zero� The values of log��K calculated fromthe SIT model are shown in Figure IX��� by the dashed line�As one can see� the Pitzer model provides better agreement with the experimental data
than the less�parameterised SIT model� Nevertheless� the maximal deviation betweenthe two curves is less than ���� log�� unit� which is close to expected accuracy of theexperimental data� ���� log�� units�An analogous procedure can be used for the description of the concentration dependence
of the second dissociation constant of carbonic acid in a NaCl medium� HCO���� H� �
CO��� � For this reaction we write
lnK� � lnK � ln �H� � ln �CO���� ln �HCO�
�
The analytical equations for the activity coe�cients of H� and HCO�� at trace concen�
trations in the NaCl ionic medium based on the Pitzer approach are given above� and forthe activity coe�cient of CO��
� one can write in accordance with Eq� �IX����
ln �CO���
� �F �mNa�BNa�CO� � mNa CNa�CO��
�mCl� Cl�CO� �mNa �Na�Cl�CO�� � mNamClCNa�Cl
As the charges of CO��� and Cl� co�ions di�er� the interaction parameter Cl�CO� should be
considered to be ionic strength dependent� Cl�CO� � �Cl�CO� �E�Cl�CO��I�� The values of
the term E�Cl�CO��I� at di�erent ionic strength can be obtained numerically� as describedin ��PIT�� Appendix B� The values of the Pitzer parameters used have been taken fromthe literature ��HAR�MOL� ��PIT��
����Na�CO�
� ������ ����Na�CO�
� ����� C�Na�CO�
� ��������Cl�CO� � ����� �Na�Cl�CO� � �������
The value of K� for the second dissociation constant for CO� was taken from theCODATA ��COX�WAG� recommendation� lnK� � ��������� or log��K� � ����������The calculated values of log��K for the reaction HCO�
��� H� � CO��
� � using thePitzer approach �solid lines� are compared with experimental ones �di�erent symbols�in Figure IX���� We should note that the experimental values of log��K in the NaClmedium have not been considered in the evaluation of the Pitzer parameters for theion combinations in the system Na��Cl��HCO�
� �CO��� �H
�� Probably� a small changein the numerical values of mixing terms might improve the quality of reproduction ofexperimental data on the basis of the Pitzer model at high concentrations of NaCl�Using the SIT model we obtain the following equation for the activity coe�cients of
CO��� at trace concentrations in NaCl ionic medium�
log�� �CO���
� � �ApIm
� � ���pIm
� ��Na��CO��� �mNa�
��
Estimations of Medium E�ects on Thermodynamic Data
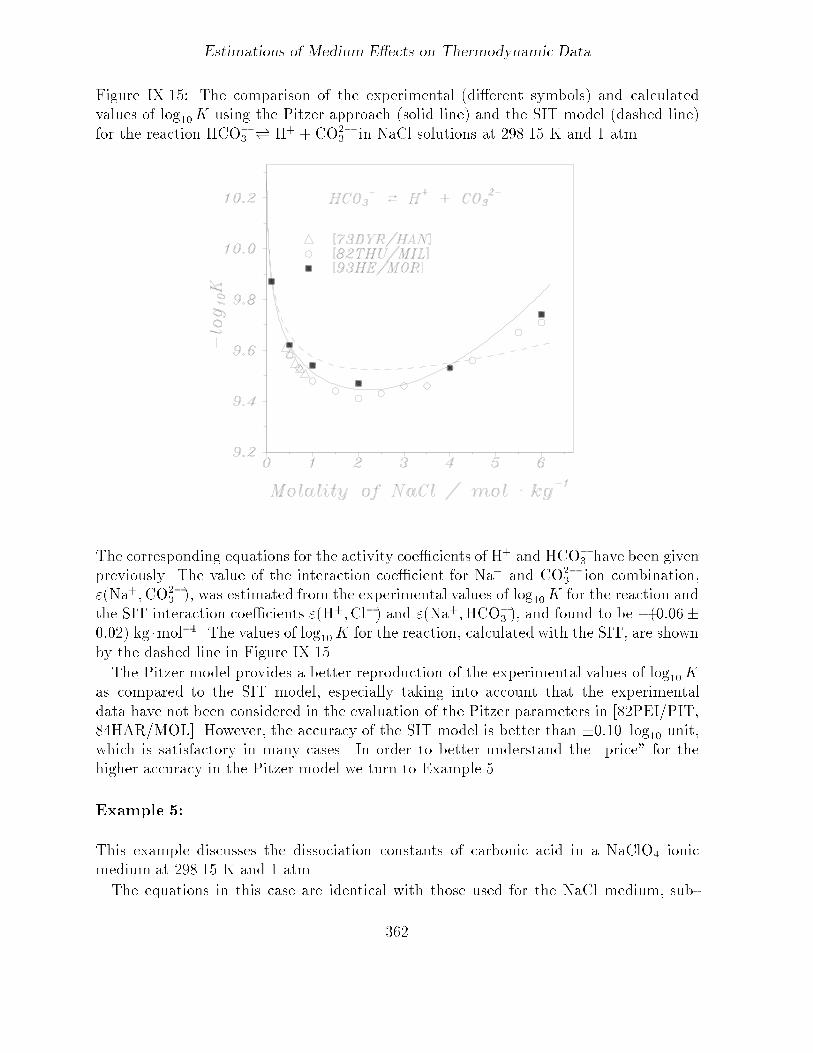
Figure IX���� The comparison of the experimental �di�erent symbols� and calculatedvalues of log��K using the Pitzer approach �solid line� and the SIT model �dashed line�for the reaction HCO�
��� H� � CO��
� in NaCl solutions at ����� K and � atm�
The corresponding equations for the activity coe�cients of H� and HCO�� have been given
previously� The value of the interaction coe�cient for Na� and CO��� ion combination�
��Na��CO��� �� was estimated from the experimental values of log��K for the reaction and
the SIT interaction coe�cients ��H��Cl�� and ��Na��HCO�� �� and found to be �������
���� kg �mol��� The values of log��K for the reaction� calculated with the SIT� are shownby the dashed line in Figure IX����
The Pitzer model provides a better reproduction of the experimental values of log��Kas compared to the SIT model� especially taking into account that the experimentaldata have not been considered in the evaluation of the Pitzer parameters in �PEI�PIT���HAR�MOL�� However� the accuracy of the SIT model is better than ����� log�� unit�which is satisfactory in many cases� In order to better understand the �price� for thehigher accuracy in the Pitzer model we turn to Example ��
Example
This example discusses the dissociation constants of carbonic acid in a NaClO� ionicmedium at ����� K and � atm�
The equations in this case are identical with those used for the NaCl medium� sub�
�
Comparison of the SIT and Pitzer models
stituting Cl� for ClO�� � The di�erence is that for the �rst dissociation constant the
experimental data refer to the reaction CO��g� � H�O�l��� H� �HCO�� � The CODATA
��COX�WAG� recommended value of K� for this reaction is lnK� � �������� ����� orlog��K
� � ������ � ������All the SIT parameters needed are available for the ion combinations in this system�
��H��ClO�� � � ��������� ��Na��HCO�
� � � ��������� and ��Na��CO��� � � ���������
�all in units of kg � mol���� c�f� Tables IX�� and IX�� Hence� the values of log��K forthe �rst and the second dissociation constants for carbonic acid in NaClO� medium maybe predicted� The predicted and experimental values of log��K for the two reactionsare shown in Figures IX��� and IX��� by dashed lines� As one can see� the SIT modelpredicts the values of log��K in NaClO� medium surprisingly well� Indeed� the valuesof log��K for the �rst dissociation constant of carbonic acid are reproduced practicallywithin the expected experimental uncertainty� ����� the deviations between experimen�tal and predicted values of log��K for the second dissociation constant are less than �����The agreement between experimental and calculated values of log��K for both reactionsin the NaClO� medium is better than in the NaCl medium� where the values of the SITinteraction coe�cients ��Na��HCO�
� � and ��Na��CO��� � were determined� This better
agreement in sodium perchlorate is fortuitous� Nevertheless� our experience shows that�in general� the less�parametrised SIT model gives quite reasonable estimations of equilib�rium constants in di�erent media� provided that the necessary interaction coe�cients areknown�For the Pitzer model the values of mixing parameters are not available in literature
for all the interactions in the system Na��H��ClO�� �HCO
In Figures IX��� and IX��� the values of log��K for the �rst and second dissociationconstants of carbonic acid are calculated from the Pitzer model with the available pa�rameters �solid lines�� The di�erence between the experimental and calculated values�with only the two known mixing parameters reported in the literature� is appreciable�especially for the �rst dissociation constant� These examples show the accuracy to expectfrom the Pitzer type of calculations when some mixing parameters are not available� Theprocedure recommended to improve the performance of the Pitzer model is to estimatethe remaining mixing parameters from the di�erences between the calculated and exper�imental values of the constants� This resulted in the following values� �ClO��HCO� � ������ClO��CO� � ����� �Na�ClO��HCO� � ������� �Na�ClO��CO� � �� These estimations are only
�
Estimations of Medium E�ects on Thermodynamic Data
Figure IX���� Comparison of the experimental �di�erent symbols� values of log��K andthe predicted values of log��K using the Pitzer approach for the reaction H�O�l� �CO��g� �� H� � HCO�
� in NaClO� solutions at ����� K and � atm� The solid linehas been calculated using literature values for the mixing terms� the dashed line refersto the SIT model� The dotted line represents the calculation based on the Pitzer modelwith estimated values of the required mixing terms �see text��
preliminary� many more determinations� preferably of better quality� are needed to getreliable values for these parameters� The values of log��K for both reactions calculatedusing all Pitzer�s parameters are shown in Figures IX��� and IX��� by dotted lines� As ex�pected� the additional parameters strongly improve the performance of the Pitzer model�
These examples demonstrate the di�erence between the two models considered�
� The SIT uses the minimal number of regression parameters� The devia�tions between experimental and �tted values of log��K are usually within���������� log�� unit� Such deviations are expected� because the uncertainty ofthe values of mean activity coe�cients� log�� �� for strong ���� ��� �� electrolytesis usually within �������� log�� units� when calculated from this model� This al�lows a reasonable extrapolation of log��K values in di�erent ionic media� if therequired SIT interaction coe�cients are known� Hence� using the data from thesodium chloride medium� we could predict the values of equilibrium constants forthe same reactions in solutions of sodium perchlorate� practically with the sameaccuracy as in the NaCl medium� The accuracy of the SIT model does not permitthe reproduction of the concentration dependence of the more precise data� to whichthe dissociation constants of carbonic acid belongs� The number of such examplesis limited to the relatively simple chemical systems which can be studied without
��
Comparison of the SIT and Pitzer models
Figure IX���� Comparison of the experimental �di�erent symbols� and the predictedvalues of log��K using the Pitzer approach with the available data from the literaturevalues of the mixing terms �solid line� and the SIT model �dashed line� for the reactionHCO�
��� H� � CO��
� in NaClO� solutions at ����� K and � atm� The dotted linerepresents the calculation based on the Pitzer model with estimated values of the requiredmixing terms �see text��
serious experimental di�culties� where the speciation is known� the number of com�plexes formed is limited� and where it is possible to �nd the conditions under whichthe studied complex is the main species in solution� etc� The precision and accu�racy of experimental equilibrium constants for metal ! ligand systems is in generalmuch smaller than that of simple protolytes� like carbonic acid� This issue will beconsidered in the following Section�
� The Pitzer model� which was developed for the description of the concentration de�pendence of very accurate activity coe�cient and osmotic coe�cient data� is ableto reproduce the precise values of log��K practically within experimental accuracy�provided that the numerical values of all the relevant parameters are available� Ifthe values of a number of parameters are unknown� the quality of the data repro�duction and the predictions are much poorer and comparable with the accuracy ofthe SIT approach� The large number of parameters in the Pitzer model and theirstrong interrelations and correlations makes it di�cult to use this model in systemswhere complex formation takes place� especially if some parameters have to be de�termined from concentration equilibrium constant data� By using a large numberof �tting parameters in the Pitzer model it is possible to describe very precise emfor isopiestic data for many ternary systems� e�g�� MeCl��HCl�H�O without consid�
��
Estimations of Medium E�ects on Thermodynamic Data
eration of complex formation at all� provided that the extent of complex formationis not large� However� for a solution coordination chemist it is essential to havecorrect information about the constitution of the complexes formed� because thisdetermines important properties of a metal in solution such as chemical reactivity�toxicity� adsorption etc� The real speciation is important in many technologicalprocesses� for instance� the formation of negatively charged chloride complexes ofcobalt in concentrated chloride solutions is used for the separation of nickel andcobalt� Progress in the understanding of chemical processes in solutions requiresknowledge of their chemistry� i�e�� their real speciation % Therefore� one must notuse an extensively parametrized Pitzer model as a �substitution� for knowledge ofthe detailed chemistry� even if this model is excellent for describing the thermo�dynamic observations� However� it is desirable to extend the Pitzer formalism toall types of complex formation reactions and to obtain experimental values of therequired Pitzer parameters for complexes� Such determinations must be based onexperimental concentration equilibrium constants in di�erent ionic media� whichrequire an extensive experimental e�ort� even though a very large amount of sta�bility constants for complex species have already been accumulated during the past��� years ��SIL�MAR� ��SIL�MAR� �HOG�� The problems will be described anddiscussed in the following section�
IX����� The determination of the Pitzer and the SIT parameters from the log��K data
Our primary goal is the description of the concentration dependence of equilibrium con�stants� since most data on the thermodynamics of complex formation reactions are re�ported in this way� The existing log��K data have the following characteristics�
� The equilibriumconstants have� as a rule� been obtained in a constant ionic medium�As discussed in the Introduction �p���� the use of high concentrations of supportingelectrolyte is a convenient and widely accepted method to establish a unique chemi�cal model of a system under study� The log��K data are not equally distributed onthe ionic strength�concentration scale� Usually the experimentally covered intervalis between ��� and � mol �kg��� The high molality of the ionic medium as comparedto the concentrations of reactants�products ensures nearly constant values of theactivity coe�cients of the reaction participants even for reasonable variations of thetotal concentrations of reactants� products�
Note� When equilibrium constants are determined using the emf�technique one mustknow or estimate liquid�junction potentials� However� by using a constant ionicmedium the variations of the liquid�junction potential with the composition of thesystem are small�
� Relatively few experimental determinations� often less than �� data points� arereported in the literature for a particular reaction in a particular ionic medium�
��
Comparison of the SIT and Pitzer models
� The accuracy of the log��K data is often much smaller than the precision of indi�vidual measurements� a fact which deserves a separate comment�
One has to distinguish between the reproducibility of the determination of the con�stant for given experimental conditions� with a particular experimental method� andan accepted chemicalmodel and the accuracy of log��K� As stated in ��BEC�NAG�p���� �the true error in the stability constants can be estimated with a high de�gree of certainty only through the comparison of constants obtained with methodsdi�ering in basic principles� or of constants obtained in independent laboratories��and �agreement within ����� log�� unit is classi�ed as very good agreement� evenin systems that can be studied experimentally without di�culty�� This means thatthe log��K data are ����� times less accurate than the values of mean activitycoe�cients or osmotic coe�cients� which often have an accuracy better than ��� percent� This important fact should be kept in mind when discussing the determinationof the Pitzer parameters for a reaction from the log��K values�
The analytical statement for the concentration dependence of the equilibrium constantfor a general chemical reaction
Xi
�iQi � rH�O�l� � � �IX���
for the Pitzer model is given by Eq� �IX���� which is valid for constant ionic mediumNX� where NX is an ��� electrolyte� and for the trace concentrations of the reactionparticipants� For the purposes of a regression it is convenient to rewrite this equation asfollows
lnK� � lnK � r ln aH�O �#�Z���f� �m�B �
NX
��m�#jZjCNX � mX�
� mg�Im�X� � m�X� �IX���
where m stands for the molality of the supporting NX electrolyte� and
#�Z�� �Xi
�iZ�i
#jZj �Xi
�ijZij
X� � #���� �# �Xi
�i����ij �
Xi
�i ii�
X� � #���� �Xi
�i����ij
X� � #C ��
#� �
Xi
�iCij ��
Xi
�i�ii�j
and g�Im� is de�ned in Eq� �IX���
��
Estimations of Medium E�ects on Thermodynamic Data
Eq� �IX��� is the general equation to be used if we want to determine log��K� and the
sum of the Pitzer parameters for reactants and products from experimental equilibriumconstants at di�erent ionic strengths� The second� third and fourth terms on the righthand side of Eq� �IX��� can be calculated from the known Pitzer parameters for the ionicmedium NX� The equation shows that the coe�cients for the other terms in m and m�
contain #���� and # � and #C and #�� respectively� Hence� it is not possible to obtainthe individual Pitzer parameters #���� and #C from this equation alone� Pitzer ��PIT�points out� that in most cases the mixing parameters are small and may be neglected�hence� X� � #���� and X� � #C is a reasonable approximation� The main di�culty isstill to determine the parameters X�� X�� X� �as well as lnK�� from a limited numberof experimental concentration constants� log��K� which rarely have a high accuracy� asindicated by the previous discussion� In order to use the Pitzer equations in systems wherecomplex formation takes place� it therefore seems necessary to make some simpli�cations�A check of the typical values of C� from ��PIT� showed that the contribution of #Cis signi�cant only at high ionic strength� typically above ��� mol � kg��� and that thisterm could be neglected at lower ionic strengths� Another simpli�cation was proposed byMillero �MIL�� who assumed the value ���� � � for complexes� The validity of thesetwo simpli�cations will be checked below�The corresponding analytical statement for the concentration dependence of log��K
for the reaction �IX��� at trace concentrations of reactants�products in a NX electrolytemedium using the SIT equation is given by Eq� �IX���� and can be rewritten as follows�
log��K� � log��K � r log�� aH�O �#�Z��D �m#� �IX��
where D is the Debye�H�uckel term� de�ned in Eq� �IX���� m stands for the molality ofthe ionic medium� the ��� electrolyte NX� and
#�Z�� �Xi
�iZ�i
#� �Xi
�i ��i� j�
see Eq� �IX��� for further explanations� After correction for the water activity and theDebye�H�uckel contribution� the SIT equation becomes a simple linear function of themolality of the ionic medium�We will use the literature data of log��K for some selected reactions for the parametriza�
tion of both the models discussed� The main questions are�
� The reliability of log��K� �i�e�� the thermodynamic constants� obtained by a regres�sion� Therefore� we use the experimental data for the reactions� for which CODATArecommendations ��COX�WAG� are available� see Examples � and �� For the reac�tions selected� the log��K data from solutions of high ionic strength have not beenconsidered when making the CODATA recommendations�
� The typical uncertainty in the �tting parameters� which is decisive for the possibilityto determine the Pitzer or the SIT concentration parameters from a limited numberof experimental points of limited accuracy�
��
Comparison of the SIT and Pitzer models
Table IX��� Equilibrium constants for the dissociation of water in KCl solutions at����� K�
For the regression we use the weighted general linear regression method as outlined in ��SHC�� The weight � of an experimental point was de�ned as � � ���� where � is anestimated uncertainty of log��K value�
Example �
This example is a simple chemical reaction� H�O�l� �� H� � OH� where precise ex�perimental data in KCl media at ����� K are available� After recalculating the experi�mental data of log��K� quoted from the �Stability constants� compilations ��SIL�MAR���SIL�MAR� �HOG�� to molality units and correcting for the water activity log�� aw thevalues given in Table IX�� were obtained�The results of the regression are presented in Table IX�� and in Figure IX���� The
following methods to estimate the Pitzer parameters are discussed�
I� the determination of the whole set of parameters log��K�� X�� X�� X��
II� the determination of log��K�� X�� X�� i�e�� neglecting the contribution of all ternary
interactions�
III� the determination of log��K�� X�� X�� i�e�� assuming ���� � � for all reaction par�
ticipants as suggested in �MIL��
IV� the determination of log��K�� X�� i�e�� using the smallest possible number of pa�
rameters in the Pitzer model�
��
Estimations of Medium E�ects on Thermodynamic Data
Figure IX���� The parametrization of the SIT and di�erent variants of the Pitzer models�see text for details� for the reaction H�O�l� �� H� � OH� in KCl medium at ����� Kand � atm�
The symbol ��� in Table IX�� means that this parameter was set equal to zero in thedata �tting� All uncertainties are given as ��� where � is the mean square error ofan unknown ��SHC�� �True� values of the parameters X� � X� were calculated fromtabulated values of ����� ����� and C for KOH and HCl� as well from and � for binaryand ternary ions interactions� between H�� K� and OH�� Cl�� H�� K�� Cl�� and OH��Cl�� K� respectively ��PIT�� In accordance with Eq� �IX���
X� � #���� �#
� ����H�Cl � �
���K�OH � �H�K � �Cl�OH
� ������ � ����� � ����� � ������ ����
X� � #����
� ����H�Cl � �
���K�OH
� ���� � ���
� ������
��
Comparison of the SIT and Pitzer models
Table IX��� Regression results of data in Table IX�� following procedures described in thetext� The data in italics have been obtained by omitting three experimental determina�tions that may be in error�
The parameters of the SIT and the Pitzer �variants I�IV� models
The �correct� value of log��K� was assumed to be that recommended by CODATA
��COX�WAG��In addition� we tested the possibility of determining the values of the Pitzer parameters
for the data set� using the CODATA value of log��K� as a �xed parameter� and obtained
X� � �� � ���� X� � ���� � ����� and X� � ����� � ����� The parameter X�
is very uncertain and we therefore also tested a re�nement involving only X� and X�
and obtained ���� � ����� and ���� � ��� respectively� The second model is in fair
��
Estimations of Medium E�ects on Thermodynamic Data
agreement with the �accepted� values� By using Eq� �IX��� in p�� and the averagevalue X�#�Z�� � ��� � ����� from Table IX��� p���� we obtain X� � ���� � ��� ingood agreement with the �accepted� value ����
We also determined the value of log��K� from the experimental values of log��K using
the �accepted� values of the Pitzer coe�cients� Of � experimental values� �� lie in theinterval ������ � ���� and only two values �at ��� mol � kg��� show a large systematicerror� with values of log��K
� equal to ������ and ������� respectively� This indicatesthat the real accuracy of most of these data is within ���� log�� units� However� twoexperimental determinations should be classi�ed as discrepant� When these values areexcluded from the data set� one obtains a signi�cant reduction in the uncertainty of theestimated parameters� and much better agreement with the �accepted� values �includingthe CODATA value for log��K
��� these data are shown in italics� A problem facingthe evaluators of published thermodynamic data is the lack of all needed experimentaldetails and often primary experimental data �e�g�� emf� solubility or absorption data� inthe original publication� This makes it very di�cult to detect data that are �awed� Theconsequences are obvious from Example � %The reduced versions of the Pitzer equation �variants II�IV� are much less sensitive for
erroneous data� presumably due to the smaller number of �tting parameters� However�there is a noticeable increase in the estimated uncertainty� This example indicates that theuncertainty in Pitzer parameters determined from equilibrium constants are likely to befairly large �of the same magnitude as the Xi� even in cases where log��K
� is assumed tobe known� the determination is also strongly a�ected by even a small number of erroneousexperimental data�
Example �
This example refers to the determination of log��K� and the Pitzer or the SIT parameters
from the experimental values of log��K for the �rst protonation constant of the sulphateion H� � SO��
��� HSO�
� studied in NaClO� medium� Only the results obtained from apotentiometric method have been used� The experimental data� quoted from �StabilityConstants� compilations ��SIL�MAR� ��SIL�MAR� �HOG� and from more recent work ��SAP�PAT� recalculated into molality units and to ����� K where necessary� are givenin Table IX���For this reaction one has to take into account the ionic strength dependence of the
electrostatic unsymmetrical mixing term E�ClO��SO��Im�� This was made as recommendedin ��PIT�� Appendix B� The results of the regression are given in Table IX�� and in Fig�ure IX���� The same models for the estimation of the Pitzer parameters as in Example �are discussed�
I� with determinations of the whole set of parameters log��K�� X�� X�� X�� and sim�
pli�ed variants�
II� with determinations log��K�� X�� X��
�
Comparison of the SIT and Pitzer models
Table IX��� Equilibrium constants for reaction H��SO���
All uncertainties are given as �� �Accepted� values of the parameters were calculatedonly from the values of ����� ����� C for NaHSO�� Na�SO�� and HClO� ��PIT�� The pa�rameters for binary and ternary interactions of ClO�
� with HSO�� and SO
��� are unknown�
but the possible e�ect of neglecting them is probably within the proposed uncertainties ofthe �accepted� values� The �accepted� value of log��K
� was chosen to be the CODATA ��COX�WAG� recommendation�The two examples discussed refer to very simple acid�base equilibria� which can be stud�
ied without major experimental di�culties� In addition� a large number of experimentaldeterminations have been reported for each of these reactions� � for the �rst and �� forthe second� In both cases the experimental determinations have also been carried out atrelatively low ionic strength� ���� mol � kg��� that facilitates the regression analysis�The examples considered allow us to conclude that the simple one�parameter SIT model
reproduces the experimental data very well� It also results in a reliable determination oflog��K
� with small uncertainties in the parameters evaluated �for both reactions thevalues of log��K
� are in excellent agreement with the CODATA recommendations�� The
��
Comparison of the SIT and Pitzer models
problems encountered when using the Pitzer model are clearly demonstrated in bothexamples� All re�nementmodels allow a precise data interpolation� however� the estimatesof log��K
� and the values of the coe�cients Xi di�er fairly much� Determination of thecomplete set of constants results in very large uncertainties �variant I�� Of the other modelsonly II which includes X� �� #����� and X� �#����� can be recommended� provided thatthe ionic strength is not too high �the estimation of X� �� #C� seems only to be possibleif reliable values of log��K are available at ionic strengths above ��� mol�kg���� The valueof X� estimated using Eq� �IX��� in p�� is equal to X� � ��������� in fair agreementwith the �true� value in Table IX��� The models III �assuming X� � #���� � �� and IVgive unreliable estimations of the parameters and should be avoided�Model IV �with the determination of log��K
� and X� � #����� deserves a more detaileddiscussion due to its formal similarity to the SIT model� The single�ion activity coe�cientfor an ion� i� in the SIT model is�
ln �i � DH�term�Xj
���i� j�mj
while the corresponding quantity for a metal ion� M� using the simpli�ed one�parameterPitzer equation is�
ln �M � DH�term� Xa
����Mama
where �DH�term� denotes the Debye�H�uckel term� Formally� both expressions are equiv�alent� However� the two models use quite di�erent forms of the Debye�H�uckel terms�The electrostatic contribution to the activity coe�cient of an ion in the Pitzer theoryis larger than in the SIT model and has a quite di�erent concentration dependence� seeFigure IX���It is important to observe that� in the Pitzer theory� the short�range contributions
cannot be represented by a linear function of the concentration� To illustrate this point�we have plottedy Y � ���� � �������Im� � � �� � �
pIm � ��Im� exp���
pIm�� versus
concentration for ��� �curve a in Figure IX��� and �� electrolytes �curve labeled b�� usingrather typical values of ���� and ����� ����� and ���� and ����� and ����� respectively� for��� and �� electrolytes� From these curves it is obvious that the approximation of aconstant value of Y results in an erroneous estimation of both log��K
� and �����As a matter of fact� the introduction in explicit form of an ionic strength dependence
of the parameter for binary interactions was one of the principal innovations in the Pitzerequations� see �PIT� ��PIT�� The problem is even more obvious if one compares thequality of reproducing experimental data of �� for some chlorides at ����� K in a limitedionic strength range ��� mol � kg��� using the SIT and the reduced Pitzer equation withonly the ���� term� In Figure IX� we have plotted the experimental �full drawn lines�and �tted values of mean activity coe�cients of NaCl� MgCl�� and NdCl� by using theSIT model �dashed lines� and the reduced Pitzer model �dotted lines�� Two points shouldbe noted�y � � ��� kg��� �mol���� for all three electrolytes� cf p���
��
Estimations of Medium E�ects on Thermodynamic Data
Figure IX��� The relative contributions of the Debye�H�uckel term to ln �� for the SITand the Pitzer models at ����� K and � atm�
Figure IX��� The concentration dependence of function Y � ����� �������Im� �� �� ��pIm���Im� exp���
pIm�� for the typical ��� �curve labeled as a� and �� electrolytes
�curve labeled as b� at ����� K and � atm�
��
Comparison of the SIT and Pitzer models
Figure IX�� The comparison of the quality of the reproduction of experimental data ofmean activity coe�cients for di�erent electrolytes �solid lines� at ����� K using the SITmodel �dashed lines� and the Pitzer model containing only the ���� term �dotted lines��
� The obtained values of ���� always di�er from the �true� ones� For instance� forNaCl the obtained value of ���� is equal to ����� as compared with ������ from ��PIT�� for MgCl� the value �
��� � ����� as compared with �true� value ���� forNdCl� ���� � ���� as compared with ������ The noticeable increase in the value of���� obtained in this way is an inevitable consequence of neglecting the contributionof the ���� term� The higher the valence type of the electrolyte� the larger the errorintroduced in the ���� value�
� The accuracy of data reproduction is much poorer when using the one�parameterPitzer model than in the one�parameter SIT model� We may compare the mean andmaximum errors �de�ned as ��� �calc�exp�� using both approaches� for NaCl theyare � and ��"� in the reduced Pitzer model� and ��� and ��" in the SIT model�for MgCl� the corresponding numbers are �� and ��" in the reduced Pitzer modeland ��� and ��" in the SIT� for NdCl� �� and " in the reduced Pitzer model�and ��� and �" in the SIT model�
This comparison of the mean activity coe�cient data �which are supposed to be veryprecise� by means of the one�parameter Pitzer and SIT models clearly demonstrates theproblems of reducing the number of parameters in the Pitzer approach� neglect of thecontribution of the ���� term in the Pitzer model results in a signi�cant loss of accuracy
��
Estimations of ionic strength corrections of thermodynamic data
in the data reproduction �as compared with the SIT model� and a wrong estimate of the���� term� Hence� the Pitzer equation in general has to be used with both the ���� and���� terms� Returning to the concentration dependence of complex formation reactions�we emphasise that in order to determine both X� and X�� it is necessary to have precisedata on log��K at rather low ionic strengths� less than ��� mol � kg��� where the relativecontribution of ���� is largest� The di�culty to determine ���� is most pronounced forreactions where the ions have a charge ��� for which the uncertainty in log��K mustbe far less than ����� in order to determine both parameters� The determination of thePitzer parameters for complexes is an important� but far from simple task� In systems withfew experimental data� one is forced to use approximations when determining log��K
�
and the Pitzer parameters� We recommend the correlation methods described below inSections IX�� and IX����� which are to be preferred to simplistic �procedures� such as� �Ifthe data are restricted� just limit the number of parameters used in the Pitzer model��
IX��� The relationship between the SIT ��i� j� and the Pitzer ����ij and �
���ij
parameters for mean�activity coe�cients
The previous sections indicate some di�culties that may be encountered when using thePitzer model for the description of the concentration dependence of equilibrium constantsin electrolyte systems of high ionic strength� The problem is the lack of experimen�tal Pitzer parameters for complexes� while they are often available for the reactants ifthese are metal ions and simple ionic ligands� This means that the activity coe�cientsof these species can be calculated even in rather complicated systems� like mixtures ofstrong electrolytes� A modeller might then wish to combine known information for thestrong electrolyte mixture with experimental information on equilibrium constants fortrace components using the Pitzer formalism� In order to do this it will be necessary tomake approximations� and some of these will be discussed in the following two sections�
An analysis of the values of ���� at ����� K from the available compilation ��PIT�shows that there is a correlation between the values of ���� and the charge type of theelectrolyte� for most ��� electrolytes the values of the ���� parameter fall in a range��� � ���� for most �� electrolytes in the range ��� � ��� and for most �� electrolytesin the range �� � ��� These averages may then be used as ��xed� values of ���� in thePitzer equations� thus reducing the number of unknown parameters� A better estimate of���� is obtained by using the following simple relationship between the Pitzer parameters���� and ���� and the �� parameters� which is valid when the term with C�
MX may beneglected� The Pitzer equation for the mean�activity coe�cient is then equal to�
ln �� � �jZMZXjA�
� pIm
� � bpIm
�
bln�� � b
qIm
��m
�M�X�
����� � ����X
�
where
X ��
��Im
�� �
�� � �
qIm � �
��Im
�e��
pIm
�
��
Relationship of parameters in the SIT and Pitzer models
Table IX��� Quantitative relationship between the Pitzer parameters ���� and ���� andthe SIT �� parameters for di�erent ion combinations at ����� K�
Ion combination����� � ����
�����
M�� X� ����� ���� � ���M��� X� and M�� X�� ����� ��� � ��M��� X� and M�� X�� ��� ��� � ���M��� X� and M�� X�� ����� � � �
From the SIT model we have �taking into account that A� � A��
ln �� � �A�jZMZXjpIm
� � ���pIm
� �M�X�
��m
After elementary transformations we obtain
Y � �A�jZMZXj �� �M�Xm
�pIm
� � ���pIm
�pIm
� � bpIm
�
bln�� � b
qIm
�
������� ��
�� ����X �IX��
The values of X and Y can be easily calculated� and Y should be a linear function of Xwith the intercept ������ ��� and the slope ����� The quality of linearity is the criterionof the compatibility of the Pitzer and the SIT models� Figures IX�� IX�� and IX��show plots of Y vs� X for di�erent MZ� and XZ� combinations� The linearity is good�showing that the SIT model is approximately equivalent to a simpli�ed Pitzer model�without the C�
MX term� and results in a constant value of the ���� parameter for each
charge type� Table IX�� summarises the relationships between the two sets of parameters�
Note� Usually the values of ��i� j�� not ���i� j� are tabulated� and the relationship betweenthem is� ��i� j� � ���i� j� ln�����
The values of the parameter ���� are in reasonable good agreement with the values tabu�lated for individual electrolytes �see above�� Using these values one obtains approximatelythe same accuracy of the reproduction of �� values with both models� This approximationallows a good estimate of the ���� parameter for di�erent ion combinations� For a moredetailed discussion of the concentration dependence of the second virial coe�cient for so�lutes� see the discussions in �PIT� ��PIT�� In principle� the same procedure may be usedto estimate the temperature dependence of the ���� parameter� because the temperature
��
Estimations of ionic strength corrections of thermodynamic data
Figure IX�� The determination of quantitative relationship between the parameter ��in the SIT model and the parameters ���� and ���� in the Pitzer model for the case of ���completely dissociated electrolytes at ����� K and � atm� X and Y are de�ned in thetext� The circles denote data which have been calculated from Eq� �IX���
Figure IX��� The determination of quantitative relationship between the parameter ��in the SIT model and the parameters ���� and ���� in the Pitzer model for the case of ��or �� completely dissociated electrolytes at ����� K and � atm� X and Y are de�ned inthe text�
��
Relationship of parameters in the SIT and Pitzer models
Figure IX��� The determination of quantitative relationship between the parameter ��in the SIT model and the parameters ���� and ���� in the Pitzer model for the case of ��or �� completely dissociated electrolytes at ����� K and � atm� X and Y are de�ned inthe text�
dependence of A� is well known ��ARC�WAN�� provided the value of numerical factor��� used in the SIT model is temperature independent� In Figure IX�� we have plottedthe calculated values of ���� for ��� and �� electrolytes versus temperature� at saturatedwater vapor pressure �solid lines� and compared them with �experimental� values forNaCl� NaBr� and MgCl� from available compilations� The semiquantitative agreement isobvious�
The previous relationships between the SIT and the Pitzer parameters may be usedto convert the ��i� j� values for the SIT model into �
���ij and �
���ij values of the Pitzer
approach� and vice versa� A similar relationship may also be obtained between #� and#���� and #���� for reactions� It is more convenient to estimate the Pitzer parametersX� and X� directly from the experimental values of #� than to use estimates of all theindividual ����ij and ����ij values for the reactants�products�
Example �
Let us consider the estimation of the Pitzer parameters for the interaction Fe���ClO�� �
In �GRE�FUG� the value of the SIT interaction coe�cient ��Fe���ClO�� � � ����� �
���� kg � mol�� is given� as estimated from the available information by Biedermann ��BIE�� Using the correlation proposed above one may estimate the Pitzer parametersFe���ClO�
Estimations of ionic strength corrections of thermodynamic data
Figure IX��� The comparison of �predicted� �see text for details� and �experimental�values of the ���� parameter as a function of temperature at saturated water vapor pres�sure�
����� kg �mol��� ���� � �� kg �mol���
Example �
Let us consider the estimation of the Pitzer parameters for the interaction Bi���ClO�
� � Only a few sets of measurements are available in literature� For the reac�tion BiOCl�cr� � H� �� Bi�� � Cl� � H�O�l� the values of log��K have been ob�tained by Ahrland and Grenthe ��AHR�GRE� from solubility and potentiometric mea�surements in mixture � M HClO� � � M NaClO� and by Vasil�ev and Grechikhina ��VAS�GRE� from solubility measurements in HClO� solutions of concentrations ������ M� Using the SIT model to treat these data one obtains the following estimationsof the SIT interaction coe�cient ��Bi���ClO�
� � � ����� � ���� kg �mol��� For the reac�tion BiOBr�cr� � H� �� Bi�� � Br� � H�O�l� the values of log��K have been reportedby Ahrland and Grenthe ��AHR�GRE� and by Fedorov et al� ��FED�KAL� from thesolubility of BiOBr�cr� in HClO��LiClO� mixtures of di�erent constant ionic strengths be�tween ��� and � M� The SIT results in the value of ��Bi���ClO�
� � � ����������� kg�mol���Vasil�ev and Grechikhina ��VAS�GRE� have measured the solubility of BiONO��cr� inHClO� solutions of concentrations between ��� and ��� M and obtained the valuesof solubility product of the solid phase after a correction for the formation of nitratecomplexes of Bi�III�� From these data the value of ��Bi���ClO�
� � was estimated to be
�
Relationship of parameters in the SIT and Pitzer models
���� � ����� These examples illustrate typical uncertainties in the estimation of inter�action coe�cients from a small number of data from di�erent laboratories� The meanvalue ��Bi���ClO�
� � � ����� � ����� kg �mol��� is in reasonable agreement with the cor�responding quantities for the lanthanoids� which have the charge and very similar ionicradii� Using the correlation proposed above we obtain for the Bi���ClO�
� interaction thefollowing preliminary values of the Pitzer parameters� ���� � ����� � ����� kg � mol������� � �� kg �mol���
IX����� The relationship between the #� values in the SIT model and the #���� and#���� values in the Pitzer models for complex formation reactions at trace�concentrations of reactants�products
By neglecting the contribution of all the ternary interactions� and excluding higher orderelectrostatic unsymmetricalmixing terms in the Pitzer equation we can write the followingstatement for the ionic medium dependence of lnK�
lnK� � lnK �#�Z��A�
� pIm
� � bpIm
�
bln�� � b
qIm
�
�#�Z��m�B�NX � mX� � mg�Im�X�
See Eq� �IX��� for explanations� The consequences of excluding the higher order electro�static unsymmetrical mixing terms will be discussed later� The corresponding analyticalstatement for the concentration dependence of lnK using the SIT formalism is�
lnK� � lnK �#�Z��A�
pIm
� � ���pIm
�m#��
See Eq� �IX�� for the explanation of abbreviations� Note again that A� � A� and#� � #�� ln����� After elementary transformations we obtain�
Y �
A�
� pIm
� � bpIm
�
bln�� � b
qIm
��
pIm
� � ���pIm
�m�B�
NX
� m
��
#�Z��
�X� � #��
��
X�
#�Z��g�Im� �IX���
i�e�� Y is a linear function of g�Im�� where the slope is X�#�Z�� and the intercept�X� �#���#�Z��� In order to calculate the values of Y one has to know the Debye�H�uckel parameter A� and B�
NX� i�e�� ���� for the ��� ionic medium electrolyte� these
data are available� The values of g�Im� are obtained from the ionic strength of thesolution� The quality of the linearity will be a criterion of the compatibility of the SITmodel and the simpli�ed Pitzer equation� In Figure IX�� we have plotted the values ofY calculated for reactions in some common ��� ionic media� The linearity is good for
�
Estimations of ionic strength corrections of thermodynamic data
Figure IX��� The determination of relationship between the SIT parameter #� andthe Pitzer parameters #���� and #���� for reactions studied in solutions of di�erent ���ionic medium electrolytes at ����� K and � atm �see text for details�� The symbols arecalculated values of Y versus g�Im� using Eq� �IX��� for the di�erent ionic media�
Table IX��� Relation between the Pitzer and the SIT parameters for the complex forma�tion reaction studied in di�erent ��� supporting electrolytes at ����� K�
Relationship of parameters in the SIT and Pitzer models
all electrolytes considered� The optimal values of the parameters �X� � #���#�Z��and X�#�Z�� can be determined for each electrolyte �see Table IX���� However� theparameters� especially the slope of the line� which is related to X�#Z� or #���� for thereaction �see Table IX��� do not vary much with the nature of electrolyte� Hence we canuse all the data to determine one unique set of parameters� �see the last line of Table IX��where the uncertainties are given as ��� Because of the di�culty of making an accuratedetermination of #���� using regression analysis of log��K data� cf� Examples � and ��we suggest that an alternative is to use the proposed correlation to estimate #���� �and���� for complex species if these values for single ions are available already�� For instance�for the Example � one estimates the value of X� � ���� � ����� #�Z�� � ���� ������� � ����� ���� which is rather close to the �true� X� � ��� �the most reliableestimation using regression of the data set without erroneous points gives ����� ���� seeTable IX�� in Example ��� For the Example � the estimated value using the proposedcorrelation is X� � ���� � ������ #�Z�� � ���� � ������ ���� � ���� � �����This result is only in fair agreement with the �true� X� � ������ However� the valuefrom the regression has very large uncertainties� X� � ���� � ��� from Table IX�� inExample ��The analysis must be modi�ed for the case of reactions where #�Z�� � �� It is possible
to show that in this case the following relationship is valid at any molality�
�X� � #��
��X� g�Im� � �
Because the �rst term is constant� and g�Im� is a monotone function of the ionic strength�this equality is only possible if �X� �#��� and X� both are equal to zero�The relationship discussed was obtained by neglecting the contribution of the terms for
higher order electrostatic unsymmetrical mixing� By including these terms the slope ofthe function Y is changed somewhat� particularly for ions of charge � or higher� However�for this type of reactions the problem to determine the contributions of the ���� and ����
terms is not severe� because of the large absolute values of ���� for interactions involvingions of high charges� We therefore suggest that the correlation between #�Z�� and #����
should only be used for reactions involving ions with absolute charges �� and ��Summing up the discussion about the determination of the Pitzer parameters for a
reaction from log��K data� we conclude that this� as a rule� is an ill�conditioned problem�To obtain reasonable estimates of the parameters in the Pitzer model from few experimen�tal data of limited accuracy� one has to use some simpli�cations� From our experience�the existing log��K data rarely permit the determination of more than one interactionparameter� Therefore� we suggest the following strategy when using the log��K data insolutions of an ��� ionic medium�
� Step �� use the SIT equation to obtain log��K� and #��
� Step � if the reaction involves ions with charges � and � then use the #�Z�� valuefor the reaction to estimate the values of X� and X� for the reaction� This estimate
��
Estimations of ionic strength corrections of thermodynamic data
of X� is preliminary� a more accurate value is then determined in a new regressionusing log��K
� from step � and X� determined from #� as �xed parameters� Forreactions involving ions with charges and higher it is su�cient to use only log��K
�
from step � as a �xed parameter and then determine X� and X� in the regression�
If the values of the Pitzer parameters for single ion reactants�products are known� onecan proceed to determine the corresponding coe�cients for the complexes in the followingway�
� Use the SIT equation to obtain log��K� for the reaction�
� Use the Pitzer interaction coe�cients for single ions� the known values of binaryand ternary mixing terms for interactions involving single ion reactants�productsand the ions of the ionic medium� and log��K
� value as �xed parameters in theregression analysis to obtain ���� and ���� for the complexes� If the charge of thecomplexes does not exceed � estimate X� from the #�Z�� value for the reaction�followed by the calculation of ���� for the complex species� Then use the regressionanalysis to obtain ���� for the complex using log��K
� and X� as �xed parameters�
All terms� including m�#jZjCNX �see Eq� �IX���� and higher order electrostatic un�symmetrical mixing terms� should be taken into account in the regression procedure�
Example ��
The reaction Cd���NO���� CdNO�
� has been studied in NaClO� ionic media� The exper�imental results� quoted from �Stability Constants� ��SIL�MAR� ��SIL�MAR� �HOG��recalculated into molality units� are given in Table IX���� The total number of experi�mental points is only �� their real accuracy can be estimated to be ���� log�� units basedon comparison of the values from � di�erent laboratories� using di�erent experimentalmethods �potentiometry� spectrophotometry� polarography�� The experimentally coveredrange of ionic medium concentrations is ������ mol � kg���Using the SIT model one obtains the following results� log��K
� � �� � ��� #� ����� � ��� kg �mol��� All errors are here given as ��The Pitzer parameters for the ion combinations Cd���ClO�
� and Na��NO�
� were taken
from the literature� ����Cd�ClO� � ������ �
���Cd�ClO� � ������ C
�Cd�ClO� � ����� ��KIM�FRE��
����Na�NO�
� ������� ����Na�NO�� ������� C� � ������� ��PIT�� No values of binary and
ternary mixing terms for these ion combinations are available� so they were assumed tobe zero� The task is to determine the values of the Pitzer parameters for the CdNO�
� �ClO��
interaction� ����CdNO� �ClO�and ����CdNO��ClO�
� and log��K� using a regression analysis�
First we used the regression in an attempt to determine all the required parametersfrom the existing log��K data set� The results are� log��K
� � � � ��� ����CdNO� �ClO��
���� ���� ����CdNO��ClO� � ���� ���� All uncertainties are given here as �� These verylarge uncertainties are typical when making a data evaluation using a Pitzer model from
��
Relationship of parameters in the SIT and Pitzer models
Table IX���� Equilibrium constants for reaction Cd�� � NO���� CdNO�
a limited number of experimental points of low accuracy� It is obvious that the data donot allow an accurate determination of the parameters� Therefore� we used the regressionwith a �xed value of log��K
� as it was obtained in the SIT�type of data treatment� i�e��log��K
� ��� ��� ���� Finally� we used the procedure recommended above� As thereaction under consideration involves only ions with the charges � and � we can estimatethe value of X� � #���� from #�Z�� � �� and obtain X� � ���� � ������ #�Z�� ������ As the values of ���� for the single ions are available� we can estimate the valueof the Pitzer parameter ����CdNO��ClO�
� ���� � ����� � ���� � ����� This value seemsto be rather high for ��� ions but it does not contradict the estimate �� � ���� obtainedabove� Using log��K
� and ����CdNO��ClO� � ���� as �xed parameters� we obtained from the
regression ����CdNO��ClO�� ���� � ���� ���� This quantity can also be estimated from the
correlation between #� and X� for the reaction� �X� �#���#�Z�� � ������ �������We �nd� X� � ���� ����� � ������ � ln���� ������ ����� � ���� � ����� Forthis reaction X� � �
���CdNO� �ClO�
� ����Cd�ClO�
� ����Na�NO�
� hence� the estimated value from the
correlation is ����CdNO��ClO� � ����� ������������� � ����� ����� which is rather close
to ����CdNO��ClO�� ���� � ����� We recommend the use of the regression procedure to get
more accurate values of the ���� parameters�
The experimental log��K data and those obtained using the SIT �solid line� and thesimpli�ed Pitzer �dashed line� models are shown in Figure IX���
Example ��
The reaction Fe�� � Cl� �� FeCl�� has been studied in HClO��NaClO� media over a
��
Estimations of ionic strength corrections of thermodynamic data
Figure IX��� The comparison of the experimental �circles� and the calculated values ofthe log��K obtained using the SIT �solid line� and the simpli�ed Pitzer �dashed line�models for the reaction Cd�� � NO�
��� CdNO�
� in NaClO� solutions at ����� K and� atm �see text for details��
wide concentration range� The experimental results in pure HClO�� quoted from �Stabil�ity Constants� ��SIL�MAR� ��SIL�MAR� �HOG�� recalculated to molality units and to����� K where necessary� are given in Table IX���� The results obtained at ionic strengthabove � M ���� mol � kg��� HClO� have not been included in the Table�The example considered is exceptional� in all there are � experimental log��K val�
ues from � independent laboratories� obtained using spectrophotometric� potentiomet�ric or distribution methods� All the data are in good agreement with each other�and the estimated uncertainties of the experimetal log��K points seem to be within���������� log�� units� Using the SIT�type of data treatment the following values ofthe parameters have been obtained by the least�square method� log��K
� � ���� � �����#� � ������ ��� kg �mol�� �all errors are given as ��� The results of the regressionin comparison with the experimental data are shown in Figure IX�� �solid line��Accurate values of the Pitzer parameters for the Fe���ClO�
� interaction are unknown�only preliminary estimations can be made� see Example ��� Hence� we can only de�termine the Pitzer parameters for the reaction� First we tried to determine all the rel�evant parameters �log��K
�� X�� X�� X�� from the regression� the obtained results are�log��K
� � ��������� X� � ���������X� � ��������X� � ����������� the errorsare given as �� Although there are a large number of experimental points ��� of good ac�curacy �� ���� log�� unit�� the result of the regression is very uncertain� Another point to
��
Relationship of parameters in the SIT and Pitzer models
Table IX���� Equilibrium constants for reaction Fe���Cl� �� FeCl�� in HClO� solutions�
be noticed is that despite the large range of HClO� concentrations covered in experiments����� mol � kg���� the X� parameter is statistically insigni�cant� In a second attemptwe tried to determine all parameters� except X� and obtained log��K
� � ���� � ����X� � ����������� X� � ����������� Finally we applied the procedure discussed in theprevious examples for the determination of the Pitzer parameters for the reaction usingthe value of log��K
�� obtained from the SIT�type of data treatment as a �xed parameter�The parametersX� and X� were then determined by regression� The �nal set of the Pitzerparameters is� X� � ����������� X� � ���������� The result of the simpli�ed Pitzer�type of regression is shown in comparison with experimental data in Figure IX�� �dashedline�� This example shows that the contribution of ternary terms �X�� are relatively smallin this case� and can be neglected even at very high ionic medium concentrations�
It is interesting to test the ability of the SIT and the Pitzer model �with the simpli��cations outlined above� to predict the log��K for the reaction Fe�� � Cl� �� FeCl�� indi�erent perchlorate media� The concentration quotient �log��K� is a function of the ionicmedium composition� as indicated by the experimental data in �Na�H�ClO� mixtures asgiven in �HEI�CLE�� We have used both the SIT and the Pitzer models� to predict thechanges of the equilibrium constant as a function of the composition of the ionic medium�Using the SIT model we obtain the following statement for log��K of the reaction in amedium of constant total ionic strength and constant total perchlorate�ion concentration�
��
Estimations of ionic strength corrections of thermodynamic data
Figure IX��� The comparison of experimental �circles� and calculated values of log��Kfor the reaction Fe���Cl� �� FeCl�� in HClO� medium at ����� K and � atm �see textfor details� using the SIT �solid line� or the simpli�ed Pitzer �dashed line��
This simple relation is consistent with Harned�s rule ��HAR�OWE�� which postulates alinear dependence of the logarithm of the activity coe�cient of a solute on the molality ofthe second electrolyte in mixtures of constant total ionic strength� The calculated values ofthe di�erence in log��K when replacing H� for Na� at constant ionic strength ��� mol�kg��are shown in Figure IX�� �the solid line� in comparison with the experimental values �thetriangles� with uncertainty estimates� from �HEI�CLE�� The following SIT interactioncoe�cients were used� ��H��Cl�� � ���� ���� kg �mol��� ��Na��Cl�� � ����� ���� kg �mol��� The quantitative agreement between experimental and predicted data is apparentin Figure IX���On the basis of the Pitzer model the following equation is obtained �neglecting the
ternary interaction parameters for the reaction participants��
��
Relationship of parameters in the SIT and Pitzer models
Figure IX��� The comparion of the experimental and predicted values of the di�erencein log��K values for the reaction Fe���Cl� �� FeCl�� in pure HClO� and mixed HClO��NaClO� media at ����� K and � atm� Triangles are the experimental results from �HEI�CLE�� the solid line � the prediction based on the SIT model� the dashed line �the prediction based on the Pitzer model�
wherem refers to the total molality of the ionic medium �or perchlorate ion concentration��mNa stands for the molality of Na� in mixture� The numerical values of binary mixingterms for the interactions Fe���H�� Fe���Na�� FeCl���Na�� FeCl���H� are unknown� Thenumerical values of the other relevant Pitzer parameters were taken from ��PIT�� Thecalculated di�erences in log��K from this equation are also shown in Figure IX�� by adashed line� The agreement is qualitative� due to lack of all parameters needed in themodel� This situation is not unusual� if not all the needed parameters of the Pitzer modelare available� then the accuracy of predictions of log��K data using this approach maybe no better than those obtained from the simpler SIT model� By �tting the unknowninteraction parameters to the data one will obtain a much better agreement with thePitzer model� This requires many additional experiments of high precision�
��
Estimations of ionic strength corrections of thermodynamic data
Example ��
The example refers to the reaction Cd�� � Cl� �� CdCl�� studied in di�erent perchlo�rate media� The experimental results� quoted from �Stability constants� compilations ��SIL�MAR� ��SIL�MAR� �HOG� and more recent studies ��FED�CHE� ��KUT�LES��GRA�SJO� ��PRO�EIN� ��PRO�BEL�� and recalculated into molality units and to����� K where necessary� are given in Table IX��� Only data in NaClO�� LiClO� andMg�ClO��� media� where most of the experimental determinations have been made� areincluded�The data have been obtained in di�erent laboratories using di�erent experimentalmeth�
ods and di�erent perchlorate media� How can we check the compatibility of the di�erentsets of data &Using the SIT�type of data treatment� we obtain the following statement for the reaction
in perchlorate media
log��K� � log��K � �D � ��CdCl��ClO�
� �mClO�
�� ��Cd���ClO�
� �mClO�
�
� ��Nn��Cl��mNn�
Only the terms log��K� and ��CdCl��ClO�
� � are unknown �we have not used the valueof ��CdCl��ClO�
� � proposed by Ciavatta ��CIA� because this is based on a smaller dataset�� It is convenient to de�ne a function Y as follows
Y � log��K � �D � ��Cd���ClO�� �mClO�
�� ��Nn��Cl��mNn�
� log��K� � ��CdCl��ClO�
� �mClO�
�
According to this equation� the function Y must be represented by a straight line witha slope equal to ���CdCl��ClO�
� � and an intercept equal to log��K�� In Figure IX��
we have plotted the values of Y calculated from log��K in di�erent perchlorate mediausing auxiliary SIT coe�cients ��Cd���ClO�
� � � ���� � ����� kg �mol��� ��Na��Cl�� ������ � ����� kg �mol��� ��Li��Cl�� � ����� � ����� kg �mol��� ��Mg���Cl�� � ����� ����� kg � mol��� All values of Y have been treated together� The results of the least�square regression are� log��K
mol��� the errors are given as �� This value di�ers from the one reported by Ciavatta ��CIA�� namely ��CdCl��ClO�
� � � ��� � ���� which was based on data for NaClO�
solutions only� In the majority of cases the deviations between the �experimental� andcalculated values of Y do not exceed �� log�� units� which is consistent with the estimateduncertainty in the experimental log��K values� This means that the data obtained indi�erent perchlorate media are consistent� This result indicates that the speci�c e�ects ofthe ionic media� which are not taken into account in the SIT approximation �triple ion�ioninteractions� mixing terms� etc�� are expected to be of the same order of magnitude asthe estimated accuracy of log��K data� Hence� they are not statistically signi�cant� andtheir determination requires much more accurate log��K data�The data treatment based on the Pitzer approach is discussed� taking into account only
the binary interaction terms for the complex CdCl�� The equation for the concentration
�
Relationship of parameters in the SIT and Pitzer models
Table IX��� Equilibrium constants for reaction Cd���Cl� �� CdCl� in NaClO�� LiClO�
and Mg�ClO��� media�
Medium m log��K�m� Medium m log��K�m��mol � kg��� �mol � kg���
Estimations of ionic strength corrections of thermodynamic data
Figure IX��� The values of function Y �see text for details� calculated from the log��Kdata for the reaction Cd�� � Cl� �� CdCl� in NaClO� �circles�� LiClO� �squares� andMg�ClO��� �triangles� media at ����� K and � atm based on the SIT model�
dependence of log��K for the reaction is
lnK� � lnK � ln�CdCl� � ln �Cd�� � ln �Cl�The equations for the concentration dependence of the activity coe�cient of Cd��� Cl��CdCl� in perchlorate media Mn��ClO��n are given below�
ln �Cd�� � f� �mnh����Cd�ClO�
� ����Cd�ClO�g�Im�
i� m�n�CCd�ClO�
� m Cd�M �m�n�Cd�M�ClO� � m�nCM�ClO�
ln �Cl� � f� �mh����M�Cl � �
���M�Cl g�Im�
i� m�nCM�Cl
� mn Cl�ClO� �m�n�Cl�ClO��M �m�nCM�ClO�
ln �CdCl� � f� �mnh�
���CdCl�ClO� � �
���CdCl�ClO� g�Im�
i� m CdCl�M �m�nCM�ClO�
where n re�ects the charge type of the ionic medium �n � � for NaClO� and LiClO��n � for Mg�ClO����� m is the molality of the ionic medium� all other symbols have beende�ned before� The binary mixing parameter Cd�M is ionic strength dependent if M � Na
��
Relationship of parameters in the SIT and Pitzer models
Figure IX�� The values of function Y �see text for details� calculated from the log��Kdata for the reaction Cd�� � Cl� �� CdCl� in NaClO� �circles�� LiClO� �squares� andMg�ClO��� �triangles� media at ����� K and � atm based on the Pitzer model�
or Li� and CdCl�M if M � Mg� For further simpli�cation the parameter ����CdCl�ClO�
� ���
was estimated from the #�Z�� value for the reaction and known values of the ���� for otherreaction participants in NaClO� and LiClO� media �note that the proposed correlationbetween #�Z�� and X� � #���� is valid only for the supporting electrolyte of ��� type��Now we can de�ne the function Y
The function Y calculated from log��K data in di�erent perchlorate media is shown inFigure IX�� the values of the ���� and ���� for Cd���ClO�
� interaction are taken from ��KIM�FRE�� and other Pitzer parameters are quoted from ��PIT�� Neither the rel�evant binary mixing parameters Cd�Li� Cd�Na� Cd�Mg� Cl�ClO� � nor the ternary mixingparameter are available� As the Pitzer parameters reported are valid up to ionic strength� mol � kg��� only the results obtained at lower ionic strength were considered� As ex�pected� the data scatter considerably� and the Y values referring to the Mg�ClO��� ionic
��
Estimations of ionic strength corrections of thermodynamic data
medium� shown by triangles� deviate from the points in LiClO� �squares� and NaClO�
�circles� media� There are several possible explanations for these deviations� e�g�� thecontribution from the Cd�M and CdCl�M terms� This issue cannot be resolved due to lackof experimental values of Cd�M� Nevertheless� we used the linear regression of all the datato obtain log��K
� � �������� as intercept and ��������� as the slope of the resultinglinear plot �see Figure IX��� The value of log��K
� is� within the estimated uncertainty�in agreement with the value from the SIT�type of data treatment�
Before using experimental concentration equilibrium constants for the determination oflog��K
� and the various interaction parameters one must be aware of the following�
� The experimental concentration constants have been determined on the assumptionthat the activity coe�cients of reactants�products are constant at a constant ionicstrength� This may not be the case if a su�ciently large part of the ionic mediumhas been replaced by the reactants�products� As a result one may have introduceda systematic error in the equilibrium constants� but rarely with the chemical model�These errors will then be propagated in the determination of log��K
� and the in�teraction parameters� The magnitude of the systematic error will be ionic strengthdependent�
� The presence of other types of systematic errors� related to the method of investi�gation� are di�cult to spot unless di�erent experimental methods are used�
These factors result in an accuracy of most published equilibrium constants that is muchlower than the claimed uncertainty of the results� which in general describe the precisionof the experiment� With this in mind� one will often �nd that even the SIT model providesreasonably good estimates of the concentration�ionic medium dependence of most equi�librium constants� especially for complex systems such as the ones encountered in nature�We can conclude that the simple SIT approach� which uses only one parameter for eachion�counter ion� ion�neutral� and neutral�neutral interaction� results in a reliable valueof the equilibrium constant at in�nite dilution� and an adequate reproduction of log��Kdata for complex formation equilibria as a function of both the ionic strength and theionic composition of the medium� The �intrinsic error� in the SIT model� due to the ap�proximations used is less than ���� per cent for the mean activity coe�cents of completelydissociated electrolytes� even at ionic strengths as high as ���� mol � kg��� Hence� theexpected �intrinsic� error �which will depend on the number of reactants�products in theequilibrium expression� in the reproduction of the log��K data is less than ���� log�� unitsfor reactions involving two reactants and one product� The agreement of the experimen�tal log��K data obtained in independent laboratories using di�erent methods is seldombetter than ��� �log���unit�� for complex formation reactions� As discussed by Beck andNagypal ��BEC�NAG�� the errors claimed by authors usually re�ect the reproducibilityof log��K values from the experimental data set for the particular experimental methodused� and the particular chemical model of the system under study�
��
The use of the SIT at elevated temperatures
IX��� The use of the SIT at elevated temperatures
In order to describe the concentration behavior of log��K at elevated temperatures andpressures it is necessary to have information on the temperature and pressure dependenceof the interaction parameters �either the Pitzer� or the SIT parameters�� The equationsinvolving temperature and pressure derivatives of the chemical potential of the solute onthe basis of the Pitzer model are published ��PIT�� Below we give the correspondingequations for the SIT model�
IX����� Osmotic coe�cient
The following formulae are all based on the application of standard thermodynamic re�lations to the SIT expression for the activity coe�cient �Eq� �IX���� of the dissolvedspecies in an aqueous system� The reader is referred to ��HAR�OWE� ��LEW�RAN�for additional details�The mean activity coe�cient of single electrolytes is equal to
ln �� � �A�jZ�Z�jpIm
t� �����
��m �IX���
where
Im �m
���Z
�� � ��Z�
��
t � � � ���qIm �IX���
all other symbols have been explained before�Using the de�nition of the osmotic coe�cient for a single electrolyte ��HAR�OWE�
we obtain�
� � � A�jZ�Z�j����Im
�t� ln t� �
t
�������
��m �IX���
Equilibria involving H�O�l� as a reactant or product require a correction for the activity ofwater� aH�O� In an electrolytemixture this can be calculated from � by using Eqs� �IX����IX���� or from the experimentally determined osmotic coe�cient of the mixture �
ln aH�O � � P
kmk
��������IX���
The summation extends over all solutes k with molality mk present in the solution� TheSIT model� with the analytical statement for the activity coe�cients for the dissolvedspecies �ions and neutral species�� can be used to obtain an analytical statement for theosmotic coe�cients of the solution� The deduction which uses the Gibbs�Duhem equationis straightforward and results in the following expression �the subscripts c and a refer
��
Estimations of ionic strength corrections of thermodynamic data
to cations and anions in general� ni and nj denote the di�erent kinds of neutral species�subscript k refer to any species��
� � � �A�
����
�t� ln t� �
t
�P
kmk
��Pkmk
� X
c
Xa
���c� a�mamc
�Xc
Xn
���c� n�mcmn �Xa
Xn
���a� n�mamn
��
Xni
Xnj
���ni� nj�mnimnj
�� �IX���
If no uncharged species are present the last three terms are zero and the expression forthe osmotic coe�cient is then very close to the expression given by Pitzer and Brewer ��LEW�RAN� their Eq� ������
IX���� The analytical statements for partial and apparent molar properties of singleelectrolytes on the basis of the SIT model
The equation presented below have been derived using the approximation that the quan�tity ajB � ��� is independent of temperature and pressure�
�� The relative partial molar enthalpy is de�ned as ��HAR�OWE��
L� � H� �H�� � ��RT �
� ln ��T
�P
�IX����
where H� and H�� are the partial molar enthalpies in a given solution and at in�
�nite dilution� respectively� Only the relative value� L�� can be determined fromexperimental measurements� We have�
L� �
��ALjZ�Z�j
pIm
t� ����RT ��Lm �IX����
where
�L �
���T
�P
�IX���
AL is a Debye�H�uckel slope de�ned in Section IX���� Using the general relationbetween partial and apparent properties
'� �
n�
��'n�
�p�T
�IX���
��
The use of the SIT at elevated temperatures
where ' and �' are partial and apparent properties respectively� and n� the soluteconcentration� we obtain the analytical statement for the concentration dependenceof the relative apparent molar enthalpy �L�
�L �
��ALjZ�Z�j����Im
�t� � �t� ln t� �
� ����RT � �Lm �IX����
� The partial molar volume is de�ned as ��HAR�OWE��
V� � V �� � �RT
� ln ��p
�T
�IX����
where V� and V �� are partial molar volumes in a given solution and at in�nite dilution�
respectively� We have
V� � V �� �
��AV jZ�Z�j
pIm
t� ����RT �V m �IX����
where
�V �
���p
�T
�IX����
and we obtain the analytical statement for the concentration dependence of theapparent molar volume �V
�V � V �� �
��AV jZ�Z�j����Im
�t� � �t� ln t� �
� ����RT �V m �IX����
AV is a Debye�H�uckel slope de�ned in Section IX����
� By de�nition ��HAR�OWE�
Cp� � Cp�� �
�L�
T
�P
�IX����
where Cp� and Cp�� are partial molar heat capacities in a given solution and atin�nite dilution� respectively� Hence
Cp� � Cp�� �
��AJ jZ�Z�j
pIm
t� ����RT � �J m �IX����
��
Estimations of ionic strength corrections of thermodynamic data
where
�J � �LT
�
��LT
�P
�
T
���T
�P
�
����T �
�P
�IX����
The analytical statement for the concentration dependence of the molar apparentheat capacity �J �AJ is a Debye�H�uckel slope� cf� Section IX���� is�
�J �Cp�� �
��AJ jZ�Z�j����Im
�t� � �t� ln t� �
� ����RT � �J m �IX���
�� For the partial molar isothermal compressibility k� we use the de�nition
k� �
�V�p
�T
�IX���
Hence
k� � k�� �
��AkjZ�Z�j
pIm
t� ����RT �km �IX����
where k�� is the partial molar isothermal compressibility at in�nite dilution� and
�k �
���p
�T
�
����p�
�T
�IX����
Ak is the Debye�H�uckel limiting slope de�ned in Section IX���� The concentrationdependence of the apparent molar isothermal compressibility �k is given by
�k � k�� �
��AkjZ�Z�j����Im
�t� � �t� ln t� �
� ����RT �km �IX����
With the model assumptions made� we obtain very simple analytical expressions for theconcentration dependence of partial and apparent molar properties of aqueous electrolytesas compared to more parametrized versions of extended Debye�H�uckel equations �e�g��Helgeson et al� ��HEL�KIR���
IX����� The Debye�H�uckel limiting law slopes
We use the following de�nitions of the Debye�H�uckel limiting law slopes ��BRA�PIT���ANA�ATK��
���
The use of the SIT at elevated temperatures
For activity and osmotic coe�cients�
A� ���N����
���������e�
k�������
��T �����IX����
A� �A�
�IX����
where N is the Avogadro number� e stands for absolute electronic charge� � is here thedielectric constant of water� � is the pure water density� k is Boltzman constant� T isabsolute temperature� K�For partial and apparent molar relative enthalpies�
AL � �RT �
�A�
T
�P
� �A�RT
�� �
T
�
��
T
�P
�T�
��IX����
where R is gas constant� � is expansivity of pure water �� � � lnVT �P ��For partial and apparent molar volumes�
AV � ��RT�A�
p
�T
� A�RT
��
�
��
p
�T
� �
��IX����
where � is compressibility of pure water �� � �� lnVp�T ��For partial and apparent molar heat capacities�
AJ �
�AH
T
�P
� �A�RT�
����
���
T �
�P
� �
��
��
T
��
P
� �
T ���
��
T
�P
�A
�AL
T�
A�L
�A�RT ��IX����
For partial and apparent isothermal molar compressibilities�
Ak �
�AV
p
�T
� A�RT
����
���
p�
�T
� �
��
��
p
��
T
� �
��
p
�T
�A
� AV
�
�
��
p
�T
� �
��IX���
When calculating the Debye�H�uckel limiting law slopes we use the Haar�Gallagher�Kell equation of state for pure water ��KES�SEN� and the Archer�Wang ��ARC�WAN� equation for the dielectric constant of pure water�
Example ��
The equations given above have been used to correlate the experimental data on activitycoe�cients� relative apparent molar enthalpies� apparent molar heat capacities and appar�ent molar volumes for NaCl at di�erent temperatures at saturated water vapor pressure�
���
Estimations of ionic strength corrections of thermodynamic data
Figure IX�� Comparison of experimental �solid line� and smoothed values of activitycoe�cients of aqueous NaCl solutions at saturated water vapor pressure on the basis ofthe SIT model� The numbers adjacent to the curves are Celsius temperatures�
See Figures IX�� IX��� IX�� and IX�� where the recent precise experimental data areshown by full�drawn lines and the values obtained from the SIT model are shown by the�lled circles�The accuracy of the �tting of the experimental data using the SIT model is far less
than that obtained by using the three�parameter Pitzer model� which describes the ther�modynamic properties of electrolyte solutions practically within the experimental errorsin most cases� The one�parameter SIT approach should not be used for the treatmentof experimental thermochemical data and data at di�erent pressure� when informationon the Pitzer parameters for the system is available� Nevertheless� the following pointsshould be noticed�
� The SIT model provides a reasonably good description of data on the activity co�e�cients� relative apparent molar enthalpies� apparent molar heat capacities andapparent molar volumes of the NaCl aqueous solutions both at ����� K and ele�vated temperatures�
� The SIT model works better at temperatures above ����� K� both for other ���and �� electrolytes� indicating that the �intrinsic� error of the model decreaseswith increasing temperature� Hence� we recommend the use of this approach for thedescription of the concentration dependence of the equilibrium constants at elevatedtemperatures� cf� Example ���
��
The use of the SIT at elevated temperatures
Figure IX��� Comparison of experimental �solid line� and smoothed values of relativeapparent molar enthalpies� �L� of aqueous NaCl solutions at saturated water vapor pres�sure on the basis of the SIT model� The numbers adjacent to the curves are Celsiustemperatures�
Figure IX��� Comparison of experimental �solid line� and smoothed values of apparentmolar volumes of aqueous NaCl solutions at saturated water vapor pressure on the basisof the SIT model� The numbers adjacent to the curves are Celsius temperatures�
��
Estimations of ionic strength corrections of thermodynamic data
Figure IX��� Comparison of experimental �solid line� and smoothed values of the appar�ent molar heat capacities of aqueous NaCl solutions at saturated water vapor pressure onthe basis of the SIT model� The numbers adjacent to the curves are Celsius temperatures�
Example ��
The main �eld of application of the SIT approach is the description of the ionicstrength�ionic medium dependence of complex formation reactions� It was repeatedlyshown ��CIA� �GRE�FUG� that the SIT model results in fair reproduction of experi�mental results and a correct estimation of log��K
� for data at ����� K� In this examplewe will check the applicability of this model to data obtained at elevated temperatures�The equilibrium constants for the following reactions have been studied experimentallyby potentiometric method at di�erent temperatures in NaCl ionic media �PAT�SLO���PAT�BUS� ��DIC�WES��
CO��aq� � H�O�l� �� H� �HCO��
HCO��
�� H� � CO���
HSO��
�� H� � SO���
A comparison between experimental data and those �tted using the SIT model are shownin Figures IX��� IX��� IX�� and in Table IX��� When using the SIT model we haveassumed that
� A is a temperature� and pressure�dependent function� cf� Eq� IX����
� The numerical factor ��� is independent of temperature�
���
The use of the SIT at elevated temperatures
Table IX��� Test of the SIT approach for some reactions at elevated temperatures inNaCl media �log��K
�exp is the value from the original publications�� The results at ���C
are shown in parenthesis� because these data may be a�ected by a partial association ofthe ionic medium�
Estimations of ionic strength corrections of thermodynamic data
Figure IX��� The di�erences �log��Kexp � log��Kcalc� between experimental and calcu�lated values of log��K using the SIT model as a function of the molality of the ionicmedium �NaCl� and temperatures �at saturated water vapor pressure� for the reactionCO��aq� � H�O�l��� H� �HCO�
� �PAT�SLO��
� #� is a temperature� and pressure�dependent parameter�
One can conclude that it is possible to describe the concentration dependence of theequilibrium constants at temperatures up to ���C �saturation water vapor pressure� infairly good agreement with experimental data �in almost all cases the di�erence betweenexperimental and calculated data do not exceed ��������� log�� units up to the ionicstrength � mol � kg���� The values of log��K
� �i�e�� at in�nite dilution� agree almostwithin the obtained uncertainties with the estimates based on more complicated modelscontaining � �tting parameters� However� the values of log��K
� obtained using the SITare systematically slightly higher than the values reported in the original publications�This is due to the fact that log��K
� value depends somewhat on the extrapolation methodused� However� these variations are small�
IX���� The concentration dependence of heats of reactions
The enthalpy of reaction� #rHm� is another characteristic of importance for complexformation reactions� All problems� which were discussed for the description of the con�centration dependence of log��K are relevant also for #rHm data� Determinations ofstandard heats of reactions in aqueous solutions �i�e�� at in�nite dilution� in general in�
���
The concentration dependence of heats of reactions
Figure IX��� The di�erences �log��Kexp � log��Kcalc� between experimental and calcu�lated values of log��K using the SIT model as a function of the molality of the ionicmedium �NaCl� and temperatures �at saturated water vapor pressure� for the reactionHCO�
��� H� � CO��
� ��PAT�BUS��
Figure IX��� The di�erences �log��Kexp � log��Kcalc� between experimental and calcu�lated values of log��K using the SIT model as a function of the molality of the ionicmedium �NaCl� and temperatures �at saturated water vapor pressure� for the reactionHSO�
��� H� � SO��
� ��DIC�WES��
���
Estimations of ionic strength corrections of thermodynamic data
volve the determinations of heats of reactions at �nite concentrations and the relevantheats of mixing and dilution of the components� Typical examples are the papers of Bergand Vanderzee ��BER�VAN� ��BER�VAN�� where the value of the standard enthalpyof formation of aqueous zinc ion was calculated from the enthalpies of solution of ZnO�cr�in HClO� solutions� the enthalpy of dilution of Zn�ClO����aq� and the enthalpy of mixingof Zn�ClO����aq� and HClO��aq� solutions� There are many examples in the literaturewhere only the enthalpies of reaction at �nite concentrations� often in solution with alarge excess of ionic medium electrolyte� have been measured experimentally� These datahave then been extrapolated to in�nite dilution by using some empirical or semi�empiricalmethods� for instance� assuming that the thermochemical quantities follow a simple squareroot dependence of the ionic strength of the solution� etc� The use of such methods mayresult in a loss of accuracy of the value at in�nite dilution� as compared to the accuracyof the experimental data� and were abandoned a long time ago for the determination oflog��K
�� A clear and unambigous discussion of the problem to describe the concentra�tion dependence of #rHm and to determine #rH
�m for complex formation reactions is still
absent �or we are not aware of it��As discussed in Section IX�� for a chemical reaction in the general form
Xi
�iQi � rH�O�l� � � �IX���
the equation for the concentration dependence of lnK is given as follows�
lnK� � lnK �Xi
�i ln �i � r ln aH�O �IX���
Using the known thermodynamic relations and de�nitions
#rHm � RT �
� lnK
T
�p
�IX���
L� � �RT �
� ln aH�O
T
�p�m
�IX����
L��i � �RT �
� ln �iT
�p�mi
�IX����
where L� and L��i stand for the relative partial molar enthalpies of water and solute irespectively� one obtains the following basic equation for the concentration dependence ofthe enthalpy of reaction�
#rH�m � #rHm �
Xi
�iL��i � rL� �IX����
Values of the relative partial molar enthalpy of water� L�� in solutions of some commonelectrolytes are given in Table IX����
���
The concentration dependence of heats of reactions
Table IX���� Values of the relative partial molar enthalpy of water� L�� in solutions ofsome common electrolytes ��PIT�� The values in parenthesis are short range extrapola�tions�
Estimations of ionic strength corrections of thermodynamic data
The particular analytical form of the equation will depend on the model used to describethe activity coe�cients� Most complex formation reactions have been studied at traceconcentrations of the reactants�products in a large excess of supporting electrolytes� Inthe following sections we will describe two equations based on the Pitzer and the SITmodels that could be used for the description of the concentration dependence of the#rHm for such reactions�
IX������ The calculation of the standard enthalpy of reaction from experimental #rHm
data using the Pitzer equation
Using the Pitzer equations the following statement is obtained for the relative partialmolar enthalpy of a cation M present at trace concentration in a solution of a �supporting�electrolyte NX �see Eqs� �IX���� �IX����IX���� �IX����� �IX������
L��M �Z�MAL
�
� pIm
� � bpIm
�
bln�� � b
qIm
��IX����
�RT �Z�MmNmX�
���LNX
g��Im�Im
� RT �mX
h����LMX � �
���LMX g�Im�
i
�RT �mN
� � MN
T
�p
�mX
��MNX
T
�p
��
�RT �mX �mNZN �mXZX�CLMX �RT �ZMmNmXC
LNX
where AL is the Debye�H�uckel parameter for the enthalpy �at ��C and � atm AL ������ kJ � kg��� � mol���� ��PIT��� ZM� ZN� ZX stand for the charges of M� N� and Xrespectively� g and g� are de�ned in Eqs� �IX�� and �IX�� in p���� and the parameters����L� ����L� CL are de�ned as
����L �
�����
T
�p
� ����L �
�����
T
�p
� CL �
�C
T
�p
where ����� ���� and C are the parameters for the osmotic and activity coe�cients in thePitzer model� The corresponding expression for the relative partial molar enthalpy of ananion Y is obtained by changing the subscript M for Y and the subscript X for N�For the relative partial molar enthalpy of water in solution of NX electrolyte� the
following equation is obtained�
���
The concentration dependence of heats of reactions
L� �Mw
����
� �AL
I���m�� � b
pIm� � RT � �M�Xm
������LNX � �
���LNX e��
pIm
� �NZNmCLNX
� �� �IX����
where Mw is the molar mass of water� �N and �X are the number of N and X in theelectrolyte NX�The Pitzer approach gives the following equation for the concentration dependence of
the enthalpy of the reaction studied at trace concentrations of the reactants�products insolution with a large excess of a ��� electrolyte ionic medium�
#rHm � rL� � #rH�m �
#�Z��AL
�
� pIm
� � bpIm�
bln�� � b
qIm
�
�RT �#�Z��m�����LNX
g��Im�Im
�RT �m�#jZjCLNX
� RT �m#����L� RT �m#
�
T
�p
� RT �m#����L g�Im�
� RT �m�#CL �RT �m�#
��
T
�p
�IX����
where
#�Z�� �Xi
�iZ�i � #jZj �
Xi
�ijZij �
#����L �Xi
�i����Lij � #����L �
Xi
�i����Lij � #CL �
Xi
�iCLij �
#
�
T
�p
�Xi
�i
� ijT
�p
� #
��
T
�p
�Xi
�i
��ii�j
T
�p
Here subscript i refers to reaction participants� i� and j stand for the ionic medium ions�having the same and opposite charge sign respectively� to the species i� and m denotes themolality of the ionic medium ��� electrolyte� NX� The Pitzer parameters ����L� ����L� CL
are tabulated for many electrolytes ��PIT�� However� the information on the temperaturederivativies of the mixing terms � T �p and ��T �p is scarce due to the small numberof studies of the enthalpy of mixing of electrolyte solutions that have been analysed withthis method� We did not include the analytical expression of the contribution of rL� termin order not to complicate the resulting equation� From a practical point of view it is
���
Estimations of ionic strength corrections of thermodynamic data
more convenient to correct the experimental values of #rHm with the contribution fromthe term rL�� when necessary� using the values of the relative partial molar enthalpies ofwater in electrolyte solutions from the thermochemical tables or calculating them usingthe Pitzer model�
IX����� The calculation of the standard enthalpy of a reaction from experimental #rHm
data using the SIT model
The corresponding equations for the concentration dependence of the relative partialmolar enthalpy of cation M present at trace concentration in an ionic medium electrolyteNX and for relative partial molar enthalpy of water �L�� are given below �considering thenumerical factor ��� kg��� �mol���� to be a constant� independent of temperature�
L��M � �RT �
� ln �MT
�p�mj
�
�
ALZ�i
pIm
� � ���pIm
�RT ��L�M�X�mX �IX����
L� �Mw
����
��
AL
����
�t� ln t� �
t
��RT ��NZNm
��L�N�X��
�IX����
where t � � � ���pIm was de�ned before�
The concentration dependence of the heat of reaction studied at trace concentrations ofreactants�products in a solution with a large excess of an ��� ionic medium is then equalto�
#rHm � rL� � #rH�m �
�
AL#�Z��pIm
� � ���pIm
�RT �m#�L �IX���
where
#�L �Xi
�i �L�i� j�
here subscript i refers to a reaction participant and j to the counter�ion of the ionicmedium�
Example �
This example refers to the determination of the #rH�m value for the reaction Mg�cr� �
H� �� Mg�� � H��g�� which is equal to the standard enthalpy of formation of the mag�nesium ion� In ��� Shomate and Hu�man �SHO�HUF� measured the enthalpy ofreaction of very pure magnesium metal in ��� mol � kg�� HCl at ����� K and obtainedthe value of #rHm � ������� � ���� kJ �mol�� �as recalculated by Morss and Williams
��
The concentration dependence of heats of reactions
�MOR�WIL� using a more accurate value of the molar mass of Mg�� This measurementhas been accepted as a standard for metal�dissolution calorimetry and has been con�rmedmany times �see �MOR�WIL���For this reaction we obtain
#rH�m � #rHm � L��Mg�� � L��H�
The corresponding statements for the relative partial molar enthalpies of this reactionparticipants in a solution with a large excess of HCl based on the Pitzer model are givenas follows
L��Mg � AL
� pIm
� � bpIm
�
bln�� � b
qIm
�� �RT �m��
���LH�Cl
g��Im�Im
� RT �mh����LMg�Cl � �
���LMg�Cl g�Im�
i
�RT �m
� � Mg�H
T
�p
�m
��Mg�H�Cl
T
�p
��
� RT �m�CLMg�Cl � RT �m�CL
H�Cl
L��H �AL
�
� pIm
� � bpIm
�
bln�� � b
qIm
�� RT �m�
���LH�Cl
� RT �m����LH�Cl
��Im
�� �
�� � �
qIm � ��Im
�e��
pIm
� RT �m�CL
H�Cl
where m stands for the molality of HCl� The required values of the Pitzer parameters forthe HCl and MgCl� electrolytes are available from the compilation ��PIT��
����LH�Cl � ����� ���� kg �mol�� �K��� ����LH�Cl � ����� ���� kg �mol�� �K���CLH�Cl � ����� ��� kg� �mol�� �K���
����LMg�Cl � ����� ���� kg �mol�� �K��� ����LMg�Cl � ��� ���� kg �mol�� �K���CLMg�Cl � ���� ��� kg� �mol�� �K���
The temperature derivativies of the mixing terms � Mg�HT �p and ��Mg�H�ClT �p arenot given in the literature due to lack of the experimental determinations of the enthalpyof mixing HCl and MgCl� solutions� Only rough estimations can be made from the poten�tiometric determinations of the mean activity coe�cients of HCl in its mixtures with alkaliearth halides at di�erent temperatures ��ROY�GIB� ��ROY�RIC� etc��� � Mg�HT �p ����� �� ���� kg �mol�� �K�� and ��Mg�H�ClT �p � ��� �� ���� kg� �mol�� �K���
��
Estimations of ionic strength corrections of thermodynamic data
using the reported sets of and � values without consideration of the higher order electro�static terms� We did not take into account the contribution of the unsymmetrical mixingterms� As pointed out by Pitzer �PIT� the e�ect of the higher order electrostatic termis non�linear with the ionic strength only at low concentrations and can be omitted forsimplicity�The calculated values are L��H � ��� kJ �mol�� and L��Mg � �� � ��� kJ �mol���
where the error is due to uncertainty in the contributions of the mixing terms� Therefore�#rH
�m � #fH
��Mg��� ����� K� � #rHm � L��Mg � L��H � �������� � ����� � ��� ����� � ��� � ������ � ��� kJ �mol���Using the SIT model� we obtain the following equations for the relative partial molar
enthalpies of the reaction participants�
L��Mg�� � AL
pIm
� � ���pIm
�RT ��L�Mg���Cl��m
L��H� �
�
AL
pIm
� � ���pIm
�RT ��L�H��Cl��m
where m stands for the molality of HCl� The values of the SIT interaction coe�cientscan be evaluated from the available ��PIT� data on the heats of dilution of MgCl� andHCl� �L�Mg���Cl�� � ����� ��� ���� kg �mol�� �K��� �L�H��Cl�� � ������ �������� kg �mol�� �K��� The calculated results are� L��H � �������� kJ�mol�� and L��Mg ���� ��� kJ �mol�� �the uncertainties have been doubled to take the neglect of speci�cmixing e�ects in the SIT model into account�� Hence� #rH
�m � #fH
��Mg��� ����� K� ��������� � ����� � ���� ���� � ���� � ����� � ������� � ���� kJ �mol���Both of the values� ������ � ��� kJ � mol�� from the Pitzer model and
������� � ���� kJ � mol�� from the SIT model can be compared with the CODATA ��COX�WAG� recommended value ������ � ��� kJ � mol��� which is based on di�er�ent experimental sets varying from ����� � ��� to ������� � ���� kJ � mol��� Thesevalues of the enthalpy of formation of the magnesium ion were obtained from a numberof di�erent thermochemical cycles� In most cases the values of #rH
�m deduced by the
authors of the original works were quoted in ��COX�WAG� without critical discussionof the extrapolation procedures employed� although this might be an additional reasonfor the discrepancies between the reported values of the enthalpy changes at in�nite di�lution� For instance� the extrapolation equation widely used by Vasil�ev with coworkers ��VAS� ��VAS�YAS� is actually based on the assumption H��m � H�
� ��L �see Eq� ���
in ��VAS�YAS��� where H��m is the enthalpy of a species in a solution of �nite concen�tration� H�
� stands for the enthalpy of the species at in�nite dilution��L is the relative
apparent molar enthalpy� This relation is in contradiction to the strict thermodynamicrelation H��m � H�
� � L�� which follows from the de�nition of the relative partial molarenthalpy of the species of the solution �see Eq� �IX������ The relative apparent molarenthalpy is not a characteristic of the solute� in fact it is the characteristic of the system�which follows from the following relation ��HAR�OWE�
L � n�L� � n�L� � n� � �L
���
The concentration dependence of heats of reactions
where L is the relative enthalpy of the solution� n� and n� stand for the concentrationsof water and solute� respectively� Hence� the extrapolation equation used by Vasil�ev andcoworkers seems to be based on erroneous assumptions� and the numerous results of #rH
�m
obtained using this equation should be revised� a discussion is given in ��PLY�GRE��
Example ��
The previous example referred to a situation where very accurate data for #rHm in an ionicmedium was available� but where the #rH
�m value from the CODATA recommendation
had a rather large uncertainty� In this example we will discuss the dissociation of waterin NaCl media� where the #rH
�m � ���� � ���� kJ � mol�� ��COX�WAG� is known
with very high precision� but where individual experimental results might be subject toundiscovered experimental errors�A number of sets of #rHm data for the reaction H�O�l��� H��OH� in NaCl ionic media
have been reported in the literature at ����� K� Harned and Mannweiler �HAR�MAN�have obtained the #rHm values at di�erent NaCl concentrations from the temperaturedependence of the very accurate log��K data in the temperature range �����C� Lobanovand Vasil�ev ��LOB�VAS� have made calorimetric determinations of the correspondingquantities� Busey and Mesmer ��BUS�MES� have tabulated the #rHm values consistentwith log��K data at di�erent temperatures� Maeda ��MAE� has reported the calorimetricresults� These values of the enthalpy changes� corrected for the values of the relativepartial molar enthalpies of water in NaCl solutions� are given in Table IX����For this reaction one obtains
#rH�m � #rHm � L� � L��H � L��OH
The Pitzer model results on the following equations for the relative partial molar en�thalpies of the reaction participants�
L��H �AL
�
� pIm
� � bpIm�
bln�� � b
qIm
��RT �m��
���LNa�Cl
g��Im�Im
� RT �mh����LH�Cl � �
���LH�Cl g�Im�
i
�RT �m
� � H�NaT
�p
�m
��H�Na�Cl
T
�p
��
� RT �m�CLH�Cl �RT �m�CL
Na�Cl
���
Estimations of ionic strength corrections of thermodynamic data
L��OH �AL
�
� pIm
� � bpIm
�
bln�� � b
qIm
��RT �m��
���LNa�Cl
g��Im�Im
� RT �mh����LNa�OH � �
���LNa�OH g�Im�
i
�RT �m
� � OH�ClT
�p
�m
��OH�Na�Cl
T
�p
��
� RT �m�CLNa�OH �RT �m�CL
Na�Cl
The Pitzer parameters are available ��PIT� for the single electrolytes NaOH� HCl andNaOH �the dimensions are kg �mol�� � K�� for the ����L and ����L� kg� �mol�� � K�� forthe CL��
����LH�Cl � ����� ����� �
���LH�Cl � ����� ����� CL
H�Cl � ����� ��������LNa�OH � ���� ����� �
���LNa�OH � ��� ����� CL
Na�OH � ����� ��������LNa�Cl � ����� ����� �
���LNa�Cl � ����� ����� CL
Na�Cl � ���� ����The parameters for the NaOH solutions are valid up to concentration �� mol � kg���those for the HCl solutions up to ��� mol � kg��� The temperature derivativies of themixing terms � H�NaT �p� ��H�Na�ClT �p� � Cl�OHT �p� ��Cl�OH�NaT �p are notknown� We assume that the sum of the terms � H�NaT �p� � Cl�OHT �p is less than� ����� and that the sum of the terms ��H�Na�ClT �p � ��Cl�OH�NaT �p is lessthan � ��� based on the available information on the temperature dependence of themixing terms in some binary systems ��HOL�MES�� Using the equations given above wehave calculated the values of the sum of the L��H�L��OH at di�erent NaCl concentrations�considering the possible contribution of the mixing terms as an estimate of the uncertaintyof the derived sum� The value of #rH
�m obtained from the experimental enthalpy changes
are given in Table IX���� the errors quoted are the square root of the sum of the squaresof the uncertainty of experimental determinations and the estimated uncertainty of thesum of L��H � L��OH�From the SIT model we obtain for the relative partial molar enthalpies of H� and OH�
in NaCl solutions�
L��H� �
�
AL
pIm
� � ���pIm
�RT ��L�H��Cl��m
L��OH� �
�
AL
pIm
� � ���pIm
�RT ��L�Na��OH��m
The values of the SIT interaction coe�cients are obtained from the enthalpy of dilutiondata for HCl and NaOH solutions� �L�H
��Cl�� � ����� � ���� ���� kg �mol�� � K���
���
The concentration dependence of heats of reactions
�L�Na��OH�� � ����� ��� ���� kg �mol�� �K��� These values were used to calculatethe sum of the relative partial molar enthalpies of H� and OH� in NaCl solutions andto obtain the values of #rH
�m from the experimental enthalpy changes �see Table IX�����
When estimating the possible error in the #rH�m� the uncertainty in the correction was
doubled� to account for the speci�c mixing e�ects which are ignored in this model�
The values of the sum L��H�L��OH calculated from the Pitzer and the SIT models� arein satisfactory agreement with one another only at concentrations of NaCl less than ��� mol�kg��� where the di�erence between them is less than � kJ�mol��� with an expecteduncertainty within ������ kJ �mol��� In this concentration range the experimental valuesof #rHm� reported in the di�erent studies� are in acceptable agreement with one another�The values of the enthalpy change at in�nite dilution� #rH
�m� calculated based on either
the Pitzer or the SIT approaches are also in excellent agreement �within the expecteduncertainties of the calculations� with the CODATA recommendation� The analysis ofthe results at higher NaCl concentrations is ambigous� the Pitzer and the SIT modelsresult in quite di�erent values of the sum of the relative partial molar enthalpies of theH� and OH� ions� and the di�erences exceed the expected uncertainty of the calculatedvalues� One also obtains di�erent values of #rH
�m from the same experimental data at high
NaCl concentrations� using the two models� The reasons can be the approximate characterof the postulates used in the SIT approach and a larger than expected contribution ofthe mixing terms in the Pitzer model� This ambiguity cannot be resolved due to lack ofthe experimental determinations of the enthalpy of mixing for the NaCl�NaOH aqueousmixtures� The example indicates that the Pitzer model gives a precise description of theionic strength�medium dependence of the enthalpy of reaction even at high concentrations�provided that all the relevant Pitzer parameters for the reaction participants are known�Unfortunately� the data on the temperature derivative of the mixing parameters for thePitzer models are scarce� and the omission of these terms in a �reduced� Pitzer modelat high concentrations may result in errors� which are comparable with those of the SITmodel at these concentrations� We recommend to use the Pitzer and SIT models only forthe #rHm data in the limited ionic strength range up to �� mol � kg���
IX������ The extrapolation equations for the determination of the standard enthalpy ofreaction from the experimental #rHm data based on the Pitzer and the SITmodels
The previous discussion was made for a reaction� where the Pitzer or the SIT parametersare known for the reaction participants in the ionic medium� However� these parametersare in general only known for the single ion combinations� and not for complexes� Whendiscussing the experimental results for the enthalpy change of complex formation reactionsusing the Pitzer model it is convenient to write Eq� �IX���� as follows �as before� thisequation is valid only for the case of reactions studied at trace concentrations of the
���
Estimations of ionic strength corrections of thermodynamic data
Table IX���� The results of the calculation of the #rH�m value for the reaction H�O�l���
H� � OH� in NaCl medium at ����� K from the heat e�ects at �nite concentrationsbased on the Pitzer and the SIT model� The uncertainties of the experimental resultsare quoted from the original studies� the uncertainties of the calculated values of #rH
�m
result from both of the claimed error in the experimental data and the error of thecorrection terms� The CODATA recommended value for the reaction of water dissociationis #rH
a Our estimation of the uncertainty of the data from ���HAR�MAN�b The concentration exceeds the range of applicability of the Pitzer parameters for the HCl and
NaOH electrolytes
���
The concentration dependence of heats of reactions
reaction participants in solutions with a large excess of supporting ��� electrolyte��
#rH�m � #rHm � rL� � #�Z��AL
�
� pIm
� � bpIm
�
bln�� � b
qIm
�
�RT �#�Z��m�����LNX
g��Im�Im
�RT �m�#jZjCLNX � RT
�mX�
� RT �mX� g�Im� � RT�m�X� �IX���
where
X� � #����L�#
�
T
�p
�Xi
�i ����Lij �
Xi
�i
� ijT
�p
X� � #����L �Xi
�i ����Lij
X� � #CL ��
#
��
T
�p
�Xi
�iCLij �
�
Xi
�i
��ii�j
T
�p
the notation has been de�ned before �see Eq� �IX������ As practically all experimentaldeterminations of the enthalpy changes for the complex formation reactions have beenstudied at relatively high concentration of the ionic medium electrolytes� there is no reasonto take into account the contribution of higher order electrostatic terms for the reactionparticipants� because this contribution is approximately linear with the concentration �PIT� and therefore is accounted for mainly in the term X��The corresponding extrapolation equation for the SIT model is given by
Eq� �IX����
Example ��
In order to test the equations for the description of the concentration dependence of#rHm and the determination of #rH
�m at in�nite dilution� we have used data for the
reaction H�O�l� �� H� � OH� in NaClO� ionic medium� For this reaction the valueof #rH
�m is recommended by CODATA ��COX�WAG�� The experimental calorimetric
data in NaClO� medium at ��C have been obtained in three laboratories by Arnek andKakolowicz ��ARN�KAK� at ��� mol � kg��� Lobanov and Vasil�ev ��LOB�VAS� at�������� mol � kg��� and Maeda ��MAE� at ��� and ���� mol � kg��� The results at thesame ionic medium concentration� ��� mol � kg��� agree within ���� kJ �mol���The experimental results on #rHm corrected for the value of L� are given in Table IX����We used the weighted linear least�square method to obtain the regression parameters for
both the Pitzer and the Br�nsted�Guggenheim�Scatchard models� The regression analysiswas made by using the uncertainty estimates in #rHm� equal to ��� kJ�mol��� The pointat highest molality� ���� mol � kg��� was not used in the regression� because as discussed
���
Estimations of ionic strength corrections of thermodynamic data
Table IX���� The results of the experimental determinations of the #rHm for the reactionH�O�l��� H� �OH� in NaClO� medium� The uncertainties are given as claimed by theauthors�
in the previous example� the concentration range used should not exceed � mol � kg���this point also deviates from the general trend of the #rHm values�� The results of theregression are given in Table IX��� and shown in Figure IX����For the case of the Pitzer equation we tested models�
� with the determination of all the relevant parameters�� neglecting the contribution of the X� term� i�e�� all the ternary interactions�
� neglecting the contribution of the X� and X� terms� i�e�� neglecting the all ternaryinteractions and the ionic strength dependence of the second virial coe�cients�
The value of the Pitzer terms can only be predicted for X�� X� � ����LNa�OH � �
���LH�ClO�
����������������� � ������ kg �mol�� �K��� As the temperature derivativies ofthe mixing terms are not available� we can only estimate the values of the parameters X�
and X�� X� � ����LNa�OH��
���LH�ClO� � ������������������ � �������� kg �mol�� �K���
X� � CLNa�OH � CL
H�ClO� � ����� ��� � ���� ��� � ���� ���� kg� �mol�� � K���As in Examples � and � where we attempted to determine the Pitzer terms for a log��Kregression� we also obtain in this case very large uncertainties in the estimated values ofthe �tting parameters� By neglecting the contribution of the ternary terms we obtainmore precise estimates of the unknowns� Even so� the error in the X� term exceedsthe magnitude of this term� However� the contribution of this term a�ects the value of
��
The concentration dependence of heats of reactions
Table IX���� The results of the least square determination of unknowns in �tting equationsfor the reaction H�O�l��� H� �OH� in NaClO� medium� All the errors are given as ��The concentration units� for X�� X�� #�L � kg �mol�� �K��� for X� � kg� �mol�� �K���
�a� the mean square error per unit weight �� is de�ned as ��� �Pw��rHm �
�rHm�calc���n � m�� where w is the weighting factor determined as the recip�rocal square of the estimated uncertainty in �rHm value� �rHm�calc is the value ofthe heat of reaction calculated using the obtained regression parameters� n is thenumber of experimental data� m is the number of variables�
�b� neglecting the contribution of X� and X� terms��c� neglecting the contribution of X� term
the enthalpy change at in�nite dilution� The application of the Pitzer equation bothfor the description of the concentration dependence of heats of reaction� and of log��Kdata is an ill�conditioned task� The main problem is the reliable estimation of the #����L
parameter� which determines the concentration dependence of the second virial coe�cientin the Pitzer approach and� therefore� has a substantial in�uence on the estimated value of#rH
�m for the reaction� However� the determination of #�
���L parameter requires preciseexperimental data at low ionic strengths� where the relative contribution of this parameterto the value of #BL is most pronounced�
The SIT model results in a reliable value of the #rH�m term� and the value #�L �
��������������� kg�mol���K�� obtained by the regression is consistent with the estimatebased on the parameters �L�H��ClO�
� � and �L�Na��OH��� obtained from the enthalpies
of dilution of the corresponding electrolytes� #�L � �L�H��ClO�
It should be kept in mind that the omission of the parameter #����L may be essential
��
Estimations of ionic strength corrections of thermodynamic data
Figure IX���� The parametrization of the SIT and di�erent variants of the Pitzer models�see text for details� from the experimental values of #rHm for the reaction H�O�l� ��H� �OH� in NaClO� medium at ����� K and � atm�
for the accuracy of the #rH�m determination� The Pitzer equation with only the #�
���L isnot analogous to the SIT equation �see previous discussion of the simpli�ed one�parameterPitzer and the SIT model IV in Examples � and ��� The choice between the Pitzer andthe SIT models must be based on the number of data available� the ionic strength rangeused and the precision of the experimental results� In our experience� the existing data onheats of complex formation reactions do not allow the use of extrapolation equations morecomplex than the linear expression used here� In principle� one could try to estimate thevalues of the Pitzer parameter ����L using a procedure like the one employed to estimatethe ���� parameters� This can be done by comparison of the analytical equations for therelative partial molar enthalpies based on the SIT and the simpli�ed �without CL term�Pitzer approaches� However� an analysis of the typical values of the CL parameters forthe di�erent electrolytes from the available compilation ��PIT� showed that in generalthe contribution of the CL term cannot be neglected even at moderate ��� mol � kg���ionic strengths�
Example ��
Another example of the use of the Pitzer and the SIT model to obtain the value of#rH
�m for a complex formation equilibrium is the determination of #rH
�m for the reaction
�
The concentration dependence of heats of reactions
Table IX���� The experimental values of the enthalpy change for the reaction Hg�� �Cl� �� HgCl� in NaClO� ionic medium at ����� K� with our estimations of the uncer�tainties�
Hg�� � Cl� �� HgCl� at ����� K� There are a number of experimental calorimetricdeterminations of the enthalpies of this reaction in NaClO� medium ��CHR�IZA� ��ARN���CIA�GRI� ��VAS�KOZ�� see Table IX����We should notice that the example considered is exceptional in the sense that we have
experimental results from � independent laboratories� which are in good agreement withone another�We used the simpli�ed Pitzer�type of the regression neglecting the contribution of the
X� term� For this reaction #�Z�� � ��� #jZj � �� The function to be �tted is givenby
Y � #rHm �AL
� pIm
� � bpIm
�
bln�� � b
qIm
�
� �RT �m�����LNa�ClO�
g��Im�Im
� RT �m�CLNa�ClO�
� #rH�m � RT �mX� � RT
�mX� g�Im�
In Figure IX��� we plotted the function Y versus the concentration of the supportingelectrolyte� The parameters #rH
�m and X� depend on the relative contribution of the
term g�Im�� which is maximal at low concentrations� However� the existing data cannotde�ne this function with any reliability� which results in very large uncertainties in the�tting parameters values� #rH
mol�� �K��� X� � ��� � ���� ���� kg �mol�� �K��� All errors are given as ��
�
Estimations of ionic strength corrections of thermodynamic data
Figure IX���� The concentration dependence of the �tting function Y �see text for details�for the reaction Hg�� � Cl� �� HgCl� in NaClO� solutions at ����� K and � atm basedon the Pitzer model�
Based on the SIT model� one can de�ne the �tting function Y as follows
Y � #rHm �AL
pIm
� � ���pIm
� #rH�m �RT �m#�L
where #rH�m and the #�L can be determined using the weighted linear regression pro�
cedure� Figure IX�� shows that the agreement between the experimental data andthe model function� and the deviations from the linear dependence are within the es�timated uncertainty of experimental values ��������� kJ � mol���� The results are�#rH
�m � �������� kJ�mol��� #�L � �������������� kg�mol���K��� This value of
#rH�m can be compared with the reported literature estimates� ������� ��MAL�PAR�
and ��� ��� kJ �mol�� ��VAS�KOZ��
IX���� Conclusions
Our �ndings may be summarised as follows�
� The more extensively parametrized Pitzer model allows the most precise model�ling of mean�activity coe�cient data and equilibrium constants� provided that allinteraction parameters are known� If some parameters are missing �e�g� for ternaryinteractions between the �strong electrolyte� reactants� or interaction parameters forcomplexes� they have to be determined experimentally or to be estimated� otherwisethere may be a substantial loss of accuracy�
��
Conclusions
Figure IX��� The concentration dependence of the �tting function Y �see text for details�for the reaction Hg�� � Cl� �� HgCl� in NaClO� solutions at ����� K and � atm basedon the SIT model�
� Estimations of missing Pitzer parameters must be made from thermodynamic dataobtained in media of di�erent composition� The estimate of parameters for complexformation reactions and other equilibria is a particular case� They are based on con�centration equilibrium constants determined in di�erent ionic media�ionic strength�and we have demonstrated that it is di�cult� or impossible� to make precise esti�mates from such data using the complete Pitzer formalism� Approximations arenecessary� and this will reduce the precision of the model�
� In the di�erent examples we have demonstrated how di�erent model assumptionswill in�uence both the precision in the parameter estimates and the description ofthe concentration�ionic strength dependence of the experimental data�
� The SIT model is inherently less precise than the Pitzer model� because it containsfewer parameters� Hence� the precision in the description of mean�activity coe�cientdata in systems of strong electrolytes is much lower than for the Pitzer model� Asindicated above� it is in general necessary to make approximations in the completePitzer model� when describing complex formation reactions� For these cases� wehave shown that the less parametrized SIT model is in good agreement with thePitzer model in the concentration range ����� mol � kg���
� The Pitzer and SIT models are equivalent for the intercomparison of equilibriumconstants determined in ionic media� The structure of the Pitzer formalismmakes itmore suitable for recalculation of tabulated equilibrium constants to concentration
��
Estimations of ionic strength corrections of thermodynamic data
constants valid for media containing di�erent strong electrolytes and�or of very highionic strength� e�g� in salt brines�
Both models are internally consistent and the same formalism may also be used todescribe the concentration dependence of other thermodynamic quantities� such as en�thalpies of reaction� partial molar heat capacities� partial molar volumes� etc�From the structure of the models follows that their range of validity varies with the
chemical system studied� The information we have provided should enable the user ofthese models to make estimates of the precision to be expected from them� and to makea sensitivity analysis of how various assumptions a�ect the modelling of the system�The Pitzer model is included in many computer codes and a user of thermodynamic
data for complex formation reactions may therefore wish to use this formalism ratherthan the SIT model� One may then re�evaluate existing equilibrium constant data todeduce the required Pitzer parameters �very few such analyses have been reported in theliterature�� We have proposed the transformation of existing SIT interaction parametersinto a set of Pitzer parameters using correlations established in Sections IX���� and IX���as an alternative� However� this requires approximations in the Pitzer model� as indicatedabove�When modelling e�g� the speciation of trace elements in the systems encountered in
nature� one invariably has to make approximations of various kinds� The most importantinformation for the model is the identi�cation of the key chemical reactions� and this cannearly always be achieved� even if the relevant equilibrium constants are known no betterthan within ����� logarithmic units� The uncertainty expected from both the Pitzer andthe SIT models is smaller than this�Finally� the relative merits of di�erent models may give rise to controversy among the
users� Let us remind the reader that no model can give a �complete� description of asystem� or a process� A model is designed to achieve a �practical� purpose� a �partial�description of a more complex phenomenon� It is up to the user to decide if a particularmodel is useful� or not� for his�her purpose % In this chapter we have tried to make adescription�discussion of the advantages�draw�backs of two such models�