IASDATA\CHEMOURS\15418.002.004\E1 EMISSIONS TEST REPORT-LW 12/4/2018 IXM MANUFACTURING PROCESS POLYMERS STACK E1 EMISSIONS TEST REPORT TEST DATE: 17 MAY 2018 THE CHEMOURS COMPANY FAYETTEVILLE, NORTH CAROLINA Prepared for: THE CHEMOURS COMPANY 22828 NC Hwy 87 W Fayetteville, North Carolina 28306 Prepared by: WESTON SOLUTIONS, INC. 1400 Weston Way P.O. Box 2653 West Chester, Pennsylvania 19380 4 December 2018 W.O. No. 15418.002.004
Transcript
IASDATA\CHEMOURS\15418.002.004\E1 EMISSIONS TEST REPORT-LW 12/4/2018
IXM
MANUFACTURING PROCESS POLYMERS STACK
E1 EMISSIONS TEST REPORT TEST DATE: 17 MAY 2018
THE CHEMOURS COMPANY
FAYETTEVILLE, NORTH CAROLINA
Prepared for:
THE CHEMOURS COMPANY 22828 NC Hwy 87 W
Fayetteville, North Carolina 28306
Prepared by:
WESTON SOLUTIONS, INC. 1400 Weston Way
P.O. Box 2653 West Chester, Pennsylvania 19380
4 December 2018
W.O. No. 15418.002.004
IASDATA\CHEMOURS\15418.002.004\E1 EMISSIONS TEST REPORT-LW 12/4/2018 i
5.2.1 E1 ..............................................................................................................8 5.2.2 Flue Gas Velocity Measurements .............................................................9 5.2.3 Gas Composition .......................................................................................9
6. DETAILED TEST RESULTS AND DISCUSSION .....................................................12 APPENDIX A PROCESS OPERATIONS DATA APPENDIX B RAW AND REDUCED TEST DATA APPENDIX C LABORATORY ANALYTICAL REPORT APPENDIX D SAMPLE CALCULATIONS APPENDIX E EQUIPMENT CALIBRATION RECORDS APPENDIX F LIST OF PROJECT PARTICIPANTS
IASDATA\CHEMOURS\15418.002.004\E1 EMISSIONS TEST REPORT-LW 12/4/2018 ii
LIST OF FIGURES
Title Page
Figure 4-1 Polymers Stack Test Port and Traverse Point Location ............................................... 7
Figure 5-1 WESTON Sampling System ...................................................................................... 10
IASDATA\CHEMOURS\15418.002.004\E1 EMISSIONS TEST REPORT-LW 12/4/2018 iii
LIST OF TABLES
Title Page
Table 1-1 Sampling Plan for Polymers Stack ................................................................................. 3
Table 2-1 Summary of E1 Test Results ......................................................................................... 4
Table 6-1 Summary of E1 Test Data and Test Results Polymers Stack (17 May 2018) ............. 13
IASDATA\CHEMOURS\15418.002.004\E1 EMISSIONS TEST REPORT-LW 12/4/2018 1
1. INTRODUCTION
1.1 FACILITY AND BACKGROUND INFORMATION
The Chemours Fayetteville Works (Chemours) is located in Bladen County, North Carolina,
approximately ten miles south of the city of Fayetteville. Chemours operating areas on the site
include the Fluoromonomers, IXM and Polymer Processing Aid (PPA) manufacturing areas,
Wastewater Treatment, and Powerhouse.
Chemours contracted Weston Solutions, Inc. (WESTON) to perform E1 (CAS No. 3330-15-2)
emission testing on a single source at the facility IXM Resins Polymers stack (Polymers).
Testing was performed on 17 May 2018 and generally followed the procedures provided to the
North Carolina Department of Environmental Quality (NCDEQ). This report provides the results
from the emission test program.
1.2 TEST OBJECTIVES
The specific objectives for this test program were as follows:
Measure the emissions concentrations and mass emissions rates of EI from the Polymers Stack which is located in the IXM process.
Monitor and record process and emissions control data in conjunction with the test program.
Provide representative emissions data.
1.3 TEST PROGRAM OVERVIEW
During the emissions test program, the concentrations and mass emissions rates of E1 were
measured at the Polymers Stack.
Table 1-1 provides a summary of the test location and the parameters that were measured along
with the sampling/analytical procedures that were followed.
IASDATA\CHEMOURS\15418.002.004\E1 EMISSIONS TEST REPORT-LW 12/4/2018 2
Section 2 provides a summary of test results. A description of the process is provided in Section
3. Section 4 provides a description of the test location. The sampling and analytical procedures
are provided in Section 5. Detailed test results and discussion are provided in Section 6.
Process operating data, raw and reduced test data, laboratory analytical reports, sample
calculations, equipment calibration records, and a list of WESTON project participants are
provided in Appendices A through F, respectively.
Appendix C includes the summary reports for the laboratory analytical results. The full
laboratory data package is provided in electronic format and on CD with each hard copy.
IASDATA\CHEMOURS\15418.002.004\E1 EMISSIONS TEST REPORT-LW 12/4/2018 3
Table 1-1 Sampling Plan for Polymers Stack
Sampling Point & Location Polymers Stack Number of Tests: 3 Parameters To Be Tested: E1 Volumetric
Flow Rate and Gas Velocity
Carbon Dioxide
Oxygen Water Content
Sampling or Monitoring Method EPA Modified
Method 18 (M-18)
EPA M1, M2, M3A, and M4 in conjunction
with M-18 tests
EPA M3A Wet bulb dry bulb in
conjunction with M-18
tests Sample Extraction/ Analysis Method(s): GC/MS NA6 NA NA Sample Size > 0.4 ft3 NA NA NA NA Total Number of Samples Collected1 3 3 3 3 3 Reagent Blanks (Solvents, Resins)1 1 set 0 0 0 0 Field Blank Trains1 1 0 0 0 0 Proof Blanks1 1 set 0 0 0 0 Trip Blanks1,2 1 set 0 0 0 Lab Blanks 2 per fraction3 0 0 0 0 Laboratory or Batch Control Spike Samples (LCS)
2 per fraction3 0 0 0 0
Laboratory or Batch Control Spike Sample Duplicate (LCSD)
2 per fraction3 0 0 0 0
Media Blanks 2 sets4 0 0 0 0 Isotope Dilution Internal Standard Spikes Each sample 0 0 0 0 Total No. of Samples 75 3 3 3 3
Key: 1 Sample collected in field. 2 Trip blanks include one methanol sample per sample shipment. 3 Lab blank and LCS/LCSD includes one set per analytical fraction. 4 One set of media blank archived at laboratory at media preparation. 5 Actual number of samples collected in field. 6 Not applicable.
IASDATA\CHEMOURS\15418.002.004\E1 EMISSIONS TEST REPORT-LW 12/4/2018 4
2. SUMMARY OF TEST RESULTS
During the E1 test program on 17 May 2018, a total of three test runs were performed on the
Polymers Stack. Table 2-1 provides a summary of the E1 emission test results. Detailed test
IASDATA\CHEMOURS\15418.002.004\E1 EMISSIONS TEST REPORT-LW 12/4/2018 8
5. SAMPLING AND ANALYTICAL METHODS
5.1 STACK GAS SAMPLING PROCEDURES
The purpose of this section is to describe the stack gas emissions sampling trains and to provide
details of the stack sampling and analytical procedures utilized during the emissions test
program.
5.1.1 Pre-Test Determinations
Preliminary test data were obtained at each test location. Stack geometry measurements were
measured and recorded, and traverse point distances verified. A preliminary velocity traverse
was performed utilizing a calibrated "S" type pitot tube and an inclined manometer to determine
velocity profiles. Flue gas temperatures were observed with a calibrated direct readout panel
meter equipped with a chromel-alumel thermocouple. Preliminary water vapor content was
estimated by wet bulb/dry bulb temperature measurements.
A check for the presence or absence of cyclonic flow was previously conducted at the test
location. The cyclonic flow checks were negative (< 20°) verifying that the source was
acceptable for testing.
Calibration of pitot tubes, metering systems, and temperature measurement devices was
performed as specified in Section 5 of EPA Method 5 test procedures.
5.2 STACK PARAMETERS
5.2.1 E1
For all E1 tests, the sample train was a modified EPA Method 18 train using midget impingers.
During the tests on 17 May 2018 the sample run included six impingers. The first impinger was
of a modified short stem design. Impingers 1 through 6 each contained 20 milliliters of methanol.
The midget impingers were maintained in an ice bath. Each test was 60 minutes in duration
collecting at a rate of approximately 0.5 liters per minute.
Each impinger was recovered and included a methanol rinse of each impinger and connector.
The impinger contents and rinses were collected separately.
IASDATA\CHEMOURS\15418.002.004\E1 EMISSIONS TEST REPORT-LW 12/4/2018 9
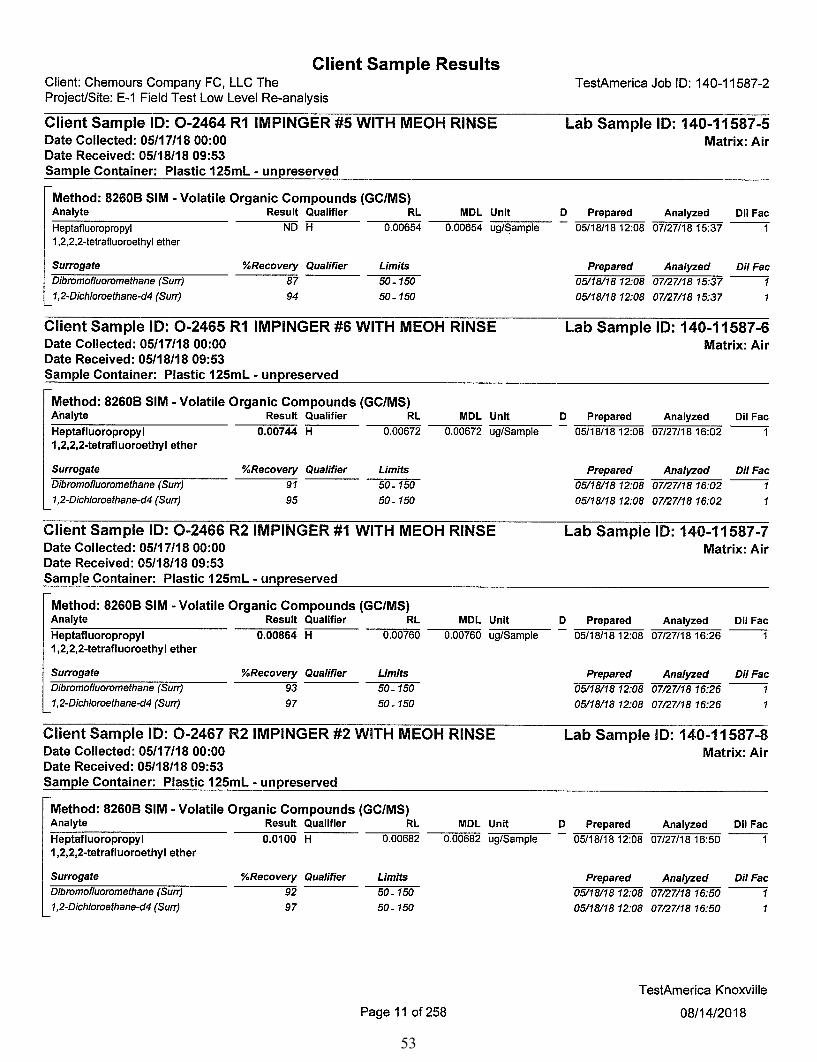
Each sample was analyzed by EPA SW-846 Method 8260B procedures by Gas Chromatography
(GC) Mass Spectrometry (MS). All results were non detect (ND) for all samples. TestAmerica
reran the samples in the Selective Ion Monitoring (SIM) mode which provides a significantly
lower detection limit. These results are provided in Appendix C.
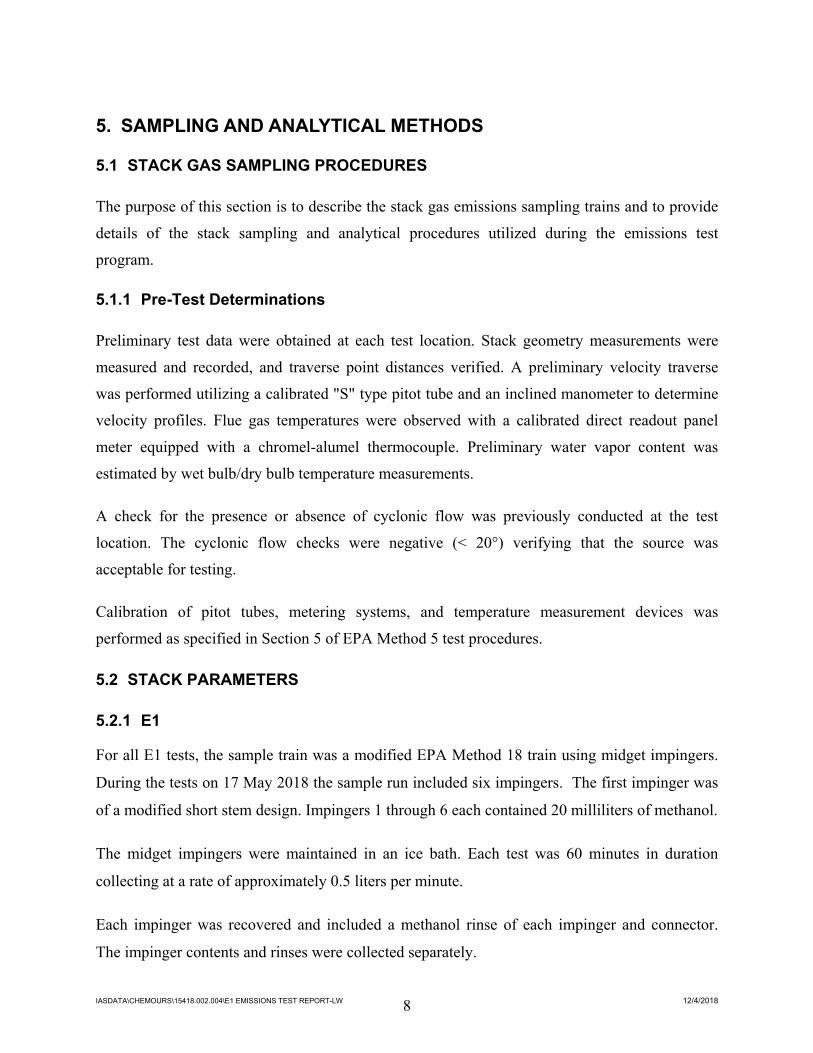
5.2.2 Flue Gas Velocity Measurements
The stack gas velocity was measured at the stack locations according to the procedures outlined
in EPA Methods 1 and 2. A S-type pitot and inclined manometer, or electronic pressure
transducer, were used to measure the velocity pressure at each traverse point. The traverse points
are selected in accordance to EPA Reference Method 1 on the basis of stack dimensions,
geometry and upstream and downstream disturbances. The traverse points for the stack locations
are presented on Figure 4-1.
One velocity traverse was conducted prior to and one conducted following each 60-minute test
run. The average of each velocity traverse was used to calculate the volumetric flow rate for
calculating mass rates for that rest run.
Stack gas moisture content was calculated by wet bulb/dry bulb measurement in conjunction
with each velocity traverse.
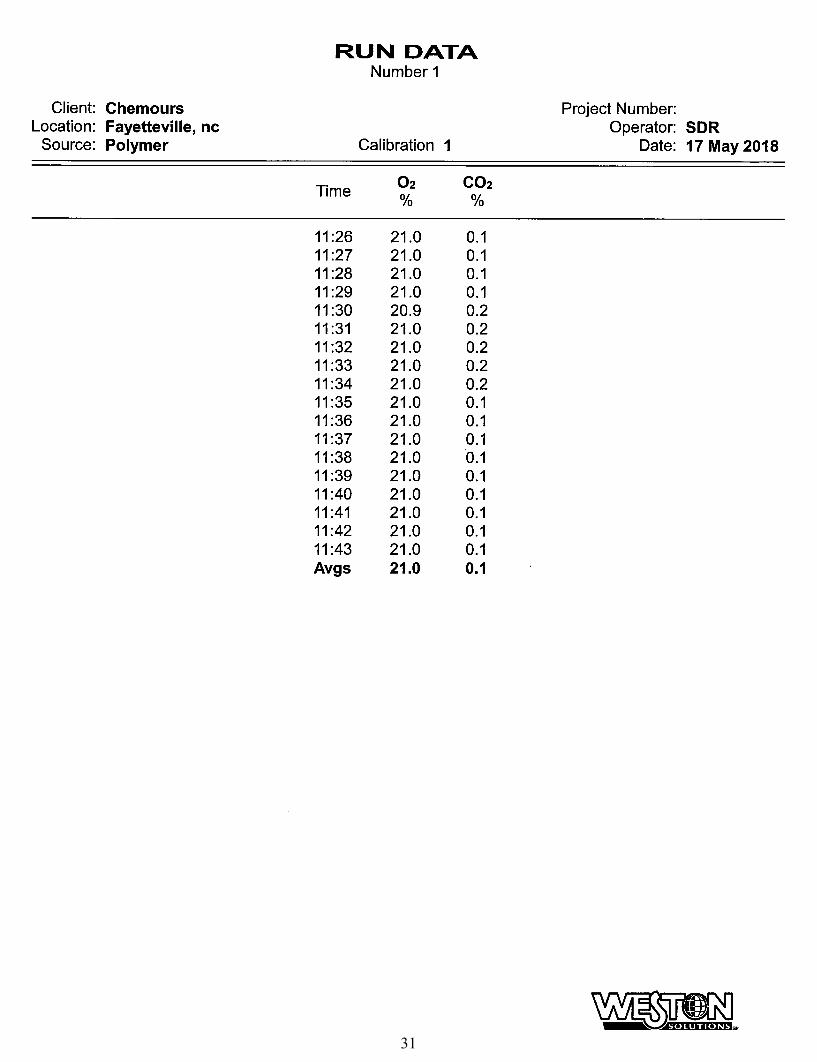
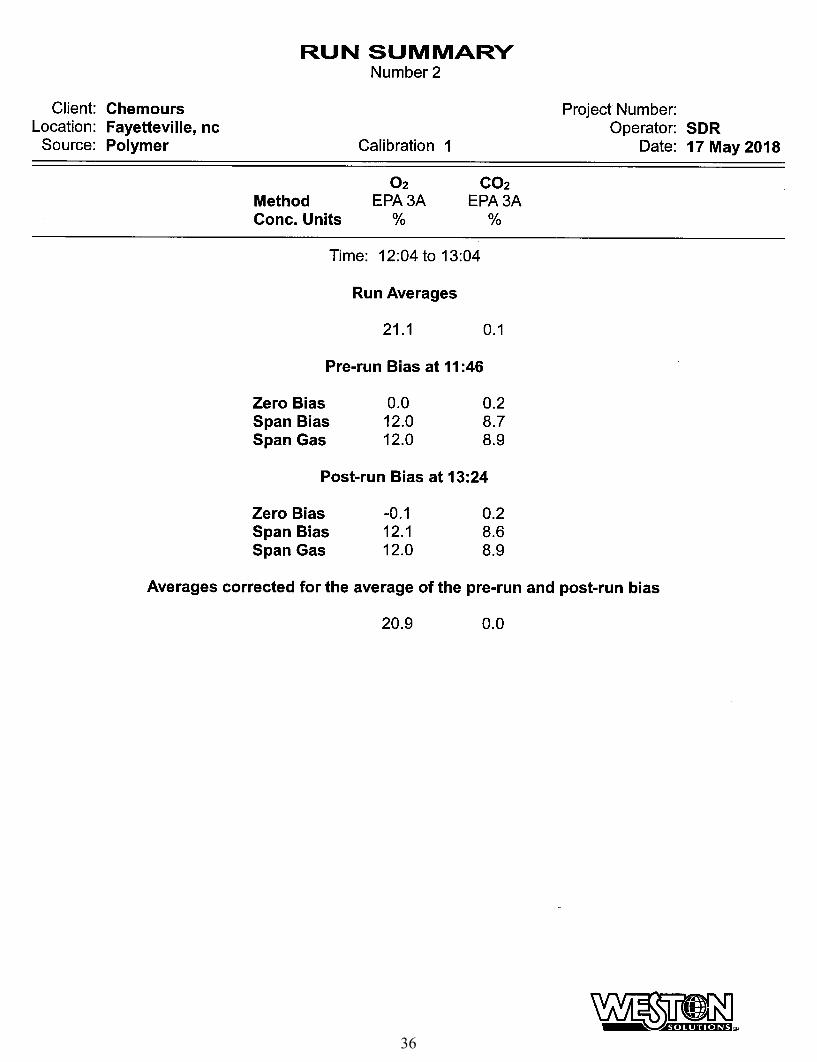
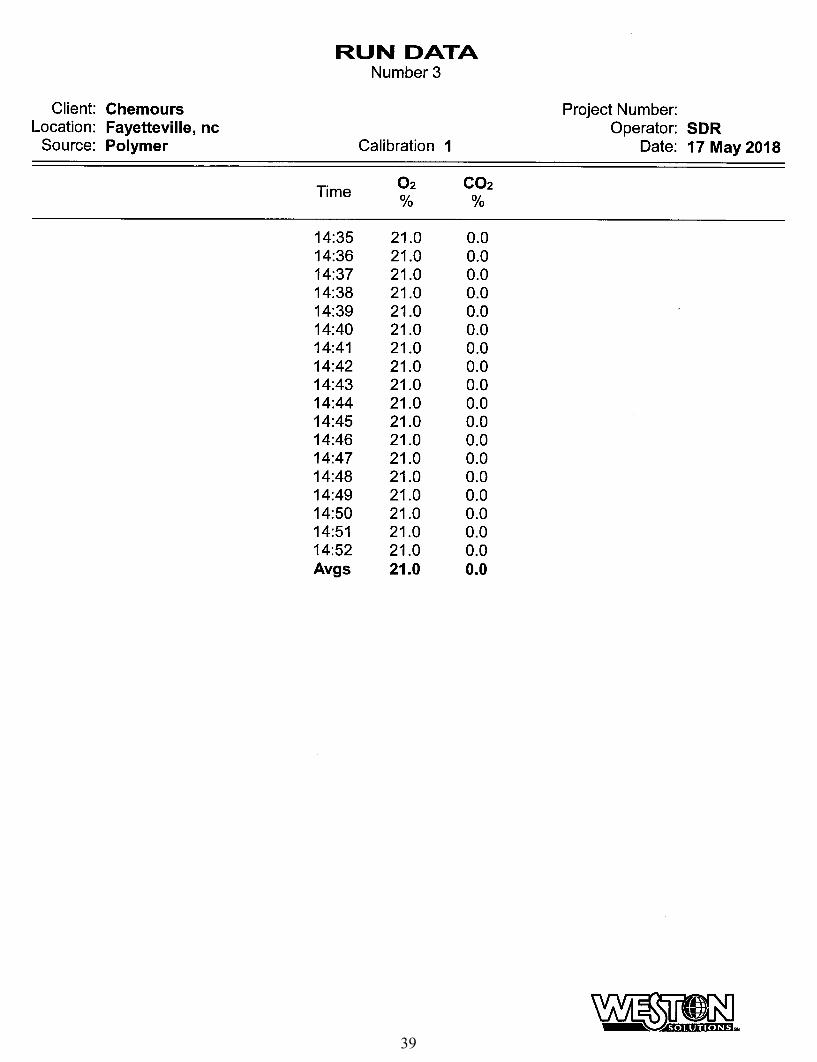
5.2.3 Gas Composition
The WESTON mobile laboratory equipped with instrumental analyzers was used to measure
carbon dioxide (CO2) and oxygen (O2) concentrations. A diagram of the WESTON sampling
system is presented in Figure 5-1.
0
STACK WALLSAMPLE VENT
CONDITIONING O
HEATED FILTER SYSTEM
HOLDER a~ ~i -iii
S MPLE HEATED SAMPLE LINE ~ O CO2 ~
MOISTURE ~PROBE ~ ~ - - iREMOVAL SAMPLE ~
PUMP O i02 i
~~ - -i
iiCALIBRATION BIAS LINE O i ANALOG
~a - -~ SIGNAL~ LINE
~~ - -~i
i
~~ -
~_ ~
i
GAS ~iANALYZERS i
iii
CALIBRATION e - - _ - iGASES ~_ ~
~= ON /OFF VALVE COMPUTER FOR DATAACQUISITION AND ACQUISTION
REDUCTION INTERFACE
FIGURE 5-1WESTON SAMPLING SYSTEM
IASDATAICHEMOURS115418.002.0041FIGURE 5-1 WESTON SAMPL~JG SYSTEM
IASDATA\CHEMOURS\15418.002.004\E1 EMISSIONS TEST REPORT-LW 12/4/2018 11
The sample was collected through the probe and a sample conditioner. At the end of the line, a
tee permitted the introduction of calibration gas. The output from the sampling system was
recorded electronically, and one-minute averages were recorded and displayed on a data logger.
Each analyzer was set up and calibrated internally by introduction of calibration gas standards
directly to the analyzer from a calibration manifold. The calibration manifold is designed with an
atmospheric vent to release excess calibration gas and maintains the calibration at ambient
pressure. The direct calibration sequence consisted of alternate injections of zero and mid-range
gases with appropriate adjustments until the desired responses were obtained. The high range
standards were then introduced in sequence without further adjustment.
The sample line integrity was verified by performing a bias test before and after each test period.
The sampling system bias test consisted of introducing the zero gas and one up range calibration
standard in excess to the valve at the probe end when the system was sampling normally. The
excess calibration gas flowed out through the probe to maintain ambient sampling system
pressure. Calibration gas supply was regulated to maintain constant sampling rate and pressure.
Instrument bias check response was compared to internal calibration responses to insure sample
line integrity and to calculate a bias correction factor after each run using the ratio of the
measured concentration of the bias gas certified by the calibration gas supplier.
The oxygen and carbon dioxide content of each stack gas was measured according to EPA
Method 3A procedures which incorporate the latest updates of EPA Method 7E. A Servomex
Model 4900 analyzer (or equivalent) was used to measure oxygen content. A Servomex Model
4900 analyzer (or equivalent) was used to measure carbon dioxide content of the stack gas. Both
analyzers were calibrated with EPA Protocol gases prior to the start of the test program and
performance was verified by sample bias checks before and after each test run.
IASDATA\CHEMOURS\15418.002.004\E1 EMISSIONS TEST REPORT-LW 12/4/2018 12
6. DETAILED TEST RESULTS AND DISCUSSION
Table 6-1 provides detailed test data and test results for the Polymers Stack.
The Method 3A sampling indicated that the O2 and CO2 concentrations were at ambient air
levels (20.9% O2, 0% CO2), therefore, 20.9% O2 and 0% CO2 values were used in all
calculations.
As discussed in Section 5.2.1, the samples were originally analyzed by standard GC/MS
procedures and all of the results were ND. TestAmerica reran the samples using the SIM mode.
As footnoted on Table 6-1, the first five impinger samples for run 1 were still ND and ½ the DL
was used in the calculation. All of the other sample fractions for all runs were detected above the
DL. Note that the SIM analysis was performed beyond the 14 day holding time; however, all
samples were maintained under chain of custody and were kept cool (≤ 4°C).
Table 6-1Chemours -Fayetteville, NC
Summary of E1 Test Data and Test ResultsPolymer Stack (May 17th, 2018)
TEST DATATest run number I 2 3Location Polymers Polymers PolymersTest date 5/17/2018 5117/18 5/17/18Test time period 1043-1143 1204-1304 1352-1452
SAMPLING DATADuration, minutes 60 60 60Average dry gas meter press. in. H2O 0.98 1.00 0.98Average dry gas meter temp. deg. F 74.7 77.8 77.9Average absolute meter temp. deg. R 534.7 537.8 537.9Sample vol. at meter cond., dcl 30.000 30.005 30.000Meter box calibration, Y 1.0150 1.0150 1.0150Barometric pressure, in. Hg 29.88 29.88 ?9.89
(I) Standard conditions = 68 deg. F. (20 deg. C.) and 29.92 inches Hg (?60mm Hg).(2) The reported laboratory values were non-detect for nn I impingers 1 through 5. The values entered for impingers I through 5represent 1/2 of the detection limit value and are noted as less than or equal to (5).
13
APPENDIX APROCESS OPERATIONS DATA
IASDATA\CHEMOURS\15418.002.0041Et EMISSIONS TEST REPORT-LW 8/10/2018
14
IXM Polymers
Date 5/17/2018
Time 900 1600 1100 1200
Stack Testing 1043 -1143 1204 -1304
Recycle Still
Polymerization Standard SR Polymer Production
Line 4 Extrusion
1300 1400 1500
1352-1452
IXM Polymers takes the following raw materials to produce the Suifonic Resin (polymer) —that then goes to the IXM Products area to make film and membrane:
PSEPVE
TFE/CO2
E2Dimer Peroxide
15
APPENDIX BRAW AND REDUCED TEST DATA
IASDATAICHEMOURS\15418.002.004\E1 EMISSIONS TEST REPORT-LW 8/10/2018
16
FIELD DATA SHEET Modified Method 18 - E1Polymer Stack
Client GHEMO[3RS Run No. ~1" ~~ Meter Box ID
~W.O.# 15418~02.003_000II Test Method M18 Meter Box Y
V .~ I JH~~' J I ~j~~,C~.~~ I ~g~ ~ I ~e~1P I ~ ~ I ~oemp
F~~
19
Determination of Stack Gas Velocity -Method 2Client Operator ~w Pitot Coeff (Cp)~
Location/Plant ~r~V~~[2Ui ~~~ ; NL Date ~~ Stack Area,ft2(/ls)~
Source ~~ iyltr ~Fi,~.(~ W.O. Number ~s~~$, ap`Z.m y Pkot TubelThertno ID ~~~ y~
w~~ ~ ~b~~ ~ ~~
~2 ~ 7 3{~3 ~ 7 ~
•:
-_
•::
~r ~ "' ~ ~ ••
r ~ ~ ~~; ; ~ ~ .,I ~ I v
~: :
•'. I~~I~~I~~I~~~~i~.~vi~~~~c-~ir~r~ir~ rr~~~~i~oi~~z~~~ir~r~~ir~r~~~~~~~~rr~~~~~■~~«~~~~I~Dlrir~i~iii~I~'~a~I Y i ~~~~I~Ei~I~'.'j'iirf~71 ~,,i~l~lr~'f►7i►Z~~~I~DI~i~~~i~.71rr~'L~~I~'`► iZyi~~I~01` . ~il~71~i~~~iZ'71~~~~i~~~I~~I«'i'~il~I~17i~11~~r7iT~~~I~~I~'L'~~il:~Ifi~L'iiL~'il~~ix~~~I~ml~~.~~'lia~l~"L~~~~~It~~i'1~7~i~~~I~~Irrlr~l~~~~ir~~si ~ c ■r~i~~~i . c~rz~~~I~~~I~~~l~ll~~~~l~~~~~~I~~'il~~i~l~+ ''k~ir~~l i • Cl.~~~I~~iil ~ ~ f~l w ~ irZ'~I~'~ri~~~I~t~I~~~I~~~Q~l~~~~~~i~oi~~■r~■i~r~~i~~r~~~~~~~~~ r ~■~~~~~~~~~~~~~~~~~~~ir~Ji~~~r~~
This report may not be reproduced except in full, and with written approval from the laboratory. For questions pleasecontact the Project Manager at the e-mail address or telephone number listed on this page.
McOH Prep Methanol Impinger Preparation None TAL KNX
Protocol References:
None =None
SW846 = "Test Methods For Evaluating Solid Waste, Physical/Chemical Methods", Third Edition, November 1986 And Its Updates.
Laboratory References:
TAL KNX = TestAmerica Knoxville, 5815 Middlebrook Pike, Knoxville, TN 37921, TEL (865)291-3000
TestAmerica Knoxville
Page 5 of 258 08/14/2018
47
Sample SummaryClient: Chemours Company FC, LLC TheProject/Site: E-1 Field Test Low Level Re-analysis
Lab Sample ID Client Sample ID Matrix140-11587-1 0-2460 R1 IMPINGER #1 WITH MEOH RINSE Air
140-11587-2 0-2461 R1 IMPINGER #2 WITH MEOH RINSE Air
140-11587-3 0-2462 R1 IMPINGER #3 WITH MEOH RINSE Air
140-11587-4 0-2463 R1 IMPINGER #4 WITH MEOH RINSE Air
140-11587-5 0-2464 R1 IMPINGER #5 WITH MEOH RINSE Air
140-11587-6 0-2465 R1 IMPINGER #6 WITH MEOH RINSE Air
140-11587-7 0-2466 R2 IMPINGER #1 WITH MEOH RINSE Air
140-11587-8 0-2467 R2 IMPINGER #2 WITH MEOH RINSE Air
140-11587-9 0-2468 R2 IMPINGER #3 WITH MEOH RINSE Air
140-11587-10_. _.
0-2469 R2 IMPINGER #4 WITH MEOH RINSE Air
140-11587-11 0-2470 R2 IMPINGER #5 WITH MEOH RINSE Air
140-11587-12 0-2471 R2 IMPINGER #6 WITH MEOH RINSE Air
140-11587-13 0-2472 R3 IMPINGER #1 WITH MEOH RINSE Air
140-11587-14 0-2473 R3 IMPINGER #2 WITH MEOH RINSE Air
140-11587-15 0-2474 R3 IMPINGER #3 WITH MEOH RINSE Air
140-11587-16 0-2475 R3 IMPINGER #4 WITH MEOH RINSE Air
140-11587-17 0-2476 R3 IMPINGER #5 WITH MEOH RINSE Air
140-11587-18 0-2477 R3 IMPINGER #6 WITH MEOH RINSE Air
140-11587-19 O-Y478 QC IMPINGER #1 WITH MEOH RINSE BT Air
140-11587-20 0-2479 QC IMPINGER #2 WITH MEOH RINSE BT Air
140-11587-21 0-2480 QC IMPINGER #3 WITH MEOH RINSE BT Air
140-11587-22 0-2481 QC IMPINGER #4 WITH MEOH RINSE BT Air
140-11587-23 0-2482 QC IMPINGER #5 WITH MEOH RINSE BT Air
140-11587-24 0-2483 QC IMPINGER #6 WITH MEOH RINSE BT Air
140-11587-25 0-2484 QC MEOH RB Air
140-11587-26 0-2485 QC MEOH TB Air
140-11587-27 0-2486 QC MEOH PB Air
TestAmerica Job ID: 140-11587-2
Collected Received05/17/18 00:00 05/18/18 09:53
05/17/18 00:00 05/18/18 09:53
05/17/18 00:00 05!18/18 09:53
05/17/18 00:00 05/18/18 09:53
05/17/18 00:00 05/18/18 09:53
05/17/18 00:00 05/18/1 S 09:53
05/17/18 00:00 05118/18 09:53
05/17/18 00:00 05/18/1 S 09:53
05/17/18 00:00 05/18/1 S 09:53
05/17/18 00:00 05/18!18 09:53
05/17/18 00:00 05/18/18 09:53
05/17/18 00:00 05/18/18 09:53
05!17/18 00:00 05/18/18 09:53
05/17/18 00:00 05/18/18 09:53
05/17/18 00:00 05/18/18 09:53
05/17!18 00:00 05/18/18 09:53
05/17/18 00:00 05/18/18 09:53
05/17/18 00:00 05/18/1 S 09:53
05/17/18 00:00 05/18!18 09:53
05/17/18 00:00 05/18/18 09:53
05!17/18 00:00 05/18/18 09:53
05!17/18 00:00 05/18/18 09:53
05/17/18 00:00 05/18/18 09:53
05/17/18 00:00 05/18/18 09:53
05/17/18 00:00 05/18/18 09:53
05/17/18 00:00 05/18/1 S 09:53
05/17/18 00:00 05/18/1 S 09:53
TestAmerica Knoxville
Page 6 of 258 08/1412018
48
Job Narrative140-11587-2
Sample Receipt
The samples were received on May 18, 2018 at 9:53 AM in good condition and properly preserved. The temperature of the cooler atreceipt was 0.1 ° C.
Quality Control and Data Interpretation
Unless otherwise noted, all holding times, and QC criteria were met and the test results shown in this report meet all applicable NELACrequirements.
GC/MS VOA
Impinger Sample Preparation and Analysis: Impinger samples were originally analyzed for the volatile organic target analytes by purgeand trap GCMS using TestAmerica Knoxville standard operating procedure KNOX-MS-0015, based on the following method:
SW 846 82608, "Volatile Organic Compounds by Gas Chromatography/ Mass Spectrometry (GC/MS)"
To enhance the detectability of the EPA 8260 Method the lab employed a selective ion monitoring analysis mode to use for the E-1samples. The methanol impinger samples were reprocessed using the more aggressive analytical technique. Samples processed by thismethod were run outside of the standard fourteen (14) day holding time, but were stored refrigerated in their original method solvent andcontainers.
Each sample is prepared by adding a known amount of sample to the purge water in a purge and trap vessel and spiking with internalstandards, surrogates, and matrix spike analytes (as needed). Volatile compounds are introduced into the gas chromatograph by thepurge and trap method. The components are separated using a gas chromatograph and detected using a mass spectrometer, whichprovides both qualitative and quantitative information.
Impinger sample results were calculated using the following equation:
Concentration, ~g/sample = (C x DF x W x Vt) / (Va)Where:C = On-column concentration, ~g/LDF =Dilution factorW =Volume of water purged, LVt =Methanol extract final volume, NLVa =Volume of e~ract analyzed, ~L
The volumes of each sample are initially measured for the calculation of the total mass of Fluoroether E-1 in the sample. Results arereported in total micrograms (ug).
No additional analytical or quality issues were noted, other than those described above or in the Definitions/Glossary page.
Page 7 of 258 ~ 08/14/2018
49
QC Association SummaryClient: Chemours Company FC, LLC The TestAmerica Job ID: 140-11587-2Project/Site: E-1 Field Test Low Level Re-analysis
GC/MS VOA
Analysis Batch: 22317
Lab Sample ID Client Sample ID Prep Type Matrix Method Prep Batch140-11587-1 0-2460 R1 IMPINGER #1 WITH MEOH RINSE TotallNA Air 82606 SIM 22604140-11587-2 0-2461 R1 IMPINGER #2 WITH MEOH RINSE Total/NA Air 82606 SIM 22604140-11587-4 0-2463 R1 IMPINGER #4 WITH MEOH RINSE Total/NA Air 82606 SIM 22604
140-11587-5_.
0-2464 R1 IMPINGER #5 WITH MEOH RINSE Total/NA Air 82608 SIM 22604
140-11587-6 0-2465 R1 IMPINGER #6 WITH MEOH RINSE Total/NA Air 82608 SIM 22604140-11587-7 0-2466 R2 IMPINGER #1 WITH MEOH RINSE Total/NA Air 82606 SIM 22604
140-11587-8 0-2467 R2 IMPINGER #2 WITH MEOH RINSE Total/NA Air 82608 SIM 22604140-11587-9 0-2468 R2 IMPINGER #3 WITH MEOH RINSE Total/NA Air 82606 SIM 22604140-11587-10 0-2469 R2 IMPINGER #4 WITH MEOH RINSE Total/NA Air 82606 SIM 22604140-11587-11 0-2470 R2 IMPINGER #5 WITH MEOH RINSE Total/NA Air 82606 SIM 22604140-11587-12 0-2471 R2 IMPINGER #6 WITH MEOH RINSE Total/NA Air 82608 SIM 22604140-11587-13 0-2472 R3 IMPINGER #1 WITH MEOH RINSE Total/NA Air 82608 SIM 22604140-11587-14 0-2473 R3 IMPINGER #2 WITH MEOH RINSE Total/NA Air 82608 SIM 22604140-11587-15 0-2474 R3 IMPINGER #3 WITH MEOH RINSE Total/NA Air 82608 SIM 22604
140-11587-16 0-2475 R3 IMPINGER #4 WITH MEOH RINSE Total/NA Air 82608 SIM 22604140-11587-17 0-2476 R3 IMPINGER #5 WITH MEOH RINSE Total/NA Air 82606 SIM 22604140-11587-18 0-2477 R3 IMPINGER #6 WITH MEOH RINSE Total/NA Air 82606 SIM 22604140-11587-19 0-2478 QC IMPINGER #1 WITH MEOH RINSE E Total/NA Air 82608 SIM 22604140-11587-20 0-2479 QC IMPINGER #2 WITH MEOH RINSE E Total/NA Air 82608 SIM 22604
MB 140-22604/2-A Method Blank Total/NA Air 82608 SIM 22604
LCS 140-22604/1-A Lab Control Sample Total/NA Air 82608 SIM 22604140-11587-4 MS 0-2463 R1 IMPINGER #4 WITH MEOH RINSE TotaUNA Air 82606 SIM 22604140-11587-4 MSD 0-2463 R1 IMPINGER #4 WITH MEOH RINSE Total/NA Air 82606 SIM 22604140-11587-5 MS 0-2464 R1 IMPINGER #5 WITH MEON RINSE Total/NA Air 82606 SIM 22604
Analysis Batch: 22361
Lab Sample ID Client Sample ID Prep Type Matrix Method Prep Batch140-11587-3 0-2462 R1 IMPINGER #3 WITH MEOH RINSE Total/NA Air 82608 SIM 22604140-11587-21 0-2480 QC IMPINGER #3 WITH MEOH RINSE E Total/NA Air 82608 SIM 22607140-11587-22 0-2481 QC IMPINGER #4 WITH MEOH RINSE E Total/NA Air 82606 SIM 22607140-11587-23 0-2482 QC IMPINGER #5 WITH MEOH RINSE E Total/NA Air 82608 SIM 22607140-11587-24 0-2483 QC IMPINGER #6 WITH MEOH RINSE E Total/NA Air 82608 SIM 22607
140-11587-25 0-2484 QC MEOH RB Total/NA Air 82608 SIM 22607
140-11587-26 0-2485 QC MEON TB Total/NA Air 82606 SIM 22607
140-11587-27 0-2486 QC MEOH PB Total/NA Air 82606 SIM 22607
MB 140-22607/2-A Method Blank Total/NA Air 82606 SIM 22607LCS 140-22607!1-A Lab Control Sample Total/NA Air 82608 SIM 22607
140-11587-5 MSD 0-2464 R1 IMPINGER #5 WITH MEOH RINSE Total/NA Air 82608 SIM 22604
140-11587-27 MS 0-2486 QC MEOH PB Total/NA Air 82608 SIM 22607
Lab Sample ID Client Sample ID Prep Type Matrix Method Prep Batch140-11587-1 0-2460 R1 IMPINGER #1 WITH MEOH RINSE Total/NA Air McOH Prep
140-11587-2 0-2461 R1 IMPINGER #2 WITH MEOH RINSE Total/NA Air McOH Prep
140-11587-3 0-2462 R1 IMPINGER #3 WITH MEOH RINSE Total/NA Air McOH Prep
140-11587-4 0-2463 R1 IMPINGER #4 WITH MEOH RINSE Total/NA Air McOH Prep
140-11587-5 0-2464 R1 IMPINGER #5 WITH MEOH RINSE Total/NA Air McOH Prep
140-11587-6 0-2465 R1 IMPINGER #6 WITH MEOH RINSE Total/NA Air McOH Prep
140-11587-7_. __
0-2466 R2 IMPINGER #1 WITH MEOH RINSE_
Total/NA_.
Air McOH Prep
140-11587-8 0-2467 R2 IMPINGER #2 WITH MEOH RINSE TotallNA Air McOH Prep
TestAmerica Knoxville
Page 8 of 258 08/14/2018
50
QC Association SummaryClient: Chemours Company FC, LLC The TestAmerica Job ID: 140-11587-2Project/Site: E-1 Field Test Low Level Re-analysis
GCIMS VOA (Continued)
Prep Batch: 22604 (Continued)
Lab Sample ID Client Sample ID Prep Type Matrix Method Prep Batch140-11587-9 0-2468 R2 IMPINGER #3 WITH MEOH RINSE Total/NA Air McOH Prep140-11587-10 0-2469 R2 IMPINGER #4 WITH MEOH RINSE Total/NA Air McOH Prep140-11587-11 0-2470 R2 IMPINGER #5 WITH MEOH RINSE Total/NA Air McOH Prep140-11587-12 0-2471 R2 IMPINGER #6 WITH MEOH RINSE Total/NA Air McOH Prep140-11587-13 0-2472 R3 IMPINGER #1 WITH MEOH RINSE Totai/NA Air McOH Prep140-11587-14 0-2473 R3 IMPINGER #2 WITH MEOH RINSE Total/NA Air McOH Prep140-11587-15 0-2474 R3 IMPINGER #3 WITH MEOH RINSE Total/NA Air McOH Prep140-11587-16
_.0-2475 R3 IMPINGER #4 WITH MEOH RINSE TotaUNA Air McOH Prep
140-11587-17 0-2476 R3 IMPINGER #5 WITH MEOH RINSE Total/NA Air McOH Prep140-11587-18 0-2477 R3 IMPINGER #6 WITH MEOH RINSE Total/NA Air McOH Prep140-11587-19
__0-2478 QC IMPINGER #1 WITH MEOH RINSE E Total/NA Air McOH Prep
140-11587-20 0-2479 QC IMPINGER #2 WITH MEOH RINSE E Total/NA Air McOH PrepMB 140-22604!2-A Method Blank Total/NA Air McOH PrepLCS 140-22604/1-A Lab Control Sample Total/NA Air McOH Prep140-11587-4 MS 0-2463 R1 IMPINGER #4 WITH MEOH RINSE Total/NA Air McOH Prep140-11587-4 MSD 0-2463 R1 IMPINGER #4 WITH MEOH RINSE Total/NA Air McOH Prep140-11587-5 MS 0-2464 R1 IMPINGER #5 WITH MEOH RINSE Total/NA Air McOH Prep140-11587-5 MSD 0-2464 R1 IMPINGER #5 WITH MEOH RINSE Total/NA Air McOH Prep
Prep Batch: 22607
Lab Sample ID Client Sample ID Prep Type Matrix Method Prep Batch140-11587-21 0-2480 QC IMPINGER #3 WITH MEOH RINSE E Total/NA Air McOH Prep140-11587-22 0-2481 QC IMPINGER #4 WITH MEOH RINSE E Total/NA Air McOH Prep140-11587-23 0-2482 QC IMPINGER #5 WITH MEOH RINSE E Total/NA Air McOH Prep140-11587-24 0-2483 QC IMPINGER #6 WITH MEOH RINSE E Total/NA Air McOH Prep
', 140-11587-25 0-2484 QC MEOH RB TotaUNA Air McOH Prep140-11587-26 0-2485 QC MEOH TB Total/NA Air McOH Prep140-11587-27 0-2486 QC MEOH PB Total/NA Air McOH PrepMB 140-22607/2-A Method Blank Total/NA Air McOH PrepACS 140-22607/1-A Lab Control Sample Total/NA Air McOH Prep140-11587-27 MS 0-2486 QC MEOH PB Total/NA Air McOH Prep140-11587-27 MSD 0-2486 QC MEOH PB Total/NA Air McOH Prep
TestAmerica Knoxville
Page 9 of 258 08/14/2018
51
Client Sample ResultsClient: Chemours Company FC, LLC The TestAmerica Job ID: 140-11587-2Project/Site: E-1 Field Test Low Level Re-analysis
Average 1.0150... - ._.~...~ ~ v~u~ ~ ~c Nu~an iy u n vuyi i u ~c vvci icai ~ i ~ciC~
Vd -Gas Volume passing through the dry gas meterTw - Temp of gas in the wet test meterTdi -Temp of the inlet gas of the dry gas meterTdo -Temp of the outlet gas of the dry gas meterTd -Average temp of the gas in the dry gas meter
1 -Channel Temps must agree with +/- 5°F or 3°C2 -Acceptable Temperature Difference less than 1.5
u - ~ ime of calibration run ~/~y * Pb * (td + 460 )Pb -Barometric Pressure Y = r0H -Pressure differential across Vd * LPb + ~H ~ * ~tw + 460orifice 13.6
Y -Ratio of accuracy of wet test 0.0317 * O H ~tw + 460 ~ O 2meter to dry gas meter ~H Pb * ~td + 460 ~] * [ Vw ]
ReferenceTemperature Temperature Reading from Individual Thermocouple Input' Average
Temp Diff = l Reference Temp(°F~+ 460 -Test Temp°F~+ 460~~
L Reference Tem °F + 460
Long Cal Vost Box #8 7-28-17 65
Post Test Wet Test Meter Calibration Datasheet for VOST Dry Gas Meter ConsoleCalibrator MDW VOST Box Number 8 Client Chemours
Date 15-Aug-18 Wet Test Meter Number 1066-1 Location/Plant Fayetteville, NC
Dry Gas Meter Number 3602380 PreTest Y 1.015
Setting Gas Volume Temperatures Baro Press, inHg (Pb)
2g.75
Liters perminute
Roto-meter
OrificeManometer
Wet Test Dry gas Meter
MeterWet Test
Dry Gas MeterMeter Results
in H2O
(DH)
liters
(Vw)litersVd
°FTw
Outlet, °C
(Tda)Inlet, °C(Td;)
Average, °FTd
Time, min
(0)Y
0.50 0.50 1.00 10.00.000
72.0 24.00 24.00 75.0' 11.8 0.993210.10010.100
0.50 0.50 1.00 10.00.000
72.0 24.00 24.00 75.0 11.7 1.003110.00010.001
0.50 0.50 1.00 10.00.000
72.0 24.00 24.00 75.0 11.5 1.00349.9989,998
1 -Tolerance for Y is less than 0.0500 Average 0.9999
Difference O.Q151
vw -vas volume passing through the wet test meterVd -Gas Volume passing through the dry gas meterTw -Temp of gas in the wet test meterTdi -Temp of the inlet gas of the dry gas meter
Tdo -Temp of the outlet gas of the dry gas meterTd -Average temp of the gas in the dry gas meter
0 -Time of calibration run
Pb -Barometric Pressure
0H -Pressure differential acrossorifice
Y -Ratio of accuracy of wet testmeter to dry gas meter
Y _ Vw *Pb *(td+460)
Vd * LPb + ~H~l * (finr + 46013.6
0.0317 * D H (tw + 460 ~ * O Z
~H - [Pb * (td + 460 ~] * [ ~/~v
• • • ~ • '-~ - a'',~~
6 sc~►.~~ir` r~s
66
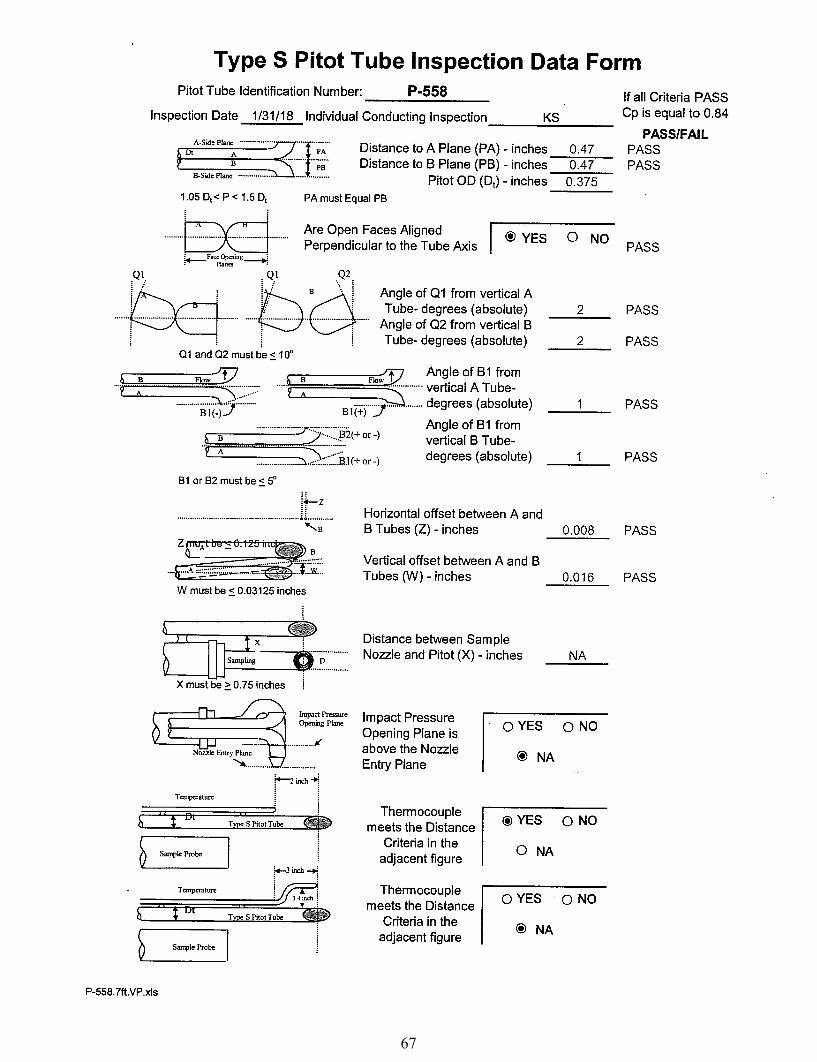
Type S Pitot Tube Inspection Data FormPitot Tube Identification Number: P-558
Inspection Date 1/31/18 Individual Conducting Inspection KS
"-S~`P'a"` ~~~'~~~~~ Distance to A Plane (PA) -inches 0.47B Pe Distance to B Plane (PB) -inches 0.47
as~a~e~ •--•••-~- --~~.~~~~--~ Pitot OD (D~) -inches 0.3751.05 D~< P < 1.5 D, PA must Equal PB
If all Criteria PASSCp is equal to 0.84
PASS/FAILPASSPASS
Are Open Faces Aligned OYES O NOPerpendicular to the Tube Axis PASS
Face Op~ing+— Planes —r/~
Q1, . ~C~ ,Q2,
s~;
Q1 and Q2 must be < 10°
Angle of Q1 from vertical ATube- degrees (absolute)Angle of Q2 from vertical BTube- degrees (absolute)
B ~w~ B ~W t Angle of 61 from.... .............-..-. -... ..-~ ...~ vertical A Tube-A ..... A
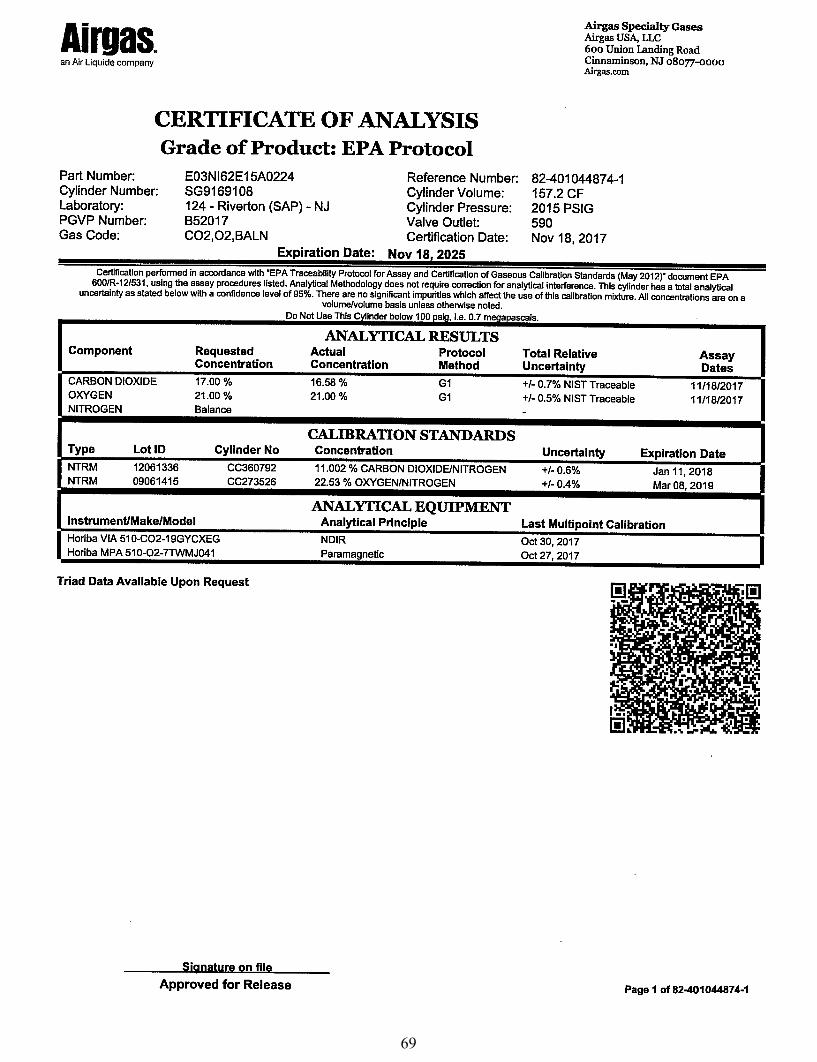
Airgas Specialty GasesAirgas USA, LLC60o Union Landing RoadCinnaminson, NJ o8oT7-0000Airgas.com
82-401044874-1157.2 CF2015 PSIG590Nov 18, 2017
Expiration Date: Nov 18, 2025Certification performed in accordance with "EPA Traceability Proto~l for Assay and Certification of Gaseous Calibratlon Standards (May 2012)" document EPA600/R-12/531, using the assay procedures listed. Analytical Methodology does not require correction for analytical interFerence. This cylinder has a total analyticical
uncertainty as stated below with a confidence level of 95%. There are no significant impurities which affect the use of this calibration mixture. All concentrations are on avolumelvolume basis unless otherwise noted.
Do Not Use This tinder below 100 si , i.e. 0.7 me a ascals.
ANALYTICAL RESULTSComponent Requested Actual Protocol Total Relative Assay
CALIBRATION STANDARDSType Lot ID Cylinder No Concentration Uncertainty Eupiration DateNTRM 12061336 CC360792 11.002 %CARBON DIOXIDElNITROGEN +/- 0.6% Jan 11, 2018NTRM 09061415 CC273526 22.53 %OXYGEN/NITROGEN +/- 0.4% Mar OS, 2019
ANALYTICAL EQUIPMENTInstrument/Make/Model Analytical Principle Last Multipoint CalibrationHoriba VIA 510-0O2-19GYCXEG NDIR Oct 30, 2017Horiba MPA 510-02-7TWMJ041 Paramagnetic Oct 27, 2017
Triad Data Available Upon Request
Signature on fie
Approved for Release Page 1 of 82-401044874-1
69
Airgas.en Air Liquide company
CERTIFICATE OF ANALYSISGrade of Product: EPA Protocol
Airgas Specialty Gasean~~ trsn, itc60o Union landing Road(tinnaminaoII, NJ 080~'j-0000Airgas.com
82-401151034-1150.5 CF2015 PSIG590Mar 16, 2018
Expiration Date: Mar 16.2026Certlflcatlon performed In accordance wlth 'EPA Traceab(Ifty Protocol for Assay and Certlflcatlon of Gaseous Calibration Standartis (May 2012)' document EPA600lR-12/531, using the assay procedures listed. AnalyBpl Methodology does not require cortectlon for analytical inteAerence. This cylinder has e total anatytical
uncertainty as stated below with a confidence level of 95%. There are no significant impurfdes which affect the use of this calibratlon mixture. All concentrations ars on avolume/volume basis unless otherwise noted.
Do Not Use Thfs inder below 100 s i.e. 0.7 m a scats.
ANt~I.i'TI~:AI. RE'.Si7I.TS►Component Requested Actual Protocol Total Relative Assay
CALIBRATION STANDARDSType Lot ID Cylinder No Concentration Uncertainty F~cpiration DateNTRM 13060609 CC413575 13.359 %CARBON DIOXIDE/fVITROGEN +/- 0.6% May 09, 2019NTRMpIus 09060208 CC262337 9.961 % OXYGENMITROGEN +/- 0.3% Nov 08, 2018
ANALYTICAL EQUIPMENTInstrument/Make/Model Analytical Principle Last Multipoint CalibrationHoriba VIA 510-0O2-19GYCXEG NDIR Feb 23, 2018Horiba MPA 510-02-71WMJ041 Paramagnetic Feb 23, 2018
Triad Data Available Upon Request
Signature on fileApproved for Release Page 1 of 82.401151034-1
70
APPENDIX FLIST OF PROJECT PARTICIPANTS
IASDATA\CHEMOURS\15418.002.004\E1 EMISSIONS TEST REPORT-LW 8 /1 012 01 8
71
The following WESTON employees participated in this project.
Paul Meeter Senior Project Manager
Steve Rathfon Team Leader
Kyle Schweitzer Team Member
Matt Winkeler Team Member
Jack Mills Team Member
IASDATA\CHEMOURSN5418.002.004\E1 EMISSIONS TEST REPORT-LW 8/10/2018