J. Fluid Mech. (2016), vol. 802, pp. 775–805. c Cambridge University Press 2016 doi:10.1017/jfm.2016.468 775 Droplet impact on a thin liquid film: anatomy of the splash Christophe Josserand 1, 2, †, Pascal Ray 1, 2 and Stéphane Zaleski 1, 2 1 Sorbonne Universités, UPMC Univ Paris 06, UMR 7190, Institut Jean Le Rond d’Alembert, F-75005, Paris, France 2 CNRS, UMR 7190, Institut Jean Le Rond d’Alembert, F-75005, Paris, France (Received 30 November 2015; revised 6 May 2016; accepted 12 July 2016) We investigate the dynamics of drop impact on a thin liquid film at short times in order to identify the mechanisms of splash formation. Using numerical simulations and scaling analysis, we show that it depends both on the inertial dynamics of the liquid and the cushioning of the gas. Two asymptotic regimes are identified, characterized by a new dimensionless number J : when the gas cushioning is weak, the jet is formed after a sequence of bubbles are entrapped and the jet speed is mostly selected by the Reynolds number of the impact. On the other hand, when the air cushioning is important, the lubrication of the gas beneath the drop and the liquid film controls the dynamics, leading to a single bubble entrapment and a weaker jet velocity. Key words: drops, drops and bubbles, interfacial flows (free surface) 1. Introduction Droplet collisions and impacts are iconic multiphase flow problems: rain, atomization of liquid jets, ink-jet printing and stalagmite growth all involve impact in one manner or another (Rein 1993; Yarin 2006; Josserand & Thoroddsen 2016). The droplet may impact on a dry surface, a thin liquid film or a deep liquid bath. In all cases, impact may lead to the spreading of the droplet or to a splash whereby a myriad of smaller droplets are ejected far away from the zone of impact (Rioboo, Marengo & Tropea 2001). Control of the outcome of impact is crucial for applications: for instance, spreading is desirable for coating or ink-jet printing while splashing may improve the efficiency of evaporation and mixing in combustion chambers. Two distinct types of splash, ‘prompt’ and ‘ordinary’, are now usually distinguished. The prompt splash is defined as a very early ejection of liquid at a time t D/U 0 where D is the droplet diameter and U 0 its velocity. A very thin liquid jet is formed, called the ejecta sheet (Thoroddsen 2002), projected at high velocity, initially almost horizontally, and it is expected to disintegrate eventually into very small and rapid droplets. The second type of splash, often called also the corolla or crown splash, occurs at later times, through the formation of a vertical corolla ending in a circular rim that destabilizes into fingers and droplets (Deegan, Brunet & Eggers 2008; Agbaglah et al. 2015). † Email address for correspondence: [email protected]
Droplet impact on a thin liquid film: anatomy ofthe splash
Christophe Josserand1,2,†, Pascal Ray1,2 and Stéphane Zaleski1,2
1Sorbonne Universités, UPMC Univ Paris 06, UMR 7190, Institut Jean Le Rond d’Alembert,F-75005, Paris, France
2CNRS, UMR 7190, Institut Jean Le Rond d’Alembert, F-75005, Paris, France
(Received 30 November 2015; revised 6 May 2016; accepted 12 July 2016)
We investigate the dynamics of drop impact on a thin liquid film at short times inorder to identify the mechanisms of splash formation. Using numerical simulations andscaling analysis, we show that it depends both on the inertial dynamics of the liquidand the cushioning of the gas. Two asymptotic regimes are identified, characterized bya new dimensionless number J: when the gas cushioning is weak, the jet is formedafter a sequence of bubbles are entrapped and the jet speed is mostly selected bythe Reynolds number of the impact. On the other hand, when the air cushioning isimportant, the lubrication of the gas beneath the drop and the liquid film controls thedynamics, leading to a single bubble entrapment and a weaker jet velocity.
Key words: drops, drops and bubbles, interfacial flows (free surface)
1. Introduction
Droplet collisions and impacts are iconic multiphase flow problems: rain, atomizationof liquid jets, ink-jet printing and stalagmite growth all involve impact in one manneror another (Rein 1993; Yarin 2006; Josserand & Thoroddsen 2016). The droplet mayimpact on a dry surface, a thin liquid film or a deep liquid bath. In all cases, impactmay lead to the spreading of the droplet or to a splash whereby a myriad of smallerdroplets are ejected far away from the zone of impact (Rioboo, Marengo & Tropea2001). Control of the outcome of impact is crucial for applications: for instance,spreading is desirable for coating or ink-jet printing while splashing may improve theefficiency of evaporation and mixing in combustion chambers. Two distinct types ofsplash, ‘prompt’ and ‘ordinary’, are now usually distinguished. The prompt splash isdefined as a very early ejection of liquid at a time t�D/U0 where D is the dropletdiameter and U0 its velocity. A very thin liquid jet is formed, called the ejectasheet (Thoroddsen 2002), projected at high velocity, initially almost horizontally, andit is expected to disintegrate eventually into very small and rapid droplets. The secondtype of splash, often called also the corolla or crown splash, occurs at later times,through the formation of a vertical corolla ending in a circular rim that destabilizesinto fingers and droplets (Deegan, Brunet & Eggers 2008; Agbaglah et al. 2015).
FIGURE 1. (Colour online) Snapshots of a droplet impacting on a thin liquid film for theparameters in tables 1 and 2, i.e. We= 500, Re= 2000 and St= 2.26× 10⁻⁶, so that thejet number is J = 0.041. For the sake of visualization, the liquid of the droplet and ofthe layer have been coloured green and blue respectively, although it is the same liquid.The gas phase is coloured dark blue. The snapshots correspond to the dimensionless timesU0t/D=−0.033, 0.0167, 0.083, 0.133, 0.217 and 0.767 respectively.
Very often, these two mechanisms are not easy to distinguish clearly since theyhappen in a sequence, the ejecta sheet being a precursor of the corolla, as illustratedby the numerical simulations of a droplet impact on a thin liquid film, shown infigure 1.
The dynamics of droplet impact is complex, involving singular surface deformationand pressure values in the inviscid limit and several instabilities of surface evolution,so that an overall understanding of the whole process is still lacking. In particular,the splash depends on many physical parameters, the most important being the impactvelocity. Obviously, high velocities promote the splash while at low velocities thedroplet gently spreads. More precisely, the splashing–spreading transition dependsmostly on the balance, in the liquid, between inertial and viscous forces (Stow &Hadfield 1981; Mundo, Sommerfeld & Tropea 1995; Yarin & Weiss 1995; Josserand& Zaleski 2003), characterized by the Reynolds and Weber numbers defined below.Although droplet impact on a solid surface or on a liquid film shows similar outputs,the physical mechanisms leading to these effects often have different origins. Fordroplet impact on solids, the surface properties play an important role, through itsroughness and the contact line dynamics for instance. There, a remarkable discoveryhas been made recently: the surrounding gas (usually air) also plays a crucial role insplash formation (Xu, Zhang & Nagel 2005), and understanding in detail the influence
Anatomy of the splash 777
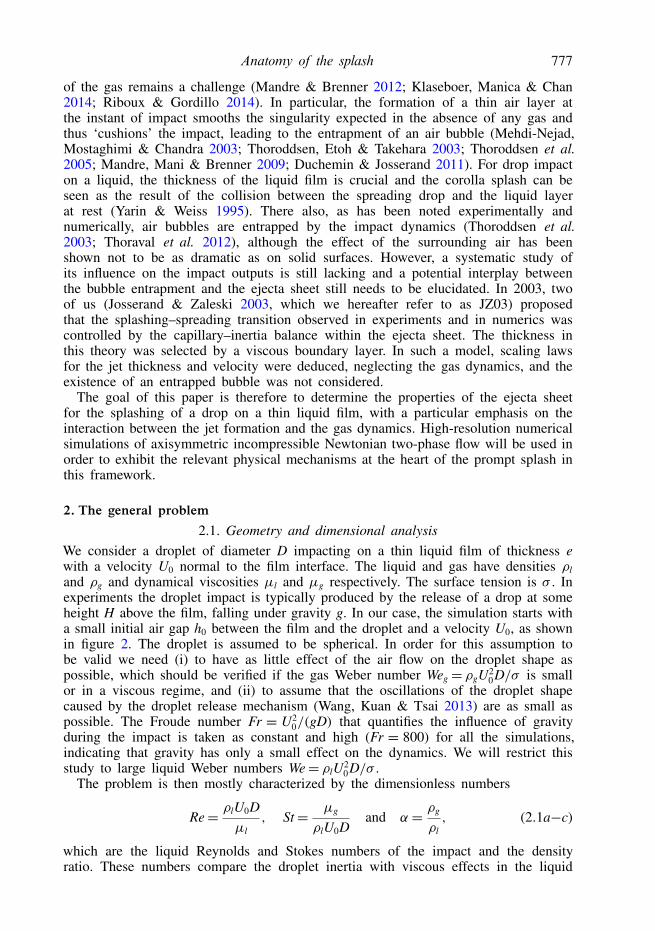
of the gas remains a challenge (Mandre & Brenner 2012; Klaseboer, Manica & Chan2014; Riboux & Gordillo 2014). In particular, the formation of a thin air layer atthe instant of impact smooths the singularity expected in the absence of any gas andthus ‘cushions’ the impact, leading to the entrapment of an air bubble (Mehdi-Nejad,Mostaghimi & Chandra 2003; Thoroddsen, Etoh & Takehara 2003; Thoroddsen et al.2005; Mandre, Mani & Brenner 2009; Duchemin & Josserand 2011). For drop impacton a liquid, the thickness of the liquid film is crucial and the corolla splash can beseen as the result of the collision between the spreading drop and the liquid layerat rest (Yarin & Weiss 1995). There also, as has been noted experimentally andnumerically, air bubbles are entrapped by the impact dynamics (Thoroddsen et al.2003; Thoraval et al. 2012), although the effect of the surrounding air has beenshown not to be as dramatic as on solid surfaces. However, a systematic study ofits influence on the impact outputs is still lacking and a potential interplay betweenthe bubble entrapment and the ejecta sheet still needs to be elucidated. In 2003, twoof us (Josserand & Zaleski 2003, which we hereafter refer to as JZ03) proposedthat the splashing–spreading transition observed in experiments and in numerics wascontrolled by the capillary–inertia balance within the ejecta sheet. The thickness inthis theory was selected by a viscous boundary layer. In such a model, scaling lawsfor the jet thickness and velocity were deduced, neglecting the gas dynamics, and theexistence of an entrapped bubble was not considered.
The goal of this paper is therefore to determine the properties of the ejecta sheetfor the splashing of a drop on a thin liquid film, with a particular emphasis on theinteraction between the jet formation and the gas dynamics. High-resolution numericalsimulations of axisymmetric incompressible Newtonian two-phase flow will be used inorder to exhibit the relevant physical mechanisms at the heart of the prompt splash inthis framework.
2. The general problem2.1. Geometry and dimensional analysis
We consider a droplet of diameter D impacting on a thin liquid film of thickness ewith a velocity U0 normal to the film interface. The liquid and gas have densities ρland ρg and dynamical viscosities µl and µg respectively. The surface tension is σ . Inexperiments the droplet impact is typically produced by the release of a drop at someheight H above the film, falling under gravity g. In our case, the simulation starts witha small initial air gap h0 between the film and the droplet and a velocity U0, as shownin figure 2. The droplet is assumed to be spherical. In order for this assumption tobe valid we need (i) to have as little effect of the air flow on the droplet shape aspossible, which should be verified if the gas Weber number Weg= ρgU2
0D/σ is smallor in a viscous regime, and (ii) to assume that the oscillations of the droplet shapecaused by the droplet release mechanism (Wang, Kuan & Tsai 2013) are as small aspossible. The Froude number Fr = U2
0/(gD) that quantifies the influence of gravityduring the impact is taken as constant and high (Fr = 800) for all the simulations,indicating that gravity has only a small effect on the dynamics. We will restrict thisstudy to large liquid Weber numbers We= ρlU2
0D/σ .The problem is then mostly characterized by the dimensionless numbers
Re= ρlU0Dµl
, St= µg
ρlU0Dand α = ρg
ρl, (2.1a−c)
which are the liquid Reynolds and Stokes numbers of the impact and the densityratio. These numbers compare the droplet inertia with viscous effects in the liquid
778 C. Josserand, P. Ray and S. Zaleski
e
R
h
U
FIGURE 2. Sketch of the numerical simulation. A spherical droplet of radius R andvelocity U0 is considered at a distance h0 from a liquid film of thickness e.
and gas, respectively, and compare the liquid to the gas inertia. We note that ρl/ρghas to be very large if one wants simultaneously to have Weg� 1 and We� 1. Anadditional dimensionless number is the aspect ratio between the liquid film and thedroplet, e/D, which we keep relatively small and constant in this study. We expect theinitial gas layer aspect ratio h0/D to be irrelevant if the conditions described above(Fr � 1, Weg < 1) are satisfied and h0 is larger than the characteristic thickness hbdefined below. Compressibility effects are characterized by the Mach numbers Ma=U/al,g, where al (respectively ag) is the speed of sound in the liquid (respectivelygas), and in all our simulations these Mach numbers remain small enough so thatcompressibility effects can be neglected (Lesser & Field 1983).
We note that the axisymmetric flow assumption is not valid when digitationsand splash droplets form. However, at short times, before these instabilities candevelop and particularly before the jet is created, we can consider this assumptioncorrect (Agbaglah & Deegan 2014). Otherwise the general three-dimensional (3-D)problem remains a grand numerical challenge because of the large range of scalesinvolved (Gueyffier & Zaleski 1998; Rieber & Frohn 1998). Despite some recentnumerical results (Fuster et al. 2009), realistic 3-D numerical simulations of dropletimpact at short times are as yet hard to attain. Moreover, a solid basis for the analysisof the scaling of 3-D flow may only be attained when the scaling of 2-D flow hasbeen uncovered. We thus postpone a detailed 3-D study of droplet impact for futurework.
2.2. Scaling analysisWe analyse now the different mechanisms at play during droplet impact using simplescaling arguments. Recall that surface tension and gravity can be neglected, and ina first step, we will consider also that the surrounding gas has negligible effects.We then quite naturally define t = 0 as the time at which the undeformed, sphericaldroplet at uniform velocity would touch the undeformed, planar liquid surface. Withthis definition of time, the initial time is t0 =−h0/U0.
We will now use an important geometrical argument first suggested by Wagner(1932): considering the intersection of the falling sphere with the impacted film, itis straightforward to define the vertical length scale as `z = U0t and the horizontal
Anatomy of the splash 779
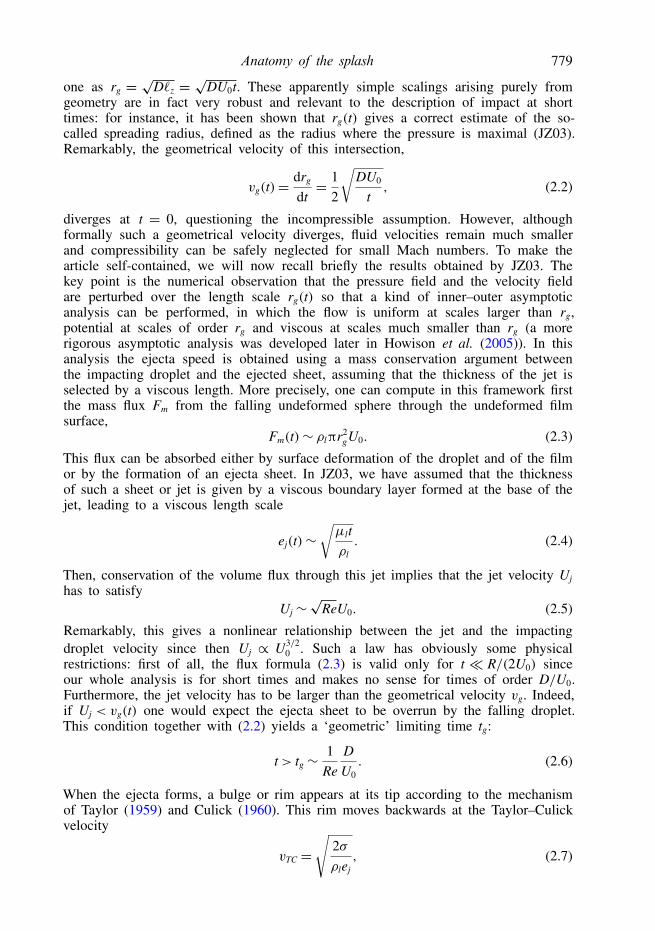
one as rg = √D`z = √DU0t. These apparently simple scalings arising purely fromgeometry are in fact very robust and relevant to the description of impact at shorttimes: for instance, it has been shown that rg(t) gives a correct estimate of the so-called spreading radius, defined as the radius where the pressure is maximal (JZ03).Remarkably, the geometrical velocity of this intersection,
vg(t)= drg
dt= 1
2
√DU0
t, (2.2)
diverges at t = 0, questioning the incompressible assumption. However, althoughformally such a geometrical velocity diverges, fluid velocities remain much smallerand compressibility can be safely neglected for small Mach numbers. To make thearticle self-contained, we will now recall briefly the results obtained by JZ03. Thekey point is the numerical observation that the pressure field and the velocity fieldare perturbed over the length scale rg(t) so that a kind of inner–outer asymptoticanalysis can be performed, in which the flow is uniform at scales larger than rg,potential at scales of order rg and viscous at scales much smaller than rg (a morerigorous asymptotic analysis was developed later in Howison et al. (2005)). In thisanalysis the ejecta speed is obtained using a mass conservation argument betweenthe impacting droplet and the ejected sheet, assuming that the thickness of the jet isselected by a viscous length. More precisely, one can compute in this framework firstthe mass flux Fm from the falling undeformed sphere through the undeformed filmsurface,
Fm(t)∼ ρlπr2gU0. (2.3)
This flux can be absorbed either by surface deformation of the droplet and of the filmor by the formation of an ejecta sheet. In JZ03, we have assumed that the thicknessof such a sheet or jet is given by a viscous boundary layer formed at the base of thejet, leading to a viscous length scale
ej(t)∼√µltρl. (2.4)
Then, conservation of the volume flux through this jet implies that the jet velocity Ujhas to satisfy
Uj ∼√
ReU0. (2.5)
Remarkably, this gives a nonlinear relationship between the jet and the impactingdroplet velocity since then Uj ∝ U3/2
0 . Such a law has obviously some physicalrestrictions: first of all, the flux formula (2.3) is valid only for t � R/(2U0) sinceour whole analysis is for short times and makes no sense for times of order D/U0.Furthermore, the jet velocity has to be larger than the geometrical velocity vg. Indeed,if Uj < vg(t) one would expect the ejecta sheet to be overrun by the falling droplet.This condition together with (2.2) yields a ‘geometric’ limiting time tg:
t> tg ∼ 1Re
DU0. (2.6)
When the ejecta forms, a bulge or rim appears at its tip according to the mechanismof Taylor (1959) and Culick (1960). This rim moves backwards at the Taylor–Culickvelocity
vTC =√
2σρlej
, (2.7)
780 C. Josserand, P. Ray and S. Zaleski
where ej is the thickness of the ejecta sheet. The ejecta sheet cannot form if itsvelocity is smaller than the Taylor–Culick velocity constructed with the thickness ej ofthe ejecta sheet. We thus obtain that the ejecta can form only when Uj > vTC, whichfrom equations (2.5), (2.4) and (2.7) yields
t> tTC = 2We2 Re
DU0. (2.8)
Both conditions (2.6) and (2.8) must be satisfied at short times t�D/U0 because, asstated above, the whole theory does not make sense for larger times. Then we musthave max(tTC, tg)�D/U0, which yields the condition
min(We2 Re, Re)� 1. (2.9)
Since we restrict the present study to the dynamics where splashing is always present,we consider situations such that We� 1 and Re� 1, so that of the two conditions forsplashing given above, t> tg is always more restrictive than t> tTC. Therefore, in ourconfiguration, the jet appears only when its velocity is bigger than the geometrical one.Interestingly, this analysis suggests that for t< tg, jets can form but are immediatelyabsorbed by the geometrical advancement of the drop on the liquid layer.
Finally, the inertial pressure of the impact, Pimp, can be computed using the rate ofchange of vertical momentum in the droplet, following JZ03:
Pimpπr2g ∼
2π
3ρlr3
gU0drg
dt. (2.10)
In this equation, the vertical momentum in the droplet is affected only in a half-sphereof radius rg. Equation (2.10) gives the impact pressure
Pimp ∼ 2ρldrb
dtU0, (2.11)
which leads to
Pimp ∼√
DU0t
ρlU20 (2.12)
as observed in numerical simulations (see JZ03). Note that a detailed analysis ofthe potential flow for a droplet falling onto a solid surface has been performedby Philippi, Lagrée & Antkowiak (2016). The reasoning in the latter paper maybe straightforwardly transposed to the impact on a liquid surface to obtain for thepressure field in the neighbourhood of z= 0
p(r, t)∼ 3ρlU20
π
√3tU0
R− r2
R2
, (2.13)
which is very similar at r= 0 to the scaling in (2.12). However, the pressure field of(2.13) has an additional singularity for t> 0 not predicted by (2.12) at r=±√3RU0t.This singularity is indeed observed in our numerical simulations as well as in JZ03,Duchemin & Josserand (2011) and Philippi et al. (2016).
Anatomy of the splash 781
In the theory above, contact occurs at t= 0, the vertical length scales are U0t andej, and the flow pressure and the geometric velocity are singular with an infinite limitat t= 0. So far, the effect of the gas layer has not been considered. When instead thegas layer is taken into account, the above analysis is an approximation valid at lengthscales `� hb where hb is the thickness of the gas layer involved in the cushioning dueto its viscosity. The scale of the impact pressure is thus, following equation (2.12),
Pimp ∼√
DhbρlU2
0 . (2.14)
The singularity of the velocity and the pressure is thus regularized by the gas viscosityso that it can be said that the gas ‘cushions’ the shock of the impact.
Furthermore, it is observed in experiments by Thoroddsen et al. (2003) and innumerical simulations (Josserand & Zaleski 2003; Mehdi-Nejad et al. 2003; Korobkin,Ellis & Smith 2008) that contact does not occur on the symmetry axis r= 0 but on acircle of radius rb so that a bubble is entrapped, as observed also for droplet impacton solid surfaces by Thoroddsen et al. (2005) and Kolinski et al. (2012). As before,horizontal and vertical length scales are related at short times by lz ∼ l2
r/D, so thatwe have the thickness hb of the gas layer or entrapped bubble at the time of contactrelated to the contact radius rb by
hb = r2b/D. (2.15)
These short-time asymptotics have to match the initial conditions at negative timet = −t0. Let z+(r, t) and z−(r, t) be the positions of the drop and film surfaces,respectively, and let h(r, t)= z+(r, t)− z−(r, t) be the thickness of the gas layer. Tofix ideas, let us consider initial conditions such that z−(r, −t0) = 0 and h(r, −t0) =z+(r,−t0) close to the impact time so that on the axis h(0,−t0)= h0� D. The gaslayer is therefore thin and there is a separation of horizontal and vertical length scalesso that the lubrication approximation is valid over distances lr∼
√h(0,−t)D. As long
as the lubrication pressure (estimated below) thus obtained in the gas layer is muchsmaller than the impact pressure Pimp, the liquid advances almost undeformed whileexpelling the gas. In this regime
∂th(0, t)=−U0. (2.16)
When the lubrication pressure becomes large enough to deform the liquid and slowdown the thinning of the gas layer, the time is of the order of the so-called air-cushioning time scale tb and the thickness reaches the air-cushioning length scale hb.Matching with the initial velocity, equation (2.16) then gives the relationship hb =U0tb, which together with the separation of scales condition (2.15) links the time andposition of the contact through tb ∼ r2
b/(DU0).In order to determine these air-cushioning space and time scales, we find the
dominant balance in the lubrication equation, following in part recent works onimpacts onto solid surfaces (Korobkin et al. 2008; Mandre et al. 2009; Hicks &Purvis 2010; Duchemin & Josserand 2011; Hicks & Purvis 2011, 2013; Klaseboeret al. 2014). Our theory starts from the incompressible lubrication equation in acylindrical geometry:
∂th= 112µgr
∂r(rh3∂rP), (2.17)
782 C. Josserand, P. Ray and S. Zaleski
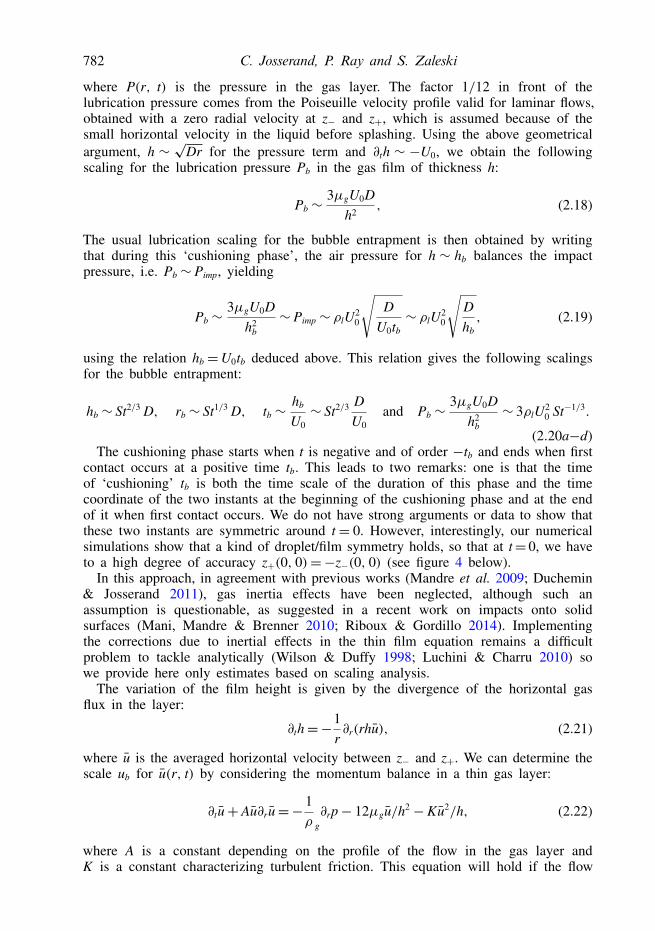
where P(r, t) is the pressure in the gas layer. The factor 1/12 in front of thelubrication pressure comes from the Poiseuille velocity profile valid for laminar flows,obtained with a zero radial velocity at z− and z+, which is assumed because of thesmall horizontal velocity in the liquid before splashing. Using the above geometricalargument, h ∼ √Dr for the pressure term and ∂th ∼ −U0, we obtain the followingscaling for the lubrication pressure Pb in the gas film of thickness h:
Pb ∼ 3µgU0Dh2
, (2.18)
The usual lubrication scaling for the bubble entrapment is then obtained by writingthat during this ‘cushioning phase’, the air pressure for h ∼ hb balances the impactpressure, i.e. Pb ∼ Pimp, yielding
Pb ∼ 3µgU0Dh2
b∼ Pimp ∼ ρlU2
0
√D
U0tb∼ ρlU2
0
√Dhb, (2.19)
using the relation hb=U0tb deduced above. This relation gives the following scalingsfor the bubble entrapment:
hb ∼ St2/3 D, rb ∼ St1/3 D, tb ∼ hb
U0∼ St2/3 D
U0and Pb ∼ 3µgU0D
h2b∼ 3ρlU2
0 St−1/3.
(2.20a−d)The cushioning phase starts when t is negative and of order −tb and ends when first
contact occurs at a positive time tb. This leads to two remarks: one is that the timeof ‘cushioning’ tb is both the time scale of the duration of this phase and the timecoordinate of the two instants at the beginning of the cushioning phase and at the endof it when first contact occurs. We do not have strong arguments or data to show thatthese two instants are symmetric around t= 0. However, interestingly, our numericalsimulations show that a kind of droplet/film symmetry holds, so that at t= 0, we haveto a high degree of accuracy z+(0, 0)=−z−(0, 0) (see figure 4 below).
In this approach, in agreement with previous works (Mandre et al. 2009; Duchemin& Josserand 2011), gas inertia effects have been neglected, although such anassumption is questionable, as suggested in a recent work on impacts onto solidsurfaces (Mani, Mandre & Brenner 2010; Riboux & Gordillo 2014). Implementingthe corrections due to inertial effects in the thin film equation remains a difficultproblem to tackle analytically (Wilson & Duffy 1998; Luchini & Charru 2010) sowe provide here only estimates based on scaling analysis.
The variation of the film height is given by the divergence of the horizontal gasflux in the layer:
∂th=−1r∂r(rhu), (2.21)
where u is the averaged horizontal velocity between z− and z+. We can determine thescale ub for u(r, t) by considering the momentum balance in a thin gas layer:
∂tu+ Au∂ru=− 1ρ g∂rp− 12µgu/h2 −Ku2/h, (2.22)
where A is a constant depending on the profile of the flow in the gas layer andK is a constant characterizing turbulent friction. This equation will hold if the flow
Anatomy of the splash 783
remains thin (h�D) and does not separate. Since in incompressible flow the pressureis defined up to a constant and the pressure at the exit of the thin gas layer flow(taken here for r∼ rg(t)) is the pressure at infinity, it is convenient to set this pressureat the exit to zero. Then Pb equals the pressure difference and it can be estimated atthe bubble entrapment, yielding
Pb = 12µgrbub/h2b +C1ρgu2
brb/hb +C2ρgu2b. (2.23)
Here, we have taken for the first (dominant) term the lubrication pressure alreadycomputed above. The second and third terms result from two kinds of inertial effects,the turbulent friction term and a possible singular head loss due to flow separation. Itis readily seen that the ratio between the first two terms is the local Reynolds numberof the gas layer, ρgubhb/µg. The third term is a singular head loss. The constantsC1 and C2 depend on the precise geometry of the flow and are difficult to estimate.However, it can be seen that the singular head loss is much smaller for our problem,by a factor of h/rg = (DU0/tb)
−1/2, than the turbulent friction term so that we willneglect the singular head loss in the following developments.
The film pressure may be finally obtained by estimating the horizontal velocity scaleas ub = rb/tb, which together with (2.15) yields
Pb ∼ 12µgU0Dh2
b+C1ρgU2
0
(Dhb
)3/2
. (2.24)
Remarkably, the neglected singular head loss term would give an additionalcontribution in the form C2ρgU2
0D/hb.Finally, equating Pb and Pimp yields now an implicit equation for hb:
ρlU20
(Dhb
)1/2
= 12µgU0Dh2
b+C1ρgU2
0
(Dhb
)3/2
, (2.25)
which can be written in terms of the dimensionless variables hb = hb/D, St and α as
12 St= h3/2b −C1αh1/2
b . (2.26)
The above equation is cubic in ξ = h1/2b and its solution gives the dimensionless height
of the film as a function of St and α, with two asymptotic regimes separated by acritical Stokes number
Stc = 112(C1α)
3/2. (2.27)
The first regime, for St�Stc, corresponds to the case computed above with lubricationonly, (2.20), and is of the form
hb ∼ St2/3, (2.28)
as also stated by Mandre et al. (2009) and Mani et al. (2010). In the other regime,for St� Stc, we obtain
hb ∼C1α. (2.29)
The estimates for the time at which the bubble is entrapped result from the estimatesfor hb through tb = hb/U0. For St� Stc we recover (2.20):
tb ∼ St2/3, (2.30)
784 C. Josserand, P. Ray and S. Zaleski
where the dimensionless time is t = U0t/D and all the other scalings are obtainedstraightforwardly from the scalings for the height hb given above. In particular, thetime scale of bubble entrapment tb can be deduced from that of hb, taking into accountthe inertial correction equation (2.26), yielding the same relation (since hb = tb):
12 St= t3/2b −C1αt1/2
b . (2.31)
Similarly, from equation (2.12) the pressure in and on top of the gas layer,neglecting surface tension effects, is (2.20):
Pimp,max ∼ ρlU20 St−1/3. (2.32)
This theory will now serve as a framework for interpreting the numerical simulationsreported below. The main prediction is that air delays contact by a time of order tband that a bubble of typical radius rb is entrapped.
The above considerations, however, do not say how the time of formation of thejet tj is affected by the gas cushioning. This sets constraints on the air-cushioningeffect and we can a priori only turn to numerical simulations to see how the air layerdynamics interacts with jet formation. However, the previous analysis suggests twodistinct regimes for the jet formation and thus for the value of tj. More precisely, iftg� tb, which means that the jet forms after the bubble entrapment, one expects tj ∼tg. On the other hand, if tg � tb, the jet can only form after bubble entrapment sothat tj∼ tb. These results evidence a transition from a regime where the gas thicknessand cushioning effect are insignificant for the jet dynamics to a regime where the aircushioning controls the jet dynamics. This transition can be characterized by the ratiotb/tg and, provided that α = ρg/ρl is small enough, it defines a new dimensionlessnumber J for the jet formation:
J = St2 Re3 =(
tb
tg
)3
. (2.33)
Therefore, J � 1 suggests that the jet forms just after the bubble entrapment whileJ � 1 would indicate that the bubble is entrapped much earlier than the time atwhich the jet is formed, creating potentially a number a secondary bubbles. Theabove considerations, however, do not say at what time tj the liquid sheet is ejected.This sets constraints on the air-cushioning effect and we can only turn to numericalsimulations to see how the air layer dynamics interacts with jet formation. Remarkably,J = St2 Re3 = Reµ2
g/µ2l varies only with Re for a given liquid–gas pair, so it fixes
a limiting U0D for which the regime changes for a given pair of fluids. For anair–water system, for instance, taking µl/µg ∼ 50 gives a transition at Re∼ 3250 orU0 = 3.25 m s−1 for a D= 1 mm droplet and µl = 10−3 Pa s.
To conclude this scaling analysis, it is interesting to note that an alternative theoryhas been proposed recently (Klaseboer et al. 2014). There, a different scaling for theentrapment has been obtained (leading to hb ∼ St1/2D instead of hb ∼ St2/3D) basedon the balance between the lubrication pressure in the gas and the Bernoulli pressurein the drop ρlU2
0 . Although the pressure amplitude in numerical simulations of dropimpact has been shown to obey the singular law (2.13), experimental studies have yetto distinguish between these two predictions.
3. Numerical methodIn our continuum-mechanics modelling approach, fluid dynamics is Newtonian and
incompressible, with constant surface tension. In the ‘one-fluid approach’ (Tryggvason,Scardovelli & Zaleski 2011) one considers a single fluid with variable viscosity and
Anatomy of the splash 785
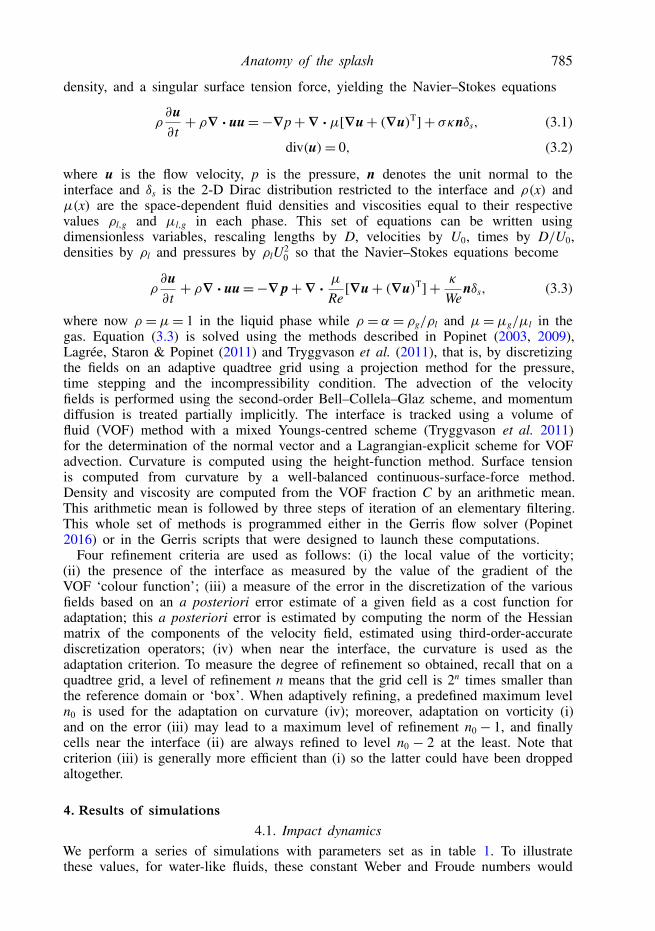
density, and a singular surface tension force, yielding the Navier–Stokes equations
ρ∂u∂t+ ρ∇ · uu=−∇p+∇ ·µ[∇u+ (∇u)T] + σκnδs, (3.1)
div(u)= 0, (3.2)
where u is the flow velocity, p is the pressure, n denotes the unit normal to theinterface and δs is the 2-D Dirac distribution restricted to the interface and ρ(x) andµ(x) are the space-dependent fluid densities and viscosities equal to their respectivevalues ρl,g and µl,g in each phase. This set of equations can be written usingdimensionless variables, rescaling lengths by D, velocities by U0, times by D/U0,densities by ρl and pressures by ρlU2
0 so that the Navier–Stokes equations become
ρ∂u∂t+ ρ∇ · uu=−∇ p+∇ · µ
Re[∇u+ (∇u)T] + κ
Wenδs, (3.3)
where now ρ =µ= 1 in the liquid phase while ρ = α = ρg/ρl and µ=µg/µl in thegas. Equation (3.3) is solved using the methods described in Popinet (2003, 2009),Lagrée, Staron & Popinet (2011) and Tryggvason et al. (2011), that is, by discretizingthe fields on an adaptive quadtree grid using a projection method for the pressure,time stepping and the incompressibility condition. The advection of the velocityfields is performed using the second-order Bell–Collela–Glaz scheme, and momentumdiffusion is treated partially implicitly. The interface is tracked using a volume offluid (VOF) method with a mixed Youngs-centred scheme (Tryggvason et al. 2011)for the determination of the normal vector and a Lagrangian-explicit scheme for VOFadvection. Curvature is computed using the height-function method. Surface tensionis computed from curvature by a well-balanced continuous-surface-force method.Density and viscosity are computed from the VOF fraction C by an arithmetic mean.This arithmetic mean is followed by three steps of iteration of an elementary filtering.This whole set of methods is programmed either in the Gerris flow solver (Popinet2016) or in the Gerris scripts that were designed to launch these computations.
Four refinement criteria are used as follows: (i) the local value of the vorticity;(ii) the presence of the interface as measured by the value of the gradient of theVOF ‘colour function’; (iii) a measure of the error in the discretization of the variousfields based on an a posteriori error estimate of a given field as a cost function foradaptation; this a posteriori error is estimated by computing the norm of the Hessianmatrix of the components of the velocity field, estimated using third-order-accuratediscretization operators; (iv) when near the interface, the curvature is used as theadaptation criterion. To measure the degree of refinement so obtained, recall that on aquadtree grid, a level of refinement n means that the grid cell is 2n times smaller thanthe reference domain or ‘box’. When adaptively refining, a predefined maximum leveln0 is used for the adaptation on curvature (iv); moreover, adaptation on vorticity (i)and on the error (iii) may lead to a maximum level of refinement n0 − 1, and finallycells near the interface (ii) are always refined to level n0 − 2 at the least. Note thatcriterion (iii) is generally more efficient than (i) so the latter could have been droppedaltogether.
4. Results of simulations4.1. Impact dynamics
We perform a series of simulations with parameters set as in table 1. To illustratethese values, for water-like fluids, these constant Weber and Froude numbers would
786 C. Josserand, P. Ray and S. Zaleski
We Fr ρl/ρg e/D h0/D
500 815 826.4 0.2 1/30
TABLE 1. Dimensionless values of the parameters for all simulations reported.
U0 D µl µg σ e
4 m s−1 2× 10⁻³ m 4× 10⁻³ kg m−1 s−1 18× 10−6 kg m−1 s−1 64× 10−3 kg s−2 4× 10⁻⁴ m
TABLE 2. Dimensional values of the main parameters for figure 1.
correspond to a 2 mm diameter drop falling at velocity 4 m s−1. The numericalsimulations are performed for different liquid and gas viscosities characterized by theReynolds and Stokes numbers varying from 400 to 16 000 and from 5.65 × 10⁻⁷ to2.26× 10−5, respectively. Again, for a 2 mm diameter drop impacting at 4 m s−1, thiswould typically cover the range from one-eighth to twenty times the water viscosity,and from one-fourth to ten times the air viscosity. In particular, we have done most ofthe simulations for three Stokes numbers (2.26× 10⁻⁶, 9.05× 10⁻⁶ and 2.26× 10⁻⁵)and a large range of Reynolds numbers (400, 600, 800, 1000, 2000, 4000, 8000 and16 000) that will be used to analyse the dynamical properties of the impact.
In an initial phase the droplet falls undeformed until air-cushioning effects set in.Then, at some point in time the jet forms and a reconnection of the interfaces on thedroplet and film occurs. Figure 1 shows a droplet impact with physical parametersapproximating a glycerinated water droplet falling in air. The main dimensionalparameters are given in table 2; other parameters approximate air at ambienttemperature, leading to the dimensionless numbers Re= 2000 and St= 2.26× 10⁻⁶ incomplement to the dimensionless numbers of table 1.
The grid is refined based on the four criteria above so that the smallest cell hassize 1x= D/(3× 213)∼ D/25 000, corresponding to an effective refinement level of15 in Gerris. Figure 3 shows two views of the grid refinement for a case where theliquid viscosity is twice as high as in table 2 and the gas density ten times larger, sothat Re = 1000 and St = 2.26 × 10⁻⁶, all the other parameters being the same as infigure 1.
We have checked that higher h0/D does not change the results significantly. Thiscan also be verified from figure 4 where it can be seen directly that the simulationstarts at a time t0 =−D/(30U0), much larger than the apparent time scale of the air-cushioning effect. In fact, the velocity of the south pole of the droplet is unperturbeduntil very short times of approximately t∼−5× 10⁻³D/U0.
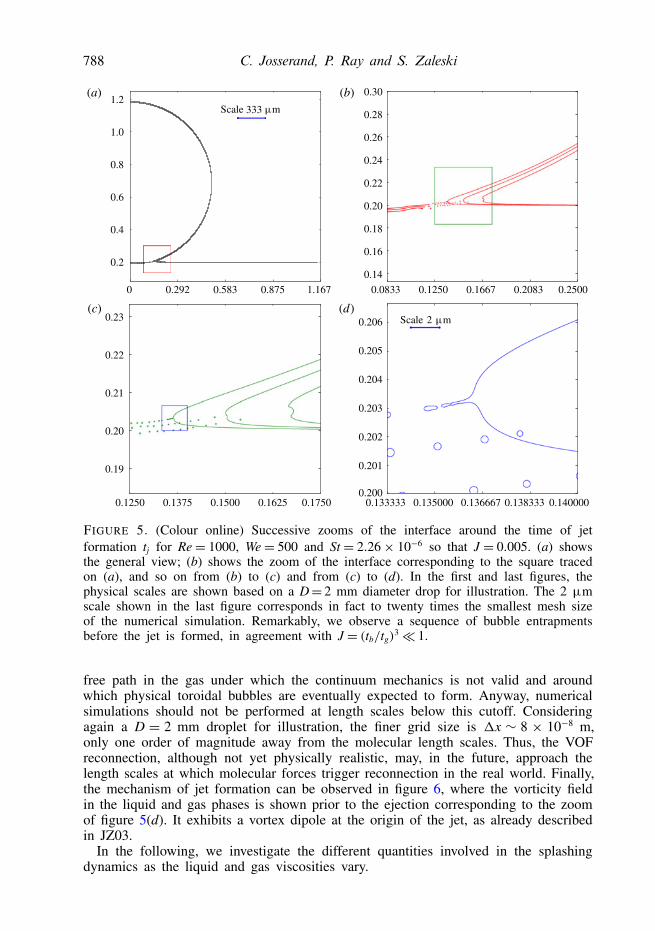
In figures 1 and 4, one can observe that a bubble is indeed entrapped by theimpact due to the cushioning of the gas beneath the droplet. A very thin ejecta sheetis formed, followed by the growth of a thicker corolla. These figures do not, however,give a full account of the level of accuracy reached in the calculation, as shown infigure 5, where successive zooms of the interface are presented around the instantwhen the droplet contacts the liquid film. The large range of scales between thedroplet diameter and the small features in figure 5(d) is apparent, figure 3 showingthe corresponding grid.
In particular, small bubbles (which are actually toroidal because of the axialsymmetry) can be seen prior to the ejection of the thin liquid sheet. In this case,the liquid of the droplet has already made contact with the liquid layer before the
Anatomy of the splash 787
(a) (b)
FIGURE 3. The grid refinement used in (a) figure 5(a) and (b) figure 5(d). Here, theviscosity is twice that of table 2, so that Re= 1000 with a gas viscosity such that St =2.26× 10⁻⁶ and J = 0.005.
–0.01
0.02
0.01
0
0.03
0.04
–0.020 0.02 0.04–0.02–0.04
Inte
rfac
e he
ight
s on
axi
s
FIGURE 4. (Colour online) The dimensionless positions of the bottom of the droplet z+/Dand the top of the film on the axis z−/D as functions of the dimensionless time U0t/Dfor St = 2.26 × 10⁻⁵, Re = 1000 and thus J = 0.5. The dashed line represents the meanposition that decreases like −0.5U0t.
jet formation, which is consistent with the small value of the jet number J = 0.005.Indeed, after the first entrapment of the bubble, the jet cannot emerge from theconnected interfaces so that additional bubbles are eventually entrapped by thedynamics. These small toroidal bubble entrapments might in fact correspond to thoseobserved in experiments recently (Thoroddsen et al. 2012). However, this is alsostrongly controlled by the size of the grid, as reconnection in the VOF methodsdepends on the grid size, questioning these bubbles’ existence in the continuumlimit. In fact, a physical cutoff length is present in this problem, due to the mean
FIGURE 5. (Colour online) Successive zooms of the interface around the time of jetformation tj for Re= 1000, We= 500 and St= 2.26× 10⁻⁶ so that J = 0.005. (a) showsthe general view; (b) shows the zoom of the interface corresponding to the square tracedon (a), and so on from (b) to (c) and from (c) to (d). In the first and last figures, thephysical scales are shown based on a D= 2 mm diameter drop for illustration. The 2 µmscale shown in the last figure corresponds in fact to twenty times the smallest mesh sizeof the numerical simulation. Remarkably, we observe a sequence of bubble entrapmentsbefore the jet is formed, in agreement with J = (tb/tg)
3� 1.
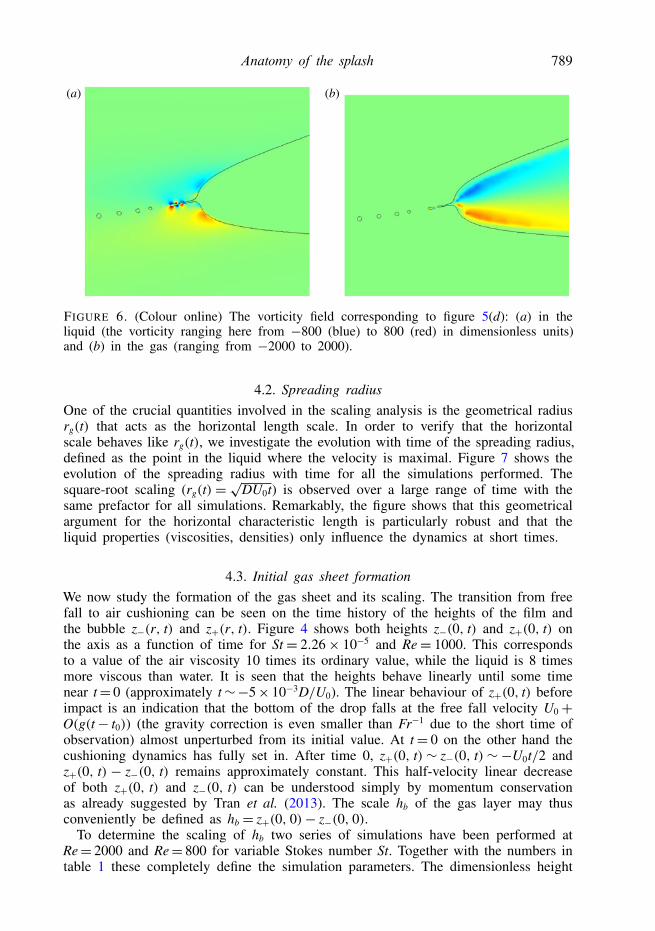
free path in the gas under which the continuum mechanics is not valid and aroundwhich physical toroidal bubbles are eventually expected to form. Anyway, numericalsimulations should not be performed at length scales below this cutoff. Consideringagain a D = 2 mm droplet for illustration, the finer grid size is 1x ∼ 8 × 10⁻⁸ m,only one order of magnitude away from the molecular length scales. Thus, the VOFreconnection, although not yet physically realistic, may, in the future, approach thelength scales at which molecular forces trigger reconnection in the real world. Finally,the mechanism of jet formation can be observed in figure 6, where the vorticity fieldin the liquid and gas phases is shown prior to the ejection corresponding to the zoomof figure 5(d). It exhibits a vortex dipole at the origin of the jet, as already describedin JZ03.
In the following, we investigate the different quantities involved in the splashingdynamics as the liquid and gas viscosities vary.
Anatomy of the splash 789
(a) (b)
FIGURE 6. (Colour online) The vorticity field corresponding to figure 5(d): (a) in theliquid (the vorticity ranging here from −800 (blue) to 800 (red) in dimensionless units)and (b) in the gas (ranging from −2000 to 2000).
4.2. Spreading radiusOne of the crucial quantities involved in the scaling analysis is the geometrical radiusrg(t) that acts as the horizontal length scale. In order to verify that the horizontalscale behaves like rg(t), we investigate the evolution with time of the spreading radius,defined as the point in the liquid where the velocity is maximal. Figure 7 shows theevolution of the spreading radius with time for all the simulations performed. Thesquare-root scaling (rg(t) =√DU0t) is observed over a large range of time with thesame prefactor for all simulations. Remarkably, the figure shows that this geometricalargument for the horizontal characteristic length is particularly robust and that theliquid properties (viscosities, densities) only influence the dynamics at short times.
4.3. Initial gas sheet formationWe now study the formation of the gas sheet and its scaling. The transition from freefall to air cushioning can be seen on the time history of the heights of the film andthe bubble z−(r, t) and z+(r, t). Figure 4 shows both heights z−(0, t) and z+(0, t) onthe axis as a function of time for St= 2.26× 10⁻⁵ and Re= 1000. This correspondsto a value of the air viscosity 10 times its ordinary value, while the liquid is 8 timesmore viscous than water. It is seen that the heights behave linearly until some timenear t= 0 (approximately t∼−5× 10⁻³D/U0). The linear behaviour of z+(0, t) beforeimpact is an indication that the bottom of the drop falls at the free fall velocity U0+O(g(t− t0)) (the gravity correction is even smaller than Fr−1 due to the short time ofobservation) almost unperturbed from its initial value. At t= 0 on the other hand thecushioning dynamics has fully set in. After time 0, z+(0, t)∼ z−(0, t)∼−U0t/2 andz+(0, t) − z−(0, t) remains approximately constant. This half-velocity linear decreaseof both z+(0, t) and z−(0, t) can be understood simply by momentum conservationas already suggested by Tran et al. (2013). The scale hb of the gas layer may thusconveniently be defined as hb = z+(0, 0)− z−(0, 0).
To determine the scaling of hb two series of simulations have been performed atRe= 2000 and Re= 800 for variable Stokes number St. Together with the numbers intable 1 these completely define the simulation parameters. The dimensionless height
790 C. Josserand, P. Ray and S. Zaleski
100
10–1
10–2
10–110–210–3
FIGURE 7. (Colour online) The dimensionless spreading radius, defined as the radiuswhere the velocity is maximal in the liquid, as a function of the dimensionless time U0t/D,in a log–log plot for all the simulations performed in this study. The straight line indicatesthe slope 1/2 corresponding to the geometrical law rg = √DU0t shifted below for eyeguiding. As suggested by this geometrical relation, the different curves all collapse ontoa single one parallel to the expected law, showing that viscous, capillary and lubricationeffects only alter slightly this dynamics. Differences can, however, be seen at short times.
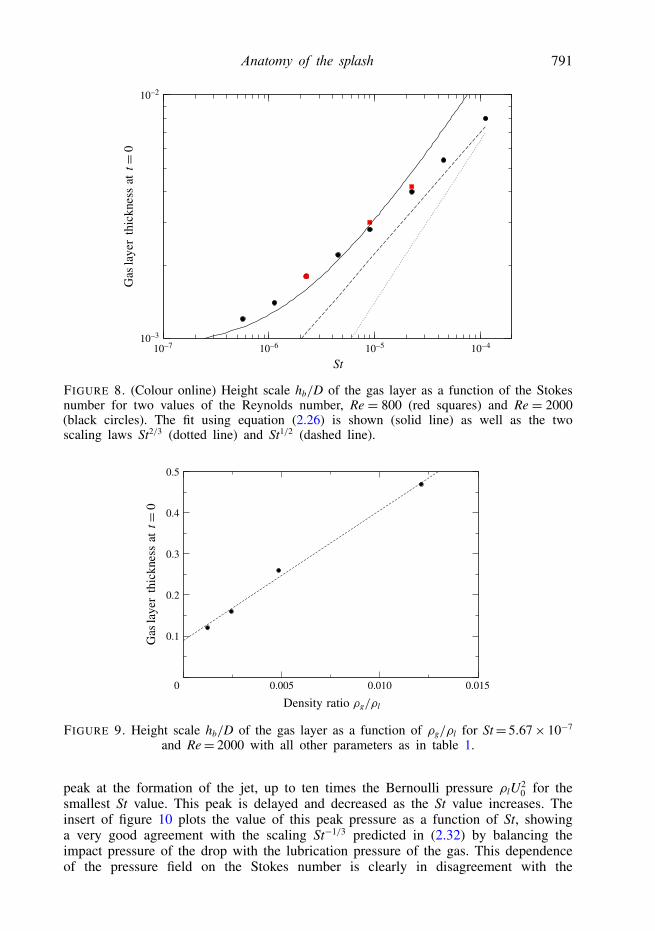
hb = hb/D is plotted in figure 8 together with relation (2.26). The unknown turbulentfriction coefficient C1 has been fitted by trial and error to C1 = 0.75± 0.1.
While the numerical data points are not exactly on top of the fit, the hypothesis ofa transition from a hb→ hminC1α limit at small St to a hb∼ Stn behaviour at larger (butstill small) St is compatible with the data, with n in some range around 2/3. However,it is worth remarking that the rightmost part of the graph is closer to a 1/2 power-law behaviour, suggesting that the alternative scenario proposed by Klaseboer et al.(2014) might be valid here. In order to test the scaling of hb at very low St, whenthe effect of α= ρg/ρl is most marked, we show the results of a series of simulationsat the smallest value of St available in our simulations in figure 8 with variable ρg/ρl,keeping all other numbers constant. The results are plotted in figure 9. We observe alinear increase of hb with ρg/ρl, in agreement with the linear relation (2.29), with aconstant in the limit ρg/ρl→0 that should depend on the Stokes number. Therefore, asthe analysis on the pressure will confirm below, the alternative scaling of Klaseboeret al. (2014) is not valid here and St1/2 has to be seen as a best-fit scaling in theintermediate regime between hb C1α at low St and hb ∼ St2/3 at large St (Jian et al.2015).
4.4. Impact pressureIn order to investigate quantitatively the various mechanisms involved in the impactdynamics and the jet formation, we follow the evolution in time of the maximumpressure on the axis in the gas layer in figure 10 for different Stokes numbers atconstant Re = 2000, around the time of jet formation. We see a very large pressure
Anatomy of the splash 791
10–410–6 10–510–7
St
10–2
10–3
FIGURE 8. (Colour online) Height scale hb/D of the gas layer as a function of the Stokesnumber for two values of the Reynolds number, Re = 800 (red squares) and Re = 2000(black circles). The fit using equation (2.26) is shown (solid line) as well as the twoscaling laws St2/3 (dotted line) and St1/2 (dashed line).
0.5
0.1
0.2
0.3
0.4
0 0.005 0.010 0.015
FIGURE 9. Height scale hb/D of the gas layer as a function of ρg/ρl for St= 5.67× 10⁻⁷
and Re= 2000 with all other parameters as in table 1.
peak at the formation of the jet, up to ten times the Bernoulli pressure ρlU20 for the
smallest St value. This peak is delayed and decreased as the St value increases. Theinsert of figure 10 plots the value of this peak pressure as a function of St, showinga very good agreement with the scaling St−1/3 predicted in (2.32) by balancing theimpact pressure of the drop with the lubrication pressure of the gas. This dependenceof the pressure field on the Stokes number is clearly in disagreement with the
792 C. Josserand, P. Ray and S. Zaleski
2
4
6
8
10
00–0.010–0.015–0.020–0.025–0.030 –0.005 0.005
10–410–6 10–5
St
101
100
Max
pre
ssur
e
Gas
pre
ssur
e
FIGURE 10. (Colour online) The pressure in the gas layer in the cushioning regime,defined as the maximum gas pressure on the axis down the drop. The dimensionlesspressure (using ρlU2
0) is plotted as a function of the dimensionless time U0t/D for a fixedRe = 2000 and for varying Stokes number St = 5.66 × 10⁻⁷, 1.13 × 10⁻⁶, 2.26 × 10−6,4.52× 10−6, 9.05× 10⁻⁶, 2.26× 10⁻⁵, 4.52× 10⁻⁵ and 1.13× 10⁻⁴, from top to bottom.The insert shows the maximum pressure over time of these curves as a function ofthe Stokes number. The dashed line represents the expected St−1/3 scaling following theprediction (2.32).
Bernoulli argument proposed in Klaseboer et al. (2014). Together with the variationsof hb described above, it indicates that the lubrication is the dominant regime in theair cushioning, in opposition to the alternative scenario of Klaseboer et al. (2014).We should also emphasize here that this high pressure in the gas layer can lead tocompression of the gas, as happens for drop impact on a solid substrate (Mandreet al. 2009; Riboux & Gordillo 2014). Indeed, taking for instance the typical valuesfor water drop impact ρl = 1000 kg m−3 and U0 ∼ 4 m s−3, we obtain an additionalpressure in the air of the order of three-fourths of the atmospheric pressure.
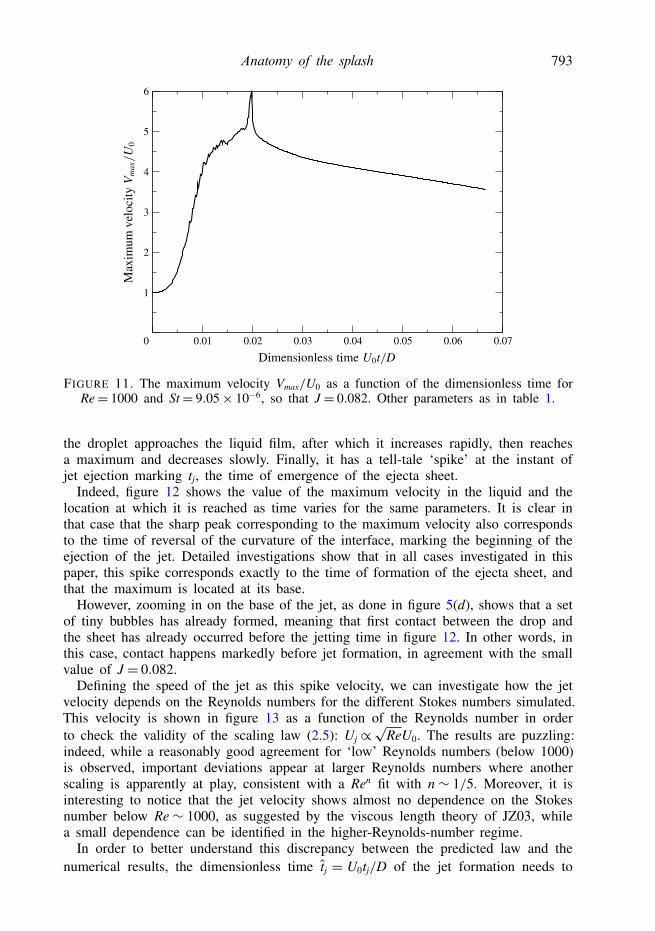
4.5. Ejecta sheet velocityThe ejecta sheet velocity can be measured by following the evolution of the velocitymaximum in the liquid. This quantity is indeed an interesting proxy for severalmeasurements and is easier and less ambiguous to measure than the ejecta thickness,which varies widely at its base. Figure 11 shows the maximum dimensionless velocityas a function of the dimensionless time shifted to the beginning of the simulationU0t/D (remember that the origin of time t= 0 corresponds to the time at which thegeometrical falling sphere would interact with the liquid layer), for Re = 1000 andSt= 9.05 10−6, with other parameters defined in table 1. It is seen that the maximumvelocity deviates from the initial velocity U0 around −U0tb/D'−0.03, that is, when
Anatomy of the splash 793
5
6
1
2
3
4
0 0.01 0.02 0.03 0.04 0.05 0.06 0.07
FIGURE 11. The maximum velocity Vmax/U0 as a function of the dimensionless time forRe= 1000 and St= 9.05× 10⁻⁶, so that J = 0.082. Other parameters as in table 1.
the droplet approaches the liquid film, after which it increases rapidly, then reachesa maximum and decreases slowly. Finally, it has a tell-tale ‘spike’ at the instant ofjet ejection marking tj, the time of emergence of the ejecta sheet.
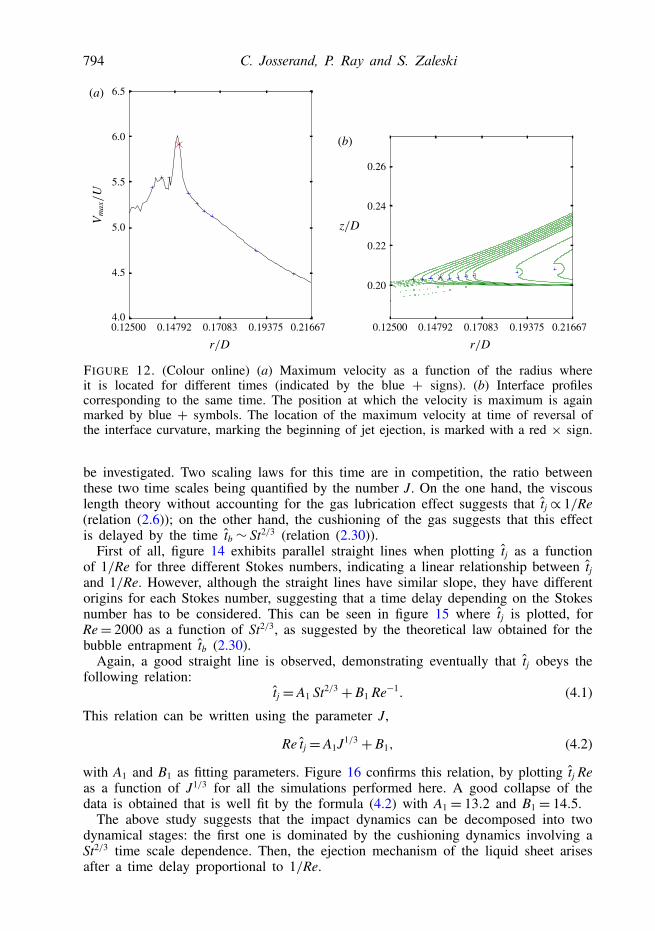
Indeed, figure 12 shows the value of the maximum velocity in the liquid and thelocation at which it is reached as time varies for the same parameters. It is clear inthat case that the sharp peak corresponding to the maximum velocity also correspondsto the time of reversal of the curvature of the interface, marking the beginning of theejection of the jet. Detailed investigations show that in all cases investigated in thispaper, this spike corresponds exactly to the time of formation of the ejecta sheet, andthat the maximum is located at its base.
However, zooming in on the base of the jet, as done in figure 5(d), shows that a setof tiny bubbles has already formed, meaning that first contact between the drop andthe sheet has already occurred before the jetting time in figure 12. In other words, inthis case, contact happens markedly before jet formation, in agreement with the smallvalue of J = 0.082.
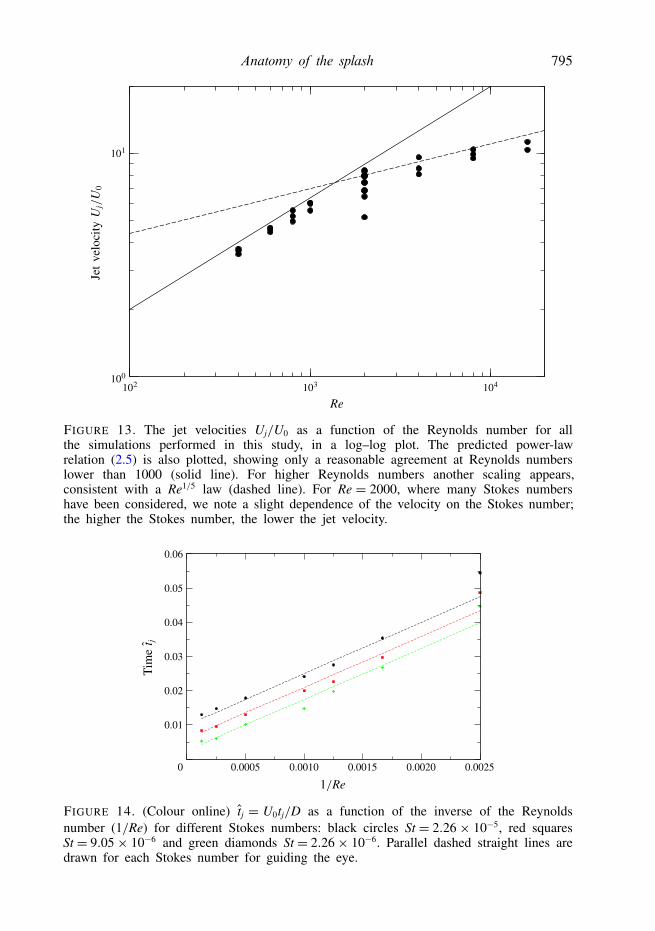
Defining the speed of the jet as this spike velocity, we can investigate how the jetvelocity depends on the Reynolds numbers for the different Stokes numbers simulated.This velocity is shown in figure 13 as a function of the Reynolds number in orderto check the validity of the scaling law (2.5): Uj ∝
√ReU0. The results are puzzling:
indeed, while a reasonably good agreement for ‘low’ Reynolds numbers (below 1000)is observed, important deviations appear at larger Reynolds numbers where anotherscaling is apparently at play, consistent with a Ren fit with n∼ 1/5. Moreover, it isinteresting to notice that the jet velocity shows almost no dependence on the Stokesnumber below Re∼ 1000, as suggested by the viscous length theory of JZ03, whilea small dependence can be identified in the higher-Reynolds-number regime.
In order to better understand this discrepancy between the predicted law and thenumerical results, the dimensionless time tj = U0tj/D of the jet formation needs to
FIGURE 12. (Colour online) (a) Maximum velocity as a function of the radius whereit is located for different times (indicated by the blue + signs). (b) Interface profilescorresponding to the same time. The position at which the velocity is maximum is againmarked by blue + symbols. The location of the maximum velocity at time of reversal ofthe interface curvature, marking the beginning of jet ejection, is marked with a red × sign.
be investigated. Two scaling laws for this time are in competition, the ratio betweenthese two time scales being quantified by the number J. On the one hand, the viscouslength theory without accounting for the gas lubrication effect suggests that tj ∝ 1/Re(relation (2.6)); on the other hand, the cushioning of the gas suggests that this effectis delayed by the time tb ∼ St2/3 (relation (2.30)).
First of all, figure 14 exhibits parallel straight lines when plotting tj as a functionof 1/Re for three different Stokes numbers, indicating a linear relationship between tjand 1/Re. However, although the straight lines have similar slope, they have differentorigins for each Stokes number, suggesting that a time delay depending on the Stokesnumber has to be considered. This can be seen in figure 15 where tj is plotted, forRe= 2000 as a function of St2/3, as suggested by the theoretical law obtained for thebubble entrapment tb (2.30).
Again, a good straight line is observed, demonstrating eventually that tj obeys thefollowing relation:
tj = A1 St2/3 + B1 Re−1. (4.1)
This relation can be written using the parameter J,
Re tj = A1J1/3 + B1, (4.2)
with A1 and B1 as fitting parameters. Figure 16 confirms this relation, by plotting tj Reas a function of J1/3 for all the simulations performed here. A good collapse of thedata is obtained that is well fit by the formula (4.2) with A1 = 13.2 and B1 = 14.5.
The above study suggests that the impact dynamics can be decomposed into twodynamical stages: the first one is dominated by the cushioning dynamics involving aSt2/3 time scale dependence. Then, the ejection mechanism of the liquid sheet arisesafter a time delay proportional to 1/Re.
Anatomy of the splash 795
100
101
104103102
Re
FIGURE 13. The jet velocities Uj/U0 as a function of the Reynolds number for allthe simulations performed in this study, in a log–log plot. The predicted power-lawrelation (2.5) is also plotted, showing only a reasonable agreement at Reynolds numberslower than 1000 (solid line). For higher Reynolds numbers another scaling appears,consistent with a Re1/5 law (dashed line). For Re = 2000, where many Stokes numbershave been considered, we note a slight dependence of the velocity on the Stokes number;the higher the Stokes number, the lower the jet velocity.
0.06
0.01
0.02
0.03
0.04
0.05
0 0.0005 0.0010 0.0015 0.0020 0.0025
FIGURE 14. (Colour online) tj = U0tj/D as a function of the inverse of the Reynoldsnumber (1/Re) for different Stokes numbers: black circles St = 2.26× 10⁻⁵, red squaresSt = 9.05× 10⁻⁶ and green diamonds St = 2.26× 10⁻⁶. Parallel dashed straight lines aredrawn for each Stokes number for guiding the eye.
796 C. Josserand, P. Ray and S. Zaleski
0.010
0.005
0.015
0.020
0.025
0.030
0.035
0.040
0 0.0005 0.0010 0.0015 0.0020 0.0025
FIGURE 15. tj as a function of the Stokes number to the power predicted by the theory(2.30), St2/3, for constant Reynolds number Re= 2000. The dashed line indicates a linearrelationship between these two quantities.
50
100
150
200
0 2 4 6 8 10 12
FIGURE 16. The data (black circles) for the jet formation time Re tj plotted as a functionof J1/3 for all the simulations performed in this study. The data align almost perfectlyalong a line as suggested by the formula (4.2), which is used to fit the data (solid curve)using A1 = 13.2 and B1 = 14.5.
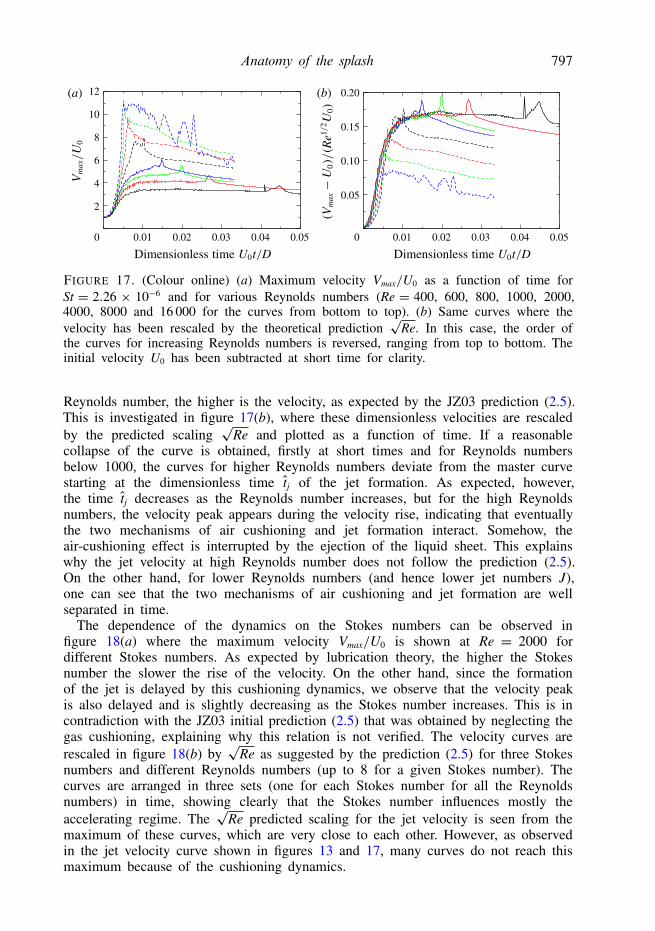
These different regimes can now be investigated through the evolution of themaximum velocity as function of time for all the parameters simulated here. Firstly,we show in figure 17(a) the maximum dimensionless velocity Vmax = Vmax/U0 as afunction of the dimensionless time t=U0t/D for different Reynolds numbers and for afixed Stokes number of St= 2.26× 10⁻⁶, where it can be observed that the higher the
FIGURE 17. (Colour online) (a) Maximum velocity Vmax/U0 as a function of time forSt = 2.26 × 10⁻⁶ and for various Reynolds numbers (Re = 400, 600, 800, 1000, 2000,4000, 8000 and 16 000 for the curves from bottom to top). (b) Same curves where thevelocity has been rescaled by the theoretical prediction
√Re. In this case, the order of
the curves for increasing Reynolds numbers is reversed, ranging from top to bottom. Theinitial velocity U0 has been subtracted at short time for clarity.
Reynolds number, the higher is the velocity, as expected by the JZ03 prediction (2.5).This is investigated in figure 17(b), where these dimensionless velocities are rescaledby the predicted scaling
√Re and plotted as a function of time. If a reasonable
collapse of the curve is obtained, firstly at short times and for Reynolds numbersbelow 1000, the curves for higher Reynolds numbers deviate from the master curvestarting at the dimensionless time tj of the jet formation. As expected, however,the time tj decreases as the Reynolds number increases, but for the high Reynoldsnumbers, the velocity peak appears during the velocity rise, indicating that eventuallythe two mechanisms of air cushioning and jet formation interact. Somehow, theair-cushioning effect is interrupted by the ejection of the liquid sheet. This explainswhy the jet velocity at high Reynolds number does not follow the prediction (2.5).On the other hand, for lower Reynolds numbers (and hence lower jet numbers J),one can see that the two mechanisms of air cushioning and jet formation are wellseparated in time.
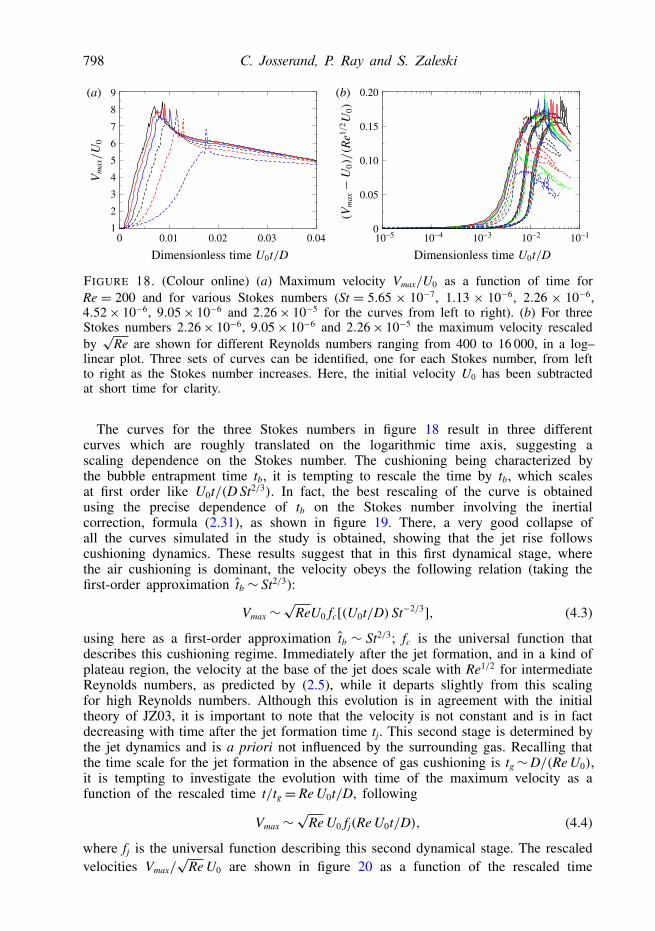
The dependence of the dynamics on the Stokes numbers can be observed infigure 18(a) where the maximum velocity Vmax/U0 is shown at Re = 2000 fordifferent Stokes numbers. As expected by lubrication theory, the higher the Stokesnumber the slower the rise of the velocity. On the other hand, since the formationof the jet is delayed by this cushioning dynamics, we observe that the velocity peakis also delayed and is slightly decreasing as the Stokes number increases. This is incontradiction with the JZ03 initial prediction (2.5) that was obtained by neglecting thegas cushioning, explaining why this relation is not verified. The velocity curves arerescaled in figure 18(b) by
√Re as suggested by the prediction (2.5) for three Stokes
numbers and different Reynolds numbers (up to 8 for a given Stokes number). Thecurves are arranged in three sets (one for each Stokes number for all the Reynoldsnumbers) in time, showing clearly that the Stokes number influences mostly theaccelerating regime. The
√Re predicted scaling for the jet velocity is seen from the
maximum of these curves, which are very close to each other. However, as observedin the jet velocity curve shown in figures 13 and 17, many curves do not reach thismaximum because of the cushioning dynamics.
798 C. Josserand, P. Ray and S. Zaleski
0 0.01 0.02 0.03 0.040
0.05
0.10
0.15
0.20(b)
5
6
7
8
9
1
2
3
4
(a)
10–110–210–310–410–5
FIGURE 18. (Colour online) (a) Maximum velocity Vmax/U0 as a function of time forRe = 200 and for various Stokes numbers (St = 5.65 × 10⁻⁷, 1.13 × 10⁻⁶, 2.26 × 10−6,4.52× 10−6, 9.05× 10⁻⁶ and 2.26× 10⁻⁵ for the curves from left to right). (b) For threeStokes numbers 2.26× 10⁻⁶, 9.05× 10⁻⁶ and 2.26× 10⁻⁵ the maximum velocity rescaledby√
Re are shown for different Reynolds numbers ranging from 400 to 16 000, in a log–linear plot. Three sets of curves can be identified, one for each Stokes number, from leftto right as the Stokes number increases. Here, the initial velocity U0 has been subtractedat short time for clarity.
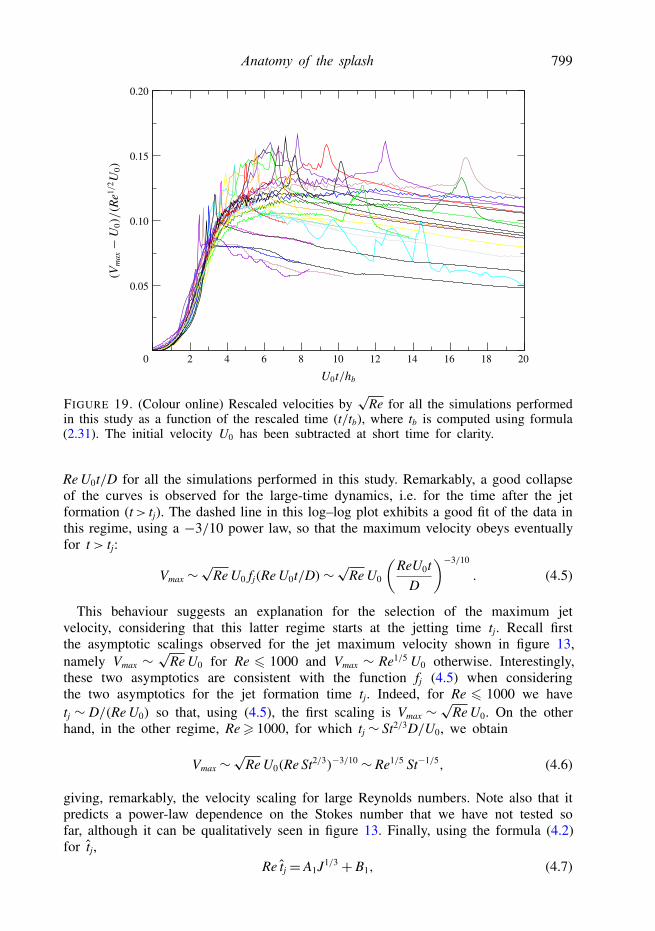
The curves for the three Stokes numbers in figure 18 result in three differentcurves which are roughly translated on the logarithmic time axis, suggesting ascaling dependence on the Stokes number. The cushioning being characterized bythe bubble entrapment time tb, it is tempting to rescale the time by tb, which scalesat first order like U0t/(D St2/3). In fact, the best rescaling of the curve is obtainedusing the precise dependence of tb on the Stokes number involving the inertialcorrection, formula (2.31), as shown in figure 19. There, a very good collapse ofall the curves simulated in the study is obtained, showing that the jet rise followscushioning dynamics. These results suggest that in this first dynamical stage, wherethe air cushioning is dominant, the velocity obeys the following relation (taking thefirst-order approximation tb ∼ St2/3):
Vmax ∼√
ReU0 fc[(U0t/D) St−2/3], (4.3)
using here as a first-order approximation tb ∼ St2/3; fc is the universal function thatdescribes this cushioning regime. Immediately after the jet formation, and in a kind ofplateau region, the velocity at the base of the jet does scale with Re1/2 for intermediateReynolds numbers, as predicted by (2.5), while it departs slightly from this scalingfor high Reynolds numbers. Although this evolution is in agreement with the initialtheory of JZ03, it is important to note that the velocity is not constant and is in factdecreasing with time after the jet formation time tj. This second stage is determined bythe jet dynamics and is a priori not influenced by the surrounding gas. Recalling thatthe time scale for the jet formation in the absence of gas cushioning is tg∼D/(Re U0),it is tempting to investigate the evolution with time of the maximum velocity as afunction of the rescaled time t/tg = Re U0t/D, following
Vmax ∼√
Re U0 fj(Re U0t/D), (4.4)
where fj is the universal function describing this second dynamical stage. The rescaledvelocities Vmax/
√Re U0 are shown in figure 20 as a function of the rescaled time
Re for all the simulations performedin this study as a function of the rescaled time (t/tb), where tb is computed using formula(2.31). The initial velocity U0 has been subtracted at short time for clarity.
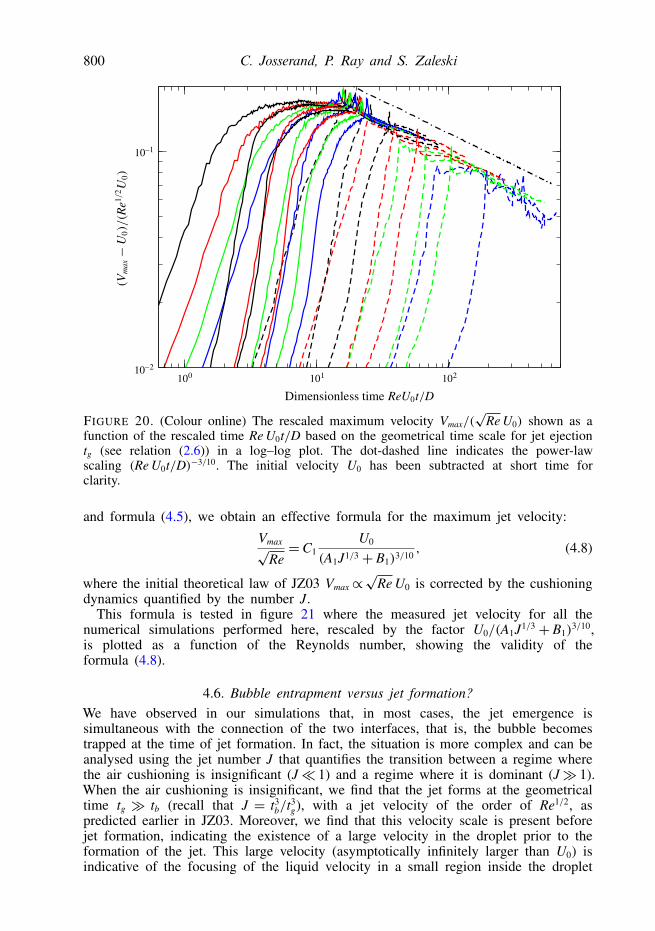
Re U0t/D for all the simulations performed in this study. Remarkably, a good collapseof the curves is observed for the large-time dynamics, i.e. for the time after the jetformation (t> tj). The dashed line in this log–log plot exhibits a good fit of the data inthis regime, using a −3/10 power law, so that the maximum velocity obeys eventuallyfor t> tj:
Vmax ∼√
Re U0 fj(Re U0t/D)∼√Re U0
(ReU0t
D
)−3/10
. (4.5)
This behaviour suggests an explanation for the selection of the maximum jetvelocity, considering that this latter regime starts at the jetting time tj. Recall firstthe asymptotic scalings observed for the jet maximum velocity shown in figure 13,namely Vmax ∼
√Re U0 for Re 6 1000 and Vmax ∼ Re1/5 U0 otherwise. Interestingly,
these two asymptotics are consistent with the function fj (4.5) when consideringthe two asymptotics for the jet formation time tj. Indeed, for Re 6 1000 we havetj ∼ D/(Re U0) so that, using (4.5), the first scaling is Vmax ∼
√Re U0. On the other
hand, in the other regime, Re > 1000, for which tj ∼ St2/3D/U0, we obtain
Vmax ∼√
Re U0(Re St2/3)−3/10 ∼ Re1/5 St−1/5, (4.6)
giving, remarkably, the velocity scaling for large Reynolds numbers. Note also that itpredicts a power-law dependence on the Stokes number that we have not tested sofar, although it can be qualitatively seen in figure 13. Finally, using the formula (4.2)for tj,
Re tj = A1J1/3 + B1, (4.7)
800 C. Josserand, P. Ray and S. Zaleski
10–1
10–2
100 102101
FIGURE 20. (Colour online) The rescaled maximum velocity Vmax/(√
Re U0) shown as afunction of the rescaled time Re U0t/D based on the geometrical time scale for jet ejectiontg (see relation (2.6)) in a log–log plot. The dot-dashed line indicates the power-lawscaling (Re U0t/D)−3/10. The initial velocity U0 has been subtracted at short time forclarity.
and formula (4.5), we obtain an effective formula for the maximum jet velocity:Vmax√
Re=C1
U0
(A1J1/3 + B1)3/10, (4.8)
where the initial theoretical law of JZ03 Vmax∝√
Re U0 is corrected by the cushioningdynamics quantified by the number J.
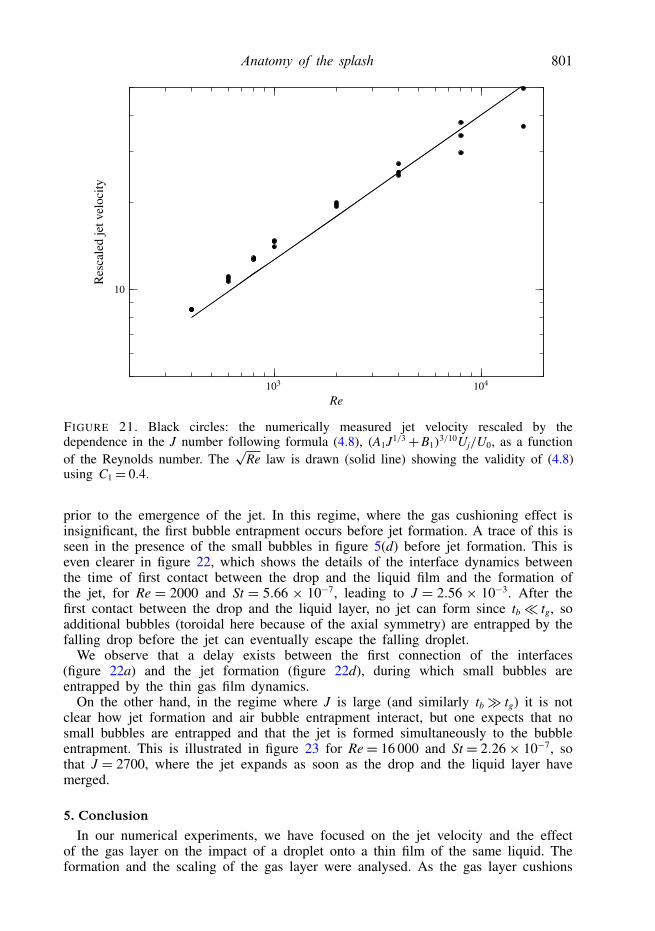
This formula is tested in figure 21 where the measured jet velocity for all thenumerical simulations performed here, rescaled by the factor U0/(A1J1/3 + B1)
3/10,is plotted as a function of the Reynolds number, showing the validity of theformula (4.8).
4.6. Bubble entrapment versus jet formation?We have observed in our simulations that, in most cases, the jet emergence issimultaneous with the connection of the two interfaces, that is, the bubble becomestrapped at the time of jet formation. In fact, the situation is more complex and can beanalysed using the jet number J that quantifies the transition between a regime wherethe air cushioning is insignificant (J� 1) and a regime where it is dominant (J� 1).When the air cushioning is insignificant, we find that the jet forms at the geometricaltime tg � tb (recall that J = t3
b/t3g), with a jet velocity of the order of Re1/2, as
predicted earlier in JZ03. Moreover, we find that this velocity scale is present beforejet formation, indicating the existence of a large velocity in the droplet prior to theformation of the jet. This large velocity (asymptotically infinitely larger than U0) isindicative of the focusing of the liquid velocity in a small region inside the droplet
Anatomy of the splash 801
10
104103
Re
Res
cale
d je
t vel
ocity
FIGURE 21. Black circles: the numerically measured jet velocity rescaled by thedependence in the J number following formula (4.8), (A1J1/3+B1)
3/10Uj/U0, as a functionof the Reynolds number. The
√Re law is drawn (solid line) showing the validity of (4.8)
using C1 = 0.4.
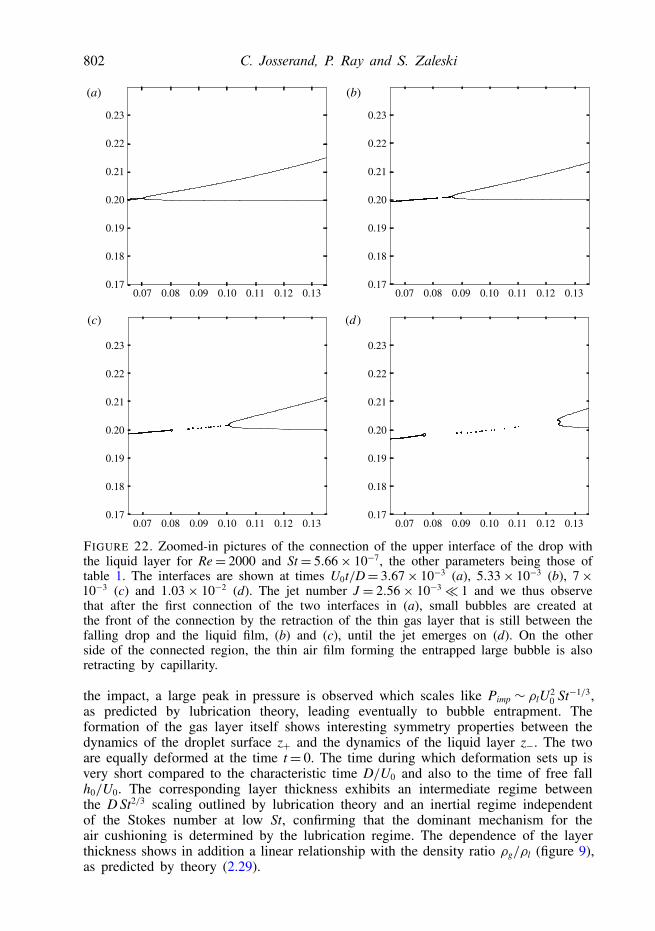
prior to the emergence of the jet. In this regime, where the gas cushioning effect isinsignificant, the first bubble entrapment occurs before jet formation. A trace of this isseen in the presence of the small bubbles in figure 5(d) before jet formation. This iseven clearer in figure 22, which shows the details of the interface dynamics betweenthe time of first contact between the drop and the liquid film and the formation ofthe jet, for Re = 2000 and St = 5.66 × 10⁻⁷, leading to J = 2.56 × 10⁻³. After thefirst contact between the drop and the liquid layer, no jet can form since tb� tg, soadditional bubbles (toroidal here because of the axial symmetry) are entrapped by thefalling drop before the jet can eventually escape the falling droplet.
We observe that a delay exists between the first connection of the interfaces(figure 22a) and the jet formation (figure 22d), during which small bubbles areentrapped by the thin gas film dynamics.
On the other hand, in the regime where J is large (and similarly tb� tg) it is notclear how jet formation and air bubble entrapment interact, but one expects that nosmall bubbles are entrapped and that the jet is formed simultaneously to the bubbleentrapment. This is illustrated in figure 23 for Re= 16 000 and St = 2.26× 10⁻⁷, sothat J = 2700, where the jet expands as soon as the drop and the liquid layer havemerged.
5. ConclusionIn our numerical experiments, we have focused on the jet velocity and the effect
of the gas layer on the impact of a droplet onto a thin film of the same liquid. Theformation and the scaling of the gas layer were analysed. As the gas layer cushions
802 C. Josserand, P. Ray and S. Zaleski
0.17
0.18
0.19
0.20
0.21
0.22
0.23
0.07 0.08 0.09 0.10 0.11 0.12 0.130.17
0.18
0.19
0.20
0.21
0.22
0.23
0.07 0.08 0.09 0.10 0.11 0.12 0.13
0.17
0.18
0.19
0.20
0.21
0.22
0.23
0.07 0.08 0.09 0.10 0.11 0.12 0.130.17
0.18
0.19
0.20
0.21
0.22
0.23
0.07 0.08 0.09 0.10 0.11 0.12 0.13
(a) (b)
(c) (d)
FIGURE 22. Zoomed-in pictures of the connection of the upper interface of the drop withthe liquid layer for Re= 2000 and St= 5.66× 10⁻⁷, the other parameters being those oftable 1. The interfaces are shown at times U0t/D= 3.67× 10⁻³ (a), 5.33× 10⁻³ (b), 7×10⁻³ (c) and 1.03× 10⁻² (d). The jet number J = 2.56× 10⁻³� 1 and we thus observethat after the first connection of the two interfaces in (a), small bubbles are created atthe front of the connection by the retraction of the thin gas layer that is still between thefalling drop and the liquid film, (b) and (c), until the jet emerges on (d). On the otherside of the connected region, the thin air film forming the entrapped large bubble is alsoretracting by capillarity.
the impact, a large peak in pressure is observed which scales like Pimp ∼ ρlU20 St−1/3,
as predicted by lubrication theory, leading eventually to bubble entrapment. Theformation of the gas layer itself shows interesting symmetry properties between thedynamics of the droplet surface z+ and the dynamics of the liquid layer z−. The twoare equally deformed at the time t= 0. The time during which deformation sets up isvery short compared to the characteristic time D/U0 and also to the time of free fallh0/U0. The corresponding layer thickness exhibits an intermediate regime betweenthe D St2/3 scaling outlined by lubrication theory and an inertial regime independentof the Stokes number at low St, confirming that the dominant mechanism for theair cushioning is determined by the lubrication regime. The dependence of the layerthickness shows in addition a linear relationship with the density ratio ρg/ρl (figure 9),as predicted by theory (2.29).
Anatomy of the splash 803
0.115 0.120 0.125 0.130 0.195
0.200
0.205
0.210
0.215
0.135 0.115 0.120 0.125 0.130 0.195
0.200
0.205
0.210
0.215
0.135
0.115 0.120 0.125 0.130 0.195
0.200
0.205
0.210
0.215
0.135 0.115 0.120 0.125 0.130 0.195
0.200
0.205
0.210
0.215
0.135
(a) (b)
(c) (d)
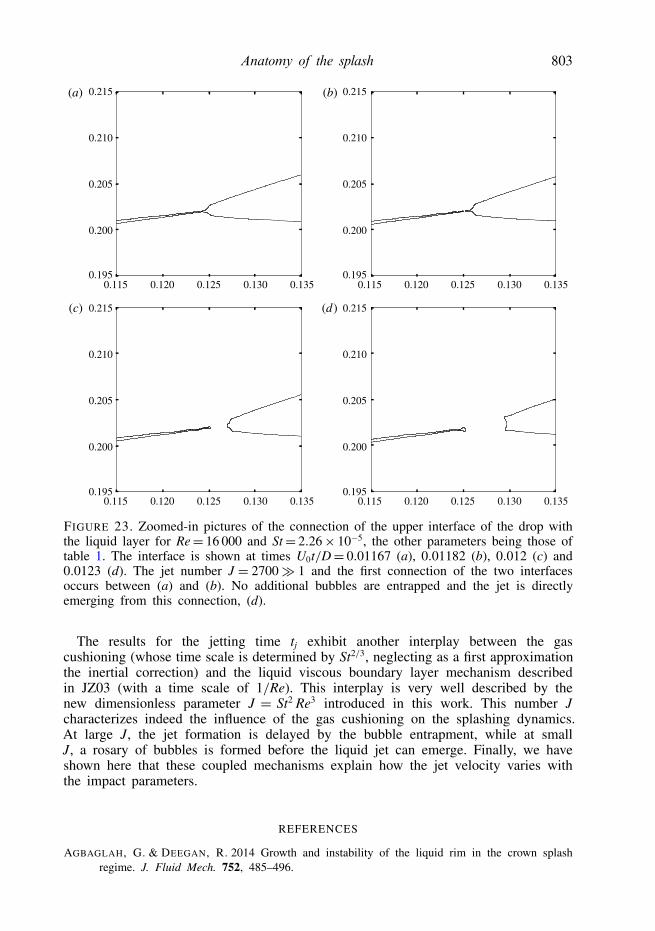
FIGURE 23. Zoomed-in pictures of the connection of the upper interface of the drop withthe liquid layer for Re= 16 000 and St= 2.26× 10⁻⁵, the other parameters being those oftable 1. The interface is shown at times U0t/D= 0.01167 (a), 0.01182 (b), 0.012 (c) and0.0123 (d). The jet number J = 2700� 1 and the first connection of the two interfacesoccurs between (a) and (b). No additional bubbles are entrapped and the jet is directlyemerging from this connection, (d).
The results for the jetting time tj exhibit another interplay between the gascushioning (whose time scale is determined by St2/3, neglecting as a first approximationthe inertial correction) and the liquid viscous boundary layer mechanism describedin JZ03 (with a time scale of 1/Re). This interplay is very well described by thenew dimensionless parameter J = St2 Re3 introduced in this work. This number Jcharacterizes indeed the influence of the gas cushioning on the splashing dynamics.At large J, the jet formation is delayed by the bubble entrapment, while at smallJ, a rosary of bubbles is formed before the liquid jet can emerge. Finally, we haveshown here that these coupled mechanisms explain how the jet velocity varies withthe impact parameters.
REFERENCES
AGBAGLAH, G. & DEEGAN, R. 2014 Growth and instability of the liquid rim in the crown splashregime. J. Fluid Mech. 752, 485–496.
804 C. Josserand, P. Ray and S. Zaleski
AGBAGLAH, G., THORAVAL, M.-J., THORODDSEN, S., ZHANG, L., FEZZAA, K. & DEEGAN, R.2015 Drop impact into a deep pool: vortex shedding and jet formation. J. Fluid Mech. 764,R1.
CULICK, F. E. C. 1960 Comments on a ruptured soap film. J. Appl. Phys. 31, 1128–1129.DEEGAN, R., BRUNET, P. & EGGERS, J. 2008 Complexities of splashing. Nonlinearity 21, C1.DUCHEMIN, L. & JOSSERAND, C. 2011 Curvature singularity and film-skating during drop impact.
Phys. Fluids 23, 091701.FUSTER, D., AGBAGLAH, G., JOSSERAND, C., POPINET, S. & ZALESKI, S. 2009 Numerical
simulation of droplets, bubbles and waves: state of the art. Fluid Dyn. Res. 41, 065001.GUEYFFIER, D. & ZALESKI, S. 1998 Formation de digitations lors de l’impact d’une goutte sur un
film liquide. C. R. Acad. Sci. Paris II 326, 839–844.HICKS, P. & PURVIS, R. 2010 Air cushioning and bubble entrapment in three-dimensional droplet
impacts. J. Fluid Mech. 649, 135–163.HICKS, P. & PURVIS, R. 2011 Air cushioning in droplet impacts with liquid layers and other droplets.
Phys. Fluids 23, 062104.HICKS, P. & PURVIS, R. 2013 Liquid–solid impacts with compressible gas cushioning. J. Fluid Mech.
735, 120–149.HOWISON, S., OCKENDON, J., OLIVER, J., PURVIS, R. & SMITH, F. 2005 Droplet impact on a thin
fluid layer. J. Fluid. Mech. 542, 1–23.JIAN, Z., JOSSERAND, C., RAY, P., DUCHEMIN, L., POPINET, S. & ZALESKI, S. 2015 Modelling
the thickness of the air layer in droplet impact. In ICLASS 2015, 13th Triennial InternationalConference on Liquid Atomization and Spray Systems (Tainan, Taiwan, 23–27 August 2015).
JOSSERAND, C. & THORODDSEN, S. 2016 Drop impact on a solid surface. Annu. Rev. Fluid Mech.48, 365–391.
JOSSERAND, C. & ZALESKI, S. 2003 Droplet splashing on a thin liquid film. Phys. Fluids 15, 1650.KLASEBOER, E., MANICA, R. & CHAN, D. Y. 2014 Universal behavior of the initial stage of drop
impact. Phys. Rev. Lett. 113 (19), 194501.KOLINSKI, J. M., RUBINSTEIN, S. M., MANDRE, S., BRENNER, M. P., WEITZ, D. A. &
MAHADEVAN, L. 2012 Skating on a film of air: drops impacting on a surface. Phys. Rev.Lett. 108, 074503.
KOROBKIN, A., ELLIS, A. & SMITH, F. 2008 Trapping of air in impact between a body and shallowwater. J. Fluid Mech. 611, 365–394.
LAGRÉE, P. Y., STARON, L. & POPINET, S. 2011 The granular column collapse as a continuum:validity of a two-dimensional Navier–Stokes model with a µ(I)-rheology. J. Fluid Mech. 686,378–408.
LESSER, M. & FIELD, J. 1983 The impact of compressible liquids. Annu. Rev. Fluid Mech. 15,97–122.
LUCHINI, P. & CHARRU, F. 2010 Consistent section-averaged equations of quasi-one-dimensionallaminar flow. J. Fluid. Mech. 565, 337–341.
MANDRE, S. & BRENNER, M. 2012 The mechanism of a splash on a dry solid surface. J. FluidMech. 690, 148–172.
MANDRE, S., MANI, M. & BRENNER, M. 2009 Precursors to splashing of liquid droplets on a solidsurface. Phys. Rev. Lett. 102, 134502.
MANI, M., MANDRE, S. & BRENNER, M. 2010 Events before droplet splashing on a solid surface.J. Fluid Mech. 647, 163–185.
MEHDI-NEJAD, V., MOSTAGHIMI, J. & CHANDRA, S. 2003 Air bubble entrapment under an impactingdroplet. Phys. Fluids 15 (1), 173–183.
MUNDO, C., SOMMERFELD, M. & TROPEA, C. 1995 Droplet-wall collisions: experimental studies ofthe deformation and breakup process. Intl J. Multiphase Flow 21, 151–173.
PHILIPPI, J., LAGRÉE, P.-Y. & ANTKOWIAK, A. 2016 Drop impact on solid surface: short timeself-similarity. J. Fluid Mech. 795, 96–135.
POPINET, S. 2003 Gerris: a tree-based adaptive solver for the incompressible euler equations incomplex geometries. J. Comput. Phys. 190 (2), 572–600.
Anatomy of the splash 805
POPINET, S. 2009 An accurate adaptive solver for surface-tension-driven interfacial flows. J. Comput.Phys. 228, 5838–5866.
POPINET, S. 2016 Gerris flow solver, http://gfs.sourceforge.net/.REIN, M. 1993 Phenomena of liquid drop impact on solid and liquid surfaces. Fluid Dyn. Res. 12,
61–93.RIBOUX, G. & GORDILLO, J. 2014 Experiments of drops impacting a smooth solid surface: a model
of the critical impact speed for drop splashing. Phys. Rev. Lett. 113, 024507.RIEBER, M. & FROHN, A. 1998 Numerical simulation of splashing drops. In Proceedings of ILASS98,
Manchester, Academic Press.RIOBOO, R., MARENGO, M. & TROPEA, C. 2001 Outcomes from a drop impact on solid surfaces.
Atomiz. Sprays 11, 155–165.STOW, C. & HADFIELD, M. 1981 An experimental investigation of fluid flow resulting from the
impact of a water drop with an unyielding dry surface. Proc. R. Soc. Lond. A 373, 419–441.TAYLOR, G. I. 1959 The dynamics of thin sheets of fluid III. Disintegration of fluid sheets. Proc. R.
Soc. Lond. A 253, 313–321.THORAVAL, M.-J., TAKEHARA, K., ETOH, T., POPINET, S., RAY, P., JOSSERAND, C., ZALESKI,
S. & THORODDSEN, S. 2012 von Kármán vortex street within an impacting drop. Phys. Rev.Lett. 108, 264506.
THORODDSEN, S. 2002 The ejecta sheet generated by the impact of a drop. J. Fluid Mech. 451,373–381.
THORODDSEN, S., THORAVAL, M.-J., TAKEHARA, K. & ETOH, T. 2012 Micro-bubble morphologiesfollowing drop impacts onto a pool surface. J. Fluid Mech. 708, 469–479.
THORODDSEN, S. T., ETOH, T. G. & TAKEHARA, K. 2003 Air entrapment under an impacting drop.J. Fluid Mech. 478, 125–134.
THORODDSEN, S. T., ETOH, T. G., TAKEHARA, K., OOTSUKA, N. & HATSUKI, A. 2005 The airbubble entrapped under a drop impacting on a solid surface. J. Fluid Mech. 545, 203–212.
TRAN, T., DE MALEPRADE, H., SUN, C. & LOHSE, D. 2013 Air entrainment during impact ofdroplets on liquid surfaces. J. Fluid Mech. 726, R3.
TRYGGVASON, G., SCARDOVELLI, R. & ZALESKI, S. 2011 Direct Numerical Simulations of Gas-Liquid Multiphase Flows. Cambridge University Press.
WAGNER, H. 1932 Über Stoss und Gleitvorgänge und der Oberfläshe von Flüssigkeiten. Z. Angew.Math. Mech. 12 (4), 193–215.
WANG, A.-B., KUAN, C. C. & TSAI, P.-H. 2013 Do we understand the bubble formation by asingle drop impacting upon liquid surface? Phys. Fluids 25, 101702.
WILSON, S. & DUFFY, B. 1998 On lubrication with comparable viscous and inertia forces. Q. J.Mech. Appl. Maths 51, 105–124.
XU, L., ZHANG, W. & NAGEL, S. 2005 Drop splashing on a dry smooth surface. Phys. Rev. Lett.94, 184505.
YARIN, A. & WEISS, D. 1995 Impact of drops on solid surfaces: self-similar capillary waves, andsplashing as a new type of kinematic discontinuity. J. Fluid Mech. 283, 141–173.
YARIN, A. L. 2006 Drop impact dynamics: splashing, spreading, receding, bouncing. Annu. Rev.Fluid Mech. 38, 159–192.