January 21, 2015 Initiating Coverage ICICI Securities Ltd | Retail Equity Research Structural shift…new thrust to growth… Century Plyboard (India) (CPIL) is India’s leading plywood player with the largest plywood capacity and enjoys ~23-30% share of the country’s organised plywood market (~25-30% of total plywood market). With a pan-India distribution network and security over raw materials, CPIL is likely to benefit from the structural shift towards the organised pie (currently stands at ~| 3500-4500 crore) on account of the rollout of GST and Myanmar’s ban on timber export. Consequently, we anticipate CPIL’s earning will grow exponentially at 52.0% during FY14-17E. We initiate coverage on CPIL with a BUY recommendation and a target price of | 254 (24x FY17E EPS, implying a PEG of 0.5x). Leading player with strong brand equity & robust distribution network… The Indian plywood industry is worth ~| 15,000-16,000 crore where the organised segment accounts for ~25-30% of the overall market. CPIL, with a capacity of 209,420 cubic metres (CBM) in FY14, is the leading player in the plywood industry. The company enjoys ~23-30% share of the organised market with strong brands across product categories and a robust pan-India distribution network comprising 33 marketing offices, 1424 dealers, 6333 employees and more than 13,000 retail outlets. Myanmar ban & GST roll out – structurally positive for organised pie… In April, 2014, Myanmar banned the export of raw timber logs, putting Indian plywood players at a huge disadvantage as they were heavily dependent on Myanmar for raw timber. However, CPIL had proactively set up a plant in Myanmar to process raw timber providing security on face veneer (key component for plywood). This has helped the company to gain a first mover advantage over others. Secondly, with the rollout of GST, the pricing difference between organised and unorganised players due to tax inequalities is likely to narrow down providing a level playing field to organised players. Hence, we believe CPIL will reap the benefits of a structural shift towards organised players. Set to ride expanding organised pie; initiate with BUY... Like other building materials such as tiles, we envisage the Indian organised plywood player’s pie will expand in coming years on the back of structural changes like rollout of GST, ban on raw material from Myanmar and higher brand aspirations. CPIL is likely to see exponential earnings growth of 52.0% in FY14-17E with a significant improvement in return ratios and leverage making a strong case for a further re-rating. Hence, we initiate coverage on CPIL with a BUY recommendation and a target price of | 254 (24x FY17E EPS implying a PEG of 0.5x). Exhibit 1: Financial performance FY13 FY14 FY15E FY16E FY17E Net Sales (| crore) 1,131.2 1,284.0 1,545.3 1,865.7 2,299.9 EBITDA (| crore) 112.9 148.2 245.4 297.6 363.6 Net Profit (| crore) 52.7 67.0 140.0 182.4 235.1 EPS (|) 2.4 3.0 6.3 8.2 10.6 P/E (x) 81.5 64.1 30.7 23.5 18.3 Price / Book (x) 17.2 14.7 11.2 8.6 6.6 EV/EBITDA (x) 41.5 32.2 19.4 15.8 12.8 RoCE (%) 12.0 14.7 23.8 26.3 28.6 RoE (%) 21.1 23.0 36.6 36.4 36.0 Source: Company, ICICIdirect.com Research Century Plyboards (India) (CENPLY) | 193 Rating matrix Rating : Buy Target : | 254 Target Period : 18-24 months Potential Upside : 31% YoY Growth (%) FY14 FY15E FY16E FY17E Net Sales 13.5 20.4 20.7 23.3 EBITDA 31.3 65.6 21.3 22.2 Net Profit 27.1 109.1 30.3 28.9 EPS (|) 3.0 6.3 8.2 10.6 Valuation summary (x) FY14 FY15E FY16E FY17E P/E 64.1 30.7 23.5 18.3 Target P/E 84.3 40.3 30.9 24.0 EV / EBITDA 32.2 19.4 15.8 12.8 P/BV 14.7 11.2 8.6 6.6 RoNW (%) 23.0 36.6 36.4 36.0 RoCE (%) 14.7 23.8 26.3 28.6 Stock data Particular Amount Bloomberg/Reuters Code CPBI IN / CNTP.NS Sensex / Nifty 27019 / 8083 30 Day Average Volume 418,481 Market Cap (| crore) 4,294.3 52 week H/L (|) 193 / 22 Equity Capital (| crore) 22.3 Face value (|) 1.0 Promoter's Stake (%) 74.5 FII Holding (%) 6.0 DII Holding (%) 2.8 Comparative return matrix (%) 1M 3M 6M 12M Century Plyboards 10.5 51.2 97.4 576.5 Greenply Industries 8.5 (11.7) 4.6 143.9 Archidply Industries 7.0 94.4 197.0 331.4 Sarda Plywood 38.3 53.8 85.8 159.9 Price movement 0 50 100 150 200 250 Jan-15 Jul-14 Jan-14 Aug-13 Feb-13 Aug-12 Feb-12 0 2,000 4,000 6,000 8,000 10,000 Price (R.H.S) Nifty (L.H.S) Research Analyst Deepak Purswani, CFA deepak,[email protected]Nikunj Gala [email protected]
Transcript
January 21, 2015
Initiating Coverage
ICICI Securities Ltd | Retail Equity Research
Structural shift…new thrust to growth… Century Plyboard (India) (CPIL) is India’s leading plywood player with the largest plywood capacity and enjoys ~23-30% share of the country’s organised plywood market (~25-30% of total plywood market). With a pan-India distribution network and security over raw materials, CPIL is likely to benefit from the structural shift towards the organised pie (currently stands at ~| 3500-4500 crore) on account of the rollout of GST and Myanmar’s ban on timber export. Consequently, we anticipate CPIL’s earning will grow exponentially at 52.0% during FY14-17E. We initiate coverage on CPIL with a BUY recommendation and a target price of | 254 (24x FY17E EPS, implying a PEG of 0.5x). Leading player with strong brand equity & robust distribution network… The Indian plywood industry is worth ~| 15,000-16,000 crore where the organised segment accounts for ~25-30% of the overall market. CPIL, with a capacity of 209,420 cubic metres (CBM) in FY14, is the leading player in the plywood industry. The company enjoys ~23-30% share of the organised market with strong brands across product categories and a robust pan-India distribution network comprising 33 marketing offices, 1424 dealers, 6333 employees and more than 13,000 retail outlets. Myanmar ban & GST roll out – structurally positive for organised pie… In April, 2014, Myanmar banned the export of raw timber logs, putting Indian plywood players at a huge disadvantage as they were heavily dependent on Myanmar for raw timber. However, CPIL had proactively set up a plant in Myanmar to process raw timber providing security on face veneer (key component for plywood). This has helped the company to gain a first mover advantage over others. Secondly, with the rollout of GST, the pricing difference between organised and unorganised players due to tax inequalities is likely to narrow down providing a level playing field to organised players. Hence, we believe CPIL will reap the benefits of a structural shift towards organised players. Set to ride expanding organised pie; initiate with BUY... Like other building materials such as tiles, we envisage the Indian organised plywood player’s pie will expand in coming years on the back of structural changes like rollout of GST, ban on raw material from Myanmar and higher brand aspirations. CPIL is likely to see exponential earnings growth of 52.0% in FY14-17E with a significant improvement in return ratios and leverage making a strong case for a further re-rating. Hence, we initiate coverage on CPIL with a BUY recommendation and a target price of | 254 (24x FY17E EPS implying a PEG of 0.5x).
Page 2ICICI Securities Ltd | Retail Equity Research
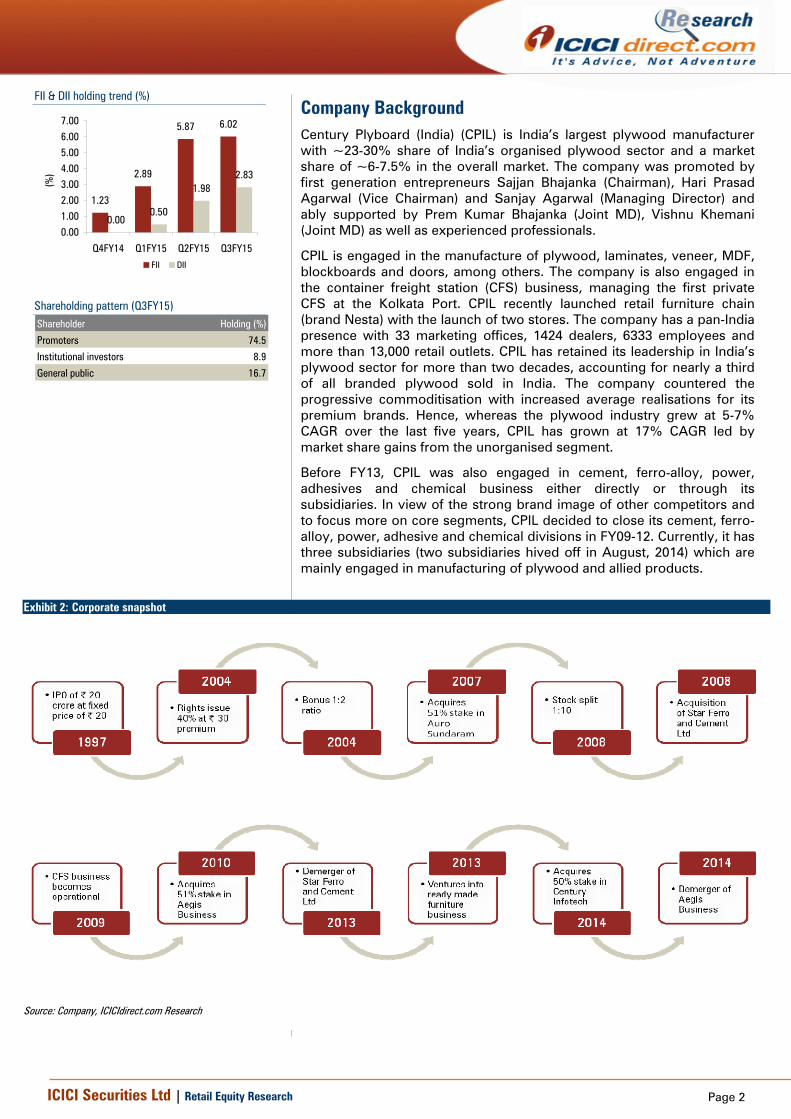
Company Background Century Plyboard (India) (CPIL) is India’s largest plywood manufacturer with ~23-30% share of India’s organised plywood sector and a market share of ~6-7.5% in the overall market. The company was promoted by first generation entrepreneurs Sajjan Bhajanka (Chairman), Hari Prasad Agarwal (Vice Chairman) and Sanjay Agarwal (Managing Director) and ably supported by Prem Kumar Bhajanka (Joint MD), Vishnu Khemani (Joint MD) as well as experienced professionals.
CPIL is engaged in the manufacture of plywood, laminates, veneer, MDF, blockboards and doors, among others. The company is also engaged in the container freight station (CFS) business, managing the first private CFS at the Kolkata Port. CPIL recently launched retail furniture chain (brand Nesta) with the launch of two stores. The company has a pan-India presence with 33 marketing offices, 1424 dealers, 6333 employees and more than 13,000 retail outlets. CPIL has retained its leadership in India’s plywood sector for more than two decades, accounting for nearly a third of all branded plywood sold in India. The company countered the progressive commoditisation with increased average realisations for its premium brands. Hence, whereas the plywood industry grew at 5-7% CAGR over the last five years, CPIL has grown at 17% CAGR led by market share gains from the unorganised segment.
Before FY13, CPIL was also engaged in cement, ferro-alloy, power, adhesives and chemical business either directly or through its subsidiaries. In view of the strong brand image of other competitors and to focus more on core segments, CPIL decided to close its cement, ferro-alloy, power, adhesive and chemical divisions in FY09-12. Currently, it has three subsidiaries (two subsidiaries hived off in August, 2014) which are mainly engaged in manufacturing of plywood and allied products.
Page 3ICICI Securities Ltd | Retail Equity Research
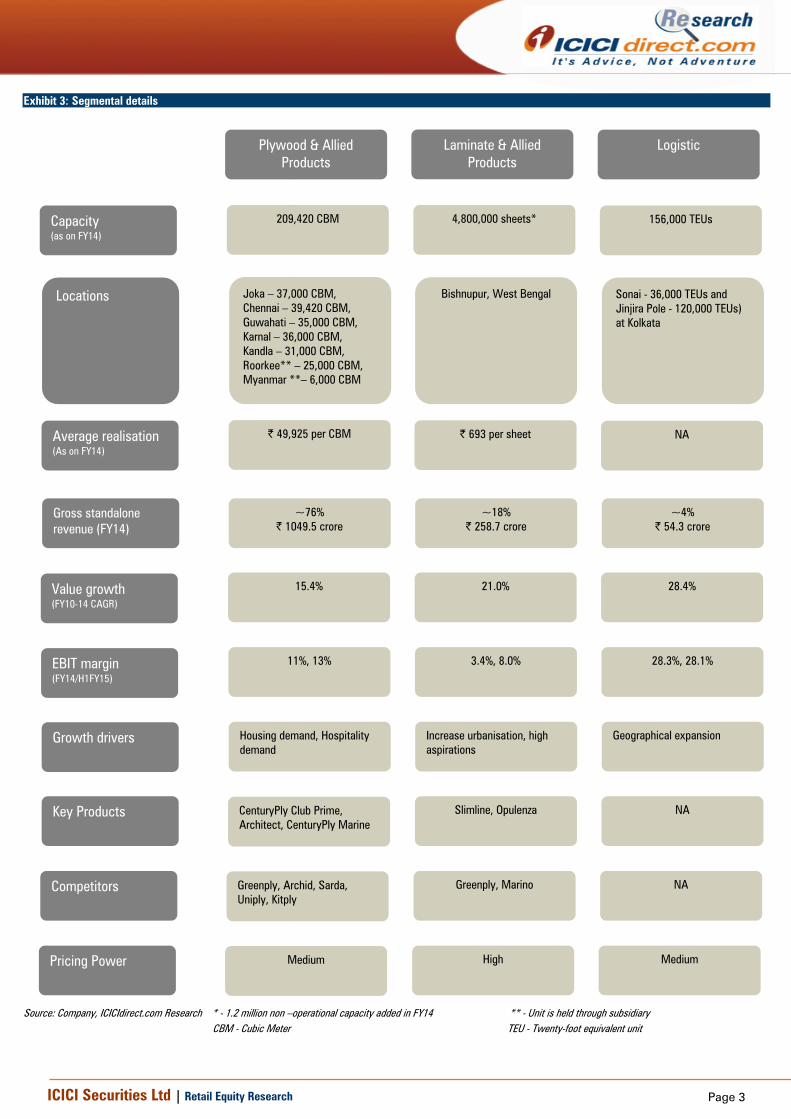
Exhibit 3: Segmental details
Source: Company, ICICIdirect.com Research * - 1.2 million non –operational capacity added in FY14 ** - Unit is held through subsidiary CBM - Cubic Meter TEU - Twenty-foot equivalent unit
Plywood & Allied Products
Laminate & Allied Products
Logistic
Capacity (as on FY14)
209,420 CBM
4,800,000 sheets*
156,000 TEUs
Gross standalone revenue (FY14)
~76% | 1049.5 crore
~18% | 258.7 crore
~4% | 54.3 crore
Value growth (FY10-14 CAGR)
15.4% 21.0% 28.4%
EBIT margin (FY14/H1FY15)
11%, 13% 3.4%, 8.0% 28.3%, 28.1%
Growth drivers Housing demand, Hospitality demand
Increase urbanisation, high aspirations
Geographical expansion
Key Products CenturyPly Club Prime, Architect, CenturyPly Marine
Bishnupur, West Bengal Sonai - 36,000 TEUs and Jinjira Pole - 120,000 TEUs) at Kolkata
Average realisation (As on FY14)
| 49,925 per CBM | 693 per sheet
NA
Page 4ICICI Securities Ltd | Retail Equity Research
Exhibit 4: Corporate Structure as on FY14
Source: Company, ICICIdirect.com Research * : On August 23, 2014 CPIL sold its stake in Aegis Business Ltd and Aegis Overseas Ltd
Century Plyboard (India) Ltd
Sajjan Bhajanka (26.7%) - Executive Chairman - 45 years of industry experience -Responsible for the overall strategic direction and Production, Finance, Treasury
Auro Sundram Ply & Door Pvt Ltd
(51%)
Aegis Business Ltd
(51%)
Century MDF Ltd (100%)
Century Ply Myanmar Pvt Ltd
(100%)
Aegis Overseas Ltd (100%)
Incorporated in - India Total assets - | 22.7 crore Gross turnover - | 57.5 crore PAT - | 0.7 crore
Incorporated in - India Total assets - | 96.3 crore Gross turnover - | 31.6 crore PAT - | 11.3 crore
Incorporated in - UAE Total assets - | 5.0 crore Gross turnover - | 36.2 crore PAT - | 3.9 crore
Incorporated in - Myanmar Total Assets - | 37.1 crore Gross Turnover - | 11.0 crore PAT – (| 5.0) crore
Incorporated in - India Total assets - | 0.3 crore Gross turnover - NA PAT - NA
Operating a plywood and allied products unit from eco-friendly agro-forestry timber at Roorkee
ABL and AOL are engaged in logistics and trading of mineral and other commodities. ABL has also entered the shipping business by acquiring a super max vessel of 52261 tonne capacity
Engaged in manufacturing of MDF
CMPL has set up a veneer and plywood unit in Myanmar, which became operational in FY14
Sanjay Agarwal (26.5%) - CEO and Managing Director - 30 years of industry experience - Responsible for sales, marketing, IT and HR
Prem Bhajanka (6.2%) - Managing Director - 30 years of industry experience - Responsible for timber procurement and operations of four units incl. Myanmar
Hari Prasad Agarwal (6.4%) - Executive Director - 48 years of administrative experience - Responsible for General Administration
Vishnu Khemani (8.6%) - Managing Director - 30 years of industry experience - Responsible for timber procurement and heads South India operations of plywood
FII (6.0%) DII (2.8%)
Others (16.7%)
Ajay Baldawa - Executive Director (Technical) - M Tech from IIT with 30 years of plywood industry experience. - Responsible for all technical matters
Arun Julasaria - CFO - FCA, FCS with varied experience over 25 years - Responsible for finance, accounts, audit treasury, corporate structuring
Ashutosh Jaiswal - President (CFS Operations) - Varied experience over 30 years - Heads CFS division and international trade
Anoop Hoon - President – Sales & marketing - XLRI graduate with varied experience over 35 years including 13 years as marketing head of Asian Paints
Sugata Halder - GM (Human Resources) - PGDM in Human Resource Management with 22 years experience in HR matters, including seven years as Regional HR head of Bharti Airtel - Responsible for HR matters
Amit Gope - GM - Branding - MBA (Marketing) from XIMB, with 21 years experience in branding matters including seven years with Vodafone, Airtel & Uninor - Responsible for branding related activities
Professionally managed
Promoters hold 74.5%
Has/Had* subsidiaries (details as on FY14)
Page 5ICICI Securities Ltd | Retail Equity Research
Investment Rationale Structural shift in industry…positive for organised players!!!
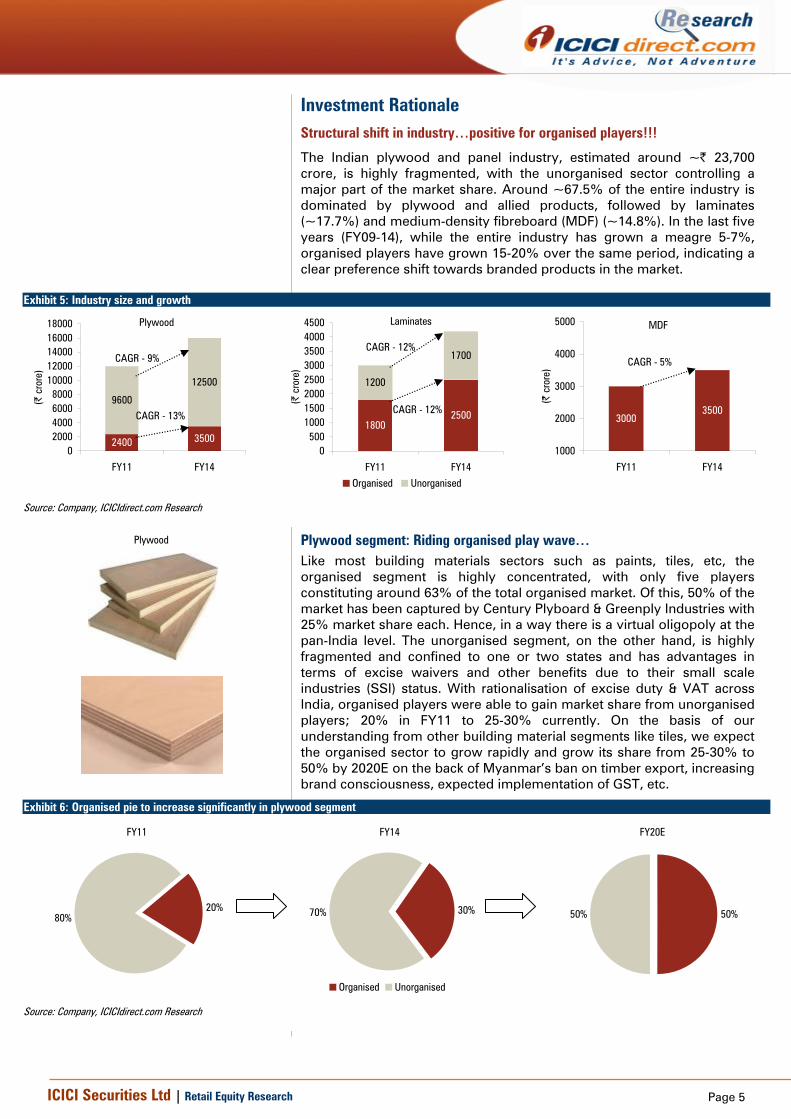
The Indian plywood and panel industry, estimated around ~| 23,700 crore, is highly fragmented, with the unorganised sector controlling a major part of the market share. Around ~67.5% of the entire industry is dominated by plywood and allied products, followed by laminates (~17.7%) and medium-density fibreboard (MDF) (~14.8%). In the last five years (FY09-14), while the entire industry has grown a meagre 5-7%, organised players have grown 15-20% over the same period, indicating a clear preference shift towards branded products in the market.
Exhibit 5: Industry size and growth
2400 3500
9600
12500
02000400060008000
1000012000140001600018000
FY11 FY14
(| c
rore
)
CAGR - 9%
CAGR - 13%
Plywood
18002500
1200
1700
0500
10001500200025003000350040004500
FY11 FY14
(| c
rore
)
Organised Unorganised
CAGR - 12%
CAGR - 12%
Laminates
30003500
1000
2000
3000
4000
5000
FY11 FY14
(| c
rore
)
CAGR - 5%
MDF
Source: Company, ICICIdirect.com Research
Plywood segment: Riding organised play wave… Like most building materials sectors such as paints, tiles, etc, the organised segment is highly concentrated, with only five players constituting around 63% of the total organised market. Of this, 50% of the market has been captured by Century Plyboard & Greenply Industries with 25% market share each. Hence, in a way there is a virtual oligopoly at the pan-India level. The unorganised segment, on the other hand, is highly fragmented and confined to one or two states and has advantages in terms of excise waivers and other benefits due to their small scale industries (SSI) status. With rationalisation of excise duty & VAT across India, organised players were able to gain market share from unorganised players; 20% in FY11 to 25-30% currently. On the basis of our understanding from other building material segments like tiles, we expect the organised sector to grow rapidly and grow its share from 25-30% to 50% by 2020E on the back of Myanmar’s ban on timber export, increasing brand consciousness, expected implementation of GST, etc.
Exhibit 6: Organised pie to increase significantly in plywood segment
FY11
80%20%
FY14
70% 30%
Organised Unorganised
FY20E
50% 50%
Source: Company, ICICIdirect.com Research
Plywood
Page 6ICICI Securities Ltd | Retail Equity Research
The plywood industry is basically divided into three segments viz. premium, medium and low on the basis of quality of products. The market is dominated by medium & low quality plywood, which is mainly served by the unorganised industry whereas organised players have a major presence in the premium & medium segment. Therefore, players in the organised market face stiff competition from local players. However, a rising middle class and urbanisation (refer exhibit 7 for demand drivers) are slowly drawing the attention of consumers towards branded plywood. A large unorganised space also spells out a huge opportunity for organised players to capture a bigger market share in times to come.
Myanmar ban on timber export…
Myanmar has some of Asia's largest remaining expanses of forests, from the slopes of the Himalayan foothills in the north to steamy rainforests in the south. Myanmar was the only country to export raw teak logs from natural forests rather than plantations. However, the forest cover shrank almost a fifth, to 47% of land area in 2010, from 58% in 1990, according to Myanmar Forestry Ministry data. Therefore, the country banned the export of raw timber logs from April 1, 2014. Though a new law prohibited the export of all raw tree logs, it did not stop firms from processing timber in the country and exporting it. Hence, probably the main intention of the ban on raw timber logs was to create more jobs internally for Burmese citizens as prior to the ban the Myanmar Investment Commission (MIC) started giving licenses from December, 2013 itself to build wood processing factories in the country.
Myanmar’s ban on timber export put Indian plywood players at a huge disadvantage as they were heavily dependent on Myanmar for raw timber. Consequently, Century Plyboards and Greenply Industries have started to build factories in an industrial zone in Dagon, Rangoon to bring face veneer to India. Now, unorganised and small players are heavily dependent on Century Plyboard and Greenply for procurement of face veneer in addition to raw material procurement from other countries like Vietnam, Indonesia, Thailand, Germany, etc. Hence, we believe the organised sector’s pie would further increase, going ahead.
GST – Key catalyst for growth of organised players…
Currently, unorganised players enjoy excise waivers and other benefits due to their small scale industries (SSI) status and clandestine sales. Thus, the inequitable indirect duty structure provides a huge price advantage to unorganised players over organised players. Consequently, India’s plywood sector is dominated by the unorganised sector, accounting for 70% of the total market size.
Following the proposed implementation of GST, this large indirect tax differential is expected to narrow down, bringing organised and unorganised players on an even tax platform. This potential game changer could become a huge catalyst for growth and give plywood manufacturers an opportunity to tap into the unorganised market, whose size is ~2x the organised market.
GST will address the complexities and inefficiencies of the current indirect tax framework through a robust technology platform. Post GST, clandestine business will become almost impossible. GST will address double taxation, cascading effects and regional disparities in tax rates. Post GST, inter state transactions will be tax neutral. GST will be a win-win situation for all stakeholders as it will lower tax incidence, ease business and increase tax buoyancy coupled with tax collections.
Page 7ICICI Securities Ltd | Retail Equity Research
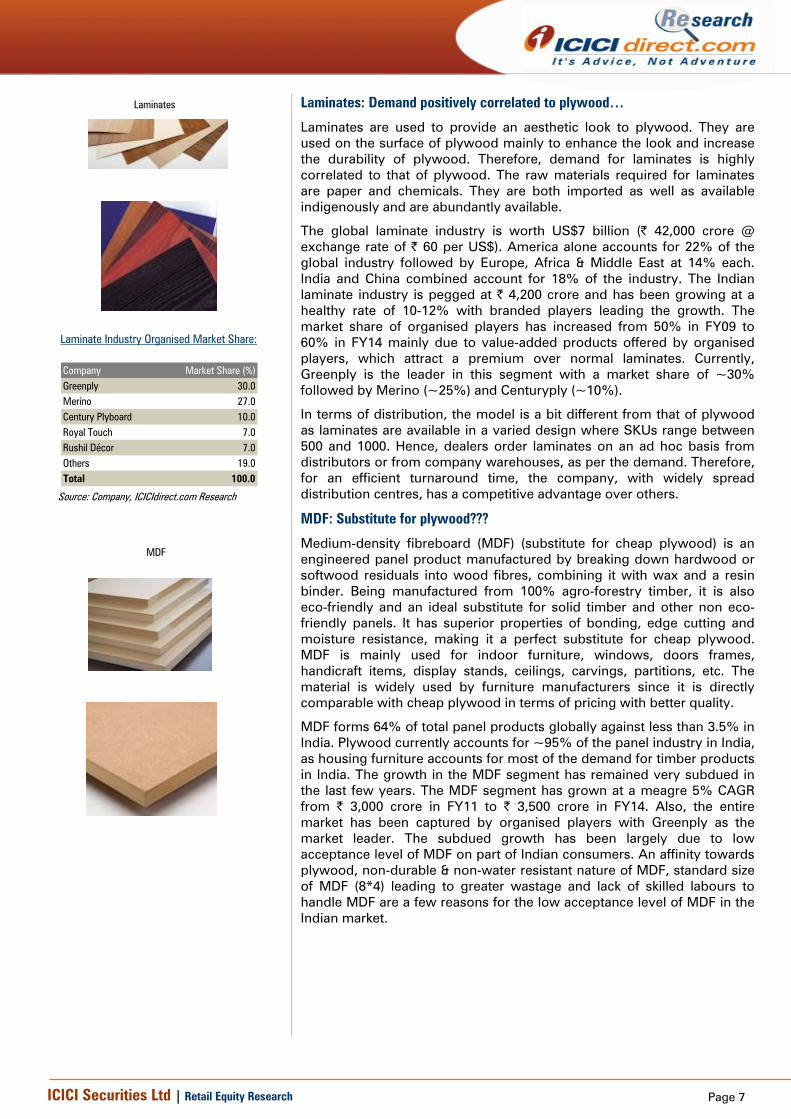
Laminates: Demand positively correlated to plywood…
Laminates are used to provide an aesthetic look to plywood. They are used on the surface of plywood mainly to enhance the look and increase the durability of plywood. Therefore, demand for laminates is highly correlated to that of plywood. The raw materials required for laminates are paper and chemicals. They are both imported as well as available indigenously and are abundantly available.
The global laminate industry is worth US$7 billion (| 42,000 crore @ exchange rate of | 60 per US$). America alone accounts for 22% of the global industry followed by Europe, Africa & Middle East at 14% each. India and China combined account for 18% of the industry. The Indian laminate industry is pegged at | 4,200 crore and has been growing at a healthy rate of 10-12% with branded players leading the growth. The market share of organised players has increased from 50% in FY09 to 60% in FY14 mainly due to value-added products offered by organised players, which attract a premium over normal laminates. Currently, Greenply is the leader in this segment with a market share of ~30% followed by Merino (~25%) and Centuryply (~10%).
In terms of distribution, the model is a bit different from that of plywood as laminates are available in a varied design where SKUs range between 500 and 1000. Hence, dealers order laminates on an ad hoc basis from distributors or from company warehouses, as per the demand. Therefore, for an efficient turnaround time, the company, with widely spread distribution centres, has a competitive advantage over others.
MDF: Substitute for plywood???
Medium-density fibreboard (MDF) (substitute for cheap plywood) is an engineered panel product manufactured by breaking down hardwood or softwood residuals into wood fibres, combining it with wax and a resin binder. Being manufactured from 100% agro-forestry timber, it is also eco-friendly and an ideal substitute for solid timber and other non eco-friendly panels. It has superior properties of bonding, edge cutting and moisture resistance, making it a perfect substitute for cheap plywood. MDF is mainly used for indoor furniture, windows, doors frames, handicraft items, display stands, ceilings, carvings, partitions, etc. The material is widely used by furniture manufacturers since it is directly comparable with cheap plywood in terms of pricing with better quality.
MDF forms 64% of total panel products globally against less than 3.5% in India. Plywood currently accounts for ~95% of the panel industry in India, as housing furniture accounts for most of the demand for timber products in India. The growth in the MDF segment has remained very subdued in the last few years. The MDF segment has grown at a meagre 5% CAGR from | 3,000 crore in FY11 to | 3,500 crore in FY14. Also, the entire market has been captured by organised players with Greenply as the market leader. The subdued growth has been largely due to low acceptance level of MDF on part of Indian consumers. An affinity towards plywood, non-durable & non-water resistant nature of MDF, standard size of MDF (8*4) leading to greater wastage and lack of skilled labours to handle MDF are a few reasons for the low acceptance level of MDF in the Indian market.
Page 8ICICI Securities Ltd | Retail Equity Research
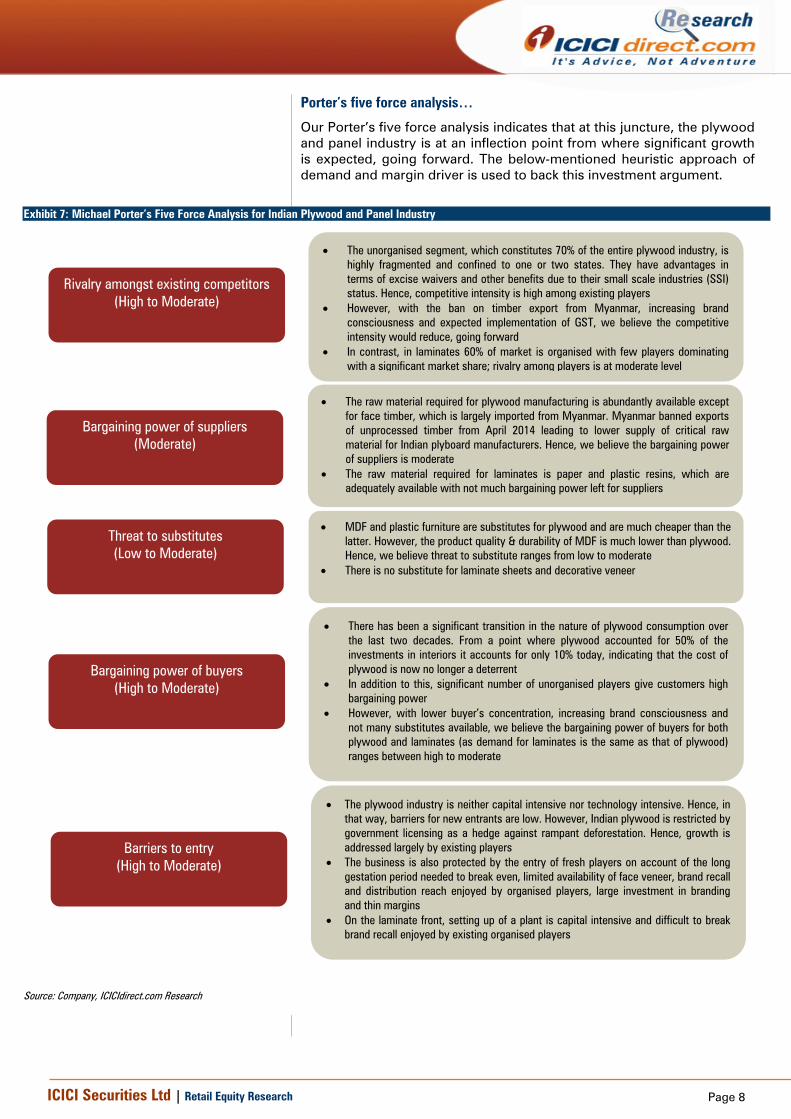
Porter’s five force analysis…
Our Porter’s five force analysis indicates that at this juncture, the plywood and panel industry is at an inflection point from where significant growth is expected, going forward. The below-mentioned heuristic approach of demand and margin driver is used to back this investment argument.
Exhibit 7: Michael Porter’s Five Force Analysis for Indian Plywood and Panel Industry
Source: Company, ICICIdirect.com Research
Rivalry amongst existing competitors (High to Moderate)
• The plywood industry is neither capital intensive nor technology intensive. Hence, in that way, barriers for new entrants are low. However, Indian plywood is restricted by government licensing as a hedge against rampant deforestation. Hence, growth is addressed largely by existing players
• The business is also protected by the entry of fresh players on account of the long gestation period needed to break even, limited availability of face veneer, brand recall and distribution reach enjoyed by organised players, large investment in branding and thin margins
• On the laminate front, setting up of a plant is capital intensive and difficult to break brand recall enjoyed by existing organised players
Bargaining power of suppliers (Moderate)
Threat to substitutes (Low to Moderate)
Barriers to entry (High to Moderate)
Bargaining power of buyers (High to Moderate)
• The raw material required for plywood manufacturing is abundantly available except for face timber, which is largely imported from Myanmar. Myanmar banned exports of unprocessed timber from April 2014 leading to lower supply of critical raw material for Indian plyboard manufacturers. Hence, we believe the bargaining power of suppliers is moderate
• The raw material required for laminates is paper and plastic resins, which are adequately available with not much bargaining power left for suppliers
• MDF and plastic furniture are substitutes for plywood and are much cheaper than the latter. However, the product quality & durability of MDF is much lower than plywood. Hence, we believe threat to substitute ranges from low to moderate
• There is no substitute for laminate sheets and decorative veneer
• There has been a significant transition in the nature of plywood consumption over the last two decades. From a point where plywood accounted for 50% of the investments in interiors it accounts for only 10% today, indicating that the cost of plywood is now no longer a deterrent
• In addition to this, significant number of unorganised players give customers high bargaining power
• However, with lower buyer’s concentration, increasing brand consciousness and not many substitutes available, we believe the bargaining power of buyers for both plywood and laminates (as demand for laminates is the same as that of plywood) ranges between high to moderate
• The unorganised segment, which constitutes 70% of the entire plywood industry, is highly fragmented and confined to one or two states. They have advantages in terms of excise waivers and other benefits due to their small scale industries (SSI) status. Hence, competitive intensity is high among existing players
• However, with the ban on timber export from Myanmar, increasing brand consciousness and expected implementation of GST, we believe the competitive intensity would reduce, going forward
• In contrast, in laminates 60% of market is organised with few players dominating with a significant market share; rivalry among players is at moderate level
Page 9ICICI Securities Ltd | Retail Equity Research
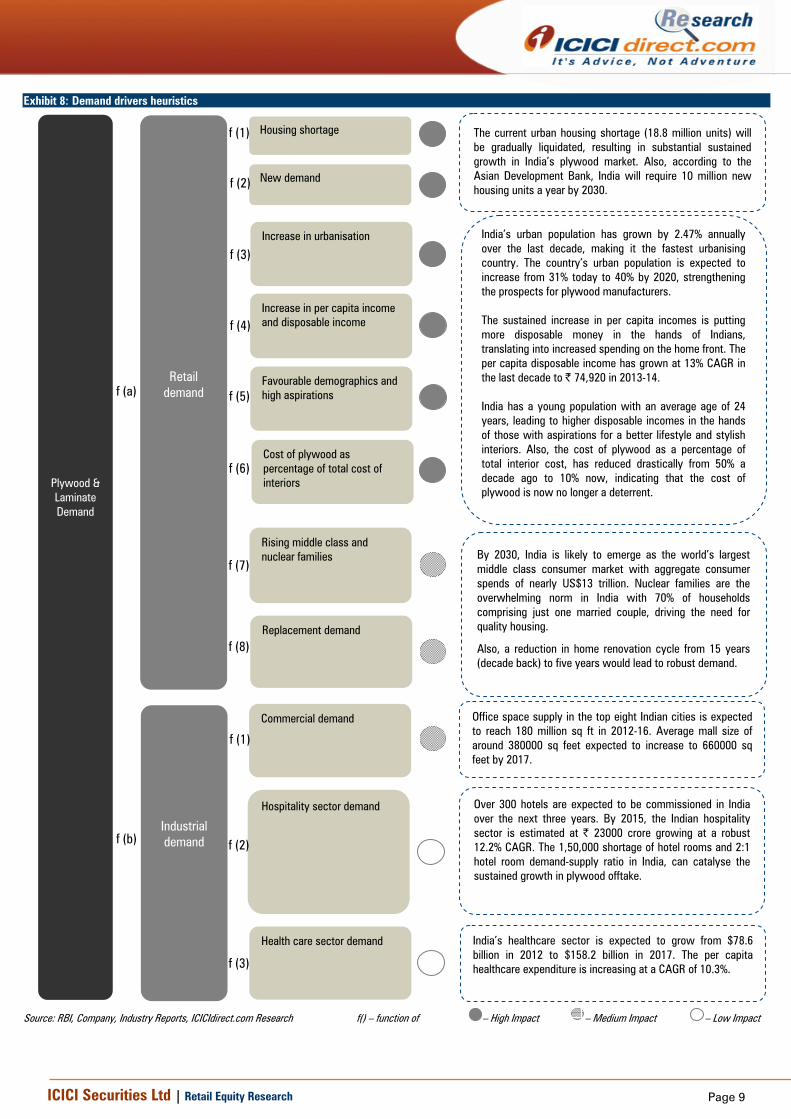
Exhibit 8: Demand drivers heuristics
Source: RBI, Company, Industry Reports, ICICIdirect.com Research f() – function of – High Impact – Medium Impact – Low Impact
Retail demand
Housing shortage
Industrial demand
Plywood & Laminate Demand
Commercial demand
f (a)
f (b)
New demand
Increase in urbanisation
Increase in per capita income and disposable income
Favourable demographics and high aspirations
Rising middle class and nuclear families
Replacement demand
Hospitality sector demand
Health care sector demand
The current urban housing shortage (18.8 million units) will be gradually liquidated, resulting in substantial sustained growth in India’s plywood market. Also, according to the Asian Development Bank, India will require 10 million new housing units a year by 2030.
India’s urban population has grown by 2.47% annually over the last decade, making it the fastest urbanising country. The country’s urban population is expected to increase from 31% today to 40% by 2020, strengthening the prospects for plywood manufacturers. The sustained increase in per capita incomes is putting more disposable money in the hands of Indians, translating into increased spending on the home front. The per capita disposable income has grown at 13% CAGR in the last decade to | 74,920 in 2013-14. India has a young population with an average age of 24 years, leading to higher disposable incomes in the hands of those with aspirations for a better lifestyle and stylish interiors. Also, the cost of plywood as a percentage of total interior cost, has reduced drastically from 50% a decade ago to 10% now, indicating that the cost of plywood is now no longer a deterrent.
By 2030, India is likely to emerge as the world’s largest middle class consumer market with aggregate consumer spends of nearly US$13 trillion. Nuclear families are the overwhelming norm in India with 70% of households comprising just one married couple, driving the need for quality housing.
Also, a reduction in home renovation cycle from 15 years (decade back) to five years would lead to robust demand.
Office space supply in the top eight Indian cities is expected to reach 180 million sq ft in 2012-16. Average mall size of around 380000 sq feet expected to increase to 660000 sq feet by 2017.
Over 300 hotels are expected to be commissioned in India over the next three years. By 2015, the Indian hospitality sector is estimated at | 23000 crore growing at a robust 12.2% CAGR. The 1,50,000 shortage of hotel rooms and 2:1 hotel room demand-supply ratio in India, can catalyse the sustained growth in plywood offtake.
India’s healthcare sector is expected to grow from $78.6 billion in 2012 to $158.2 billion in 2017. The per capita healthcare expenditure is increasing at a CAGR of 10.3%.
Cost of plywood as percentage of total cost of interiors
f (1)
f (2)
f (3)
f (4)
f (5)
f (6)
f (7)
f (8)
f (1)
f (2)
f (3)
Page 10ICICI Securities Ltd | Retail Equity Research
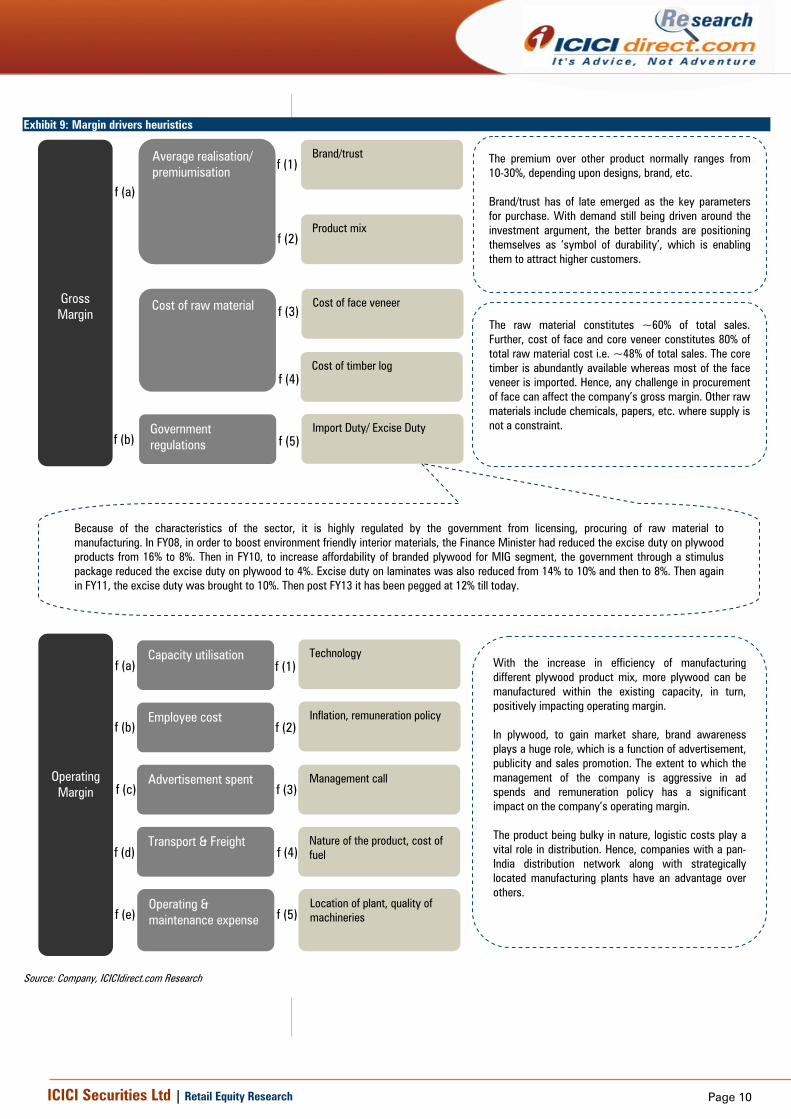
Exhibit 9: Margin drivers heuristics
Source: Company, ICICIdirect.com Research
Average realisation/ premiumisation
Cost of face veneer Cost of raw material
Gross Margin
f (a)
f (4) Cost of timber log
Employee cost
Technology
Advertisement spent
Operating Margin
Inflation, remuneration policy f (b)
f (c)
The premium over other product normally ranges from 10-30%, depending upon designs, brand, etc. Brand/trust has of late emerged as the key parameters for purchase. With demand still being driven around the investment argument, the better brands are positioning themselves as ‘symbol of durability’, which is enabling them to attract higher customers.
Government regulations
Transport & Freight
Operating & maintenance expense
Capacity utilisation
Brand/trust
Product mix
Import Duty/ Excise Duty
The raw material constitutes ~60% of total sales. Further, cost of face and core veneer constitutes 80% of total raw material cost i.e. ~48% of total sales. The core timber is abundantly available whereas most of the face veneer is imported. Hence, any challenge in procurement of face can affect the company’s gross margin. Other raw materials include chemicals, papers, etc. where supply is not a constraint.
f (b)
f (d)
f (a)
f (e)
Management call
Nature of the product, cost of fuel
Location of plant, quality of machineries
f (2)
f (3)
f (4)
f (1)
f (5)
With the increase in efficiency of manufacturing different plywood product mix, more plywood can be manufactured within the existing capacity, in turn, positively impacting operating margin. In plywood, to gain market share, brand awareness plays a huge role, which is a function of advertisement, publicity and sales promotion. The extent to which the management of the company is aggressive in ad spends and remuneration policy has a significant impact on the company’s operating margin. The product being bulky in nature, logistic costs play a vital role in distribution. Hence, companies with a pan-India distribution network along with strategically located manufacturing plants have an advantage over others.
Because of the characteristics of the sector, it is highly regulated by the government from licensing, procuring of raw material to manufacturing. In FY08, in order to boost environment friendly interior materials, the Finance Minister had reduced the excise duty on plywood products from 16% to 8%. Then in FY10, to increase affordability of branded plywood for MIG segment, the government through a stimulus package reduced the excise duty on plywood to 4%. Excise duty on laminates was also reduced from 14% to 10% and then to 8%. Then again in FY11, the excise duty was brought to 10%. Then post FY13 it has been pegged at 12% till today.
f (1)
f (2)
f (3)
f (5)
Page 11ICICI Securities Ltd | Retail Equity Research
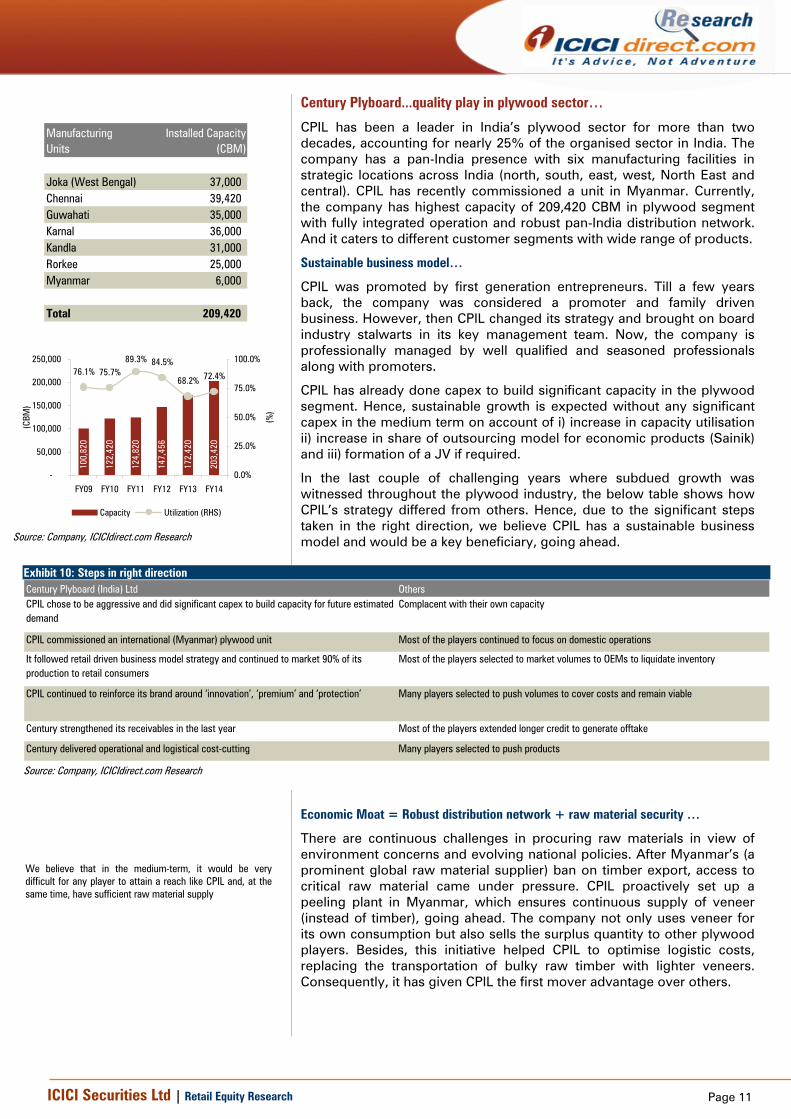
Century Plyboard...quality play in plywood sector…
CPIL has been a leader in India’s plywood sector for more than two decades, accounting for nearly 25% of the organised sector in India. The company has a pan-India presence with six manufacturing facilities in strategic locations across India (north, south, east, west, North East and central). CPIL has recently commissioned a unit in Myanmar. Currently, the company has highest capacity of 209,420 CBM in plywood segment with fully integrated operation and robust pan-India distribution network. And it caters to different customer segments with wide range of products.
Sustainable business model…
CPIL was promoted by first generation entrepreneurs. Till a few years back, the company was considered a promoter and family driven business. However, then CPIL changed its strategy and brought on board industry stalwarts in its key management team. Now, the company is professionally managed by well qualified and seasoned professionals along with promoters.
CPIL has already done capex to build significant capacity in the plywood segment. Hence, sustainable growth is expected without any significant capex in the medium term on account of i) increase in capacity utilisation ii) increase in share of outsourcing model for economic products (Sainik) and iii) formation of a JV if required.
In the last couple of challenging years where subdued growth was witnessed throughout the plywood industry, the below table shows how CPIL’s strategy differed from others. Hence, due to the significant steps taken in the right direction, we believe CPIL has a sustainable business model and would be a key beneficiary, going ahead.
Exhibit 10: Steps in right direction Century Plyboard (India) Ltd OthersCPIL chose to be aggressive and did significant capex to build capacity for future estimated demand
Complacent with their own capacity
CPIL commissioned an international (Myanmar) plywood unit Most of the players continued to focus on domestic operations
It followed retail driven business model strategy and continued to market 90% of its production to retail consumers
Most of the players selected to market volumes to OEMs to liquidate inventory
CPIL continued to reinforce its brand around ‘innovation’, ‘premium’ and ‘protection’ Many players selected to push volumes to cover costs and remain viable
Century strengthened its receivables in the last year Most of the players extended longer credit to generate offtake
Century delivered operational and logistical cost-cutting Many players selected to push products
Source: Company, ICICIdirect.com Research
Economic Moat = Robust distribution network + raw material security …
There are continuous challenges in procuring raw materials in view of environment concerns and evolving national policies. After Myanmar’s (a prominent global raw material supplier) ban on timber export, access to critical raw material came under pressure. CPIL proactively set up a peeling plant in Myanmar, which ensures continuous supply of veneer (instead of timber), going ahead. The company not only uses veneer for its own consumption but also sells the surplus quantity to other plywood players. Besides, this initiative helped CPIL to optimise logistic costs, replacing the transportation of bulky raw timber with lighter veneers. Consequently, it has given CPIL the first mover advantage over others.
100,
820
122,
420
124,
820
147,
456
172,
420
203,
420
76.1% 75.7%89.3% 84.5%
68.2% 72.4%
-
50,000
100,000
150,000
200,000
250,000
FY09 FY10 FY11 FY12 FY13 FY14
(CBM
)
0.0%
25.0%
50.0%
75.0%
100.0%
(%)
Capacity Utilization (RHS)
Source: Company, ICICIdirect.com Research
ManufacturingUnits
Installed Capacity (CBM)
Joka (West Bengal) 37,000 Chennai 39,420 Guwahati 35,000 Karnal 36,000 Kandla 31,000 Rorkee 25,000 Myanmar 6,000
Total 209,420
We believe that in the medium-term, it would be very difficult for any player to attain a reach like CPIL and, at the same time, have sufficient raw material supply
Page 12ICICI Securities Ltd | Retail Equity Research
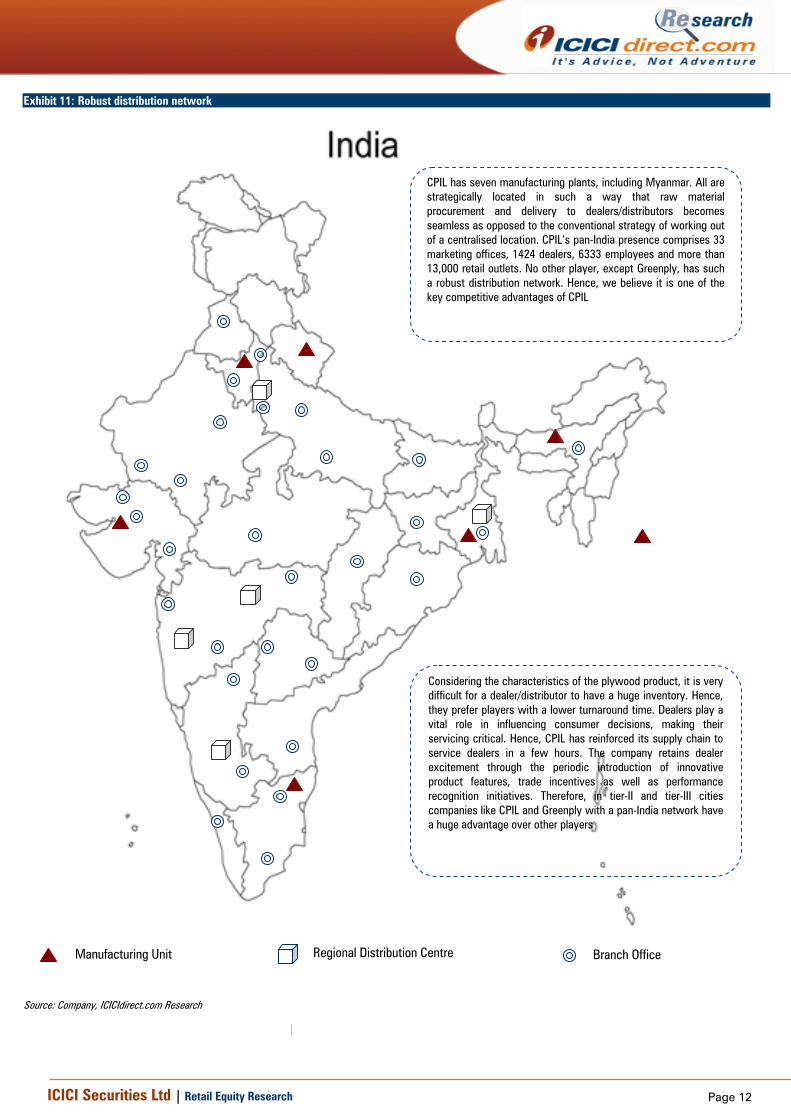
Exhibit 11: Robust distribution network
Source: Company, ICICIdirect.com Research
Manufacturing Unit Regional Distribution Centre Branch Office
CPIL has seven manufacturing plants, including Myanmar. All are strategically located in such a way that raw material procurement and delivery to dealers/distributors becomes seamless as opposed to the conventional strategy of working out of a centralised location. CPIL’s pan-India presence comprises 33 marketing offices, 1424 dealers, 6333 employees and more than 13,000 retail outlets. No other player, except Greenply, has such a robust distribution network. Hence, we believe it is one of the key competitive advantages of CPIL
Considering the characteristics of the plywood product, it is very difficult for a dealer/distributor to have a huge inventory. Hence, they prefer players with a lower turnaround time. Dealers play a vital role in influencing consumer decisions, making their servicing critical. Hence, CPIL has reinforced its supply chain to service dealers in a few hours. The company retains dealer excitement through the periodic introduction of innovative product features, trade incentives as well as performance recognition initiatives. Therefore, in tier-II and tier-III cities companies like CPIL and Greenply with a pan-India network have a huge advantage over other players
Page 13ICICI Securities Ltd | Retail Equity Research
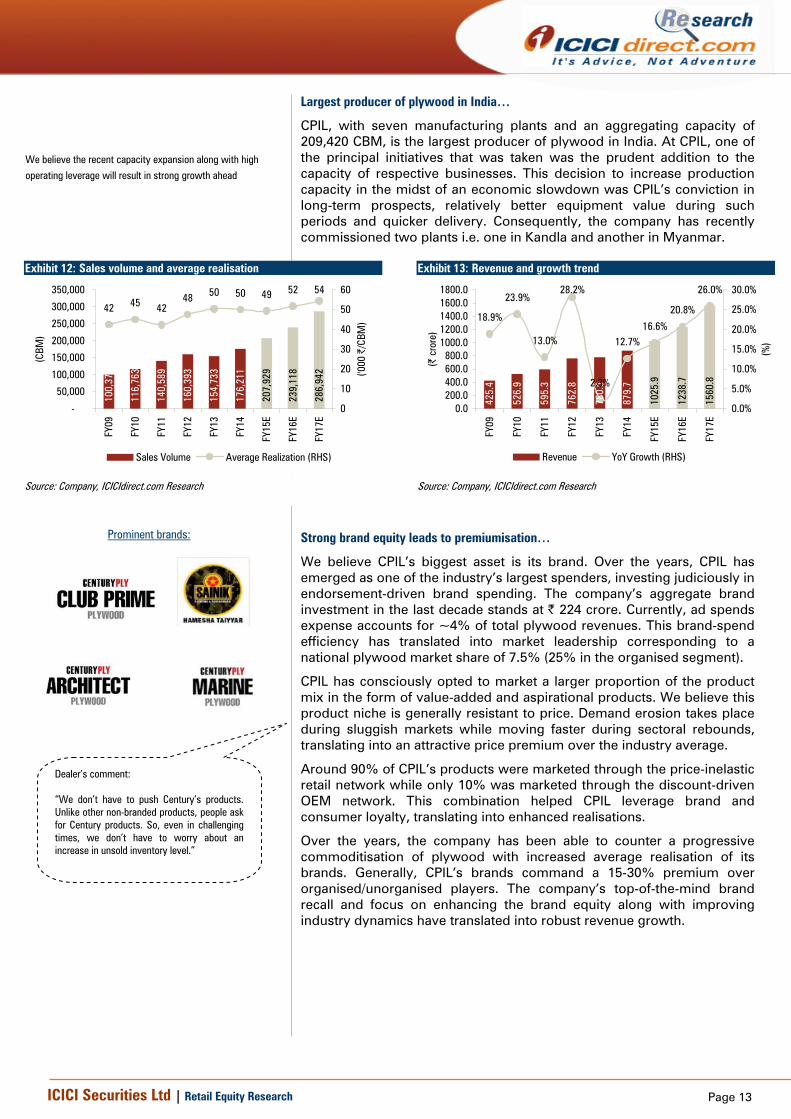
Largest producer of plywood in India…
CPIL, with seven manufacturing plants and an aggregating capacity of 209,420 CBM, is the largest producer of plywood in India. At CPIL, one of the principal initiatives that was taken was the prudent addition to the capacity of respective businesses. This decision to increase production capacity in the midst of an economic slowdown was CPIL’s conviction in long-term prospects, relatively better equipment value during such periods and quicker delivery. Consequently, the company has recently commissioned two plants i.e. one in Kandla and another in Myanmar.
Exhibit 12: Sales volume and average realisation
100,
378
116,
763
140,
589
160,
393
154,
733
176,
211
286,
942
239,
118
207,
929
42 45 4248 50 50 49 52 54
-
50,000
100,000
150,000
200,000
250,000
300,000
350,000
FY09
FY10
FY11
FY12
FY13
FY14
FY15
E
FY16
E
FY17
E
(CBM
)
0
10
20
30
40
50
60
('000
|/C
BM)
Sales Volume Average Realization (RHS)
Source: Company, ICICIdirect.com Research
Exhibit 13: Revenue and growth trend
425.
4
526.
9
595.
3
762.
8
780.
5
879.
7
1560
.8
1238
.7
1025
.9
18.9%
23.9%
13.0%
28.2%
2.3%
12.7%16.6%
20.8%
26.0%
0.0200.0400.0600.0800.0
1000.01200.01400.01600.01800.0
FY09
FY10
FY11
FY12
FY13
FY14
FY15
E
FY16
E
FY17
E
(| c
rore
)
0.0%
5.0%
10.0%
15.0%
20.0%
25.0%
30.0%
(%)
Revenue YoY Growth (RHS)
Source: Company, ICICIdirect.com Research
Strong brand equity leads to premiumisation…
We believe CPIL’s biggest asset is its brand. Over the years, CPIL has emerged as one of the industry’s largest spenders, investing judiciously in endorsement-driven brand spending. The company’s aggregate brand investment in the last decade stands at | 224 crore. Currently, ad spends expense accounts for ~4% of total plywood revenues. This brand-spend efficiency has translated into market leadership corresponding to a national plywood market share of 7.5% (25% in the organised segment).
CPIL has consciously opted to market a larger proportion of the product mix in the form of value-added and aspirational products. We believe this product niche is generally resistant to price. Demand erosion takes place during sluggish markets while moving faster during sectoral rebounds, translating into an attractive price premium over the industry average.
Around 90% of CPIL’s products were marketed through the price-inelastic retail network while only 10% was marketed through the discount-driven OEM network. This combination helped CPIL leverage brand and consumer loyalty, translating into enhanced realisations.
Over the years, the company has been able to counter a progressive commoditisation of plywood with increased average realisation of its brands. Generally, CPIL’s brands command a 15-30% premium over organised/unorganised players. The company’s top-of-the-mind brand recall and focus on enhancing the brand equity along with improving industry dynamics have translated into robust revenue growth.
We believe the recent capacity expansion along with high operating leverage will result in strong growth ahead
Prominent brands:
Dealer’s comment: “We don’t have to push Century’s products. Unlike other non-branded products, people ask for Century products. So, even in challenging times, we don’t have to worry about an increase in unsold inventory level.”
Page 14ICICI Securities Ltd | Retail Equity Research
Century’s laminate segment…healthy support to plywood segment…
Well poised in terms of capacity…
At a very early stage, CPIL recognised the need to cater to customers with a growing supply of varied interior products. Hence, the company extended from manufacture of plywood to laminates, decorative veneers etc. facilitating cross sale, superior leverage of existing brand and a better use of a robust dealer network. Recently, CPIL has augmented its laminate capacity from 2.4 to 4.8 million sheets, making it the third largest producer of laminates in India. The company is continuously making efforts to widen its product offering in the laminate segment, which can be seen from an increase in stock keeping units (SKU) to 700 in FY14 and expects to add 100 every year. Consequently, a wide product choice has made it possible to address varied consumer preference across different states and locations through regional distribution centres. This has resulted in a consumer pull strategy instead of a product push strategy. As a result, leadership in the plywood segment translated to a position as one of the leading players in the laminates segment, validating the multi-product strategy.
After creating a strong brand recall in plywood and leveraging it, going ahead, CPIL would now be focusing on the laminate segment through aggressive brand spending. Going ahead, we expect enhanced capacity and branding to lead to an increase in market share and, in turn, robust revenue growth. Operating leverage would lead to an increase in margins and, in turn, higher profitability.
Exhibit 14: Capacity and utilisation trend
2.4
2.4
2.4
2.4
3.6
4.8
81.4%75.2%
87.1%98.9%
78.1%
61.5%
0
1
2
3
4
5
6
FY09 FY10 FY11 FY12 FY13 FY14
(Milli
on S
heet
s)
0.0%
20.0%
40.0%
60.0%
80.0%
100.0%
120.0%
(%)
Capacity Utilization (RHS)
Source: Company, ICICIdirect.com Research
Exhibit 15: Market share
Greenply30%
Merino27%
Century Plyboard
10%
Royal Touch7%
Rushil Décor7%
Others19%
Source: Company, ICICIdirect.com Research
Exhibit 16: Sales volume and average realisation trend
2.0
1.8
2.1
2.4
2.7
2.9
4.6
4.0
3.5
522573 556
627 667 693 728 764 802
0.0
1.0
2.0
3.0
4.0
5.0
FY09
FY10
FY11
FY12
FY13
FY14
FY15
E
FY16
E
FY17
E
(milli
on s
heet
s)
0
150
300
450
600
750
900
(|/s
heet
)
Sales Volume Average Realization
Source: Company, ICICIdirect.com Research
Exhibit 17: Revenue and growth trend
106.
3
104.
5
117.
1
153.
3
180.
0
202.
1
371.
2
307.
4
254.
6
17.2%
-1.6%
12.0%
31.0%
17.4%12.3%
26.0%20.8% 20.8%
0.050.0
100.0150.0200.0250.0300.0350.0400.0
FY09
FY10
FY11
FY12
FY13
FY14
FY15
E
FY16
E
FY17
E
(| c
rore
)
-5.0%0.0%5.0%10.0%15.0%20.0%25.0%30.0%35.0%
(%)
Revenue YoY Growth (RHS)[
Source: Company, ICICIdirect.com Research
Prominent brands:
Page 15ICICI Securities Ltd | Retail Equity Research
Prudent utilisation of cash flows…
CPIL has been utilising cash flows prudently to incubate businesses with long-term potential. This finds credence in the fact that even when CPIL was initially engaged in the business of plywood manufacture, it leveraged its available cash flows in the business of cement, ferro alloys (both demerged now) and container freight station (within the company). The objective was to invest in these incubated businesses for the long-term, grow the business and de-merge after creating business value.
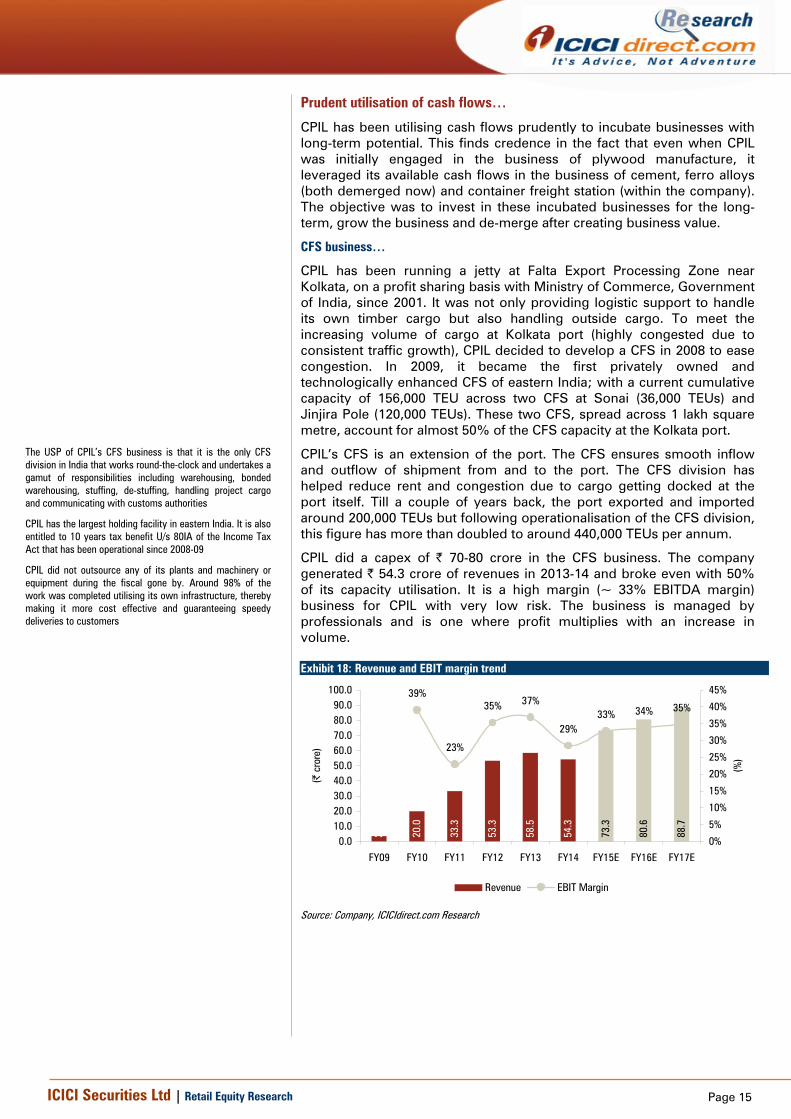
CFS business…
CPIL has been running a jetty at Falta Export Processing Zone near Kolkata, on a profit sharing basis with Ministry of Commerce, Government of India, since 2001. It was not only providing logistic support to handle its own timber cargo but also handling outside cargo. To meet the increasing volume of cargo at Kolkata port (highly congested due to consistent traffic growth), CPIL decided to develop a CFS in 2008 to ease congestion. In 2009, it became the first privately owned and technologically enhanced CFS of eastern India; with a current cumulative capacity of 156,000 TEU across two CFS at Sonai (36,000 TEUs) and Jinjira Pole (120,000 TEUs). These two CFS, spread across 1 lakh square metre, account for almost 50% of the CFS capacity at the Kolkata port.
CPIL’s CFS is an extension of the port. The CFS ensures smooth inflow and outflow of shipment from and to the port. The CFS division has helped reduce rent and congestion due to cargo getting docked at the port itself. Till a couple of years back, the port exported and imported around 200,000 TEUs but following operationalisation of the CFS division, this figure has more than doubled to around 440,000 TEUs per annum.
CPIL did a capex of | 70-80 crore in the CFS business. The company generated | 54.3 crore of revenues in 2013-14 and broke even with 50% of its capacity utilisation. It is a high margin (~ 33% EBITDA margin) business for CPIL with very low risk. The business is managed by professionals and is one where profit multiplies with an increase in volume. Exhibit 18: Revenue and EBIT margin trend
3.5
20.0
33.3
53.3
58.5
54.3
88.7
80.6
73.3
39%
23%
35% 37%
29%33% 34% 35%
0.010.020.030.040.050.060.070.080.090.0
100.0
FY09 FY10 FY11 FY12 FY13 FY14 FY15E FY16E FY17E
(| c
rore
)
0%
5%
10%
15%
20%
25%
30%
35%
40%
45%
(%)
Revenue EBIT Margin
Source: Company, ICICIdirect.com Research
The USP of CPIL’s CFS business is that it is the only CFS division in India that works round-the-clock and undertakes a gamut of responsibilities including warehousing, bonded warehousing, stuffing, de-stuffing, handling project cargo and communicating with customs authorities
CPIL has the largest holding facility in eastern India. It is also entitled to 10 years tax benefit U/s 80IA of the Income Tax Act that has been operational since 2008-09
CPIL did not outsource any of its plants and machinery or equipment during the fiscal gone by. Around 98% of the work was completed utilising its own infrastructure, thereby making it more cost effective and guaranteeing speedy deliveries to customers
Page 16ICICI Securities Ltd | Retail Equity Research
Nesta: Readymade furniture business…
On the lines of the company’s vision to utilise free cash flow prudently into a value creating business, CPIL entered the readymade furniture trading business in 2012 with two pilot retail showrooms in Kolkata and Bangalore. Based on experience and research, the company decided to foray into the modular kitchen business and expanded this business through the franchisee model. CPIL has already signed more than 20 franchisees and is planning to commence 16 stores by FY15. According to the management, the modular kitchen market in India is at a very nascent stage with a size of | 1200 crore (in 2012) and has the potential to grow to | 6000 crore by 2016. CPIL’s USP in modular kitchens is that water proof plywood is used in modular kitchens whereas all other modular kitchens available in India have durability issues as they are made of MDF like material. Going ahead, we expect this business to contribute significantly to CPIL’s topline and bottomline.
Structural change in borrowings…Big positive going ahead… CPIL used to import raw timber from Myanmar substantially. Also, the company was largely using buyer’s credit facility instead of hedging its forex position as it believed the cost of hedging was higher than the cost of buyer’s credit. Buyer’s credit carries interest @ Libor plus 0.4% to 1.5% and is repayable in 60-365 days as per annual report FY14. However, due to significant INR depreciation last year, the company had to book losses of ~| 44 crore, which impacted its bottomline radically.
Exhibit 19: Sample working of buyer’s credit
Payment to exporter 100$ Current exchange rate | 60 per USD
Payable to exporter after 1 year 100$ Payable to bank after 1 year | 6000
Case I: INR depreciates @5% Case II: INR depreciates @10%
Exchange rate | 63 per USD Exchange rate | 66 per USD
Payable to exporter | 6489 Payable to exporter | 6798
Benefit | 111 Benefit - | 198
In case of opting for buyer's credit In case of hedging
Source: Company, ICICIdirect.com Research
CPIL used to follow this strategy rather than hedging before April 1, 2014
In case the INR depreciates more than or equal to cost of hedging, then CPIL has to take the hit, which is shown in case II. On account of this, in FY14, CPIL has to book losses worth | 44 crore
Page 17ICICI Securities Ltd | Retail Equity Research
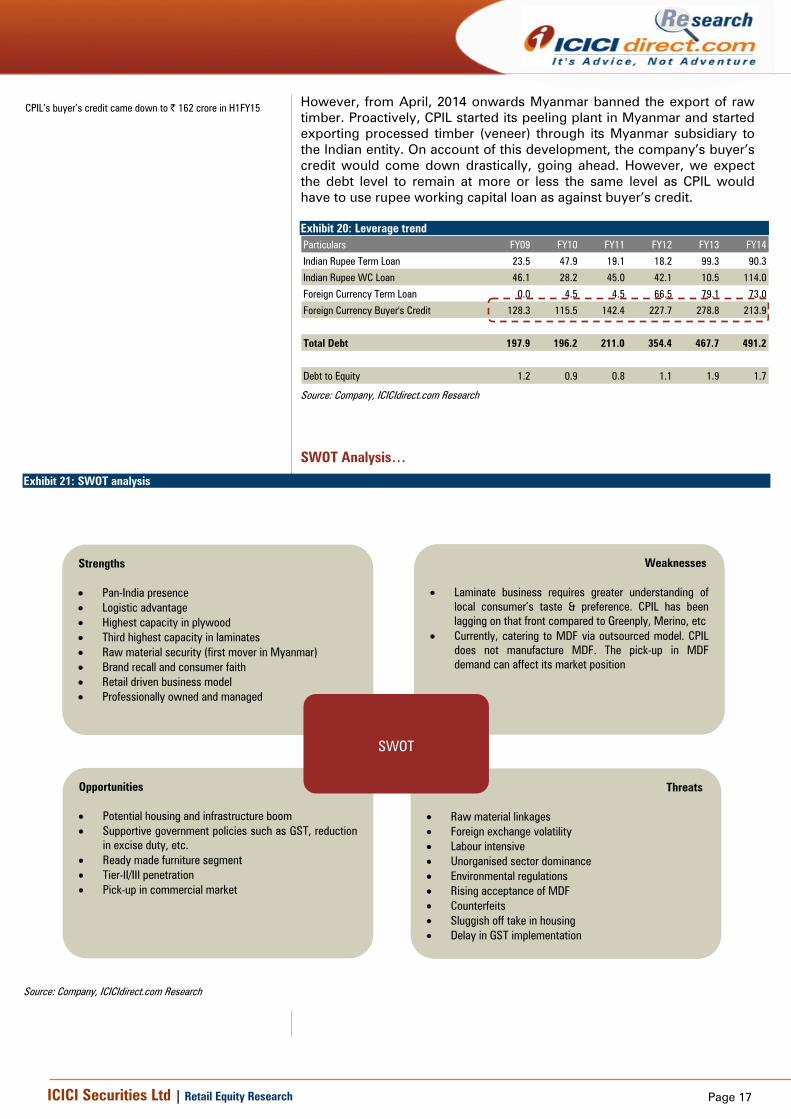
However, from April, 2014 onwards Myanmar banned the export of raw timber. Proactively, CPIL started its peeling plant in Myanmar and started exporting processed timber (veneer) through its Myanmar subsidiary to the Indian entity. On account of this development, the company’s buyer’s credit would come down drastically, going ahead. However, we expect the debt level to remain at more or less the same level as CPIL would have to use rupee working capital loan as against buyer’s credit. Exhibit 20: Leverage trend Particulars FY09 FY10 FY11 FY12 FY13 FY14
Indian Rupee Term Loan 23.5 47.9 19.1 18.2 99.3 90.3
Indian Rupee WC Loan 46.1 28.2 45.0 42.1 10.5 114.0
Foreign Currency Term Loan 0.0 4.5 4.5 66.5 79.1 73.0
Exhibit 21: SWOT analysis Source: Company, ICICIdirect.com Research
CPIL’s buyer’s credit came down to | 162 crore in H1FY15
Strengths • Pan-India presence • Logistic advantage • Highest capacity in plywood • Third highest capacity in laminates • Raw material security (first mover in Myanmar) • Brand recall and consumer faith • Retail driven business model • Professionally owned and managed
Weaknesses • Laminate business requires greater understanding of
local consumer’s taste & preference. CPIL has been lagging on that front compared to Greenply, Merino, etc
• Currently, catering to MDF via outsourced model. CPIL does not manufacture MDF. The pick-up in MDF demand can affect its market position
Opportunities • Potential housing and infrastructure boom • Supportive government policies such as GST, reduction
in excise duty, etc. • Ready made furniture segment • Tier-II/III penetration • Pick-up in commercial market
T Threats • Raw material linkages • Foreign exchange volatility • Labour intensive • Unorganised sector dominance • Environmental regulations • Rising acceptance of MDF • Counterfeits • Sluggish off take in housing • Delay in GST implementation
SWOT
Page 18ICICI Securities Ltd | Retail Equity Research
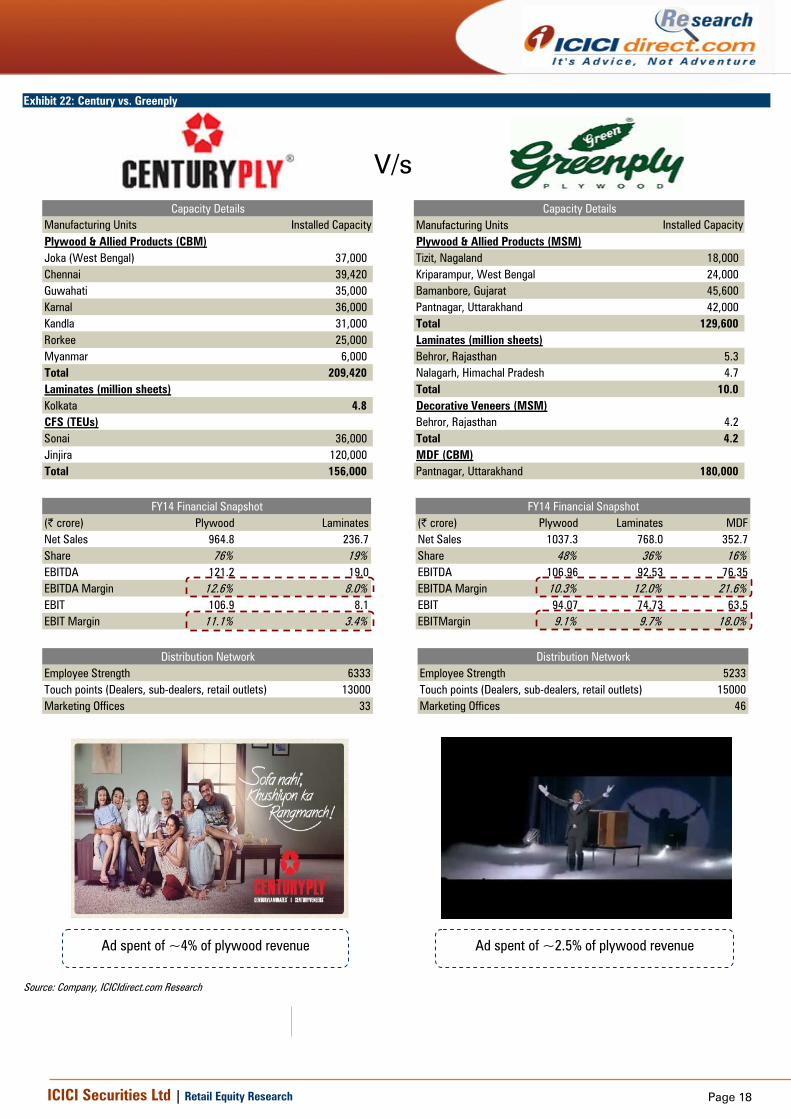
Exhibit 22: Century vs. Greenply
Manufacturing Units Installed CapacityPlywood & Allied Products (CBM)Joka (West Bengal) 37,000 Chennai 39,420 Guwahati 35,000 Karnal 36,000 Kandla 31,000 Rorkee 25,000 Myanmar 6,000 Total 209,420 Laminates (million sheets)Kolkata 4.8 CFS (TEUs)Sonai 36,000 Jinjira 120,000 Total 156,000
Capacity Details
Manufacturing Units Installed CapacityPlywood & Allied Products (MSM)Tizit, Nagaland 18,000 Kriparampur, West Bengal 24,000 Bamanbore, Gujarat 45,600 Pantnagar, Uttarakhand 42,000 Total 129,600 Laminates (million sheets)Behror, Rajasthan 5.3 Nalagarh, Himachal Pradesh 4.7 Total 10.0 Decorative Veneers (MSM)Behror, Rajasthan 4.2 Total 4.2 MDF (CBM)Pantnagar, Uttarakhand 180,000
Page 21ICICI Securities Ltd | Retail Equity Research
Exhibit 25: Quantitative analysis
8270
110
148
57 61
85
54 51
21
58
85 9278
118
73
129
72
122
129
020406080
100120140160180200
Century Ply Greenply Archidply Sarda Uniply
(Day
s)
Inventory Days Debtors Days Creditors Days WC Days
CPIL classifies buyer's credit in short term borrowings. Hence, creditor days are seen at 21 else it would have been 78
1.78
1.24
0.52
2.02
3.31
0
0.5
1
1.5
2
2.5
3
3.5
Century Ply Greenply Archidply Sarda Uniply
(x)
D/E
2.26
3.44
1.41
-0.51
0.39
-1-0.5
00.5
11.5
22.5
33.5
4
Century Ply Greenply Archidply Sarda Uniply
(x)
Interest Cover Ratio
Source: Company, ICICIdirect.com Research
Exhibit 26: Reach vs. pricing
Source: CICIdirect.com Research
Reach
Low Pan-India
Premium
Low-cost Pricing
Page 22ICICI Securities Ltd | Retail Equity Research
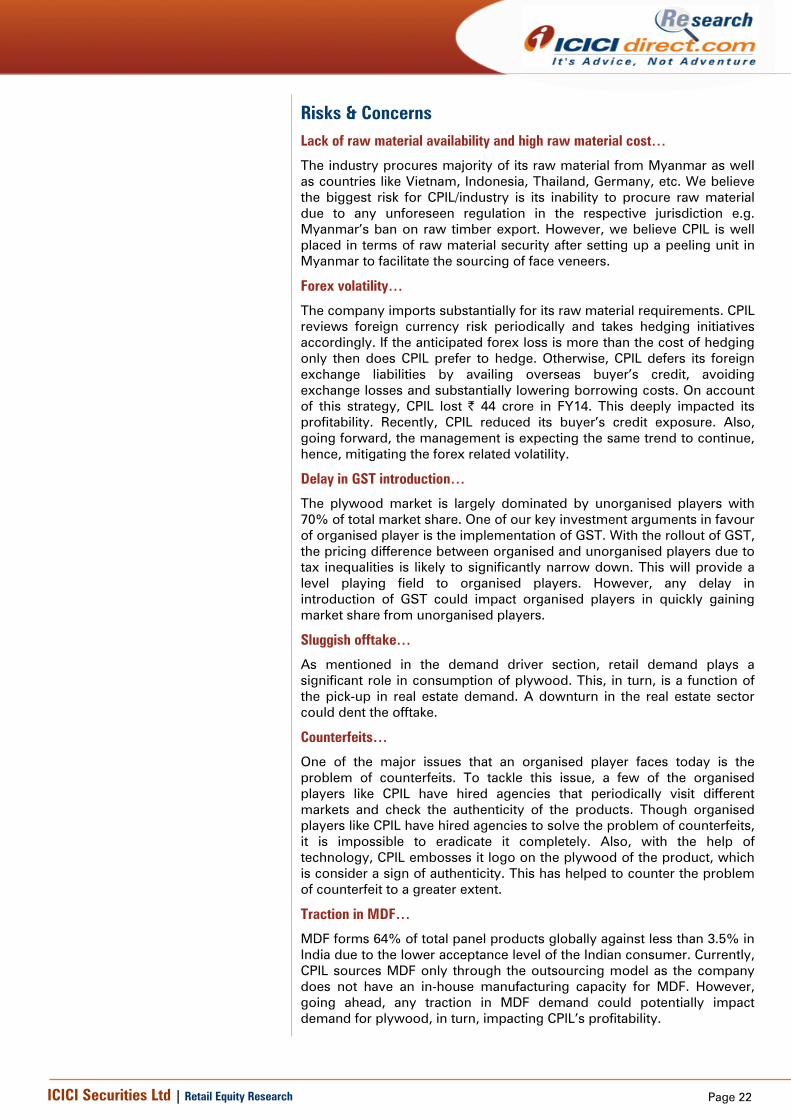
Risks & Concerns Lack of raw material availability and high raw material cost…
The industry procures majority of its raw material from Myanmar as well as countries like Vietnam, Indonesia, Thailand, Germany, etc. We believe the biggest risk for CPIL/industry is its inability to procure raw material due to any unforeseen regulation in the respective jurisdiction e.g. Myanmar’s ban on raw timber export. However, we believe CPIL is well placed in terms of raw material security after setting up a peeling unit in Myanmar to facilitate the sourcing of face veneers.
Forex volatility…
The company imports substantially for its raw material requirements. CPIL reviews foreign currency risk periodically and takes hedging initiatives accordingly. If the anticipated forex loss is more than the cost of hedging only then does CPIL prefer to hedge. Otherwise, CPIL defers its foreign exchange liabilities by availing overseas buyer’s credit, avoiding exchange losses and substantially lowering borrowing costs. On account of this strategy, CPIL lost | 44 crore in FY14. This deeply impacted its profitability. Recently, CPIL reduced its buyer’s credit exposure. Also, going forward, the management is expecting the same trend to continue, hence, mitigating the forex related volatility.
Delay in GST introduction…
The plywood market is largely dominated by unorganised players with 70% of total market share. One of our key investment arguments in favour of organised player is the implementation of GST. With the rollout of GST, the pricing difference between organised and unorganised players due to tax inequalities is likely to significantly narrow down. This will provide a level playing field to organised players. However, any delay in introduction of GST could impact organised players in quickly gaining market share from unorganised players.
Sluggish offtake…
As mentioned in the demand driver section, retail demand plays a significant role in consumption of plywood. This, in turn, is a function of the pick-up in real estate demand. A downturn in the real estate sector could dent the offtake.
Counterfeits…
One of the major issues that an organised player faces today is the problem of counterfeits. To tackle this issue, a few of the organised players like CPIL have hired agencies that periodically visit different markets and check the authenticity of the products. Though organised players like CPIL have hired agencies to solve the problem of counterfeits, it is impossible to eradicate it completely. Also, with the help of technology, CPIL embosses it logo on the plywood of the product, which is consider a sign of authenticity. This has helped to counter the problem of counterfeit to a greater extent.
Traction in MDF…
MDF forms 64% of total panel products globally against less than 3.5% in India due to the lower acceptance level of the Indian consumer. Currently, CPIL sources MDF only through the outsourcing model as the company does not have an in-house manufacturing capacity for MDF. However, going ahead, any traction in MDF demand could potentially impact demand for plywood, in turn, impacting CPIL’s profitability.
Page 23ICICI Securities Ltd | Retail Equity Research
Financials Revenues to grow at 21.4% CAGR during FY14-17E…
On the basis of our demand drivers, we expect the plywood and panel industry to grow at a decent rate. With the structural shift in the industry, we believe CPIL would be a key beneficiary, going ahead. CPIL’s strong brand equity, raw material security and robust distribution network would give a significant boost to its revenues in the coming years. The company has been able to counter a progressive commoditisation of plywood with increased realisation of its well established brands. Hence, CPIL’s products command 15-30% premium over other products. Consequently, we estimate CPIL’s revenue will grow at 21.4% CAGR to | 2488.7 crore during FY14-17E.
EBIT margin expected to expand on back of operating leverage…
CPIL’s prudent strategy to augment the capacity in both plywood and laminates in challenging times for the business would benefit in times of rebound. The plywood division and laminate division were operating at ~72% and 65% of their respective capacities. Hence, going ahead, we expect operating leverage to play out well for CPIL. Consequently, EBIT is expected to grow at 38.0% CAGR to | 327.1 crore during FY14-17E. We expect the EBIT margin to expand to 14.2% in FY17E from 9.7% in FY14.
We expect revenues to witness robust growth of 21.4% CAGR to | 2488.7 crore during FY14-17E
We expect an EBIT margin expansion by 450 bps to 14.2% in FY17E. Consequently, EBIT is expected to grow at 38.0% CAGR to | 327.1crore during FY14-17E
Page 24ICICI Securities Ltd | Retail Equity Research
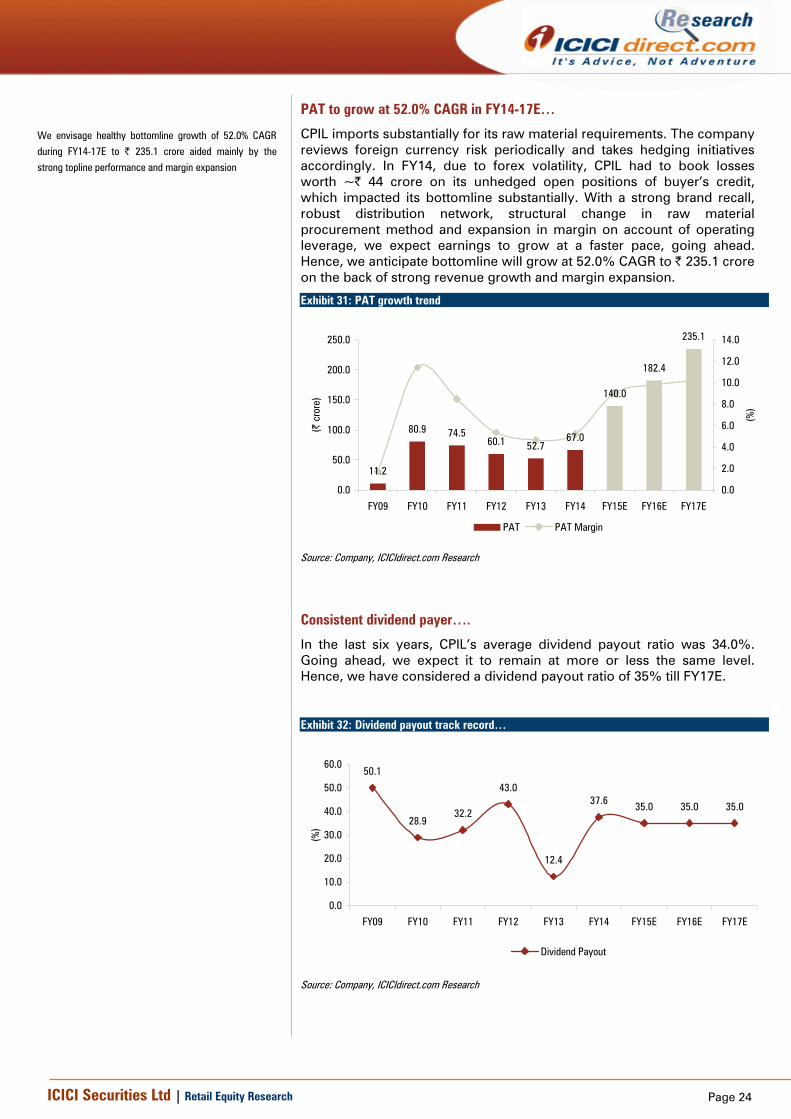
PAT to grow at 52.0% CAGR in FY14-17E…
CPIL imports substantially for its raw material requirements. The company reviews foreign currency risk periodically and takes hedging initiatives accordingly. In FY14, due to forex volatility, CPIL had to book losses worth ~| 44 crore on its unhedged open positions of buyer’s credit, which impacted its bottomline substantially. With a strong brand recall, robust distribution network, structural change in raw material procurement method and expansion in margin on account of operating leverage, we expect earnings to grow at a faster pace, going ahead. Hence, we anticipate bottomline will grow at 52.0% CAGR to | 235.1 crore on the back of strong revenue growth and margin expansion.
Exhibit 31: PAT growth trend
11.2
80.9 74.560.1 52.7
67.0
140.0
182.4
235.1
0.0
50.0
100.0
150.0
200.0
250.0
FY09 FY10 FY11 FY12 FY13 FY14 FY15E FY16E FY17E
(| c
rore
)
0.0
2.0
4.0
6.0
8.0
10.0
12.0
14.0
(%)
PAT PAT Margin
Source: Company, ICICIdirect.com Research
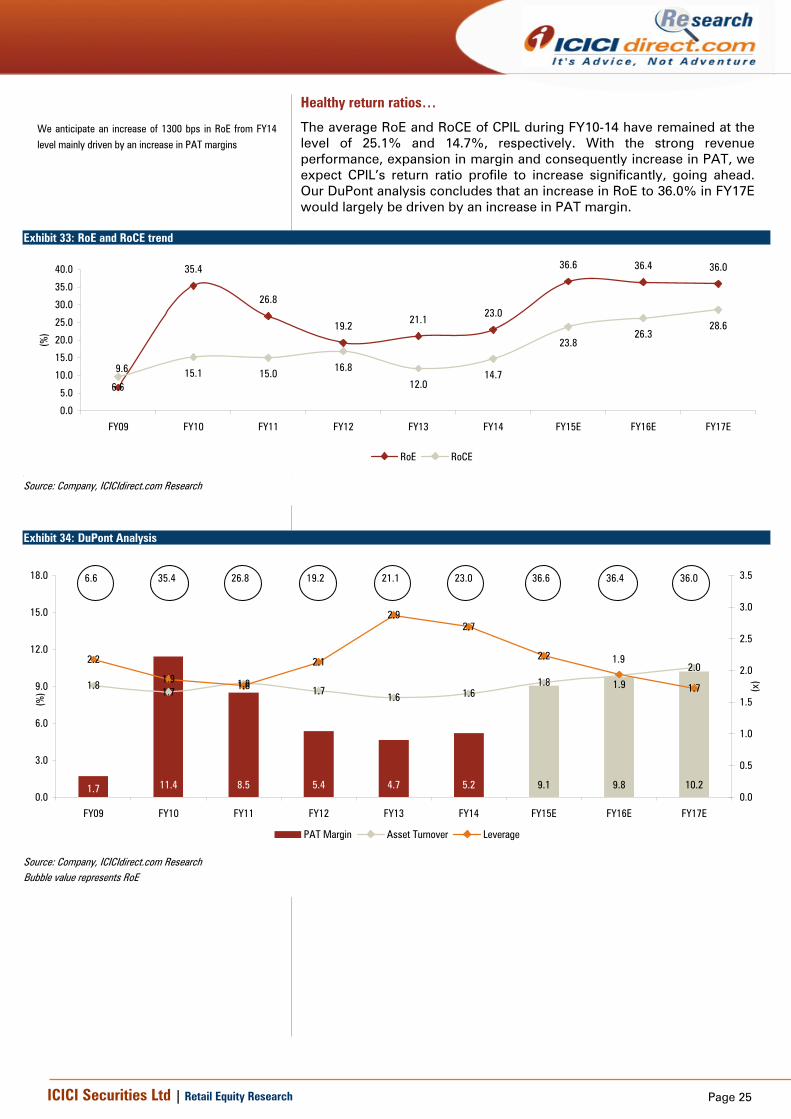
Consistent dividend payer….
In the last six years, CPIL’s average dividend payout ratio was 34.0%. Going ahead, we expect it to remain at more or less the same level. Hence, we have considered a dividend payout ratio of 35% till FY17E.
Exhibit 32: Dividend payout track record…
50.1
28.932.2
43.0
12.4
37.6 35.0 35.0 35.0
0.0
10.0
20.0
30.0
40.0
50.0
60.0
FY09 FY10 FY11 FY12 FY13 FY14 FY15E FY16E FY17E
(%)
Dividend Payout
Source: Company, ICICIdirect.com Research
We envisage healthy bottomline growth of 52.0% CAGR during FY14-17E to | 235.1 crore aided mainly by the strong topline performance and margin expansion
Page 25ICICI Securities Ltd | Retail Equity Research
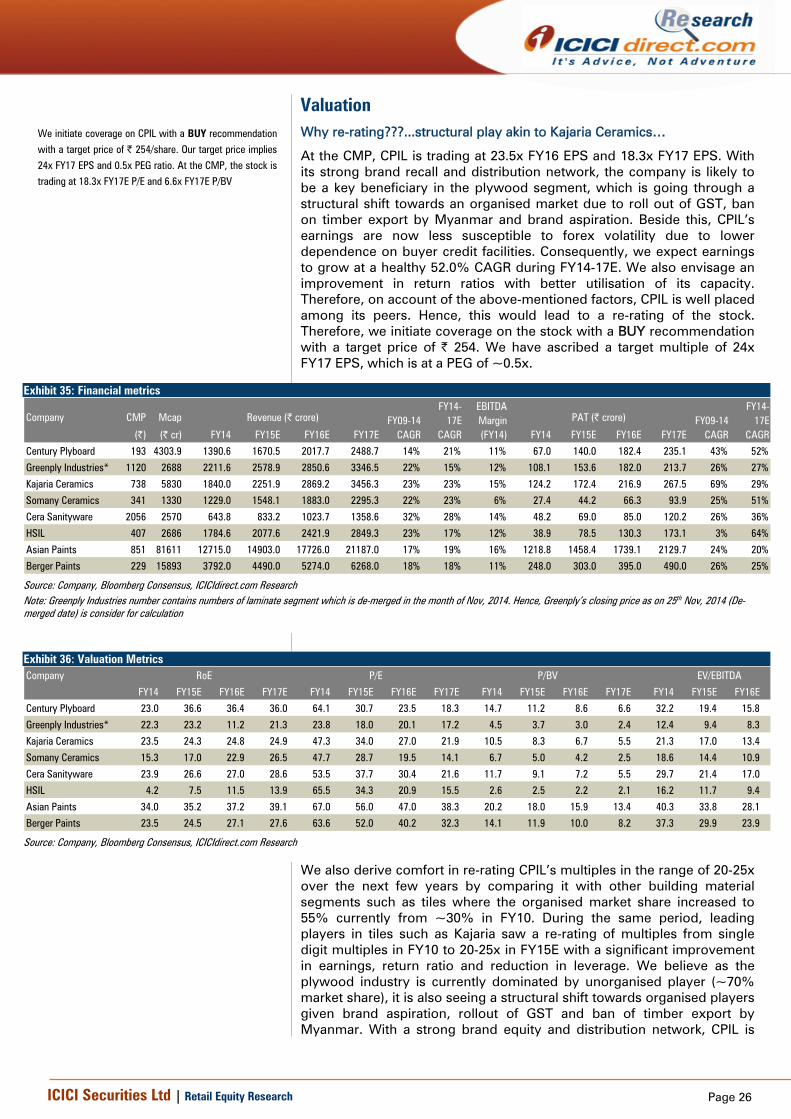
Healthy return ratios…
The average RoE and RoCE of CPIL during FY10-14 have remained at the level of 25.1% and 14.7%, respectively. With the strong revenue performance, expansion in margin and consequently increase in PAT, we expect CPIL’s return ratio profile to increase significantly, going ahead. Our DuPont analysis concludes that an increase in RoE to 36.0% in FY17E would largely be driven by an increase in PAT margin.
Exhibit 33: RoE and RoCE trend
35.4
26.8
19.221.1
23.0
36.6 36.4 36.0
15.1 15.0 16.8
12.014.7
23.826.3
28.6
6.6
9.6
0.0
5.0
10.0
15.0
20.0
25.0
30.0
35.0
40.0
FY09 FY10 FY11 FY12 FY13 FY14 FY15E FY16E FY17E
(%)
RoE RoCE[
Source: Company, ICICIdirect.com Research
Exhibit 34: DuPont Analysis
11.4 8.5 5.4 4.7 5.2 10.29.89.11.7
1.81.7
1.81.7
1.6 1.61.8
2.02.2
1.91.8
2.1
2.92.7
2.2
1.71.9
1.9
0.0
3.0
6.0
9.0
12.0
15.0
18.0
FY09 FY10 FY11 FY12 FY13 FY14 FY15E FY16E FY17E
(%)
0.0
0.5
1.0
1.5
2.0
2.5
3.0
3.5
(x)
PAT Margin Asset Turnover Leverage
35.46.6 26.8 19.2 23.0 36.6 36.4 36.021.1
Source: Company, ICICIdirect.com Research Bubble value represents RoE
We anticipate an increase of 1300 bps in RoE from FY14 level mainly driven by an increase in PAT margins
Page 26ICICI Securities Ltd | Retail Equity Research
Valuation Why re-rating???...structural play akin to Kajaria Ceramics…
At the CMP, CPIL is trading at 23.5x FY16 EPS and 18.3x FY17 EPS. With its strong brand recall and distribution network, the company is likely to be a key beneficiary in the plywood segment, which is going through a structural shift towards an organised market due to roll out of GST, ban on timber export by Myanmar and brand aspiration. Beside this, CPIL’s earnings are now less susceptible to forex volatility due to lower dependence on buyer credit facilities. Consequently, we expect earnings to grow at a healthy 52.0% CAGR during FY14-17E. We also envisage an improvement in return ratios with better utilisation of its capacity. Therefore, on account of the above-mentioned factors, CPIL is well placed among its peers. Hence, this would lead to a re-rating of the stock. Therefore, we initiate coverage on the stock with a BUY recommendation with a target price of | 254. We have ascribed a target multiple of 24x FY17 EPS, which is at a PEG of ~0.5x.
Source: Company, Bloomberg Consensus, ICICIdirect.com Research Note: Greenply Industries number contains numbers of laminate segment which is de-merged in the month of Nov, 2014. Hence, Greenply’s closing price as on 25th Nov, 2014 (De-merged date) is consider for calculation
Source: Company, Bloomberg Consensus, ICICIdirect.com Research
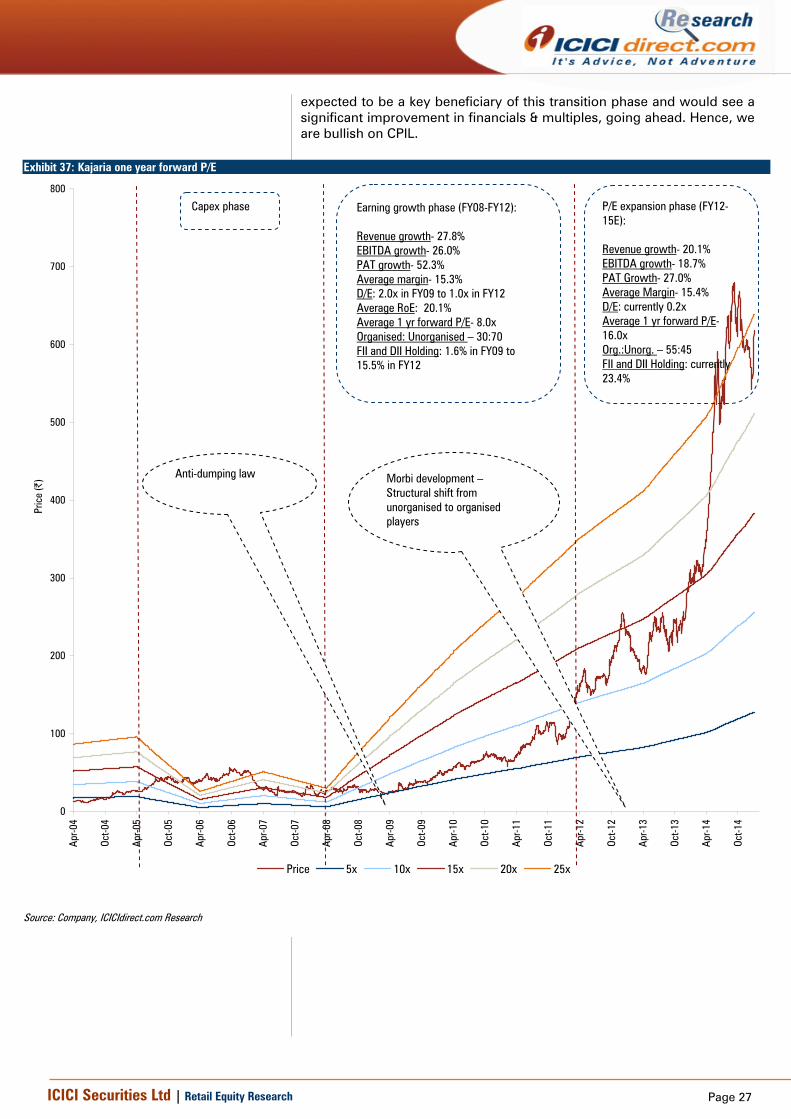
We also derive comfort in re-rating CPIL’s multiples in the range of 20-25x over the next few years by comparing it with other building material segments such as tiles where the organised market share increased to 55% currently from ~30% in FY10. During the same period, leading players in tiles such as Kajaria saw a re-rating of multiples from single digit multiples in FY10 to 20-25x in FY15E with a significant improvement in earnings, return ratio and reduction in leverage. We believe as the plywood industry is currently dominated by unorganised player (~70% market share), it is also seeing a structural shift towards organised players given brand aspiration, rollout of GST and ban of timber export by Myanmar. With a strong brand equity and distribution network, CPIL is
We initiate coverage on CPIL with a BUY recommendation with a target price of | 254/share. Our target price implies 24x FY17 EPS and 0.5x PEG ratio. At the CMP, the stock is trading at 18.3x FY17E P/E and 6.6x FY17E P/BV
Page 27ICICI Securities Ltd | Retail Equity Research
expected to be a key beneficiary of this transition phase and would see a significant improvement in financials & multiples, going ahead. Hence, we are bullish on CPIL.
Exhibit 37: Kajaria one year forward P/E
0
100
200
300
400
500
600
700
800
Apr-0
4
Oct-0
4
Apr-0
5
Oct-0
5
Apr-0
6
Oct-0
6
Apr-0
7
Oct-0
7
Apr-0
8
Oct-0
8
Apr-0
9
Oct-0
9
Apr-1
0
Oct-1
0
Apr-1
1
Oct-1
1
Apr-1
2
Oct-1
2
Apr-1
3
Oct-1
3
Apr-1
4
Oct-1
4
Pric
e (|
)
Price 5x 10x 15x 20x 25x
Source: Company, ICICIdirect.com Research
Capex phase
Earning growth phase (FY08-FY12): Revenue growth- 27.8% EBITDA growth- 26.0% PAT growth- 52.3% Average margin- 15.3% D/E: 2.0x in FY09 to 1.0x in FY12 Average RoE: 20.1% Average 1 yr forward P/E- 8.0x Organised: Unorganised – 30:70 FII and DII Holding: 1.6% in FY09 to 15.5% in FY12
P/E expansion phase (FY12-15E): Revenue growth- 20.1% EBITDA growth- 18.7% PAT Growth- 27.0% Average Margin- 15.4% D/E: currently 0.2x Average 1 yr forward P/E- 16.0x Org.:Unorg. – 55:45 FII and DII Holding: currently 23.4%
Morbi development – Structural shift from unorganised to organised players
Anti-dumping law
Page 28ICICI Securities Ltd | Retail Equity Research
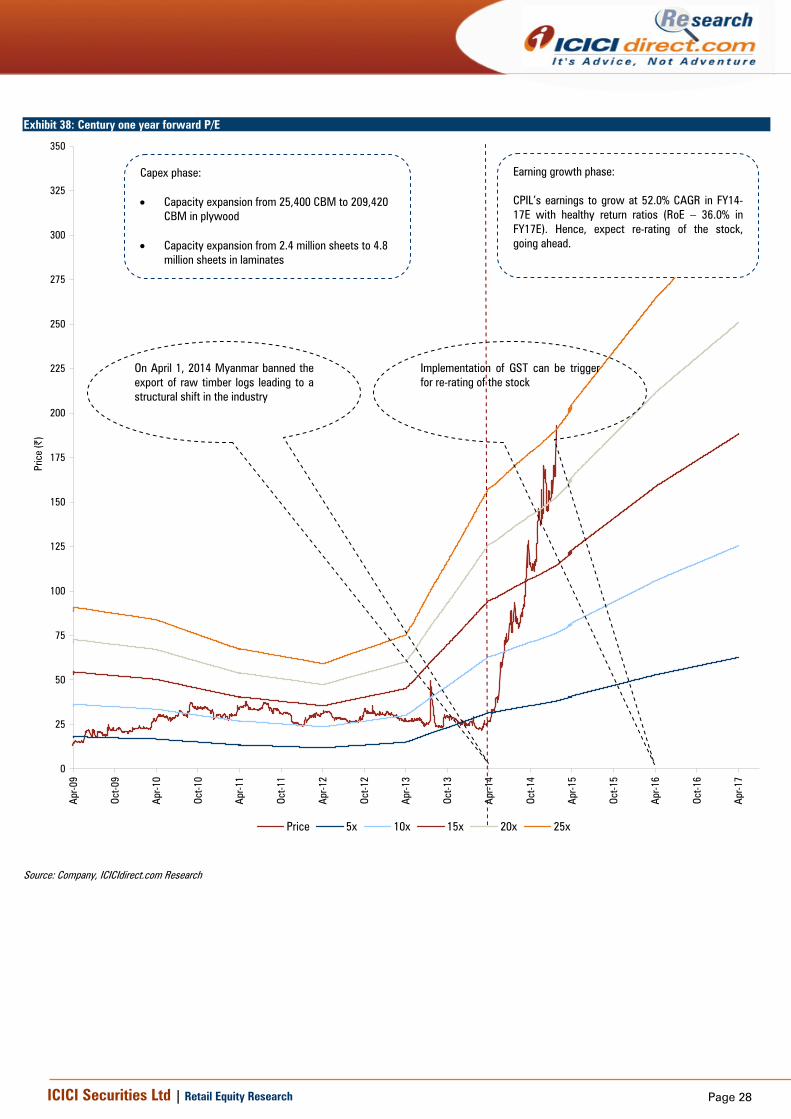
Exhibit 38: Century one year forward P/E
0
25
50
75
100
125
150
175
200
225
250
275
300
325
350
Apr-0
9
Oct-0
9
Apr-1
0
Oct-1
0
Apr-1
1
Oct-1
1
Apr-1
2
Oct-1
2
Apr-1
3
Oct-1
3
Apr-1
4
Oct-1
4
Apr-1
5
Oct-1
5
Apr-1
6
Oct-1
6
Apr-1
7
Pric
e (|
)
Price 5x 10x 15x 20x 25x
Source: Company, ICICIdirect.com Research
Implementation of GST can be trigger for re-rating of the stock
On April 1, 2014 Myanmar banned the export of raw timber logs leading to a structural shift in the industry
Capex phase: • Capacity expansion from 25,400 CBM to 209,420
CBM in plywood • Capacity expansion from 2.4 million sheets to 4.8
million sheets in laminates
Earning growth phase: CPIL’s earnings to grow at 52.0% CAGR in FY14-17E with healthy return ratios (RoE – 36.0% in FY17E). Hence, expect re-rating of the stock, going ahead.
Page 29ICICI Securities Ltd | Retail Equity Research
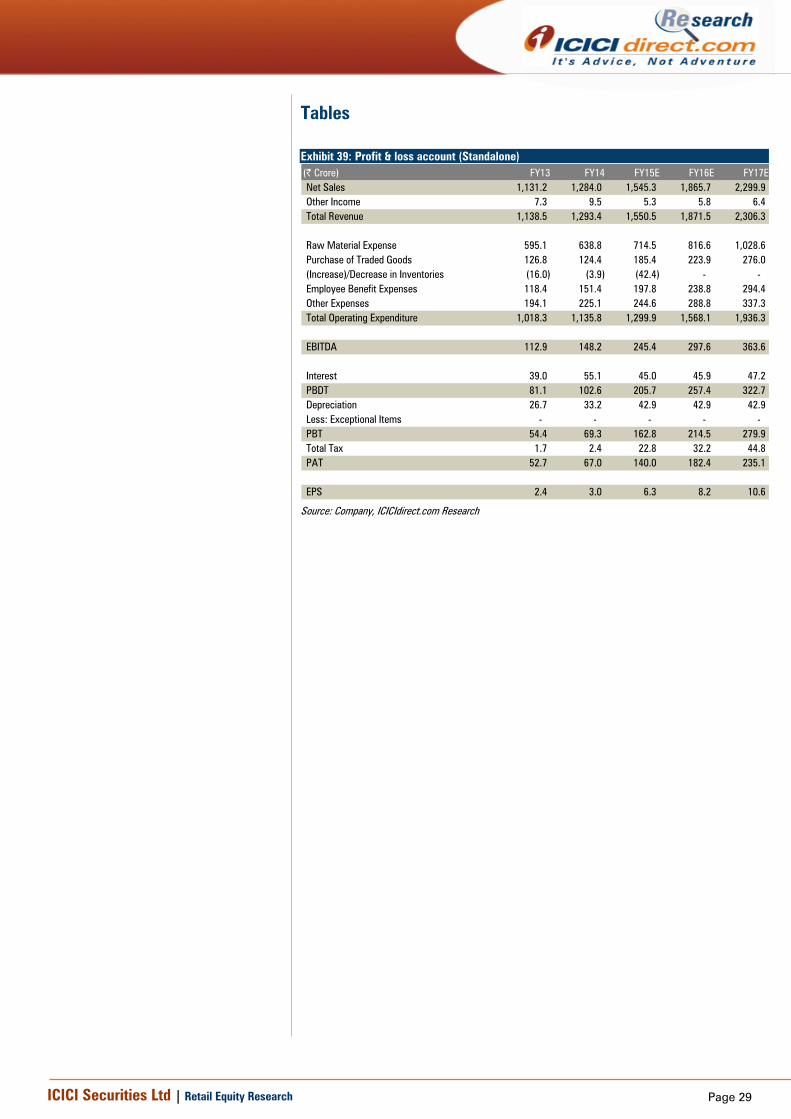
Tables Exhibit 39: Profit & loss account (Standalone) (| Crore) FY13 FY14 FY15E FY16E FY17ENet Sales 1,131.2 1,284.0 1,545.3 1,865.7 2,299.9 Other Income 7.3 9.5 5.3 5.8 6.4 Total Revenue 1,138.5 1,293.4 1,550.5 1,871.5 2,306.3
Raw Material Expense 595.1 638.8 714.5 816.6 1,028.6 Purchase of Traded Goods 126.8 124.4 185.4 223.9 276.0 (Increase)/Decrease in Inventories (16.0) (3.9) (42.4) - - Employee Benefit Expenses 118.4 151.4 197.8 238.8 294.4 Other Expenses 194.1 225.1 244.6 288.8 337.3 Total Operating Expenditure 1,018.3 1,135.8 1,299.9 1,568.1 1,936.3
Net Increase in Current Assets (43.5) (99.3) (79.5) (107.0) (129.6) Net Increase in Current Liabilities 4.8 13.3 6.8 29.0 39.3 Net Cash Flow from Operating Activities 79.7 69.3 155.1 193.1 234.8
Inc/ (Dec) in Deferred Tax Liability 0.2 (0.4) - - - (Purchase)/Sale of Fixed Assets (37.7) (42.3) (41.2) (26.6) (27.2) (Inc)/Dec in Long term loans and advances (23.6) (9.3) (8.4) (15.8) (21.4) (Inc)/Dec in Other Investments 57.7 (22.3) 1.9 - - Proceeds from issues of Equity Shares (0.5) - - - - Net Cash flow from Investing Activities (0.8) (74.1) (47.8) (42.4) (48.6)
Proceeds from issues of Equity Shares (0.5) - - - - One time adj. in P&L Appropriation - - - - - Adj. in General Reserves (96.7) - - - - Dividend and Dividend Tax Paid 116.3 23.4 (22.2) - - Interest Paid (3.0) - - - - Dividend and Dividend Tax Paid (6.5) (25.2) (49.0) (63.8) (82.3) Interest Paid (39.0) (55.1) (45.0) (45.9) (47.2) Net Cash flow from Financing Activities (41.2) (56.9) (116.2) (109.8) (129.5)
Solvency Ratios (x)Current Ratio 4.5 4.3 4.6 4.7 4.7 Quick Ratio 2.7 2.1 2.5 2.7 2.8
Source: Company, ICICIdirect.com Research
Page 33ICICI Securities Ltd | Retail Equity Research
RATING RATIONALE ICICIdirect.com endeavours to provide objective opinions and recommendations. ICICIdirect.com assigns ratings to its stocks according to their notional target price vs. current market price and then categorises them as Strong Buy, Buy, Hold and Sell. The performance horizon is two years unless specified and the notional target price is defined as the analysts' valuation for a stock. Strong Buy: >15%/20% for large caps/midcaps, respectively, with high conviction; Buy: >10%/15% for large caps/midcaps, respectively; Hold: Up to +/-10%; Sell: -10% or more;
Page 34ICICI Securities Ltd | Retail Equity Research
Disclaimer
ANALYST CERTIFICATION We , Deepak Purswani, MBA (Finance), CFA; Nikunj Gala, MBA (Capital Markets) research analysts, authors and the names subscribed to this report, hereby certify that all of the views expressed in this research report accurately reflect our views about the subject issuer(s) or securities. We also certify that no part of our compensation was, is, or will be directly or indirectly related to the specific recommendation(s) or view(s) in this report.
Terms & conditions and other disclosures: ICICI Securities Limited (ICICI Securities) is full-service, integrated investment banking and is, inter alia, engaged in the business of stock brokering and distribution of financial products. ICICI Securities is a wholly-owned subsidiary of ICICI Bank which is India’s largest private sector bank and has its various subsidiaries engaged in businesses of housing finance, asset management, life insurance, general insurance, venture capital fund management, etc. (“associates”), the details in respect of which are available on www.icicibank.com. ICICI Securities is one of the leading merchant bankers/ underwriters of securities and participate in virtually all securities trading markets in India. We and our associates might have investment banking and other business relationship with a significant percentage of companies covered by our Investment Research Department. ICICI Securities generally prohibits its analysts, persons reporting to analysts and their relatives from maintaining a financial interest in the securities or derivatives of any companies that the analysts cover. The information and opinions in this report have been prepared by ICICI Securities and are subject to change without any notice. The report and information contained herein is strictly confidential and meant solely for the selected recipient and may not be altered in any way, transmitted to, copied or distributed, in part or in whole, to any other person or to the media or reproduced in any form, without prior written consent of ICICI Securities. While we would endeavour to update the information herein on a reasonable basis, ICICI Securities is under no obligation to update or keep the information current. Also, there may be regulatory, compliance or other reasons that may prevent ICICI Securities from doing so. Non-rated securities indicate that rating on a particular security has been suspended temporarily and such suspension is in compliance with applicable regulations and/or ICICI Securities policies, in circumstances where ICICI Securities might be acting in an advisory capacity to this company, or in certain other circumstances. This report is based on information obtained from public sources and sources believed to be reliable, but no independent verification has been made nor is its accuracy or completeness guaranteed. This report and information herein is solely for informational purpose and shall not be used or considered as an offer document or solicitation of offer to buy or sell or subscribe for securities or other financial instruments. Though disseminated to all the customers simultaneously, not all customers may receive this report at the same time. ICICI Securities will not treat recipients as customers by virtue of their receiving this report. Nothing in this report constitutes investment, legal, accounting and tax advice or a representation that any investment or strategy is suitable or appropriate to your specific circumstances. The securities discussed and opinions expressed in this report may not be suitable for all investors, who must make their own investment decisions, based on their own investment objectives, financial positions and needs of specific recipient. This may not be taken in substitution for the exercise of independent judgment by any recipient. The recipient should independently evaluate the investment risks. The value and return on investment may vary because of changes in interest rates, foreign exchange rates or any other reason. ICICI Securities accepts no liabilities whatsoever for any loss or damage of any kind arising out of the use of this report. Past performance is not necessarily a guide to future performance. Investors are advised to see Risk Disclosure Document to understand the risks associated before investing in the securities markets. Actual results may differ materially from those set forth in projections. Forward-looking statements are not predictions and may be subject to change without notice. ICICI Securities or its associates might have managed or co-managed public offering of securities for the subject company or might have been mandated by the subject company for any other assignment in the past twelve months. ICICI Securities or its associates might have received any compensation from the companies mentioned in the report during the period preceding twelve months from the date of this report for services in respect of managing or co-managing public offerings, corporate finance, investment banking or merchant banking, brokerage services or other advisory service in a merger or specific transaction. ICICI Securities or its associates might have received any compensation for products or services other than investment banking or merchant banking or brokerage services from the companies mentioned in the report in the past twelve months. ICICI Securities encourages independence in research report preparation and strives to minimize conflict in preparation of research report. ICICI Securities or its analysts did not receive any compensation or other benefits from the companies mentioned in the report or third party in connection with preparation of the research report. Accordingly, neither ICICI Securities nor Research Analysts have any material conflict of interest at the time of publication of this report. It is confirmed that Deepak Purswani, MBA (Finance), CFA; Nikunj Gala, MBA (Capital Markets) research analysts of this report have not received any compensation from the companies mentioned in the report in the preceding twelve months. Compensation of our Research Analysts is not based on any specific merchant banking, investment banking or brokerage service transactions. ICICI Securities or its subsidiaries collectively or Research Analysts do not own 1% or more of the equity securities of the Company mentioned in the report as of the last day of the month preceding the publication of the research report. Since associates of ICICI Securities are engaged in various financial service businesses, they might have financial interests or beneficial ownership in various companies including the subject company/companies mentioned in this report. It is confirmed that Deepak Purswani, MBA (Finance), CFA; Nikunj Gala, MBA (Capital Markets) research analysts do not serve as an officer, director or employee of the companies mentioned in the report. ICICI Securities may have issued other reports that are inconsistent with and reach different conclusion from the information presented in this report. Neither the Research Analysts nor ICICI Securities have been engaged in market making activity for the companies mentioned in the report. We submit that no material disciplinary action has been taken on ICICI Securities by any Regulatory Authority impacting Equity Research Analysis activities. This report is not directed or intended for distribution to, or use by, any person or entity who is a citizen or resident of or located in any locality, state, country or other jurisdiction, where such distribution, publication, availability or use would be contrary to law, regulation or which would subject ICICI Securities and affiliates to any registration or licensing requirement within such jurisdiction. The securities described herein may or may not be eligible for sale in all jurisdictions or to certain category of investors. Persons in whose possession this document may come are required to inform themselves of and to observe such restriction.