28
Japan Real Estate and Tokyo Residential Market Overview for The Westminster Nanpeidai Japan Capital Markets – May 2016
Japan Real Estate and Tokyo Residential Market Overview
for The Westminster Nanpeidai
Japan Capital Markets – May 2016
2
AGENDA
• Japan Economy Overview
• Abenomics Improves Economy
• Tokyo Residential Market Overview
• Shibuya Now and Future
• Exit Strategy
• Asian Investors Update

3
JAPAN GDP TIME SERIES
Stable GDP growth to be expected towards 2020
Source: Oxford Economics
FORECAST

4
NIKKEI 225 TIME SERIES
A steep growth is confirmed after the Abe administration
Source: Nikkei Indices
2012 2013 2014 2015
Abe Administration
2016
5
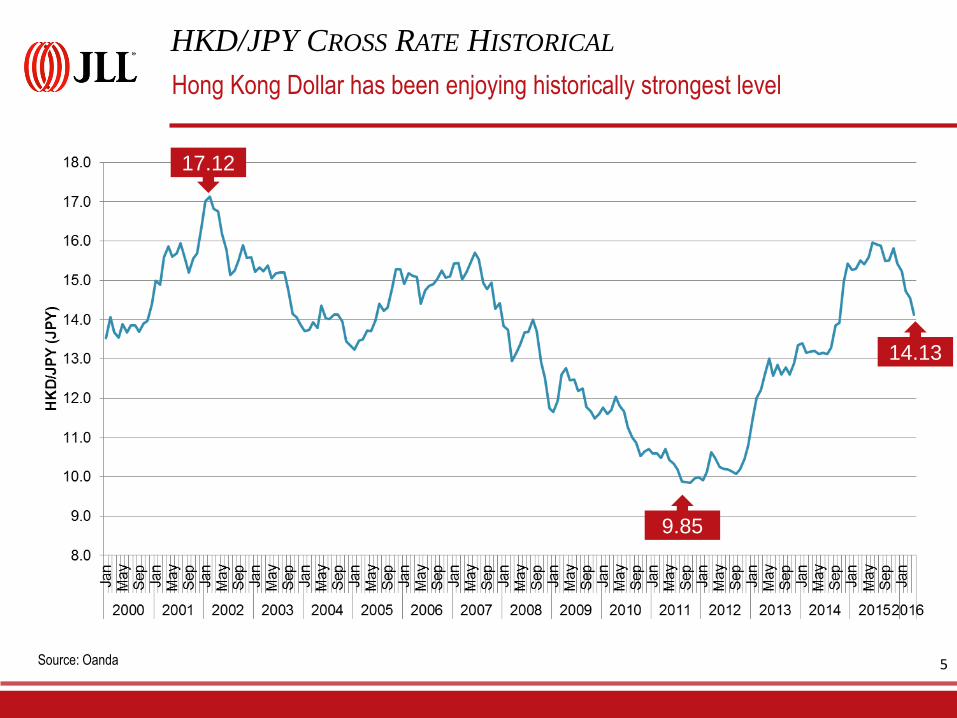
HKD/JPY CROSS RATE HISTORICAL
Hong Kong Dollar has been enjoying historically strongest level
Source: Oanda
17.12
9.85
14.13
6
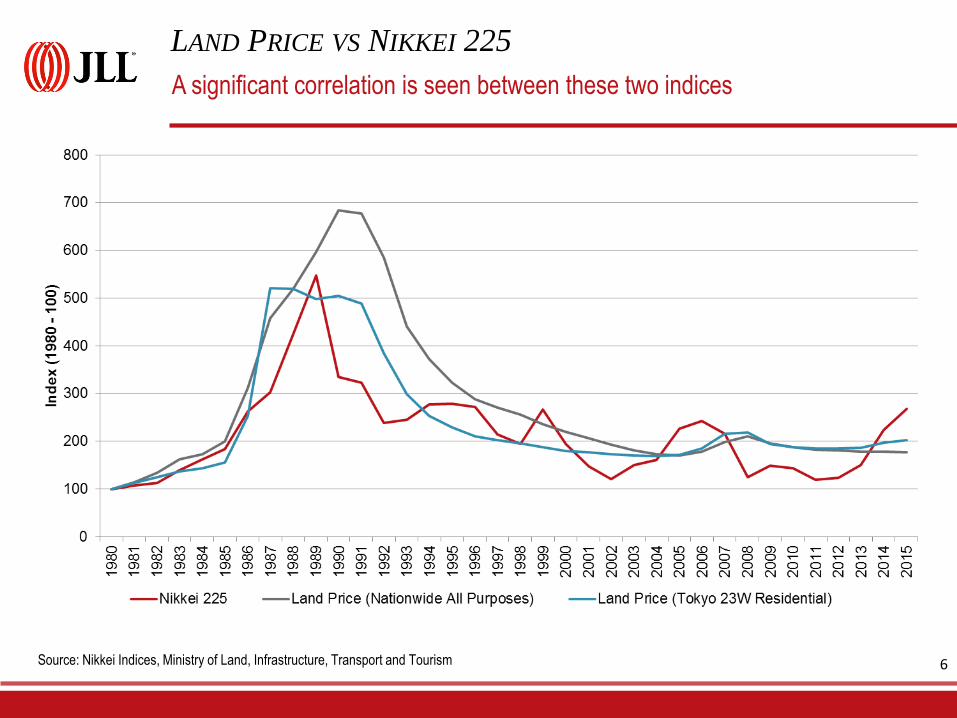
LAND PRICE VS NIKKEI 225
A significant correlation is seen between these two indices
Source: Nikkei Indices, Ministry of Land, Infrastructure, Transport and Tourism

7
LAND PRICE MOVEMENT (SHIBUYA RESIDENTIAL)
Latest survey shows the continuing positive movement
Source: Ministry of Land, Infrastructure, Transport and Tourism “Chika Koji 2016”
Note: As of 1 January each year
7
The Bubble
Economy

8
AGENDA
• Japan Economy Overview
• Abenomics Improves Economy
• Tokyo Residential Market Overview
• Shibuya Now and Future
• Exit Strategy
• Asian Investors Update

9
ABENOMICS SCORE CARD
Stable growth is seen during the past three years
Source: Oanda, Nikkei Indices, Reuters.com, ARES, Japan Reit.com, MLIT, JNTO, Cabinet Office, Tokyo Metropolitan Government
Jun-13 May-16 Change Notes
HKD/JPY Cross Rate 12.57 14.13 12.5% JPY, monthly average
Nikkei 225 13,677 16,666 21.9% JPY, monthly average
Land Price
(Shibuya-ku Residential) 961,900 1,054,000 9.6% JPY per sqm, as of 1 Jan
Inbound Tourists 8.4 million 19.7 million 136.1% Yearly total (2012, 2015)
GDP Growth (Nominal) 0.8% 2.5% 1.7% Yearly total (2013, 2015)
CPI 99.7 103.6 3.9% Year 2010 = 100 (2012, 2015)
Population (Tokyo 23-ku) 9.1 million 9.3 million 2.9% Monthly total
(Jun 2013 and Apr 2015)
5-yr Swap Rate 0.48% -0.08% -0.56%
REIT Yield 3.80% 3.28% -0.52% Monthly weighted average
(Jun 2013 and Apr 2016)

10
BUSINESS SENTIMENT DIFFUSION INDEX
The sentiment has been in the positive territory since September 2013
Source: “Tankan Survey” conducted by The Bank of Japan
Abe
Administration

11
COMPANIES’ PRETAX PROFIT
Scores record high level
Source: “Statistics of Corporations” conducted by Ministry of Finance
Abe Administration
12
AGENDA
• Japan Economy Overview
• Abenomics Improves Economy
• Tokyo Residential Market Overview
• Shibuya Now and Future
• Exit Strategy
• Asian Investors Update
13
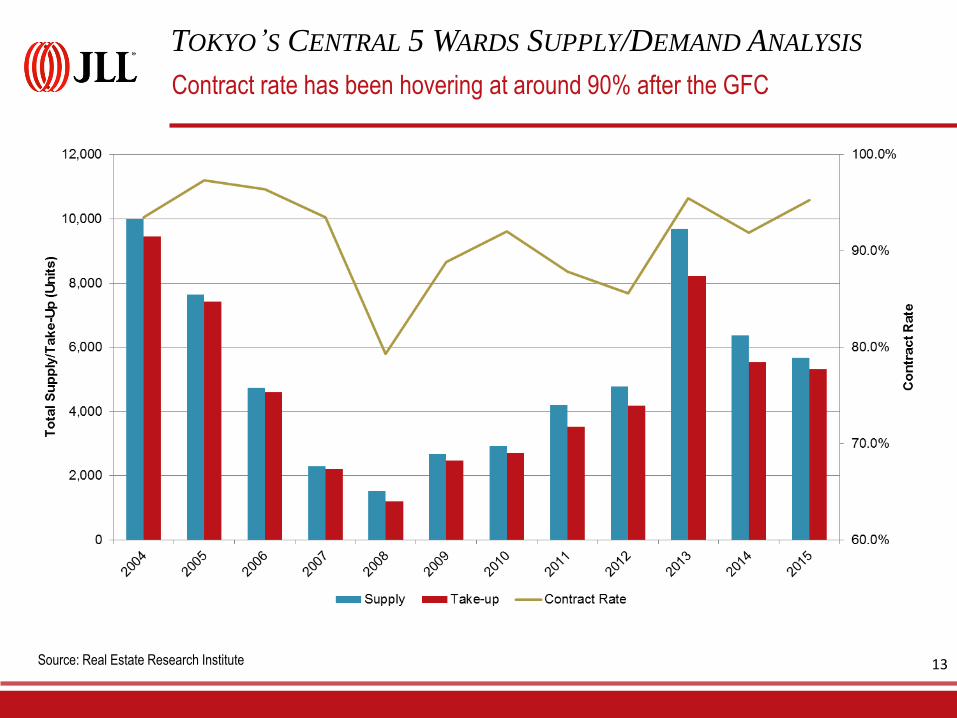
TOKYO’S CENTRAL 5 WARDS SUPPLY/DEMAND ANALYSIS
Contract rate has been hovering at around 90% after the GFC
Source: Real Estate Research Institute
14
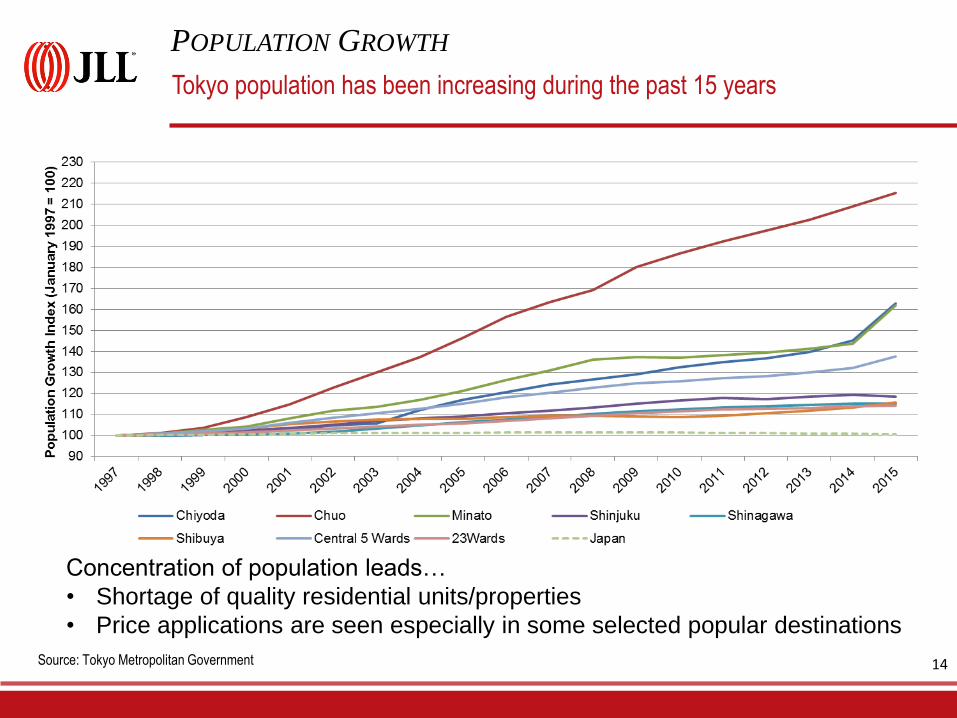
POPULATION GROWTH
Tokyo population has been increasing during the past 15 years
Source: Tokyo Metropolitan Government
Concentration of population leads…
• Shortage of quality residential units/properties
• Price applications are seen especially in some selected popular destinations

15
AVERAGE UNIT PRICE TRENDS (NEW DEVELOPMENTS)
Price continues the upward trends
Source: Real Estate Research Institute
16
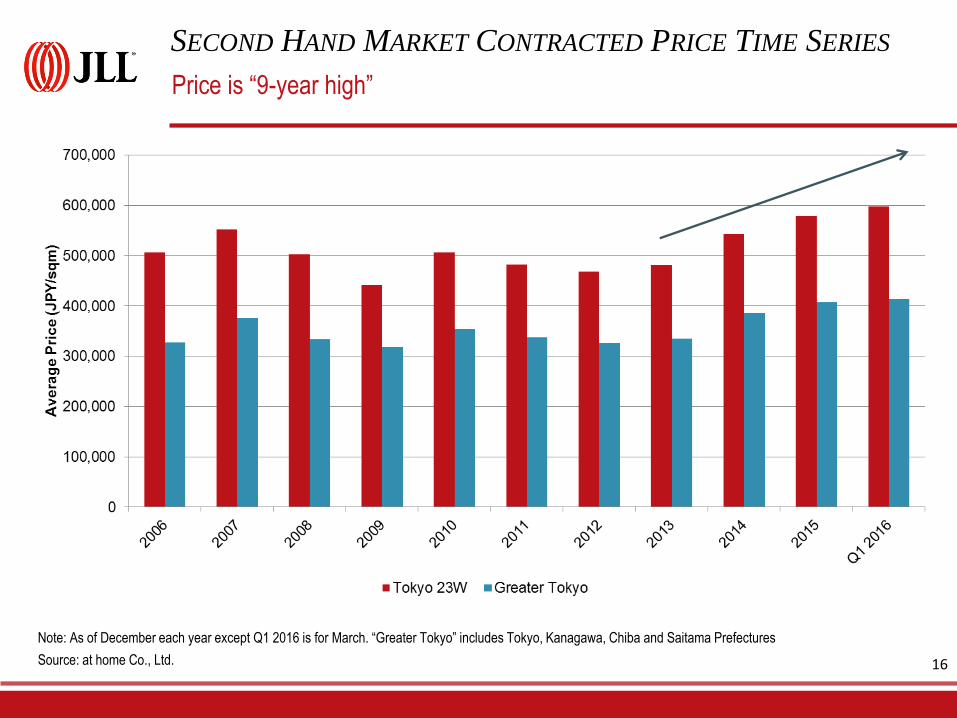
SECOND HAND MARKET CONTRACTED PRICE TIME SERIES
Price is “9-year high”
Source: at home Co., Ltd.
Note: As of December each year except Q1 2016 is for March. “Greater Tokyo” includes Tokyo, Kanagawa, Chiba and Saitama Prefectures

17
AGENDA
• Japan Economy Overview
• Abenomics Improves Economy
• Tokyo Residential Market Overview
• Shibuya Now and Future
• Exit Strategy
• Asian Investors Update
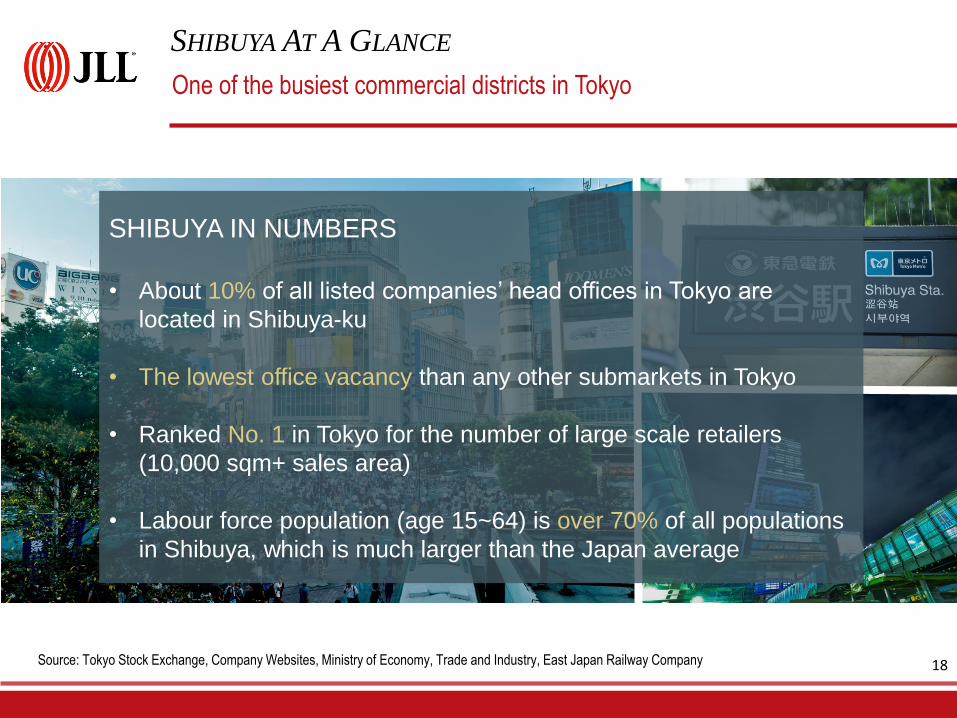
SHIBUYA IN NUMBERS
• About 10% of all listed companies’ head offices in Tokyo are
located in Shibuya-ku
• The lowest office vacancy than any other submarkets in Tokyo
• Ranked No. 1 in Tokyo for the number of large scale retailers
(10,000 sqm+ sales area)
• Labour force population (age 15~64) is over 70% of all populations
in Shibuya, which is much larger than the Japan average
18
SHIBUYA AT A GLANCE
One of the busiest commercial districts in Tokyo
Source: Tokyo Stock Exchange, Company Websites, Ministry of Economy, Trade and Industry, East Japan Railway Company

SHIBUYA RESIDENTIAL MARKET OVERVIEW
• Shibuya is one of the three wards of Tokyo which provides the
highest condo sale price per sqf in average
• Shibuya’s average annual income is the second highest in Tokyo,
which is about 2.7 times larger than the Tokyo average
• Shibuya-ku’s 3 bedroom+ units are less than 5% among all
available residential units in the ward
19 Source: Next Co., Ltd., Ken Corporation, Ministry of Internal Affairs and Communications
SHIBUYA AT A GLANCE
Shibuya is also recognised as the high class residential area

20
SHIBUYA STATION
Above Shibuya Station (2016→2027)
Dogenzaka Area (2015→2018)
Redev. Area
Redev. Bldgs.
SHIBUYA IN THE FUTURE
Redevelopments progressing 200m away from The Westminster Nanpeidai

21
SHIBUYA STATION
NANPEIDAI
SHOTO
SHOTO
• Area: 0.28 sqkm
(1.9% of Shibuya-ku)
• Pop.: 2,472
(1.2% of Shibuya-ku)
• Only 4 units being
leased now
NANPEIDAI
• Area: 0.15 sqkm
(1.0% of Shibuya-ku)
• Pop.: 1,674
(0.8% of Shibuya-ku)
• No rental vacancies
SHIBUYA NAMPEIDAI AND SHOTO
Two high end residential area nearby Shibuya station are significantly small

Nanpeidai Project
(Tokyu Corp. HQ)
Shibuya
Garden Tower
Daikanyama
T-SITE (Tsutaya)
Nippon Steel
President’s House
Takeo Miki
Memorial House
La Tour
Daikanyama
SHIBUYA STATION
REDEVELOPMENT
AREA
NANPEIDAI
DAIKANYAMA
SHIBUYA NANPEIDAI
Harmonising with vibrant and quiet neighbourhoods

23
AGENDA
• Japan Economy Overview
• Abenomics Improves Economy
• Tokyo Residential Market Overview
• Shibuya Now and Future
• Exit Strategy
• Asian Investors Update

24
CASE STUDIES
Actual examples of value appreciation
Completion: May 2014/ 7F – 62.83 sqm
The Parkhouse Nishi-Azabu Residence
The Parkhouse Nishi-Azabu Residence
Completion: May 2014/17F – 70.09 sqm
April 2014
JPY 77.5 million July 2015
JPY 98.0 million
April 2013
JPY 77.5 million
April 2013
JPY 94.5 million
March 2015
JPY 115.0 million
April 2013
JPY 94.5 million
Source: Jones Lang LaSalle
Park City Osaki The Tower
Completion: May 2015 / 24F – 44.01sqm
May 2014
JPY 52.6 million
September 2015
JPY 63.0 million
May 2014
JPY 52.6 million

25
WHO IS DRIVING THE DEMAND OF SECOND-HAND CONDO?
The key word is the “compression rate” of inheritance tax
Source: Ken Corporation
If you have JPY 150 million, the assessed value for inheritance tax will be…
In Cash & Stock
JPY 150 million Compression rate: 0% • Assessed value is always the same as the cash amount
Acquired a unit in a 100 units low/mid rise condominium
JPY 32.4 million Compression rate: 78.4% (approximately) • Land price is valued based upon “rosenka” (80% of current price)
• Building price is decided in between 40-60% of construction price
26
AGENDA
• Japan Economy Overview
• Abenomics Improves Economy
• Tokyo Residential Market Overview
• Shibuya Now and Future
• Exit Strategy
• Asian Investors Update

27
ASIAN INSTITUTIONAL INVESTORS UPDATES
The institutional investors from Asia are seen…
Source: Real Capital Analytics, Nikkei Kenplatz
Dynasty Holdings (Taiwan)
• A retail property called “Nakaza Kuidaore Building” in Osaka
• Acquired from UK based fund Grosvenor and Tokyo Tatemono
• Dynasty won the bidding process
• Price was USD 74.9 million and closed in early 2015
China Investment Corporation (China)
• A commercial property called “Meguro Gajoen” located in Tokyo
• Acquired from Mori Trust
• Acquisition through LaSalle Investment Management
• Price was USD 1,167 million and closed in early 2015
A High Net Worth Investor (Philippines)
• A hotel property near to the Narita International Airport
• JLL Hotels & Hospitality Group and Capital Market teams advised to the buyer
• Price was undisclosed and closed on January 2016
28
THANK YOU


