Joint European Research Infrastructure network for Coastal Observatories Report on Biofouling Prevention Methods D4.3 Grant Agreement n° 262584 Project Acronym : JERICO Project Title : Towards a Joint European Research Infrastructure network for Coastal Observatories Coordination : P. Farcy, IFREMER, [email protected], www.jerico-fp7.eu: Authors : M. Faimali, G. Pavanello, G. Greco, I. Trentin, S. Sparnocchia Involved Institution : CNR Date : V1.2 - 10/06/2014
Transcript
Joint European Research Infrastructure network for Coastal Observatories
Report on Biofouling Prevention Methods D4.3
Grant Agreement n° 262584 Project Acronym: JERICO Project Title: Towards a Joint European Research Infrastructure network for Coastal Observatories Coordination: P. Farcy, IFREMER, [email protected], www.jerico-fp7.eu: Authors: M. Faimali, G. Pavanello, G. Greco, I. Trentin, S. Sparnocchia Involved Institution: CNR Date: V1.2 - 10/06/2014
JERICO–WP4–D4.3–100614–V1.2�
. 2
JERICO–WP4–D4.3–100614–V1.2�
. 3
Document description
REFERENCES
Annex 1 to the Contract Description of Work (DoW) version of the 22 Feb. 2011
Document information
Document Name Report on Biofouling Prevention Methods
Document ID JERICO-WP4-D4.3-100614-V1.2
Revision
Revision Date
Author M. Faimali, G. Pavanello, G. Greco, I. Trentin, S. Sparnocchia
V1.2 10.06.2014 Implementation of Partners’ suggestions, writing of Conclusions, final version of the document
Faimali
Diffusion list
Consortium beneficiaries
X
Third parties
Associated Partners
other
This document contains information, which is proprietary to the JERICO consortium. Neither this document nor the information contained herein shall be used, duplicated or communicated by any means to any third party, in whole or in parts, except with prior written consent of the JERICO Coordinator.
The information in this document is provided as is and no guarantee or warranty is given that the information is fit for any particular purpose. The user thereof uses the information at its sole risk and liability.
JERICO–WP4–D4.3–100614–V1.2�
. 4
JERICO–WP4–D4.3–100614–V1.2�
. 5
Table of Contents
1.� Executive Summary 7�
2.� Introduction 9�
3.� Biofouling and Antifouling technologies for marine environmental monitoring devices 11�
3.1.� Biofouling as a Technological Problem 11�
3.2.� Changes of Strategy in the Development of Antifouling Technologies 13�
3.3.� Non-Toxic Antifouling Coatings: The Future 16�
3.4.� Antifouling strategies for marine environmental monitoring devices 17�
4.� Review on biofouling protection strategies in the field of marine sensors 19�
4.2.� Active strategy 27�4.2.1. Technical reports and patents 27�4.2.2. Scientific papers 30�
5.� Survey on biofouling problem perception and prevention approaches and practices in JERICO36�
5.1.� Biofouling problem perception 36�
5.2.� Biofouling prevention approaches 38�
5.3.� Biofouling prevention practices 43�
5.4.� Additional questions on biofouling-related issues 51�
5.5.� Summary of outcomes from the survey 53�
6.� Conclusions 55�
6. Conclusion 56
7. References 57
8. Appendix: The Biofouling Monitoring Program 61
JERICO–WP4–D4.3–100614–V1.2�
. 6
JERICO–WP4–D4.3–100614–V1.2�
. 7
1. Executive Summary
The main aim for this report is to provide an overview of biofouling prevention practices adopted by the JERICO consortium, to evaluate new methods used by the community external to JERICO, and to provide recommendation for best practices and methodologies across the network with the aim towards a common approach.
Information on practices in use were collected through a questionnaire, from the JERICO workshops, and from the literature.
Furthermore, JERICO started a Biofouling Monitoring Program (BMP) aiming in identifying major organisms responsible for biofouling in different geographical area, as an input to the development and application of more suitable approach to any specific region.
JERICO–WP4–D4.3–100614–V1.2�
. 8
JERICO–WP4–D4.3–100614–V1.2�
. 9
2. Introduction Biofouling is a common problem across observing systems, even though there is a significant gradient of magnitude in European Seas - north to south and west to east. Additionally each sensor has its own characteristics and requirements.
Potential solutions to this problem have been proposed, but none have been universally applicable. During the last 20 years, marine monitoring stations have been developed to collect data for calibration of satellite observations, coastal water quality assessment and monitoring of the marine environment. Most are surface buoys or subsurface moorings, and are now equipped with sophisticated sensing equipment, which is subject to biofouling. The long-tem quality of measurements may therefore be questionable due to biofouling issues in the short-term. Although the protection of the sensing area of the sensor is a concern that has been addressed during the last decade, and operational solutions are now implemented on commercial equipment used for long-term deployments, the problem still exists. Autonomous monitoring systems should provide reliable measurements in real-time without costly and/or frequent maintenance. In deep-sea conditions this maintenance is nearly impossible to realize. For coastal applications it is widely accepted that a two-month interval for maintenance is the minimum duration for economically viable in-situ monitoring systems. Consequently, systems without efficient biofouling protection are likely to be compromised.
A major task in JERICO was to:
- describe all different methods used across the network with reference to the cost (implementation, maintenance) and adaptability (different sensors and areas);
- share best practices and methodologies across the network with the aim towards a common approach;
- to evaluate new methods used by the community external to JERICO and suggest possible future implementation.
A preliminary discussion on biofouling problem and its impact on data was launched at JERICO Fixed Platforms Workshop in Rome (29 February – 1 March, 2012), where a session on biofouling was organized around the experiences of the partners in different environmental conditions and how they face this problem in maintaining sensors and installations and its effects on data.
Several examples were shown of the biofouling action on different sensors and after different periods of deployment.
Biofouling modifies optical properties (window opacity, interference, etc.) in optical sensors and membrane permeability in membrane-based sensors (pH, oxygen, etc.). Consequences are loss of sensibility, drift and variation in response time.
This problem must be treated as long as autonomous measurement longer than 1 week is involved. This especially applies to fluorescence sensors, see for instance Fig. 2.1 where data from protected and unprotected sensors are compared. Note the drift, which started also in the protected sensor’s signal as a consequence of a failure of the biofouling protection system after a power supply interruption of about 1 week.
JERICO–WP4–D4.3–100614–V1.2�
. 10
Figure 2.1: Biofouling effect on an in-situ fluorometer exposed by 100 days (courtesy L. Delauney)
Also, materials and shape should be chosen very carefully in order to reduce fouling attachment. From the experience of the partners, it emerged that the sensors that have simpler geometry (flatter interfaces, no cavities, no appendages, etc.) are the best to treat, both with preventive and curative methods.
To be suited to its purposes, a biofouling protection system should be able to:
x delay the biofouling effect on the response of the measuring system for at least 1 month in severe conditions (estuary, low depths, high insolation) and for 3 months in average condition;
x last for at least 6 months in deep sea observatories;
x be compatible with autonomous energy supplying devices (batteries);
x be adaptable quite easily on existing instrumentation;
x not affect the measurements produced.
Keeping these points in mind, the questionnaire and the bibliographic review presented in this report try to highlight which are the main problems related to antifouling protection of oceanographic sensors, which are the pros and cons of the antifouling technologies available on the market and under research.
JERICO–WP4–D4.3–100614–V1.2�
. 11
3. Biofouling and Antifouling technologies for marine environmental monitoring devices
This section reviews the methods of protection from biofouling of marine sensors taking into account recent changes in the overall strategy for research and development in the field of antifouling technologies. The document updates the state of the art in this area since the last reviews published before 2010.
3.1. Biofouling as a Technological Problem
Biological fouling, usually termed biofouling, can be defined as the undesirable accumulation of micro- and macro-organisms on artificial surfaces immersed in water.
Biofouling has been described as a four-step sequential ecological process. The first two steps, which produce a microbial biofilm, occur similarly whether on a surface in the sea or on a catheter in a hospital room. The following two steps are unique to aquatic habitats and involve the attachment of unicellular and multicellular eukaryotes to an inorganic or living surface. The multi-step process results from the web of interactions in the initial biofilm and the subsequent community of colonizers, culminating in the establishment of a mature community composed of prokaryotes, fungi, protists and adult invertebrates.
Biofouling assemblages on artificial substrates are a complex phenomenon resulting from several processes, the rate and extent of which are influenced by numerous physical, chemical and biological factors in the immediate proximity of the surface, and cannot be defined as distinct and univocal entities (Fig. 3.1).
Figure 3.1: Preliminary model of interactions between larvae, biofilm and substratum during settlement process. The role of subtratum and biofilm on settlement S, B is indirectly modulated by their mutual relationships (s, b). In natural conditions, these interactions can be changed by other chemical, physical and biological (environmental) variables [1].
JERICO–WP4–D4.3–100614–V1.2�
. 12
From the initial adsorption of organic molecules, to the colonisation by microorganisms, and to the development of complex and diverse sessile assemblages, biofouling affects most man-made surfaces, resulting in significant economic costs.
Biofouling is a costly problem, and it is encountered in a wide spectrum of technical systems, ranging from the shipping industry, power industry, water purification, aquaculture plant and oceanographic measuring instruments.
Fouled ships, for instance, need 40% more fuel in order to maintain the same speed. This leads to a global cost of about $ 7.5 billion per year and to related environmental issues due to 20 million tons of CO2 more that are emitted annually. The US Office of Naval Research estimated that the periodically cleaning and restoring of ship hulls cost to the US Navy about $1000 million per year [2].
The costs of biofouling are clearly not limited to ship hulls nor to the marine environment. Control of fouling in water intakes, piping systems and desalination plants (Fig. 3.2) cost over $15 billion per year [3].
Figure 3.2: Biofouling colonization residual inside cooling water system [1].
In food industry, the formation of fouling layer within food processing equipment for pasteurization and sterilization costs to the US industrial community about $10 billion per year [4]. Biofilm-associated infections extend hospital stays of an average of about three days and it is estimated that up to 65% of nosocomial infections are biofilm-based with an associated treatment cost in excess of $1 billion per year. Up to 82% of nosocomial bacteremias are the result of bacterial contamination of intravascular catheterizations [5].
The influence of biofouling on coastal and oceanographic measuring instruments, which are routinely used in marine and coastal research and monitoring programmes, is very strong (Fig. 3.3) and the
JERICO–WP4–D4.3–100614–V1.2�
. 13
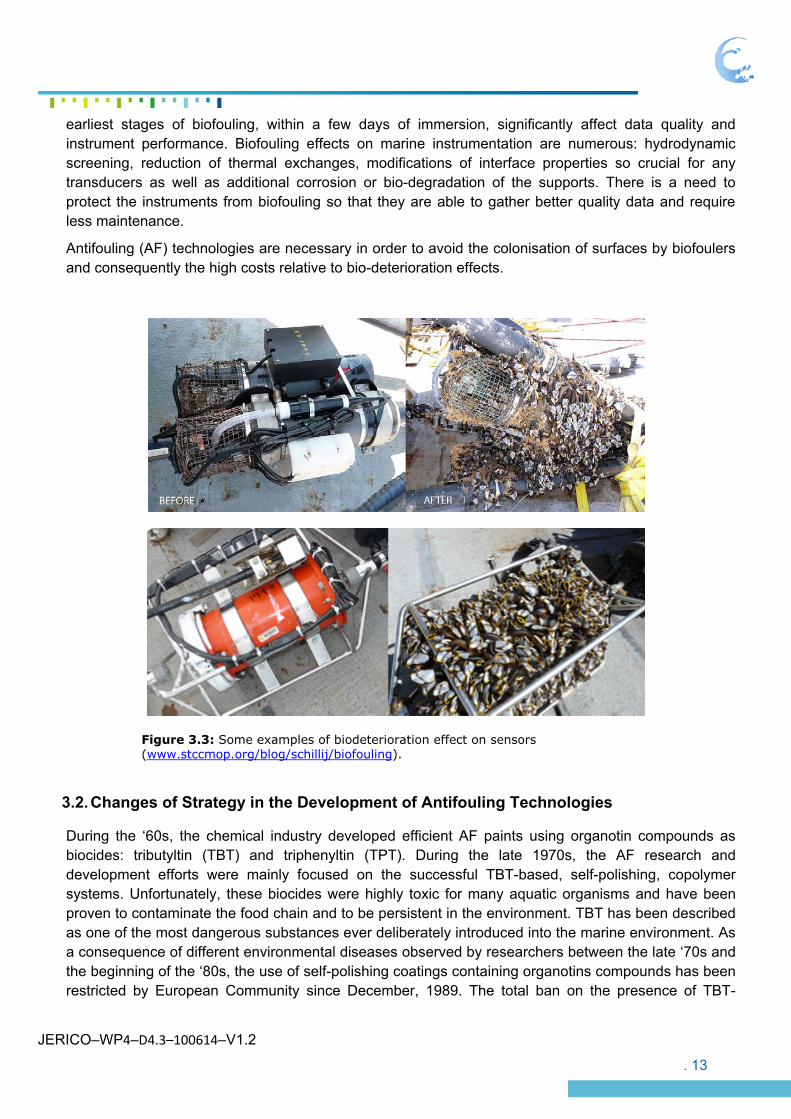
earliest stages of biofouling, within a few days of immersion, significantly affect data quality and instrument performance. Biofouling effects on marine instrumentation are numerous: hydrodynamic screening, reduction of thermal exchanges, modifications of interface properties so crucial for any transducers as well as additional corrosion or bio-degradation of the supports. There is a need to protect the instruments from biofouling so that they are able to gather better quality data and require less maintenance.
Antifouling (AF) technologies are necessary in order to avoid the colonisation of surfaces by biofoulers and consequently the high costs relative to bio-deterioration effects.
Figure 3.3: Some examples of biodeterioration effect on sensors (www.stccmop.org/blog/schillij/biofouling).
3.2. Changes of Strategy in the Development of Antifouling Technologies
During the ‘60s, the chemical industry developed efficient AF paints using organotin compounds as biocides: tributyltin (TBT) and triphenyltin (TPT). During the late 1970s, the AF research and development efforts were mainly focused on the successful TBT-based, self-polishing, copolymer systems. Unfortunately, these biocides were highly toxic for many aquatic organisms and have been proven to contaminate the food chain and to be persistent in the environment. TBT has been described as one of the most dangerous substances ever deliberately introduced into the marine environment. As a consequence of different environmental diseases observed by researchers between the late ‘70s and the beginning of the ‘80s, the use of self-polishing coatings containing organotins compounds has been restricted by European Community since December, 1989. The total ban on the presence of TBT-
JERICO–WP4–D4.3–100614–V1.2�
. 14
based antifoulings on ships hulls in EU ports came into effect on the 1st of January, 2008. As a consequence of the ban, in the last few decades a great deal of attention has been devoted to find alternative antifouling technologies [7].
Following the ban of TBT-based products in AF paints, alternatives containing high amounts of copper (Cu)-based compounds were developed. As it is about ten times less toxic than TBT, cobiocides, also called boosters, were used to enhance the AF performance of copper-based coatings [8].
All these compounds vary in terms of their mode of action, environmental persistence, and toxicological properties. Several reviews have been published presenting an overview of the biocides used in AF paints and their specific fate and effects in the environment [9,10-14].
As a consequence of the growing investigations on its toxicity, the release rate of Cu-based soluble species from AF paints has been regulated in several areas, for example, Sweden and the U.S. states of Washington and California [7].
In order to identify potential candidates able to possess these characteristics in recent years, using a biomimetic approach, the possibility of exploiting marine natural product antifoulants (NPAs) utilized by marine organisms (e.g., sponges, corals, and macroalgae) to prevent them from colonization by other marine organisms has been investigated [15-17].
To date, purification of active products has yielded ca. 200 molecules with some degree of AF activity against a wide range of marine fouling organisms, assayed mainly through laboratory tests [17].
The challenge of finding a natural product which fulfills the required criteria of low toxicity, broad spectrum activity, and ease of production has yet to be realized, and is the main reason why they have not been so far successfully commercialized.
Also the idea of using enzymes, catalytically active proteins omnipresent in nature, for developing new enzyme-based coatings has received increased interest in recent years [18,19].
Enzymes can degrade the fouling organism or its bioadhesive, or produce other biocidal compounds. Direct enzymatic AF covers the application of “biocidal” or adhesive-degrading enzymes, whereas indirect enzymatic AF is based on enzymatic generation of biocides from substrates present in the seawater or coating-ingredients [20]. In several cases, concepts as well as short-term AF activity in coatings have been proven, but long-term efficiency towards all fouling organisms remains to be reported.
Furthermore, the definitive failure of the “chemically active strategy” in Europe has been catalyzed by the fact that the predisposition of biocidal compounds (synthetic and / or natural origin) to cause environmental adverse effects has received in recent years, a greater attention, and biocide containing AF paints are currently regulated and require approval.
From the 1st of September 2013, the Biocidal Products Regulation (BPR) will replace the BPD and henceforth regulate all biocidal products in the European Union. The BPR will introduce new procedures for all EU countries and authorities now require testing of new active substance prior to marketing authorization [21].
The total costs have to be taken into account, for example, not only by preparing agreed protocols and placing studies but also by monitoring studies, analysis of the results, risk assessments based on exposure scenarios, dossier preparation, registration costs, task force participations, legal fees, etc., as well as management activities of the directive and associated registration. The very high costs and long
JERICO–WP4–D4.3–100614–V1.2�
. 15
times for the registration process almost totally limit the development of new biocides, regardless of their potential AF efficacy and environmental compatibility [22].
The awakening of the global environmental awareness in the form of legislative measures has completely changed the way AF research is conducted nowadays.
An overview of the main papers that in recent years have addressed the changes in the strategy of research in the field of antifouling technologies are summarized in Table 1.
Table 1: Selection of scientific papers related to the new trends of antifouling technology.
Grozea, CM, Walker, GC [26] Approaches�in�designing�nonͲtoxic�polymer�surfaces�to�deter�marine�biofouling�
2009�
Magin CM, Cooper SP, Brennan AB [27] NonͲtoxic�antifouling�strategies� 2010�
Cao S et al. [28] Progress� of� marine� biofouling� and� antifouling�technologies�
2011�
Callow JA, Callow ME [29] Trends�in�the�development�of�environmentally�friendly�foulingͲresistant�marine�coatings�
2011�
Kirschner CM, Brennan AB [30] BioͲInspired�Antifouling�Strategies� 2012�
Lejars M, Margaillan A, Bressy C [7] Fouling� Release� Coatings:� A� Nontoxic� Alternative� to�Biocidal�Antifouling�Coatings�
2012�
JERICO–WP4–D4.3–100614–V1.2�
. 16
3.3. Non-Toxic Antifouling Coatings: The Future
Within the context of worldwide pressure for legislation limiting the use of biocides, and ever-increasing fuel prices, there is now a real need for the continuous development of new non-toxic AF formulations and an interesting and promising line of research is inspired by biomimetic solutions.
Nature provides examples of antifouling surfaces that emphasize the importance of both chemical and physical concepts. Physical cues, such as surface roughness and fluid hydrodynamics, can act singularly or in concert with the surface chemistry to enhance or inhibit the attachment of organisms to a surface. Chemical cues, especially surface energy, influence not only the ability of an organism to initially attach to a surface, but also the degree of fouling-release from the surface once adhesion has been established.
There are many examples from natural fouling-resistant organisms, which can serve as a basis for new scientific investigations, but two general (non-exclusive) strategies are typically followed in the design of novel, non-biocidal, non-fouling surfaces and are now considered to be the most promising environmentally-friendly, antifouling technology [23].
- Engineered Microtopographical Surfaces, in which the objective is to deter the recruitment stages of fouling organisms from attaching in the first place.
- Fouling Release Coatings (FRC), which do not prevent organisms from attaching, but the interfacial bond is weakened so that attached organisms are more easily removed by the hydrodynamic shear forces.
These two general approaches are not mutually exclusive and in fact the distinction is overly simplistic. In both cases the objective is to achieve the desired result through the manipulation of the physicochemical properties of coating materials (for example, elastic modulus, frictional coefficient) [29].
Some of the most promising strategies that define a new era of antifouling technology have been inspired by nature and can be summarized in two main approaches [30]:
- Bio-inspired chemical/physical strategies: antifouling surface material and topography inspired by natural antifouling surface (eg., shells of mollusks and crabs and skin of marine mammals and sharks).
- Bio-inspired stimuli-responsive strategies: surface self-cleaning mechanism inspired by the skin of marine mammals and fishes that have the capability to respond to stimuli in the environment.
At this point, no single technology has been demonstrated to be universally effective and one way forward will be to design ‘multifunctional smart coatings’ combining chemical, physical, and stimuli-responsive strategies in order to develop the best non-toxic antifouling solutions.
JERICO–WP4–D4.3–100614–V1.2�
. 17
Figure 3.4: Microtopography of the eye surface of the crab Carcinus maenas (SEM image and elaboration by G. Greco - ISMAR-CNR, [31]).
3.4. Antifouling strategies for marine environmental monitoring devices
However, the vast majority of antifouling methods developed to date have been developed with large-scale applications in mind (e.g., the hull of a shipping vessel), and many are not adapted to specialized applications such as sensors. Protection of sensors from biofouling is further complicated by the variety of materials used in the construction of electrodes, membranes, optical windows and other sensing components, all of which have differing antifouling requirements for optimal protection.
The next review section outlines the research that has been carried out on strategies for the protection of marine monitoring devices, taking into account recent changes in the overall strategy for research and development in the field of antifouling technologies, updating the state of the art in this area since the last reviews published before 2010 [32-34]:
The strategies to prevent biofouling development on sensors can be first classified in two main groups:
- Active: the biofouling protection is dependent on energy, consequently in most cases it can be turned on and off.
- Passive: the biofouling protection does not need any energy, consequently.
In general, the techniques for biofouling protection for oceanographic sensors can be classified, as shown in Table 2, also according to their methods of action [34]:
- Volumetric action: the biofouling protection is acting in a small volume surrounding the sensor area.
- Surface action: the biofouling protection is acting directly on the sensing area of the sensor.
JERICO–WP4–D4.3–100614–V1.2�
. 18
Table 2: Synthetic scheme of biofouling protection strategies in the field of marine sensors from [34].
JERICO–WP4–D4.3–100614–V1.2�
. 19
4. Review on biofouling protection strategies in the field of marine sensors
Following the mentioned classification, we have organized this review of scientific, technical and commercial literature summarizing the analyzed information, highlighting any representative reference and providing a short opinion (indicated as [SYNTHETIC REMARKS]) on possible applicability for antifouling protection of marine sensors.
4.1. Passive strategy
The passive strategies are characterised by the fact that they do not require any external energy. Moreover, we have decide to include into this category just the technologies which have only a physical antifouling mechanism (without any active chemical interaction as antifouling protection).
The updated bibliography also considers the recent promising approach for the development of novel sustainable solutions to biofouling, known as biomimetic design [1].
Thus physical or mechanical methods (bio-inspired chemical/physical strategies) of fouling prevention look very promising from the point of view of their applicability in specific markets, such as one of environmental sensors. In fact, the small surface areas involved and the range of materials utilized in the construction of sensing technologies is an advantage in this regard, and optimization of surface chemistry may be coupled with micro- or nanoscale surface texturing, in order to produce a synergistic antifouling effect.
4.1.1. Technical reports and patents
1. Moline, M. A., Wendt, D. (2011). Evaluation of gliders coatings against biofouling for improved flight performance. Office of Naval Research, Technical report: 10pp.
Several commercial products have been tested (laboratory and field testing) included CleanSignal (see previous papers). Laboratory testing includes toxicity (Artemia salina nauplii), settlement (Amphibalanus amphitrite cyprids), monitoring growth of juvenile barnacles and coating durability (A. amphitrite), removal assay (A. amphitrite adults). As regards this last laboratory testing method it has to be underlined that ClearSignal is the only tested product displaying foul-release properties. Indeed in all the other products, during the barnacle removal test, the organism’s basal plate was left behind on the surface. When this occurs, it indicates that the cohesive strength of the barnacle was less than the force necessary to remove the entire barnacle from the coating. It is a clear indication that the coatings are not functioning as a foul-release surface.
Field testing (6 months) included determination of percent coverage, measurement of biofouling, adhesion using a water jet, measurement of barnacle adhesion, visual Inspection of coating durability. None of the tested products showed better performance than the standard silicone coating from International Paint, Intersleek (selected standard foul-release coating). Among the different tested products “Aluminium with proline 4800 point with Zinc Oxide Cream” represents an interesting technique. It is a specific cream spread on the surface of the coating enhancing the antifouling
JERICO–WP4–D4.3–100614–V1.2�
. 20
properties. However, the cream is easily washed away losing its effectiveness after a short deployment time in the marine environment. In general for gliders the authors suggest that standard ablative copper based products are more suitable. Perhaps gliders do not reach the needed speed for foul release coating.
[SYNTHETIC REMARKS: Not particularly promising but applicable]
2. Williams, A. J. (2011). Sensor fouling prevention in an acoustic current meter, MAVS. Applied Ocean Physics and Engineering, Woods Hole Oceanographic institution, Massachusetts, USA
Two commercial silicone based coatings (ClearSignal and Propspeed) for acoustic current meters have been successfully tested but over a short exposure to seawater (7 months Propspeed and 3 months Clearsignal). Application of the coating has to be performed by specialized companies as this kind of products can be very susceptible to a lack of accuracy during the application procedure. Propspeed, originally designed for propellers, after 7 months of static immersion started to degrade (flocking), probably because of the lack of an appropriate application process (“homemade” application).
[SYNTHETIC REMARKS: Not particularly promising but applicable]
3. Lobe, H., Das, A. K. (2010). The ClearSignal Biofouling control system for Oceanographic Instrumentation. Conference proceedings OCEAN 2010, 20th -23rd September, Seattle, USA.
Describe ClearSignal (see previous works) from SevernMarine. The product is applicable to almost every structure immersed in the sea (dynamic and static), above all the product is indicated for optical sensors.
[SYNTHETIC REMARKS: Not particularly promising but applicable]
4. Lobe, H., Knapp, J., Das, A. K., Moffat, G. (2011). Optically clear biofouling resistant coating compositions for marine instrument and application methods. European Patent No. EP 2,363,438 A1.
European Patent on a transparent and “high light transmission” silicone coating (organosiloxane - PDMS based) for every kind of sensor and sensor housings. (ClearSignal from SevernMarine see Williams, A. J. (2011))
[SYNTHETIC REMARKS: Not particularly promising but applicable]
4.1.2. Scientific papers
1. Sullivan, T., Regan, F. (2011). The characterization, replication and testing of dermal denticles of Scyliorhinus canicula for physical mechanisms of biofouling prevention. Bioinspiration & Biomimetics, 6: 11p.
The biomimetic design of novel antifouling materials is an attractive prospect, as many marine
JERICO–WP4–D4.3–100614–V1.2�
. 21
organisms appear to have an intrinsic natural ability to resist biofouling through non-toxic mechanisms [2,3]. Shark dermal denticles are of interest in antifouling material development as it has been speculated that dermal denticles and riblets may possess dual functionality in both drag reduction and biofouling reduction [4].
Attempts are underway to exploit shark dermal denticles morphology/features in various applications such as the Fastskin R body suit designed by Speedo as a drag reducing whole body swimsuit [5]. However, inhibition of microbial adhesion by the presence of riblets or by the hydrodynamic conditions created by the presence of dermal denticles has not been proven experimentally. Shark dermal denticles have, however, recently inspired a successful commercial antifouling solution: Sharklet AFTM is a novel antifouling solution that has proven to be effective in preventing the settlement Ulva linza [6, 7], and in controlling biofilm formation in Staphylococcus aureus [8]. However, current manufacturing limitations mean that engineered surfaces such as Sharklet AFTM cannot match the topographic and dimensional complexity of real dermal denticles.
Aim of the paper is to assess the use of real sharkskin from the catshark, Scyliorhinus canicula, as a template for producing inexpensive synthetic sharkskin exhibiting dermal denticles for antifouling testing. A preliminary characterization of the dermal denticles was carried out to gain information on the feature morphology and variation across the surface before performing PDMS replicas.
The studied shark is characterized by a slow swimming behaviour and different part of its skin display different anti-settlement low drag features.
Figure 4.1: SEM images illustrating the variation in dermal denticle shape across the body surface of S. canicula, showing gradual variation from a large three-pointed denticle to a teardrop-shaped denticle with an elongated terminal point (A) through to shortened denticles with a large overlap (D) with large variation at intermediate stages.
c
a
b
d
JERICO–WP4–D4.3–100614–V1.2�
. 22
Samples were exposed for 14 days in seawater in two different sites characterized by different flow regimes. Mass increase % was calculated to quantify fouling resistance. Areas of synthetic skin with fewer, larger, denticles showed larger mass increases compared with synthetic skin with a higher density of denticles, albeit with a reduction in the mean size. Synthetic skin exposed in a high-energy fouling environment exhibited the same overall trend as samples exposed in the low energy environment. In literature denticles configuration and spacing may have a role either in increased fouling release or perhaps reduced adhesion of contamination and biofouling. [9, 10, 11] and this paper confirm the potentiality, as regards this dual function (drag reduction and reduction of surface fouling) of skin replicas of Scyliorhinus canicula.
Figure 4.2: SEM cross-section of dermal denticles at the first dorsal fin of S. canicula showing synthetic PDMSe denticles (A) and real surface (C). Synthetic dermal denticles reproduced from the caudal fin of S. canicula are shown in (B) with the real surface (D). PDMSe replication of dermal denticles with larger spacing and less overlap between denticles was accurate; however, for locations with larger areas of individual denticle overlap and with smaller denticles, PDMSe replicas of the surface were less accurate possibly as a result of insufficient penetration of the PDMSe into the spaces between the underlying skin surface and the denticle (scale bar = 100 Njm).
[SYNTHETIC REMARKS: promising technology, potentially applicable but still at an experimental level]
2. Bixler, G.D., Bhushan, B. (2012). Biofouling: lessons from nature. Philosophical transactions of the Royal Society A., 370: 2381–2417.
One of the most interesting, promising and increasing trends in the field of antifouling technologies seems to be biomimetic materials. In nature, the surface of several animals and plants shows great antifouling properties, thanks to different properties. This self-cleaning or antifouling natural surfaces can be used as model for new approaches aimed at limiting biological growth on man-made structures:
- naturally flexible in response to external solicitations (currents, etc), with self-cleaning effect (algae, shark skin)
Figure 4.6: Low-drag, micro-textured shark (S. acanthias) skin [3]
For now there are just pilot studies and limited applications of these solutions, and the work for implementing such a kind of surfaces into real applications, in particular oceanographic sensors, seems to be quite long. Nevertheless, the advances made in the last years in the field of material sciences could make such technologies more affordable and easy to be scaled up. [Ref. 12-14]
[SYNTHETIC REMARKS: promising technology, potentially applicable but still at an experimental level]
3. Chae, K. H., Hong, D. W., Lee, M. K., Son, O., Rhee, J. I. (2012). Antifouling sol-gel derived membrane entrapped with polymer containing phosphorylcholine groups for an optical O2 sensor application. Sensor and Actuators B, 173: 636-642.
JERICO–WP4–D4.3–100614–V1.2�
. 24
Polymers containing PC groups have properties that reduce biofouling [15] as well as resist protein adsorption and cell adhesion, and have been used in various biomedical [16] and sensor applications to prevent biofouling [17,18]. The combination of sol-gel technology containing specific polymers (phosporylcholine) can protect optical O2 sensors form bacterial growth. Indeed, in biomedical field, Sol-gel transparent matrices are used to detect oxygen by means of fluorescence dyes [19]. The polymer (PC) embedded in the matrix did not interfere with sensor measurements and inhibit E. coli growth [20]. The prepared sol–gel-derived sensing membrane also has good stability and reproducibility. The results indicated that the anti-fouling sol–gel derived O2 sensing membranes containing PMB (phosphorylcholine groups) were stable. This method can be usefully applied to prepare other anti-fouling optical sensors.
[SYNTHETIC REMARKS: potentially promising technology applicable only on some types of sensors]
4. Bixler, D. G., Theiss, A., Bhushan B., Lee S. C. (2014). Antifouling properties of microstructured surfaces bio-inspired by rice leaves and butterfly wings. Journal of Colloid and Interface Science, 419: 114-133.
A new topography combining rice leaf and butterfly wings structure with antifouling (as sharkskin) and self-cleaning (as the lotus effect) properties is proposed. Bixler and Bhushan [21,22,23] reported that rice leaves and butterfly wings combine the desirable shark skin (antifouling) and lotus leaf (self-cleaning) effects; creating the so-called rice and butterfly wing effect. Water droplets moving effortlessly in the direction indicated on rice leaf and butterfly wing surfaces are shown in Fig. 4.7. Producing effective low cost antifouling surfaces inspired from nature may be possible by embossing patterns onto flexible adhesive backed polymer films. Such films could be applied to flat or curved substrates such as oil pipeline interiors and ship hulls. Embossing has been shown to fabricate various structures yielding sub-micron scale features [24,25]. In Fig. 4.10 replicas fabricated with different pattern/techniques (standard techniques compared to hot embossing technique) are shown. Anti-microfouling test (as inhibition of E. coli growth) were carried out on rice leaves topographies displaying promising results. They believe that the sharp edges of the pillars discourage the settling and eventual colonization of microorganisms on the surface. E. coli are shaped and sized such that the edges provide an inconvenient landing place for such settlement, and thus continue the search for an ideal location to colonize.
Figure 4.7: Rice and butterfly wing effect that combines the shark skin and lotus effects [21]. Shown are water droplets resting atop their superhydrophobic and low adhesion surfaces. Rice leaves contain longitudinal grooves with a transverse sinusoidal pattern and butterfly wings contain aligned shingle-like scales that provide anisotropic flow. Hierarchical structures consisting of micropapillae superimposed by waxy nanobumps in rice leaves and microgrooves on shingle-like scale structures in butterfly wings provide superhydrophobicity and low adhesion. This combination of anisotropic flow, superhydrophobicity, and low adhesion is believed to lead to improved antifouling and self-cleaning [33,21,22].
JERICO–WP4–D4.3–100614–V1.2�
. 25
However, the bioassay carried out with E. coli was very short (2-4 hours), and the proposed technology was not evaluated against other model organisms for the investigation of antifouling properties, such as barnacles, green algae and diatoms.
This paper provides an overview of antifouling work as well as results from new anti-biofouling and previous anti-inorganic fouling research using rice leaf inspired samples. Furthermore the work reviews analytically biomimetic antifouling strategies (Shark skin and lotus leaf, Rice and Butterfly wing effect, Fig. 4.8-4.9) and different antifouling solutions (prevention and cleaning both biomedical and marine).
Nature’s self-cleaning methods are commonly associated with the lotus effect that combines superhydrophobicity and low adhesion, but can also include superhydrophilicity, as demonstrated with pitcher plant. Self-cleaning of lotus leaves occurs when water beads up and rolls off of leaf surfaces carrying contaminants [26,27,28,29]. Conversely, pitcher plant self-cleaning occurs when water uniformly spreads and slides off carrying contaminants [27,30,31]. Similar self-cleaning mechanisms are possible with a variety of liquids, depending on the surface’s ability to repel or attract the liquids.
Even though fouling prevention is the goal, in many cases fouling is not completely preventable and a surface must be cleaned. In response, several self-cleaning coatings have been developed for various applications. Bixler and Bhushan [32] report examples of self-cleaning products including hydrophobic paints, roof tiles, and fabrics as well as self-cleaning hydrophilic windows and membranes.
Figure 4.8 (on the right): Shark skin and lotus leaf effects. Shown is biofouling on the whale and clean shark skin, even though both live in similar environments. The SEM image shows Mako shark skin microstructured riblets that provide low drag and antifouling properties [34]. The lotus effect is illustrated with a water droplet carrying off contaminants from the lotus leaf surface [32].
��������
�
Figure 4.9: Optical profiler height maps of actual rice leaf adapted from Bixler and Bhushan [22]. Arrows indicate the tendencies of fluid flow in transverse and longitudinal directions.
JERICO–WP4–D4.3–100614–V1.2�
. 26
�
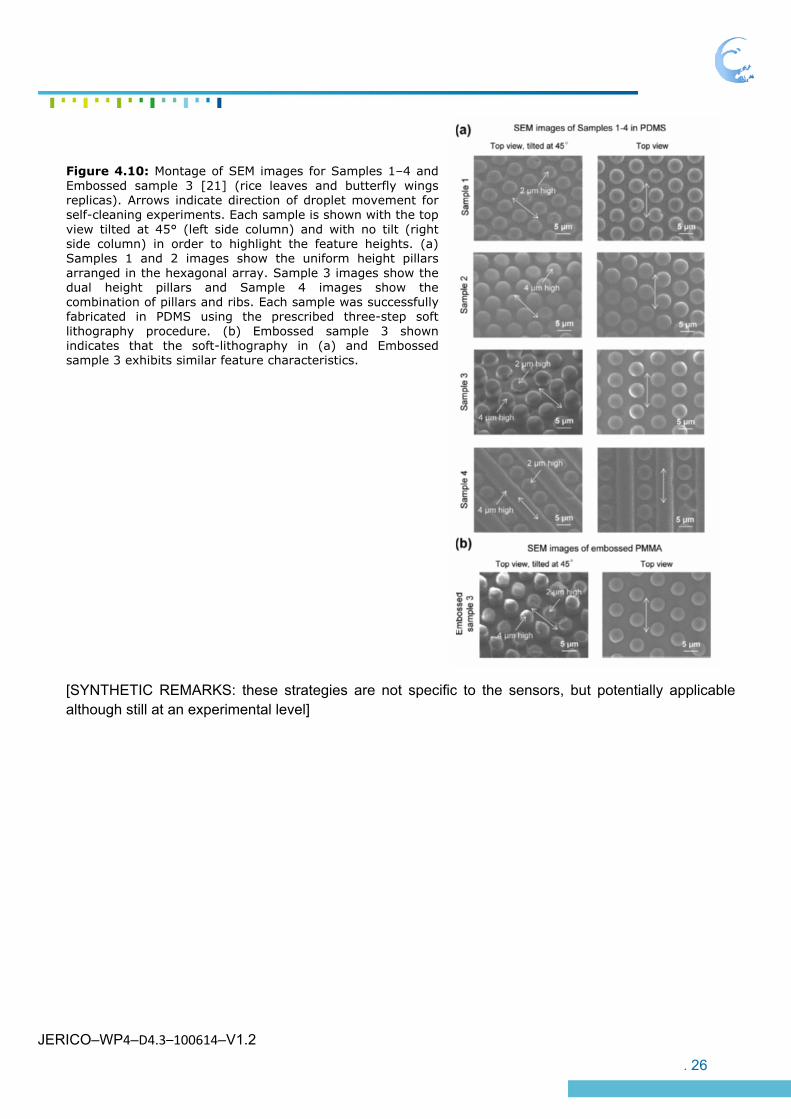
Figure 4.10: Montage of SEM images for Samples 1–4 and Embossed sample 3 [21] (rice leaves and butterfly wings replicas). Arrows indicate direction of droplet movement for self-cleaning experiments. Each sample is shown with the top view tilted at 45° (left side column) and with no tilt (right side column) in order to highlight the feature heights. (a) Samples 1 and 2 images show the uniform height pillars arranged in the hexagonal array. Sample 3 images show the dual height pillars and Sample 4 images show the combination of pillars and ribs. Each sample was successfully fabricated in PDMS using the prescribed three-step soft lithography procedure. (b) Embossed sample 3 shown indicates that the soft-lithography in (a) and Embossed sample 3 exhibits similar feature characteristics.
[SYNTHETIC REMARKS: these strategies are not specific to the sensors, but potentially applicable although still at an experimental level]
JERICO–WP4–D4.3–100614–V1.2�
. 27
4.2. Active strategy
Active strategies include all techniques which require a controlled operation mode and the biofouling prevention efficiency remains energy dependent. Moreover, we have decided to include into this category also the technologies which have an active chemical interaction as antifouling protection.
4.2.1. Technical reports and patents
1. Antifouling System Extends Instrument Deployment by Up to Six Weeks Cristina Windsor, Technical Marketing Specialist, In-Situ Inc. Robert J. Mooney
The TROLL® Shield Antifouling System, developed by In-Situ® Inc., was designed to inhibit biofouling of environmental monitoring instruments.
TROLL® Shield Antifouling Systems were examined for viability on the Aqua TROLL® 200 Instrument. The TROLL Shield System is comprised of a specially formulated copper alloy sensor guard and nose cone.
Figure 4.11: Aqua TROLL 200 Instrument with complete TROLL Shield
Antifouling System
Three Aqua TROLL 200 Instruments were deployed in Pass Christian Harbor, Mississippi in August
2008 and programmed to log water level, specific conductivity, and temperature at 15-minute intervals.
The area is known to be high in both micro- and macro-fouling—with frequent fouling bymicrobes and
barnacles.
Figure 4.12: The control, one Aqua TROLL 200 Instrument with TROLL Shield guard, and another one with TROLL Shield guard and nose cone were tested side-by-side over an 81-day period.
JERICO–WP4–D4.3–100614–V1.2�
. 28
Figure 4.13: The Aqua TROLL 200 control (A) and the Aqua TROLL 200 with TROLL Shield guard and nose cone (B). In C the nose cone is in place and guard removed to show how effectively it protects the conductivity cell from biofouling. The conductivity cell was not cleaned.
This experiment clearly illustrates the superiority of data quality when using the TROLL Shield System for long-term deployments. The TROLL Shield Antifouling System provides protection of both conductivity and pressure sensors in one simple solution.
[SYNTHETIC REMARKS: Commercial technology applicable only on some types of sensors]
2. Leung Kimberly & Charles Ringer IODINE-DISPENSING ANTIFOULANT IMPLEMENTED WITH DISPENSING SHUTTER. Date of Patent: Dec. 31, 2013 United States Patent (10) Patent N0.: US 8,617,484 B1
The disclosed techniques relate to preventing or retarding biofouling of waterborne sensors such as optical lenses.
Sensors, such as optical sensors and other sensors used in an aqueous environment are protected from biological contamination by applying a biocide behind a shutter.
Protection of a sensor in an aqueous environment is achieved by providing a shutter having a facing surface and a reservoir, the shutter being configured to cover a mating surface of the sensor or surrounding a mounting surface in at least a semi-sealing manner. The reservoir is provided in the shutter and is capable of holding a biocide with a limited water solubility and a low environmental toxicity in the aqueous environment, for example anhydrous iodine. The reservoir is in communication with the portion of the sensor while positioned against the portion of the sensor or surrounding mounting surface adjacent to the sensor.
JERICO–WP4–D4.3–100614–V1.2�
. 29
[SYNTHETIC REMARKS: New technology applicable only on some types of sensors]
3. Bringhurst, B., Christensen, C.B., Ewert, D.W., Thurston, J., Downing, J.P. Jr. (2013). Sensor with antifouling control. United States Patent No. US 8,429,952 B1.
A patent presenting several different solutions for protecting from biofouling a sensor in aquatic environments. Most of the proposed solutions are standard techniques (wipers, chemicals and others) with no major modification. The most interesting point is the idea of implementing a “feedback component” (even if no additional detail is provided by authors) to monitor the cleaning effectiveness of biocides and wipers, to adjust the intensity of the cleaning treatment, if needed. The idea of optimizing (considering both effectiveness and energy consumption) sensor cleaning basing on the real needs, seems to be the best way for improving existing antifouling technologies, making possible at the same time to reduce the environmental impact of the cleaning, if biocides are used.
[SYNTHETIC REMARKS: promising and applicable]
4. Thoren, M.D., Piper, A.M. (2013). Method and apparatus for anti-biofouling of a protected surface in liquid environments. United States Patent No. US 8,445,864 B2.
This patent present a new technological solution for improving the performances of UV light as antifouling treatment for surfaces (ship hull and others) immersed in the water. The use of light emitting diodes (LEDs) as source of light, drastically reduce the power demand of this kind of treatment, with a consumption of some hundred mW for each LED. To further increase the effectiveness of the treatment, without increasing power demand, an “optical medium”, i.e. optical fibers, can be used to spread UV over the surface to be treated. These fibers can be parallel or perpendicular to (or even included into) the surface to be treated. “Scattering particles” (e.g. bubbles or nanoparticles) are suggested as possible booster of treatment efficacy.
Such a progress in UV antifouling treatment can represent a good step towards the use of such technology in oceanographic sensors, up to now limited by power demand and effectiveness.
[SYNTHETIC REMARKS: promising and applicable]
JERICO–WP4–D4.3–100614–V1.2�
. 30
5. Farr, N.E., Pontbriand, C.T., Peters, T.G. (2014). Marine environment antifouling system and methods. United States Patent No. US 20140078584 A1.
This patent is similar to the one from Thoren and Piper (2013), mentioned at point 4, i.e. UV light used as antifouling treatment for surfaces. In this case the surface to be protected is optically transparent (window or lens).
[SYNTHETIC REMARKS: promising and applicable]
6. Zouak, J. (2014). UV•XCHANGE BIOFOULING CONTROL: ANY SURFACE, FOUL FREE. Eco Magazine, http://www.eco-tsc.com/blind-pages/uvxchange-biofouling-control-any-surface-foul-free.html.
AML Oceanographic Ltd. designs and manufactures a UV module for antifouling protection of oceanographic sensors, which can be integrated into third party devices/systems. Installed directly on the end cap of the sensor, the module can be set to various positions, to achieve the best coverage of the surface to be protected. Successful in-situ trials in collaboration with the Hawaii Undersea Research Laboratory, the Institute of Ocean Sciences in Sidney, and the Ocean Network Canada are mentioned.
[SYNTHETIC REMARKS: promising product]
4.2.2. Scientific papers
1. M.J. Vucko , P.C. King , A.J. Poole , C. Carl , M.Z. Jahedi & R. de Nys (2012) Cold spray metal embedment: an innovative antifouling technology, Biofouling: The Journal of Bioadhesion and Biofilm Research, 28:3,239-248.
Cold spray is a metal spray process whereby solid metal particles (typically 550 mm) are accelerated to supersonic velocities in an inert gas flow and deposited onto a substratum surface to form a coating.
The study demonstrates that embedment of copper particles into thermoplastic polymers (polymers) using cold spray technology is an effective deterrent against fouling organisms. Two polymers, high-density polyethylene (HDPE) and nylon were metallised with copper powder using cold spray technology.
JERICO–WP4–D4.3–100614–V1.2�
. 31
Figure 4.14: Backscattered SEM images of polymers embedded with copper particles using cold spray technology.
In this study, the ability of cold spray technology to produce Cu-embedded polymers for marine AF applications using a thin layer of embedded metal particles without building up large deposits or coatings was first developed and quantified. Subsequently, the polymers were tested over 250 days to quantify their efficacy as AF materials under intense fouling conditions. After 250 days in the field, Cu-embedded HDPE and copper plate controls were completely free of hard foulers compared to Cu-embedded nylon and polymer controls which were heavily fouled with both soft and hard fouling.
Antifouling (AF) success is related to the interaction between the properties of the polymers (elastic modulus and hardness) and the cold spray process, which affect particle embedment depth, and, subsequently, the release of copper ions as determined by analytical techniques. Embedding metal using cold spray equipment is shown to be an effective AF technology for polymers, in particular those that are difficult to treat with standard AF coatings, with efficacy being a function of the interaction between the cold spray metal and the polymer recipient. The use of cold spray technology as a method of controlling biofouling by embedding metal particles into polymers is an innovative approach, which promises the delivery of new AF materials.
In conclusion, cold spray is an innovative AF technology and its effectiveness has been demonstrated. Cu-embedded polymers, produced using cold spray technology, prevented fouling with similar efficacy to copper plate for at least 250 days. Because of this, bulk polymer properties such as flexibility are not sacrificed and, although further study is needed, the technology can potentially be used on polymers, polymer-hulled vessels, seismic exploration equipment, and aquaculture cages and netting, where fouling impedes functional capacity.
[SYNTHETIC REMARKS: promising and applicable]
2. Kento Yoshida, Hideyuki Kanematsu, Daisuke Kuroda, Hajime Ikigai, Takeshi Kogo and Seiji Yokoyama (2012) Biofouling of Cr-Nickel Spray Coated Films on Steel Surfaces, Journal of Physics:
JERICO–WP4–D4.3–100614–V1.2�
. 32
Conference Series 352 :012031
In this study, a spray coating has been applied to steels, investigating if chromium-nickel spray coating could mitigate the biofouling, being compared with the conventional aluminium-zinc spray coating in marine environments. Various spray-coated steel were immersed in marine environment and the biofouling behaviours were measured, evaluated and discussed. The highest inhibition effect was shown by aluminum zinc spray coated film with sealer.
[SYNTHETIC REMARKS: not applicable for sensor]
3. C. Debiemme-Chouvya, Y. Huaa, F. Huia, J.-L. Duvalc, D. Festy, H. Cacheta (2011) Electrochemical treatments using tin oxide anode to prevent biofouling, Electrochimica Acta 56 (2011) 10364– 10370
Electrochemistry could be a very efficient tool for biofouling prevention in two ways, either by local biocide production through seawater electrolysis or by immobilizing electrogenerated biocides. In this paper, both strategies were developed and illustrated in the particular case of tin dioxide as anode material. Chloride and bromide ions present in seawater are efficiently oxidized at antimony doped tin dioxide to form biocidal hypohalogenous acids, namely HOCl and HOBr. Underwater optical instruments having glass window coated with a transparent tin dioxide layer can be effectively protected against biofouling without environmental damages because hypohalogenous acids are produced at a low level and on the window itself.
Another possibility explored in this paper has been to perform a pre-treatment of the surface to be protected. It consists in seawater electrolysis in the presence of organic macromolecules, as for instance bovine serum albumin. In these conditions, chlorinated and brominated organic deposit is formed on the tin oxide surface as proved by EDX and XPS analyses. By testing adhesion and growth of E. coli bacteria, it was shown that this deposit possesses biocidal property. Actually, this property is due to the presence of chloramine and bromamine groups. Another way is to use hypohalogenous acids, namely hypochlorous (HOCl) or hypobromous (HOBr) acids. They can be generated either chemically by the slow dissolution of tablets (salt) or by the electrochemical oxidation of chloride or bromide ions.
It has been shown that biofouling in seawater could be efficiently prevented by electrochemical treatments based on chloride and bromide oxidation leading to the formation of hypochlorous and hypobromous acids as the most active biocidal products.
Two ways have been explored: (i) local biocide production and (ii) immobilization of electrogenerated biocides.
The first one was illustrated by the protection of glass windows against biofouling by depositing a conductive and transparent antimony doped tin oxide layer on top of the window. Electrolysis of seawater allows us to keep clean the window over a long period. Since the current density is small, the flux of biocidal compounds is very tiny and the protective effect is localized at the very surface with a limited environmental impact.
JERICO–WP4–D4.3–100614–V1.2�
. 33
Figure 4.15: Effect of a progressive exposure up to three month exposure in the Brest bay on the surface of unprotected and protected optical window. The protected optical window is coated by spray pyrolysis with ATO/FTO bi-layer with an uncovered circular disc performed in order to check the spatial extension of the electrochemical antifouling protection. Image from Ifremer.
The second way is also based on seawater electrolysis but in the presence of organic macromolecules. Taking BSA as a model protein, and using EDX and XPS analyses, it was demonstrated that electrogenerated HOCl and HOBr react with BSA leading to their aggregation and to the modification of some amine groups into chloramine and bromamine groups. As a result, an organic film is formed at the tin oxide surface having biocidal property. The latter was proved by testing the adhesion and growth of E. coli bacteria.
[SYNTHETIC REMARKS: potentially applicable although still at an experimental level.]
4. James Chapman, Laurianne Le Nor, Robert Brown, Eolann Kitteringham, Sonia Russell, Timothy
Sullivan and Fiona Regan. Antifouling performances of macro- to micro- to nano-copper materials
for the inhibition of biofouling in its early stages. J. Mater. Chem. B, 2013, 1, 6194
In this paper the performance of different forms of copper (macro, micro and nano) for application as
antifouling materials has been investigated. Samples has been deployed in SmartBay Ireland for four
weeks and analysed for evidence of biofouling. It was found that copper in its nano form, produced the
greatest antifouling effectiveness in both PDMS and sol–gel matrices.
Consistently the nano form of copper has demonstrated best antifouling responses in each of the
assays for overall biofouling characterisation. A benchmark using the best performing commercial
antifouling paints also show the merit of the materials.
JERICO–WP4–D4.3–100614–V1.2�
. 34
Figure 4.16: Drying procedure for the copper particles in each polymer. Shaded zone indicates inactive polymer zone.
[SYNTHETIC REMARKS: promising and applicable]
5. James Chapman and Fiona Regan*Nanofunctionalized Superhydrophobic Antifouling Coatings for Environmental Sensor Applications - Advancing Deployment with Answers from Nature. ADVANCED ENGINEERING MATERIALS 2012, 14, No. 4
In this work, a novel preparation for superhydrophobic nanofunctionalized silver and gold, coppercoated substrates as potential antifouling coatings for environmental monitoring devices has been fabricated. The superhydrophobic coating is topographically similar to the design of the Lotus leaf (Nelumbo necifera) and was synthesized by creating an electroless galvanic reaction between copper and the metal salt. In doing so, a nano- and micro-topographical structure was created on the surface of a copper substrate which can be rendered superhydrophobic through the addition of a self-assembled monolayer (SAM) of CF3(CF2)7CH2CH2SH.
Figure 4.17: Left: Scanning electron micrograph showing the micro and nano texturing of Ag on the copper substratum before superhydrophobic treatment. Right: Contact angle of superhydrophopic copper substrate showing 178° angle.
The work investigates whether the hydrophobicity of such materials affects micro-organism attachment and subsequent biofouling. The materials have been deployed in a marine environment in Dublin, Ireland for a 6-week study to determine the overall antifouling capacity. The materials have been analyzed for biomass, slime (glycocalyx) production and more specifically protein and carbohydrate adsorption all of which are attributed to the inherent makeup of biofilm and exopolymeric substances (EPS) which are secreted by micro-organisms during the biofouling process. This work highlights the dominance of combinational antifouling approaches rather than single tactics for such a complex problem and one that plagues multiple research areas. This novel approach in developing a new
JERICO–WP4–D4.3–100614–V1.2�
. 35
antifouling material for sensors, and indeed, any aquatic platform has shown excellent results throughout.
Figure 4.18: Left: Fouling of sensor sonde. Right: Contact angle of Superhydrophopic material track showing no obvious signs of fouling following week 4.
Overall, Ag superhydrophobic coatings have shown the greatest promise as a candidate for antifouling coatings for environmental monitoring devices. When used as a ‘‘double’’ antifoulant (i.e., superhydrophobicity and Ag as a biocide) this proves to be an effective alternative when using Cu substrates alone.
[SYNTHETIC REMARKS: promising and applicable]
6. Gómez Olmedilla, D. (2012). Preventing the growth of barnacles by using ultrasonic sound. Master of Science Thesis in Sound and Vibration, Chalmers University Of Technology, Sweden: 78pp.
The use of ultrasounds (US) as antifouling treatment has been very limited, until now, due to power constraints and reduced effectiveness. VOLVO PENTA AB., an important international company which produces marine engines, has co-funded a study program on the use of US as antifouling treatment for marine structures (in this case mainly ship hulls). The results shows how US influence settlement preferences of barnacle larvae on different materials, but the most interesting thing is that such a company invest in this kind of technology, highlighting that it could be a promising alternative for the future. Before this option can be really applicable, it will require major improvements, mainly for what concerns energy consumption, but this work and the interest demonstrated by VOLVO PENTA AB shows that some investments are being made in this direction.
[SYNTHETIC REMARKS: promising and applicable]
JERICO–WP4–D4.3–100614–V1.2�
. 36
5. Survey on biofouling problem perception and prevention approaches and practices in JERICO
The survey was carried out within the JERICO community, i.e. amongst the member of the project consortium. Answers were provided by 19 partners for 23 platforms and 54 sensors/sensors systems.
The questionnaire was organized in 2 parts: Part A aiming in collecting information on the perception of the problem and the most common approaches used to afford this problem, and Part B focussed to collect information for specific sensors/systems in use. A further questionnaire was sent as an addendum to the first, to investigate with more detail some specific issues resulting from the discussion on biofouling problem at JERICO Fixed Platforms Workshop in Rome.
5.1. Biofouling problem perception
A1: Is biofouling a problem in your observing activities?
100% of the participants indicate that biofouling represents a problem in their observing activities.
A2: How much does biofouling influence the way in which you plan your observing activities (as a fraction of the total money and time invested on a percentage scale)?
A3: How much does biofouling influence the way in which you conduct your monitoring activities (as a fraction of the total money and time invested on a percentage scale)?
Figure A2.1: How much biofouling influences the total amount of money invested by partners for planning and conducting their observing activities
JERICO–WP4–D4.3–100614–V1.2�
. 37
For what concerns money (Fig. A2.1), for 18 platforms there is no difference in biofouling influence on planning and on conduction of observing activities. Among these platforms, most partners indicate that biofouling influence on the expenses for the mentioned activities is 10% of the total.
On the other hand, for 22% of platforms (2 from UK, 1 from SE, 1 from FR, 1 from IT) partners indicate that biofouling influences the conduction of observing activities 10-20% more than the planning.
Figure A2.2: How much biofouling influences the total amount of time invested by partners for planning and conducting their observing activities
For what concerns time (Fig. A2.2), for 77% of platforms there is no difference in biofouling influence on planning and on conduction of observing activities. Among these platforms, most partners indicate that biofouling influence on the time spent for the mentioned activities is 10% of the total.
In 26% of platforms (2 from UK, 1 from SE, 1 from SP, 1 from FR, 1 from DE) biofouling influences the conduction of observing activities 10-30% more than the planning.
Geographic distribution has no influence both on money and on time related answers, with a uniform distribution of data between temperate seas (Mediterranean) and colder areas (Atlantic, Baltic Sea).
JERICO–WP4–D4.3–100614–V1.2�
. 38
5.2. Biofouling prevention approaches
A4: In the list of anti-biofouling techniques below, please indicate the ones which you currently use.
In 70% of partner’s infrastructures/installations, mechanical devices are used to avoid unwanted biological growth on oceanographic sensors (Fig. A4.1).
Figure A4.1: Antifouling techniques used by partners
Among these systems, there are manual periodic cleaning, wipers, transparent films to be periodically replaced, pressurized air and others.
57% of infrastructures/installations are equipped with uncontrolled biocide generation systems, like copper plates/tubing/shutters, zinc chloride paste, antifouling paints (also containing TBT).
26% of infrastructures/installations are equipped with controlled biocide generation systems, like electrochlorination and automatic washing with chemicals. It is interesting to note that, even if these systems can be much more “environmentally friendly” than uncontrolled biocide generation, they are used in less than half of the platforms. This can be due both to economic and reliability factors.
It has to be noted that some of the techniques mentioned by partners (e.g. SeaBird systems) use a mixed approach coupling, for example, uncontrolled biocide generation with mechanical cleaning. In these cases, for the calculation of the percentages exposed here, it has been taken into account just the option (e.g. uncontrolled biocide generation) marked by the partner, disregarding any other coupled technique (e.g. mechanical cleaning).
JERICO–WP4–D4.3–100614–V1.2�
. 39
A5: In the list of anti-biofouling techniques below, please indicate the ones which you think are currently the most effective.
The answers given by partners reflect the ranking of techniques they already use (A4), with an important difference for what concerns uncontrolled biocide generation. This technique is applied in 57% of platforms, as indicated in A4, but it is considered the most effective only in 39% of cases (Fig. A5.1). This discrepancy could be due to the fact that uncontrolled biocide generation is, usually, a low cost solution, even if in partners' opinion it does not provide the best results.
Figure A5.1: Antifouling techniques considered to be most effective by partners
A6: In the list of anti-biofouling techniques below, please indicate the ones which you think show the greatest promise for the future.
Also in this question mechanical devices are ranked first (Fig. A6.1), while controlled biocide generation systems are considered more promising than uncontrolled ones. Taking into account partner’s notes, reliability and environmental sustainability are considered to be extremely important for possible future enhancements of antifouling technologies for oceanographic sensors.
It is interesting to note that irradiation systems, currently not used by any partner, are considered promising in 9% of cases, in particular when UV lamps with lower energy consumption will become available.
JERICO–WP4–D4.3–100614–V1.2�
. 40
Figure A6.1: Antifouling techniques considered by partners to be most promising for the future
A7: In your view, which of the following modes of action would be preferable for an anti-
biofouling system:
� Active: the system requires a power supply in order to function (i.e. it needs to be energized to work, and possibly could be turned on and off);
� Passive: the system does not require a power supply in order to function (i.e. it is always working, and cannot be turned off).
In line with the previously mentioned considerations regarding economic aspects and reliability, passive mode of action is considered to be preferable in most cases (Fig. A7.1).
Figure A7.1: Preferred modes of action of partners (active-passive means that the partner has checked both options)
JERICO–WP4–D4.3–100614–V1.2�
. 41
A8: In your view, is there any advantage to using closed-path sensor systems (i.e. systems where sensors are served by a single, closed hydraulic circuit with just one entrance and one exit for a sample stream) over open-path ones, from the perspective of the biofouling (biofilm/slime, hard-fouling, soft-fouling) problem (e.g. extended operational life, easier maintenance, other)?
Nearly 70% of partners have answered that closed-path systems can give advantages, explaining that:
- they are more protected against biofouling and can stand for longer deployment periods;
- the space to be protected is smaller;
- in this way the sensor is sheltered from light, therefore biological growth is reduced.
This could be a useful indication for sensor producers, in order to achieve a better antifouling protection of oceanographic probes.
A9: Are you aware of any recurring differences in the extensions/distributions of the various types of biofouling (biofilm/slime, hard-fouling, soft-fouling) between physical, optical and chemical sensors?
About 74% of partners answered that they are not aware of any difference (Fig. A9.1). It could seem strange that different kinds of instrument show no influence on biofouling growth, but the answer given by partners could be explained by the fact that this biological phenomenon is not examined in depth during/after sensors deployment. The Biofouling Monitoring Program carried out within JERICO (see the Appendix) can help to throw light on this point.
Figure A9.1: Awareness of partners of any differences in the extension/distribution of the various kinds of biofouling between physical, optical and chemical sensors
A10: Do you have any suggestions for choosing / promoting / developing new antibiofouling systems for specific sensor(s) or sensor system(s)? Some partners have highlighted innovative technologies being developed by different groups, including energised bubble systems and engineered, non-toxic surface/coatings designed to inhibit organism’s settlement and growth. Others have underlined the necessity of having antifouling systems with a low impact on the environment, on sensor materials and on the performed measurement.
JERICO–WP4–D4.3–100614–V1.2�
. 42
A11: In the list of sensors below, please indicate only the ones that you are currently using on your infrastructures/installations
Figure A11.1: Physical sensors currently used on partners platforms (indicated as fraction of the total number of platforms which have physical sensors installed); other = waves
Figure A11.2: Optical sensors currently used on partners platforms (indicated as fraction of the total number of platforms which have optical sensors installed); PAR = Photosynthetically Active Radiation; other = CO2, nitrates, phycocyanin fluorescence, CDOM, optode, oil spill, cyanobacteria, PAH
Figure A11.3: Chemical sensors currently used on partners platforms (indicated as fraction of the total number of platforms which have chemical sensors installed); other = hydrocarbons, total carbon dioxide, nitrates, pCO2, passive sampler/extractor for contaminants
JERICO–WP4–D4.3–100614–V1.2�
. 43
5.3. Biofouling prevention practices
B1: Sensor description(s): kindly report the parameter/measurand being measured, the instrument manufacturer(s), the instrument model(s), and the operating depth(s).
The largest part of sensors installed by partners are physical, while only very few are chemical (Fig. B1.1). Each of the partner’s platform hosts 2-10 sensors. Operating depths ranges from few meters to 1700 m, but most of the instruments are positioned at less than 50 m of depth. These sensors, of course, are the most exposed to biofouling growth.
The fact that the answers to this question does not reflect the results of A11 could indicate that in the Part A partners referred also to other platforms which they did not include in Part B.
Figure B1.1: Sensors installed by partners
B2: Do you currently apply any anti-fouling measure(s) for this(these) sensor(s)?
In most cases antifouling solutions are applied by partners mainly for optical and chemical sensors. Regarding physical sensors, such solutions are applied mainly for conductivity sensors. The antifouling techniques most widely applied includes manual cleaning, wipers, copper plates and chemical biocides, as per partners’ answers to A4.
Figure B2.1: Current use of antifouling measures in partners’ sensors
JERICO–WP4–D4.3–100614–V1.2�
. 44
B3: Can you provide an estimate of the minimum maintenance-free duty cycle(s) (days or months) for your sensor(s) furnished with an anti-biofouling system?
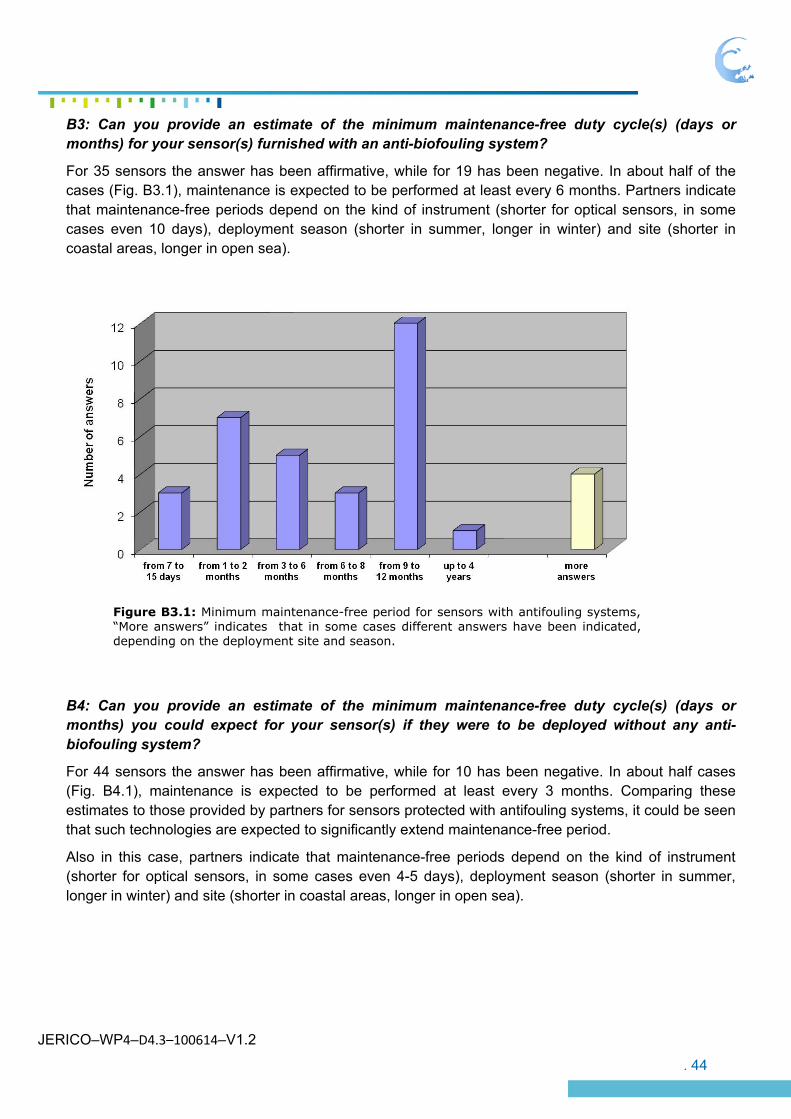
For 35 sensors the answer has been affirmative, while for 19 has been negative. In about half of the cases (Fig. B3.1), maintenance is expected to be performed at least every 6 months. Partners indicate that maintenance-free periods depend on the kind of instrument (shorter for optical sensors, in some cases even 10 days), deployment season (shorter in summer, longer in winter) and site (shorter in coastal areas, longer in open sea).
Figure B3.1: Minimum maintenance-free period for sensors with antifouling systems, “More answers” indicates that in some cases different answers have been indicated, depending on the deployment site and season.
B4: Can you provide an estimate of the minimum maintenance-free duty cycle(s) (days or months) you could expect for your sensor(s) if they were to be deployed without any anti-biofouling system?
For 44 sensors the answer has been affirmative, while for 10 has been negative. In about half cases (Fig. B4.1), maintenance is expected to be performed at least every 3 months. Comparing these estimates to those provided by partners for sensors protected with antifouling systems, it could be seen that such technologies are expected to significantly extend maintenance-free period.
Also in this case, partners indicate that maintenance-free periods depend on the kind of instrument (shorter for optical sensors, in some cases even 4-5 days), deployment season (shorter in summer, longer in winter) and site (shorter in coastal areas, longer in open sea).
JERICO–WP4–D4.3–100614–V1.2�
. 45
Figure B4.1: Minimum maintenance-free period for sensors without any antifouling systems. “More answers” indicates that in some cases different answers have been indicated, depending on the deployment site and season.
B5: Are you aware of any recurring differences in the extensions/distribution of the different types of biofouling (biofilm/slime, hard-fouling, soft-fouling) in relation to the depths at which your sensors are placed?
Even if most partners have answered negatively to this question (Fig. B5.1), those who have answered affirmatively indicate that they observe higher biofouling development at lower depths, in particular for algae. Observations regarding thermocline influence on nutrients distribution have also been submitted by partners.
The fact that 70% of answers are negative confirms what has been proposed in A9 discussion, i.e. that this biological phenomenon is not examined in depth during/after sensors deployment.
Figure B5.1: Partners aware or not of any differences in the type of biofouling related to sensor depth
JERICO–WP4–D4.3–100614–V1.2�
. 46
B6: Are you aware of any recurring differences in the extensions/distributions of the different types of biofouling (biofilm/slime, hard-fouling, soft fouling) affecting your sensor(s) or sensor system(s) in relation to the season of the year (spring, summer, autumn, winter)?
The major part of answers has been affirmative (Fig. B6.1), and in most cases partners indicate that during spring/summer biofouling pressure is higher than in other seasons. Also in this case, it has to be noted the fact that 35% of answers are negative.
Figure B6.1: Partners aware or not of any differences in the extension/ distribution of biofouling related to season.
B7: In your view, which are the parts of your sensor(s) or sensor system(s) that are most affected by biofouling?
80% of partners have indicated that sensing area is more affected by biofouling, with respect to housing/container (Fig. B7.1).
Figure B7.1: Parts of the sensor considered most affected by biofouling
B8: In your view, which type of biofouling (biofilm/slime, hard fouling, soft fouling) constitutes the main problem for the housing/container of your sensor(s) or sensor system(s)? (multiple choice allowed)
The answers given by partners show no clear dominance of one option (Fig. B8.1).
Figure B8.1: Type of biofouling considered as the main problem for housing/container
JERICO–WP4–D4.3–100614–V1.2�
. 47
B9: In your view, are some types of organisms more likelier than others to be the principal agents of the kind of biofouling you have indicated as the major problem for the housing/container of your sensor(s) or sensor system(s)? (multiple choice allowed)
57% percent of answers has been affirmative, and among the organisms indicated by partners (Fig. B9.1), mussels and barnacles prevail. No clear geographic distribution of answers can be observed.
Figure B9.1: Organisms considered as the main constituent of the biofouling which causes problems on sensor housing/container
B10: In your view, are there any types of organisms that, while not directly involved in the kind of biofouling you have indicated as the major problem for the housing/container of your sensor(s) or sensor system(s), can contribute significantly to the overall deterioration in instrument performances? (multiple choice allowed)
Only 44% of answers have been affirmative, with a clear dominance of unidentified organisms (Fig. B10.1).
Figure B10.1: Organisms which can contribute significantly to the overall degradation of instrument performances
JERICO–WP4–D4.3–100614–V1.2�
. 48
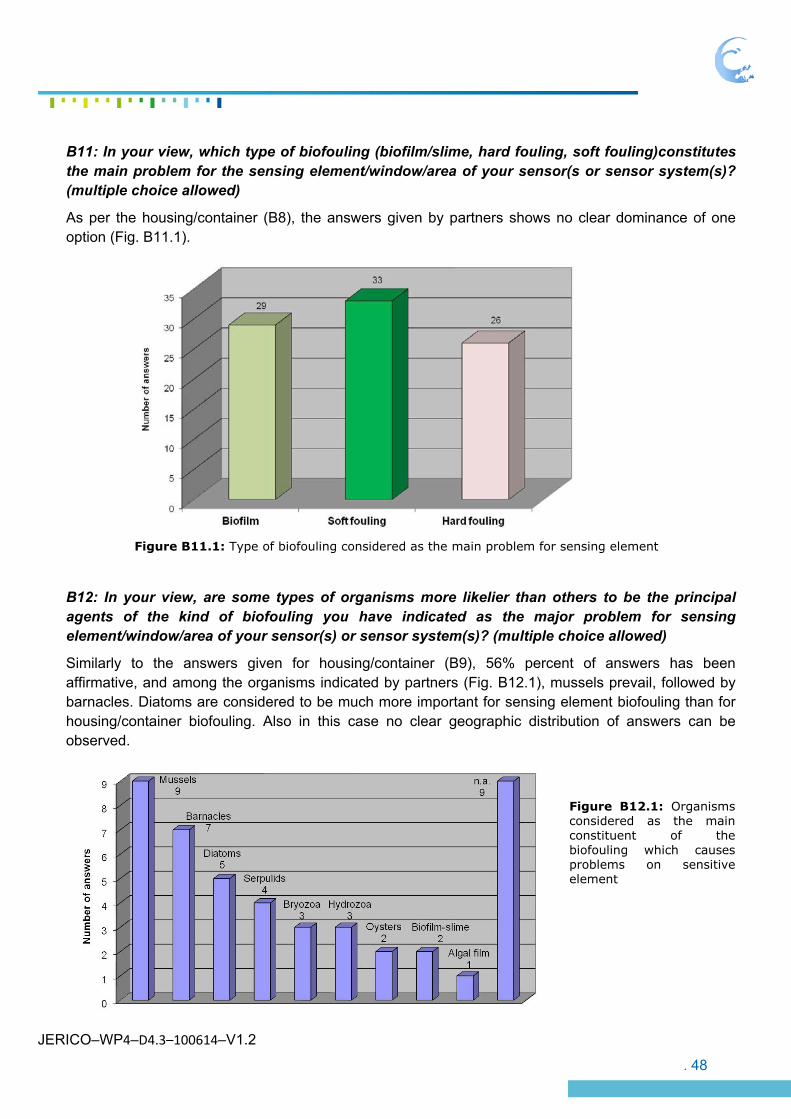
B11: In your view, which type of biofouling (biofilm/slime, hard fouling, soft fouling)constitutes the main problem for the sensing element/window/area of your sensor(s or sensor system(s)? (multiple choice allowed)
As per the housing/container (B8), the answers given by partners shows no clear dominance of one option (Fig. B11.1).
Figure B11.1: Type of biofouling considered as the main problem for sensing element
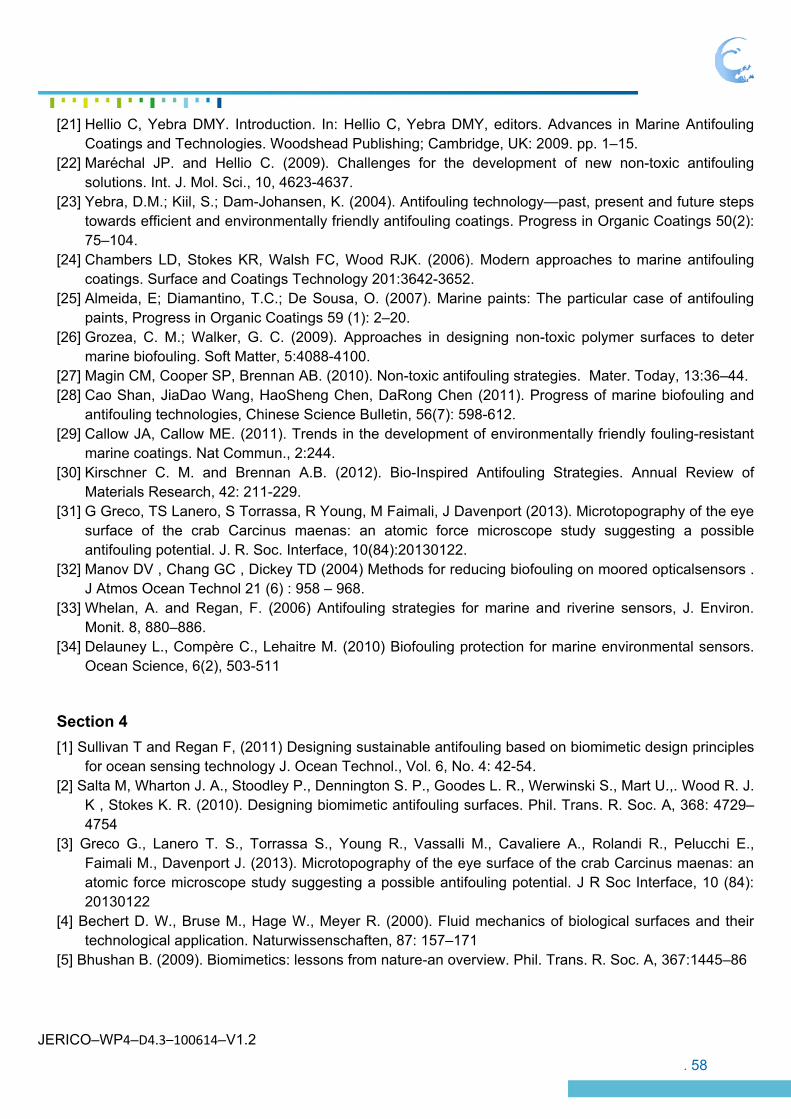
B12: In your view, are some types of organisms more likelier than others to be the principal agents of the kind of biofouling you have indicated as the major problem for sensing element/window/area of your sensor(s) or sensor system(s)? (multiple choice allowed)
Similarly to the answers given for housing/container (B9), 56% percent of answers has been affirmative, and among the organisms indicated by partners (Fig. B12.1), mussels prevail, followed by barnacles. Diatoms are considered to be much more important for sensing element biofouling than for housing/container biofouling. Also in this case no clear geographic distribution of answers can be observed.
Figure B12.1: Organisms considered as the main constituent of the biofouling which causes problems on sensitive element
JERICO–WP4–D4.3–100614–V1.2�
. 49
B13: In your view, are there any types of organisms that, while not directly involved in the kind of biofouling you have indicated as the major problem for the sensing element/window/area of your sensor(s) or sensor system(s), can contribute significantly to the overall deterioration in instrument performances? (multiple choice allowed)
Only 31% of answers have been affirmative (even less than those to the same question regarding housing/container, B10), with a clear dominance of unidentified organisms (Fig. B13.1).
Figure B13.1: Organisms which can contribute significantly to the overall deterioration in instrument performances
B14: In your view, does biofouling influence the quality of the data furnished by your sensor(s)/sensor system(s) over time during a deployment?
About 2/3 of partners have answered affirmatively (Fig. B14.1). It is interesting to note that, in most cases, answers to this question reflect those given to B2. It seems that, on the sensors of which collected data can be influenced by biofouling, partners apply antifouling protection. This is a good indication about biofouling-related problems awareness by partners.
Figure B14.1: Awareness of partners of any biofouling impact on data quality
Many comments have been received with the answers to this question, in particular regarding direct influences (oxygen consumption, optical windows sheltering, pumps blockage) of organisms growing on sensitive surfaces. As countermeasures, visual check of biofouling growth on these parts of the probes, corrections applied to data drifts comparing sensors reading with in-situ measurements, check of consistency with other collected data are used by partners (see also ADD4).
JERICO–WP4–D4.3–100614–V1.2�
. 50
B15: If you think that biofouling can affect the data furnished by your sensor(s)/sensor system(s) over time during a deployment, are you able to distinguish between effects attributable principally to a deterioration in the condition of the housing(s)/container(s) and those caused by the degradation of the sensing element(s)/window(s)/area(s)?
Only 22% of partners has answered affirmatively (Fig. B15.1), explaining that this can be done thanks to an expert view or calibration data sheets. One partner stated that the answer could be “yes and no”, giving some examples of cases in which this is possible or not.
Figure B15.1: Partners able to distinguish between effects on collected data attributable to a deterioration in the condition of the housing and those caused by the degradation of the sensing element
Given that, for most sensors, it seems to be impossible for the partners to discern if data have been affected by deterioration in the conditions of the housing or of the sensing element, it results to be very important to protect both these parts of sensors from biofouling.
B16: Kindly provide an estimate of how much you spend annually for the anti-biofouling system(s) of your instrumentation, considering the following: purchase price of the system, implementation of the system, maintenance & consumables, others.
The answers provided by partners (Fig. B16.1) clearly show that more than half of the total annual expenses for antifouling systems of their oceanographic sensors is for maintenance & consumables. On the other hand, the purchase price of the antifouling system accounts for less than 20% of the total annual expenditures. The mean annual expense for each sensor / sensor system is about 8.5K€, but in half cases is less than 1K€ (Fig. B16.2). As it can be seen in Fig. B16.3, no clear geographic distribution can be observed.
Figure B16.1: Estimated annual expenditure for the antifouling systems of the 22 sensors / sensors system for which an answer has been provided
JERICO–WP4–D4.3–100614–V1.2�
. 51
Figure B16.2: Estimated annual expenditure, divided by class, for the antifouling systems of the 22 sensors / sensors system for which an answer has been provided
Figure B16.3: Estimated annual expenditure, divided by country, for the antifouling systems of the 22 sensors / sensors system for which an answer has been provided
5.4. Additional questions on biofouling-related issues
After the distribution of the questionnaire to the partners, some additional questions have been proposed by IFREMER (Laurent Delauney). Answers were provided by 10 partners.
C1: Do you think that biofouling-related issues are really taken into account by sensor developers? If not, can you explain your point of view in few words
Only 10% of partners think that such issues are not taken into account by sensor developers (Fig. C1.1). This indicates that there is a growing concern by manufacturers about biofouling prevention, in particular for long term deployments.
Partners explain also that some kinds of sensor (e.g. electrochemical dissolved oxygen probes) are still very sensitive to biofouling related issues, and specific procedures to clean those devices require human efforts. Where and when biofouling pressure is very high, human intervention is necessary for cleaning also other kinds of sensor.
Partners point out that conductivity cells that are highly dependent on geometry, and therefore affected by biofouling, have been substantially improved through the use of envelopes that are more resistant to biofouling.
On the other hand, some manufacturers use materials/structure that are hard to keep clean with simple solutions or which are not compatible with common cleaning agents.
JERICO–WP4–D4.3–100614–V1.2�
. 52
Figure C1.1: Partners thinking that biofouling-related issues are really taken into account by sensor developers
C2: Do you take into account biofouling prevention when you choose a sensor among different providers? If yes, can you explain how?
80% of partners have answered affirmatively (Fig. C2.1), explaining that their evaluation is based on experience, sensor structure and technology, availability of antifouling systems by sensor producer or by third party, field tests, users and manufacturer feedback. However, it has been underlined that the selection of a new instrument is often a compromise (availability / reliability / sensitivity / robustness / tradition / price).
Figure C2.1: Partners taking into account biofouling prevention when choosing a sensor
C3: When you deploy a biofouling prevention system for a sensor, do you evaluate the in situ biofouling pressure? If yes, can you give three criteria?
Just 60% of partners evaluate in situ biofouling pressure when deploying a biofouling prevention system (Fig. C3.1). This kind of evaluation is performed basing on deployment depth (parameter taken into account by nearly all partners who have answered affirmatively), seasonality, temperature, light intensity, orientation/exposure, chl a, stability of measurements with time, visibility of biofouling and, in one case, even taking samples for genomic studies.
The partners who have answered negatively explain that the conditions are relatively well known in the deployment sites; in some cases they have developed best-practice guidelines based on experience to define deployment time-windows, while in one case the maintenance is subcontracted and this topic is taken into account by the subcontractor.
Figure C3.1: Partners evaluating in situ biofouling pressure when deploying a biofouling prevention system
JERICO–WP4–D4.3–100614–V1.2�
. 53
C4: Considering biofouling-related measurement drifts during sensor deployment, do you apply any post-treatment to data in order to compensate the drift? If yes, can you briefly explain how do you set up the correction model?
Half of the partners apply corrections to the collected data, to compensate biofouling-related drifts (Fig. C4.1). Such correction is usually based on periodic calibrations, performed on site, or it is carried out comparing the data collected by different sensors deployed in the same area. In one case, when the sensors are recovered, calibration experiments are performed before and after maintenance and fouling removal.
Half of the partners do not apply any kind of correction, stating that their measurements taken during long period deployments are not affected by biofouling, or that they discard the data regarded as invalid (explaining that invalidation remains somewhat subjective).
Regardless of their answer, many partners comment that it is not easy to correct such drifts. This is a very good point, showing that biofouling-related measurement errors should be prevented, rather than corrected.
Figure C4.1: Partners who compensate biofouling-related measurement drifts
5.5. Summary of outcomes from the survey
Most partners take into account biofouling prevention when choosing a sensor among different providers, and to avoid biofouling growth most of their infrastructures/installations use mechanical devices and uncontrolled biocide generation system (Fig. A4.1), choice which can be attributed to economic and reliability aspects. Regarding uncontrolled biocide generation, many partners point towards “smarter” solutions, like controlled biocide generation (Fig. A6.1), feeling confirmed by the necessity expressed by partners of having antifouling systems with a lower environmental impact. Most partners consider advantageous also closed-path systems, which is, conversely, a solution rarely applied by sensor producers. However, nearly all partners think that biofouling-related issues are really taken into account by sensor developers (Fig. C1.1), highlighting that there is a growing concern by manufacturers about biofouling prevention, in particular for long-term deployments. In parallel, it seems that there is still a large potential for growth of this market.
When biofouling affects the measured data provided by the sensors, about for only 20% of sensors it seems to be possible to distinguish between the effects attributable to a deterioration of the housing and those caused by the degradation of the sensing element (Fig. B15.1). This underlines the need of protecting the whole sensor.
All the partners are aware that biofouling represents a real problem in their observing activities, even if most of them indicate that it influences money and time spent for the mentioned activities by only a 10% of the total (Fig. A2.1 - A2.2). Annual expenses for antifouling systems in half of the cases is less
JERICO–WP4–D4.3–100614–V1.2�
. 54
than 1K€ (in more than 25% of the cases is less than 0.5K€; Fig. B16.2). One third of partners sensors do not have even any antifouling protection (Fig. B2.1).
Most of the partners indicate that they are not aware of any recurring differences in the extensions/distributions of the various types of biofouling (biofilm/slime, hard-fouling, soft-fouling) related to the kind of sensor (physical, optical, chemical; Fig. A9.1) or to the depth at which the sensor is placed (Fig. B5.1). About one third of partners is not aware of any difference even in relation to the seasons of deployment (Fig. B6.1). Moreover, just 60% of partners evaluate in situ biofouling pressure when deploying a biofouling prevention system (Fig. C3.1).
All these data suggest that biofouling phenomenon is not examined in depth before, during and after sensor deployment, even if partners are aware that it causes significant problems.
Indeed, two third of partners confirm that biofouling influence the quality of the data collected by their sensors over time during a deployment (Fig. B14.1), and questionnaire answers suggest that, on the sensors subjected to accuracy loss due to biofouling, partners apply antifouling protection.
Half of the partners apply corrections to collected data, to compensate biofouling-related drifts.
For about half of the sensors protected with antifouling systems, maintenance is expected to be performed at least every 6 months (Fig. B3.1). On the other side, for about half of the sensors not protected with such systems, maintenance is expected to be performed at least every 3 months (Fig. B4.1).
This confirms both the awareness of partners for what concerns biofouling-related issues and the (partial, at least) efficacy of the applied antifouling technologies. However, on-site maintenance of sensors is very expensive and there is still a strong need of reducing the frequency of such operations implementing new and/or optimized techniques.
JERICO–WP4–D4.3–100614–V1.2�
. 55
6. Conclusions
The bibliographic review presented in the first part of this report shows that, in the field of biofouling protection for oceanographic sensors, just few innovations have seen the light during the last years.
Among these, the most interesting and promising approach to developing novel sustainable solutions to biofouling is known as biomimetic design. This involves the study, characterization and transfer of natural antifouling mechanisms (surface topography and surface chemistry) utilized by aquatic organisms into artificial antifouling materials or solutions.
From the application point of view, this biomimetic antifouling approach, based on physical and mechanical principles, seems to be particularly suitable in specialized markets such as the marine sensors one, thanks to the small surface area to be protected and the kind of materials utilized in the construction of these instruments.
Currently, just a small number of lab/pilot applications of biomimetic surfaces exists, and it is quite hard to think that such technology will be used widely in the next years, mainly due to cost and scaling-up related issues, even though they remain extremely promising.
On the other side, as it shows the survey performed among Jerico partners, there is a strong need for antifouling technologies which could make sensor deployment and maintenance (and, therefore, data acquisition) less expensive, guarantying the quality of collected data during long-term deployments. Such solutions should be reliable, cost-effective, and environmentally friendly and should require a reduced maintenance. All these things in an extreme environment as the open ocean one.
Answering this need is a hard challenge, which requires both basic research on biology, material science, engineering, chemistry (and other fields) and, at the same time, a strong technology transfer to and collaboration with private companies.
JERICO–WP4–D4.3–100614–V1.2�
. 56
JERICO–WP4–D4.3–100614–V1.2�
. 57
References
Section 3 [1] Terlizzi A, Faimali M (2010). Biofouling Processes in Industry - Fouling on artificial substrata. In: Dürr S,
Thomason JC (eds). Biofouling. Blackwell Publishing. pp. 170-184. [2] Alberte, R.S., Snyder. S., Zahuranec, B.J. & Whetstone, M. (1992). Biofouling research needs for the
United States Navy: program history and goals. Biofouling, 6, 91-95. [3] Meesters K.P.H., Groenestijin J.W. and J. Gerritse (2003). Biofouling reduction in recirculating cooling
system through biofiltration of process water, Wat. Res. 37 pp. 525–532. [4] Jun S & Puri VM, (2005). 3D milk-fouling model plate heat exchangers using computational fluids
dynamics. Int. J. Dairy Thecnol., 58(4): 214-224. [5] Archibald, L. K., and R. P. Gaynes (1997). Hospital acquired infections in the United States: the
importance of interhospital comparisons. Nosocomial Inf. 11(2):245-255. [6] Schultz, M.P. (2007). Effects of coating roughness and biofouling on ship resistance and powering.
Biofouling, 23, 331–341. [7] Lejars M., Margaillan A., Bressy C. (2012). Fouling Release Coatings: A Nontoxic Alternative to
Biocidal Antifouling Coatings. Chem. Rev., 112 (8): 4347–4390. [8] Swain, G. W. (1998). Proceedings of the International Symsposium on Seawater Drag Reduction;
Newport, RI; p 155. [9] Omae I. (2003). General aspects of tin-free antifouling paints. Chem Rev. 2003 Sep;103(9):3431-48. [10] Arai, T.; Harino, H.; Ohji, M.; Langston, W. J. (Eds.), 2009. Ecotoxicology of Antifouling Biocides, 1st
ed.; Springer. [11] Thomas, K. V. (2009). Advances in Marine Antifouling Coatings and Technologies; Woodshead
Publishing: Cambridge, U.K.,; p 522. [12] Thomas, K. V.; Brooks, S. (2010) The environmental fate and effects of antifouling paint biocides.
Biofouling, 26, 73. [13] Voulvoulis, N.; Scrimshaw, M. D.; Lester, J. N. (1999) Alternative antifouling biocides. Appl.
Organomet. Chem. 1999, 13, 135. [14] Konstantinou, I. K.; Albanis, T. A. (2004). Worldwide occurrence and effects of antifouling paint booster
biocides in the aquatic environment: a review, Environ. Int. 30(2):235-48. [15] Clare, AS. (1998) Towards nontoxic antifouling. J. Mar. Biotechnol., 6, 3. 10:181–202. [16] Rittschof D (2000). Natural product antofoulants: one perspective on the challenges related to coatings
development. Biofouling 15: 119–127. [17] Hellio, C.; Maréchal, J.-P.; Da Gama, B. A.; Pereira, M.; Clare, A. S. (2009). Natural marine products
with antifouling activities. In Advances in Marine Antifouling Coatings and Technologies; Hellio C., Yebra D.M.Y. (Eds) Woodshead Publishing: Cambridge, UK. pp. 572-622.
[18] Olsen, S.M., Pedersen, L.T., Laursen, M.H., Kiil, S., Dam-Johansen, K. (2007). Enzyme-based antifouling coatings: A review. Biofouling, 23, 369—383.
[19] Kristensen JB, Meyer RL, Laursen BS, Shipovskov S, Besenbacher F, Poulsen CH. (2008). Antifouling enzymes and the biochemistry of marine settlement. Biotechnol Adv., 26(5):471-81.
[20] Olsen, S. M.; Pedersen, L. T.; Hermann, M. H.; Kiil, S.; Dam-. Johansen, K. Advances in Marine Antifouling Coatings and, Woodshead Publishing: Cambridge, U.K., 2009; p 623.
JERICO–WP4–D4.3–100614–V1.2�
. 58
[21] Hellio C, Yebra DMY. Introduction. In: Hellio C, Yebra DMY, editors. Advances in Marine Antifouling Coatings and Technologies. Woodshead Publishing; Cambridge, UK: 2009. pp. 1–15.
[22] Maréchal JP. and Hellio C. (2009). Challenges for the development of new non-toxic antifouling solutions. Int. J. Mol. Sci., 10, 4623-4637.
[23] Yebra, D.M.; Kiil, S.; Dam-Johansen, K. (2004). Antifouling technology—past, present and future steps towards efficient and environmentally friendly antifouling coatings. Progress in Organic Coatings 50(2): 75–104.
[24] Chambers LD, Stokes KR, Walsh FC, Wood RJK. (2006). Modern approaches to marine antifouling coatings. Surface and Coatings Technology 201:3642-3652.
[25] Almeida, E; Diamantino, T.C.; De Sousa, O. (2007). Marine paints: The particular case of antifouling paints, Progress in Organic Coatings 59 (1): 2–20.
[26] Grozea, C. M.; Walker, G. C. (2009). Approaches in designing non-toxic polymer surfaces to deter marine biofouling. Soft Matter, 5:4088-4100.
[27] Magin CM, Cooper SP, Brennan AB. (2010). Non-toxic antifouling strategies. Mater. Today, 13:36–44. [28] Cao Shan, JiaDao Wang, HaoSheng Chen, DaRong Chen (2011). Progress of marine biofouling and
antifouling technologies, Chinese Science Bulletin, 56(7): 598-612. [29] Callow JA, Callow ME. (2011). Trends in the development of environmentally friendly fouling-resistant
marine coatings. Nat Commun., 2:244. [30] Kirschner C. M. and Brennan A.B. (2012). Bio-Inspired Antifouling Strategies. Annual Review of
Materials Research, 42: 211-229. [31] G Greco, TS Lanero, S Torrassa, R Young, M Faimali, J Davenport (2013). Microtopography of the eye
surface of the crab Carcinus maenas: an atomic force microscope study suggesting a possible antifouling potential. J. R. Soc. Interface, 10(84):20130122.
[32] Manov DV , Chang GC , Dickey TD (2004) Methods for reducing biofouling on moored opticalsensors . J Atmos Ocean Technol 21 (6) : 958 – 968.
[33] Whelan, A. and Regan, F. (2006) Antifouling strategies for marine and riverine sensors, J. Environ. Monit. 8, 880–886.
[34] Delauney L., Compère C., Lehaitre M. (2010) Biofouling protection for marine environmental sensors. Ocean Science, 6(2), 503-511
Section 4 [1] Sullivan T and Regan F, (2011) Designing sustainable antifouling based on biomimetic design principles
for ocean sensing technology J. Ocean Technol., Vol. 6, No. 4: 42-54. [2] Salta M, Wharton J. A., Stoodley P., Dennington S. P., Goodes L. R., Werwinski S., Mart U.,. Wood R. J.
K , Stokes K. R. (2010). Designing biomimetic antifouling surfaces. Phil. Trans. R. Soc. A, 368: 4729–4754
[3] Greco G., Lanero T. S., Torrassa S., Young R., Vassalli M., Cavaliere A., Rolandi R., Pelucchi E., Faimali M., Davenport J. (2013). Microtopography of the eye surface of the crab Carcinus maenas: an atomic force microscope study suggesting a possible antifouling potential. J R Soc Interface, 10 (84): 20130122
[4] Bechert D. W., Bruse M., Hage W., Meyer R. (2000). Fluid mechanics of biological surfaces and their technological application. Naturwissenschaften, 87: 157–171
[5] Bhushan B. (2009). Biomimetics: lessons from nature-an overview. Phil. Trans. R. Soc. A, 367:1445–86
JERICO–WP4–D4.3–100614–V1.2�
. 59
[6] Schumacher J. F., Carman M. L., Estes T. G., Feinberg A. W., Wilson L. H., Callow M. E., Callow J. A., Finlay J. A., Brennan A. B. (2007). Engineered antifouling microtopographies-effect of feature size, geometry, and roughness on settlement of zoospores of the green alga Ulva. Biofouling, 23: 55–62
[7] Schumacher J. F., Aldred N., Callow M. E., Finlay J. A., Callow J. A., Clare A. S., Brennan A. B. (2007). Species-specific engineered antifouling topographies: correlations between the settlement of algal zoospores and barnacle cyprids. Biofouling, 23: 307–317
[8] Chung K. K., Schumacher J. F., Sampson E. M., Burne R. A., Antonelli P. J., Brennan A. B. (2007). Impact of engineered surface microtopography on biofilm formation. Biointerphases, 2 :89-94
[9] Lang A. W., Motta P., Hidalgo P. Westcott M. (2008). Bristled shark skin: a microgeometry for boundary layer control? Bioinsp. Biomim., 3: 046005
[10] Scardino A. J., Hudleston D., Peng Z., Paul N. A. de Nys R. (2009). Biomimetic characterisation of key surface parameters for the development of fouling resistant materials. Biofouling, 25: 83–93
[11] Bers A. V. Díaz E. R., da Gama B. A., Vieira-Silva F., Dobretsov S., Valdivia N., Thiel M., Scardino A. J., McQuaid C. D., Sudgen H. E., Thomason J. C., Wahl M. (2010). Relevance of mytilid shell microtopographies for fouling defence-a global comparison. Biofouling, 26 367–377
[12] Bhushan, B., Jung, Y. C., Koch, K. (2009). Micro-, nano- and hierarchical structures for superhydrophobicity, self-cleaning and low adhesion. Philosophical transactions of the Royal Society A., 367: 1631–1672.
[13] Liu, M., Wang, S., Wei, Z., Song, Y., Jiang, L. (2009). Bioinspired design of a superoleophobicand low adhesive water/solid interface. Advanced Materials, 21: 665–669.
[14] Jung, Y. C., Bhushan, B. (2009). Wetting behavior of water and oil droplets in three-phase interfaces for hydrophobicity/philicity and oleophobicity/philicity. Langmuir, 25: 14165–14173.
[15] Lewis A.L. (2000). Phosphorylcholine-based polymers and their use in the prevention of biofouling. Colloids Surfaces B: Biointerfaces, 18: 261–275.
[16] Iwasaki Y., Ishihara K. (2005). Phosphorylcholine-containing polymers for biomedical application. Analytical and Bioanalytical Chemistry, 381: 534–546.
[17] Yajima S., Suzuki K., Kimura K. (2000). Potentiometric ion sensors with neutral-carrier-type ion-sensing membranescoated by biocompatible phosphorylcholine polymers. Analytical Sciences, 16: 899–900.
[18] Navarro-Villoslada F., Orellana G., Moreno-Bondi M.C., Vick T., Driver M., Hildebrand G., Liefeith K. (2001) Fiber-optic luminescent sensors with composite oxygen-sensitive layers andanti-biofouling coatings. Analytical Chemistry, 73: 5150–5156.
[19] O’Neal D.P., Meledeo M.A., Davis J.R., Ibey B.L., Gant V.A., Pishko M.V., Coté G.L. (2004). Oxygen sensor based on the fluorescence quenching of a ruthenium complex immobilized in a biocompatible poly (ethylene glycol) hydrogel. IEEE Sensors Journal, 4: 728–734.
[20] Chae K.H., Jang Y.M., Kim Y.H., Sohn O.J., Rhee J.I. (2007). Anti-fouling epoxy coatings for optical biosensor application based on phosphorylcholine. Sensors and Actuators B: Chemical, 124 (1): 153-160.
[21] Bixler G. D., Bhushan B. Rice- and Butterfly-Wing Effect Inspired Self- Cleaning and Low Drag Micro/nanopatterned Surfaces in Water, Oil, and Air Flow (unpublished).
[22] Bixler G. D., Bhushan B. (2012). Bioinspired rice leaf and butterfly wing surface structures combining shark skin and lotus effects. Soft Matter, 8: 11271–11284
[23] Bixler G. D., Bhushan B. (2013). Fluid drag reduction and efficient self-cleaning with rice leaf and butterfly wing bioinspired surfaces. Nanoscale, 5: 7685–7710.
[24] Mappes T., Worgull M., Heckele M., Mohr J. (2008). Submicron polymer structures with X–ray lithography and hot embossing. Microsyst. Technol., 14: 1721–1725.
JERICO–WP4–D4.3–100614–V1.2�
. 60
[25] Roos N., Luxbacher T., Glinsner T., Pfeiffer K., Schulz H., Scheer H. C. (2001). Nanoimprint lithography with a commercial 4-in. bond system for hot embossing. 26th Annual International Symposium on Microlithography, 4343: 427-435
[26] Bhushan B. (2009) Biomimetics: lessons from nature–an overview. Philos. Trans. R. Soc. 367: 1445–1486.
[27] Bhushan B. (2012). Biomimetics: Bioinspired Hierarchical-Structured Surfaces for Green Science and Technology. Springer-Verlag, Heidelberg, Germany, 2012
[28] Koch K., Barthlott W. (2009). Superhydrophobic and superhydrophilic plant surfaces: an inspiration for biomimetic materials. Philos. Trans. R. Soc., 367: 1487–1509
[29] Wong T. S., Kang S. H.,. Tang S. K. Y, Smythe E. J., Hatton B.D., Grinthal A., Aizenberg J. (2011). Bioinspired self-repairing slippery surfaces with pressure-stable omniphobicity. Nature, 477: 443–447.
[30] Hunt J., Bhushan B. (2011) Nanoscale biomimetics studies of Salvinia molesta for micropattern fabrication. J. Colloid Interface Sci., 363: 187–192
[31] Nishimoto S., Bhushan B. (2013). Bioinspired self-cleaning surfaces with superhydrophobicity, superoleophobicity, and superhydrophilicity. RSC Advances, 3: 671–690
[32] Bixler G. D., Bhushan B. (2012). Biofouling: lessons from nature. Philos. Trans. R. Soc. A, 370: 2381–2417
[33] Bixler G. D., Bhushan B. (2013). Bioinspired micro/nanostructured surfaces for oil drag reduction in closed channel flow. Soft Matter 9: 1620–1635
[34] Bixler G. D., Bhushan B. (2013) Fluid Drag Reduction with Shark-Skin Riblet Inspired Microstructured Surfaces. Adv, Funct. Mater., 23: 4507–4528
JERICO–WP4–D4.3–100614–V1.2�
. 61
7. APPENDIX: The Biofouling Monitoring Program (BMP)
A.1 Objectives
ISMAR-CNR developed a special sampling system (Biofouling Monitoring Box - BMB) designed to provide
substrates with spatial and structural heterogeneity that can simulate the complexity of the sensors and
sensor housing/containers.
Several BMBs have been sent to the JERICO partners interested in the biofouling monitoring activity, for a
total of 12 different monitoring sites (open waters and coastal waters) along a European geographical
gradient. Each selected partner has immersed the system (BMB) close to a particular sensor, selected as
reference sensor, for this long-term study.
The aim of this monitoring program is to highlight the different characteristics of the process of biological
colonization through the analysis of the biodiversity of the biofouling community that develops on different
materials in different conditions. The idea is to highlight any differences and/or similarities of biofouling
settlement process at different spatial scales in order to characterize in more detail the types of potential
organisms that make up the biofouling of sensors at different latitudes of some of the major European
The following map represents the distribution of 12 different monitoring sites (open water and coastal
water) along a European geographical gradient.
JERICO–WP4–D4.3–100614–V1.2�
. 62
A.3 Biofouling Monitoring Box - BMB
The Biofouling Monitoring Box (BMB) is a specifically monitoring device designed by ISMAR-CNR to provide substrates with spatial and structural heterogeneity, which simulate the complexity of the sensors and housing/container. It is composed by (Fig. A.3.1):
- a horizontal side (A) in which the series of 6 tiles of different materials (P-M-G) is inserted from both sides (side exposed to light and to the dark).
- a vertical side (B) with the same series of 6 tiles of different materials on both sides ((side exposed to light and to the dark)
- a second vertical side (C) is composed of two panels kept together by the cable ties (easily removable when it must be opened like a book to take the photograph) in which one series of 6 tiles of different materials is inserted (in order to simulate an interstitial environment in the dark).
Each side is provided with several spacers that will serve as a support to perform the pictures of all side (sides exposed to light and sides exposed in the dark).
Each selected partner participating to the experiment have immersed a system (BMB) close to a particular sensor selected as the reference sensor for this long-term study. Then photograph of the different parts of the BMB and the different parts of the reference sensor are being collected every 2 months for the coastal monitoring stations and whenever possible for those in the open ocean. After 6-12 months each partner will ship the two BMBs to ISMAR laboratory after appropriate conservation treatment.
JERICO–WP4–D4.3–100614–V1.2�
. 63
Figure A.3.1: The Biofouling Monitoring Box
A.4 Biofouling estimation
Biofouling coverage will be estimated by Photogrid software (Bird, 2003) and main taxa representative
of biofouling community will be recorded in each selected location.
JERICO–WP4–D4.3–100614–V1.2�
. 64
Figure A.3.2: Estimation of biofouling coverage by Photogrid software.
The software creates 100 random points on a digital picture and allows zooming in/out to recognize the main taxonomic groups of biofouling assemblages on a surface. Macro digital pictures have to be all-consistent in size (at least 1000x1000 pixels) and the photographs have to be taken parallel to the surface and close enough to identify the settled organisms. The output of the software is “total coverage” and percentage coverage for each identified taxonomic group. The main taxonomic groups can be modified and adapted to the local representative species of the considered geographic location.
When the BMB will be collected at the end of the exposure period, the fouled surface will be analysed by standard microscopy techniques and a modified Dethier method (Dethier et al. 1993). The analysis is carried out placing a small grid (20×20 cm) on the sample estimating, in a fixed number of random squares inside the grid, the presence and abundance of each taxa (representative groups of biofouling assemblages). Each randomly selected square is scored for each identified taxonomic group as follows: 0 absence, 1 if the taxon is covering 1/4 of the square surface, 2 if the taxon is covering 1/2 of the square surface, 3 if the taxon is covering 3/4 of the square surface, 4 if the taxon is covering all the square surface.
JERICO–WP4–D4.3–100614–V1.2�
. 65
Figure A.3.2: Estimation of fouling by standard microscopy
techniques and Dethier method.
A.4 References Bird C.E. (2003) PhotoGrid version 1.0. Honolulu, Hawaii Dethier, M. N., E. S. Graham, S. Cohen, and L. M. Tear. (1993). Visual versus random-point percent cover estimations: ‘objective’ is not always better. Mar. Ecol. Progr. Ser. 96: 93-100.