KEt 3 22 p i 'OB ARKANSAS PUBLIC SERVICE COMMISSION /f By: ") -.- a j F ; : -7 IN THE MATTER OF AN INQUIRY INTO ELECTRtC 1 :,ULh TRANSMISSION ISSUES WITHIN THE AREAS 1 SERVED BY THE SOUTHWEST POWER POOL REGIONAL TRANSMISSION ORGANZATION AND 1 THE ENTERGY CORPORATION AS SUCH ISSUES 1 AFFECT ELECTRIC SERVICE WITHIN ARKAMSAS 1 ) DOCKET NO. 08-1364 & RESPONSE OF SOUTHWEST POWER POOL, INC. TO ORDER NO. 2 EIS MONTHLY STATE OF THE MARKET REPORT FOR NOVEM8ER 2008 COMES now Southwest Power Pool, Inc. (YSPP"), by and through its attorneys, and hereby submits its Response to Order No. 2 - EIS Monthly State of the Market Report for November 2008. In support thereof, SPP states as follows: 1. Pursuant to Order No. 2, issued October 17,2008 in this docket, the Commission directed SPP to file the EIS Monthly State of the Market Report contemporaneously as it is provided informally to FERC via posting on the SPP website. The report for November 2008 is provided herein as Exhibit 1 to this Response and can also be accessed via the SPP website at the following link: Respectfully submitted, Southwest Power Pool. Inc. MO BIN 52608 Y And
Transcript
KEt 3 22 pi 'OB ARKANSAS PUBLIC SERVICE COMMISSION
/f
By: ")
-.- a j F ;: -7 IN THE MATTER OF AN INQUIRY INTO ELECTRtC 1 :,ULh
TRANSMISSION ISSUES WITHIN THE AREAS 1 SERVED BY THE SOUTHWEST POWER POOL REGIONAL TRANSMISSION ORGANZATION AND 1 THE ENTERGY CORPORATION AS SUCH ISSUES 1 AFFECT ELECTRIC SERVICE WITHIN ARKAMSAS 1
) DOCKET NO. 08-1364
&
RESPONSE OF SOUTHWEST POWER POOL, INC. TO ORDER NO. 2
EIS MONTHLY STATE OF THE MARKET REPORT FOR NOVEM8ER 2008
COMES now Southwest Power Pool, Inc. (YSPP"), by and through its attorneys,
and hereby submits its Response to Order No. 2 - EIS Monthly State of the Market
Report for November 2008. In support thereof, SPP states as follows:
1. Pursuant to Order No. 2, issued October 17,2008 in this docket, the Commission
directed SPP to file the EIS Monthly State of the Market Report contemporaneously as it
is provided informally to FERC via posting on the SPP website. The report for
November 2008 is provided herein as Exhibit 1 to this Response and can also be
accessed via the SPP website at the following link:
Respectfully submitted,
Southwest Power Pool. Inc.
MO BIN 52608 Y
And
Susan E. Polk, AR BIN 2007198
And
H. Edward Skinner, AR BIN 81 145 WRIGHT, BERRY, HUGHES & MOORE Attorneys at Law P.O. Drawer 947 303 Professional Park Drive Arkadelphia, AR 71 923
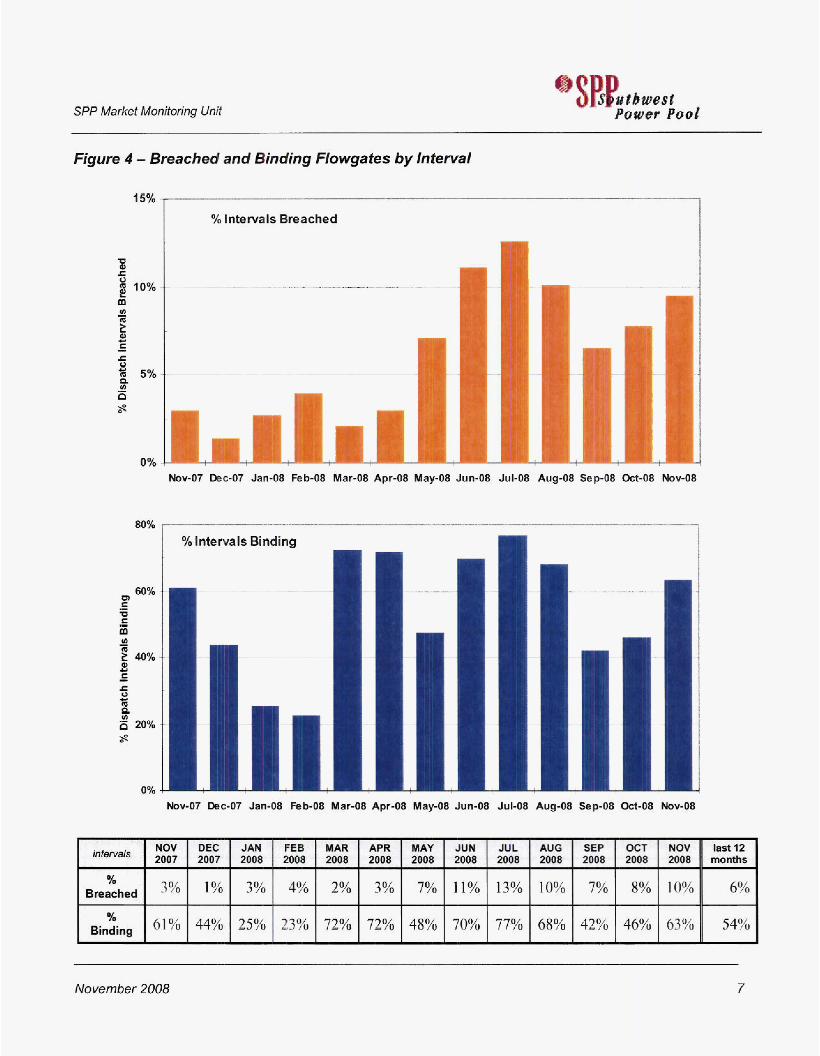
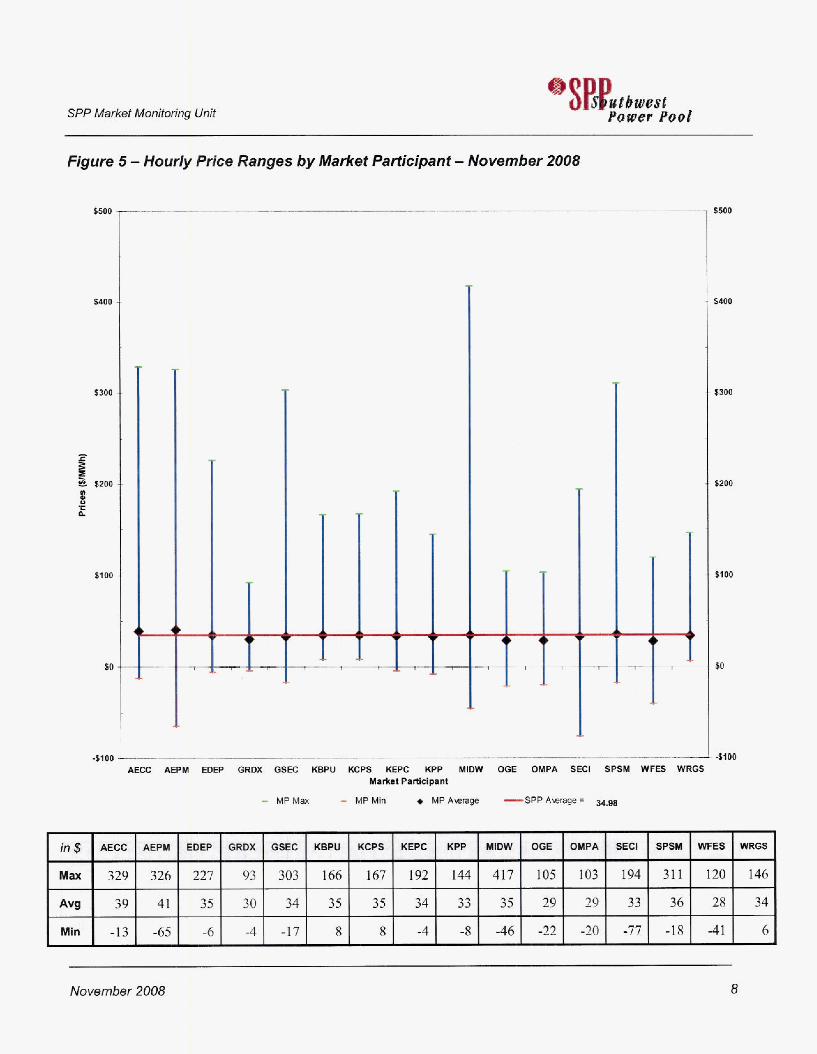
Figure 4 -- Breached and Binding Flowgates by Interval ......................................................................... 7 Figure S . Hourly Price Ranges by Market Participant - November 2008 ............................................. 8
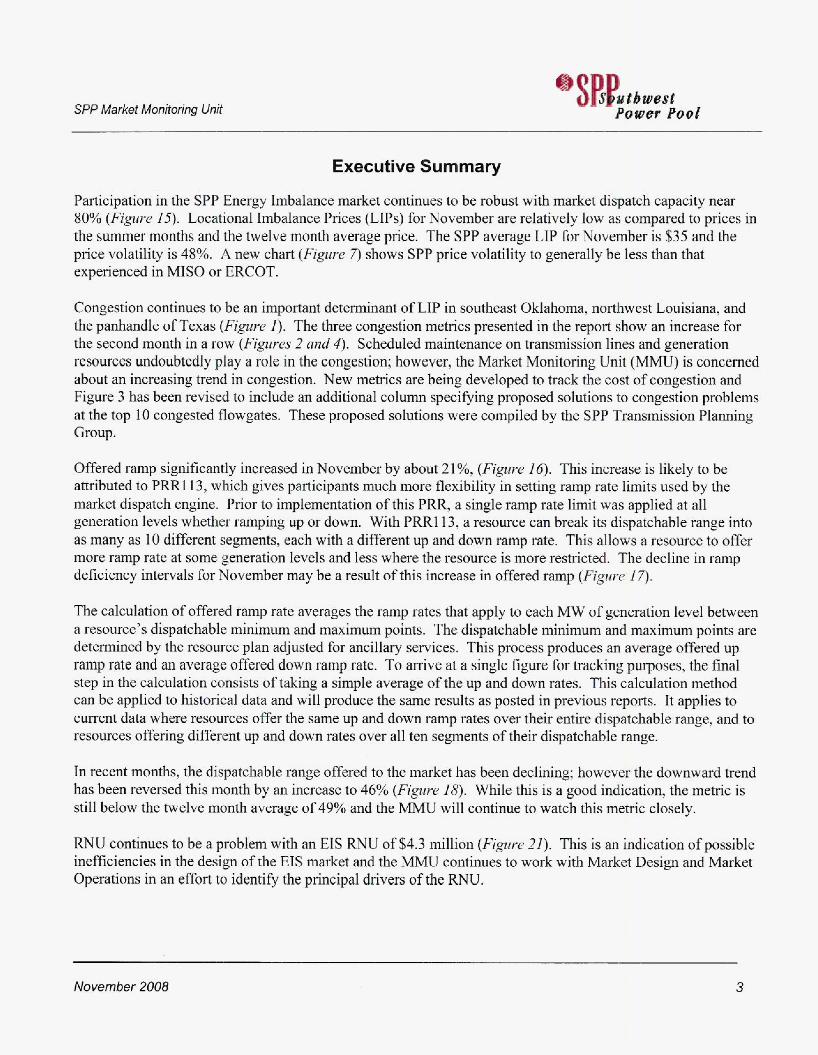
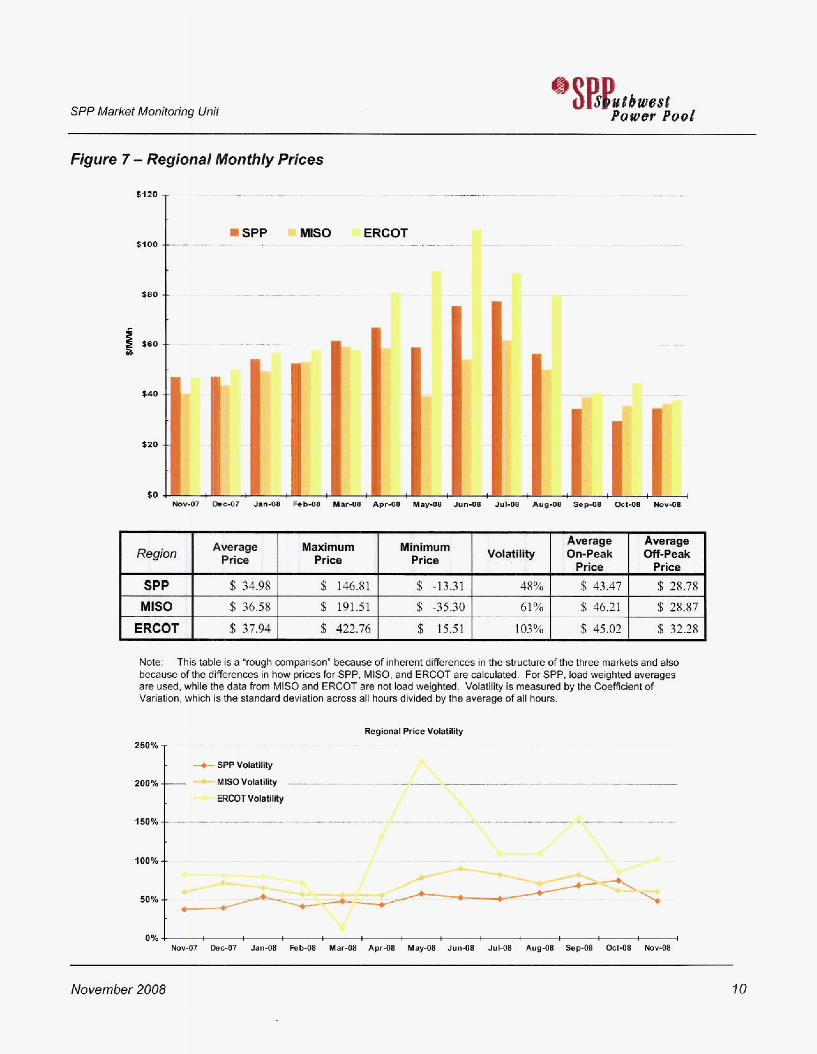
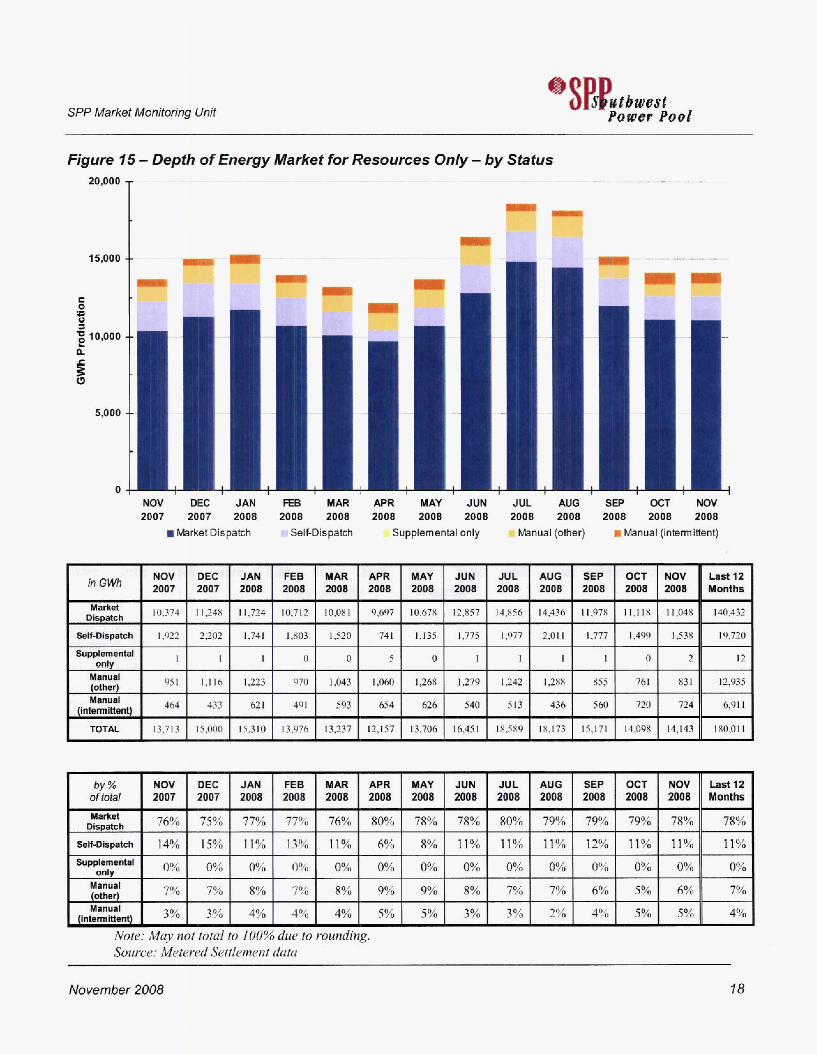
Participation in the SPP Energy Imbalance market continues to be robust with market dispatch capacity near 80% (Figwe 15). Locational Imbalance Prices (LIPS) for November are relatively low as compared to prices in the summer months and the twelve month average price. The SPP average LIP for November is $35 and the price volatility is 48%. A new chart (Jigurc 7) shows SPP price voIatility to generally be less than that experienced in MlSU or ERCOT.
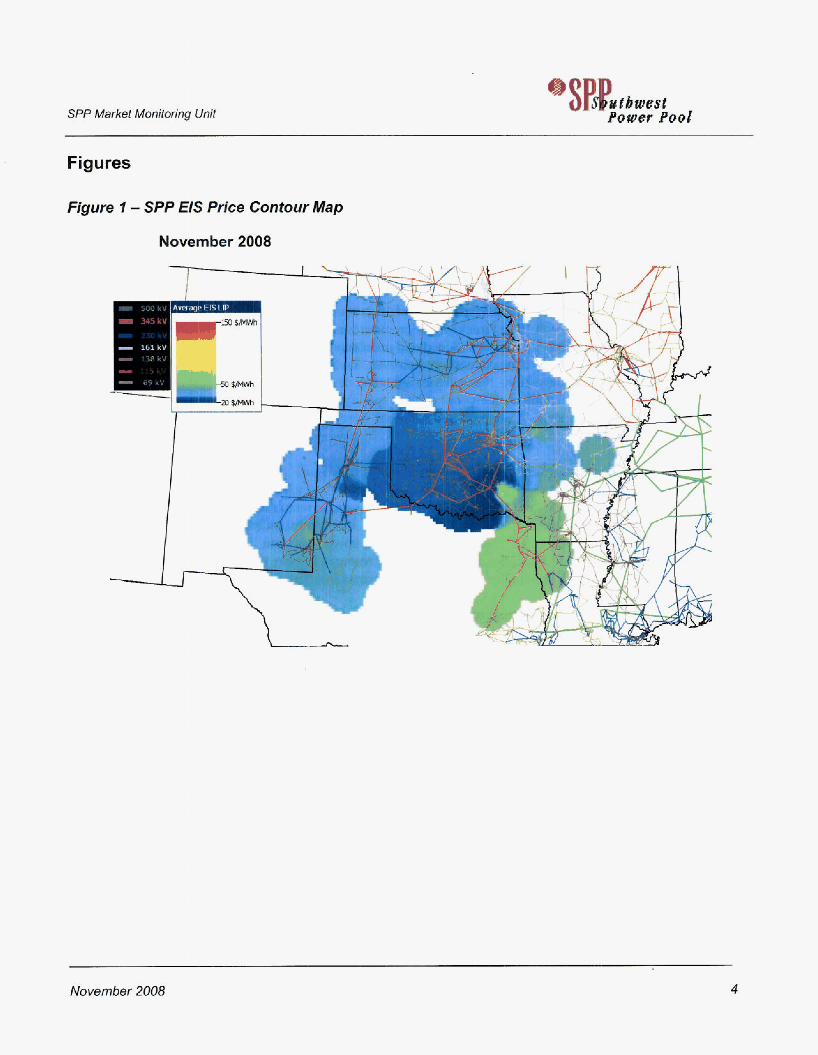
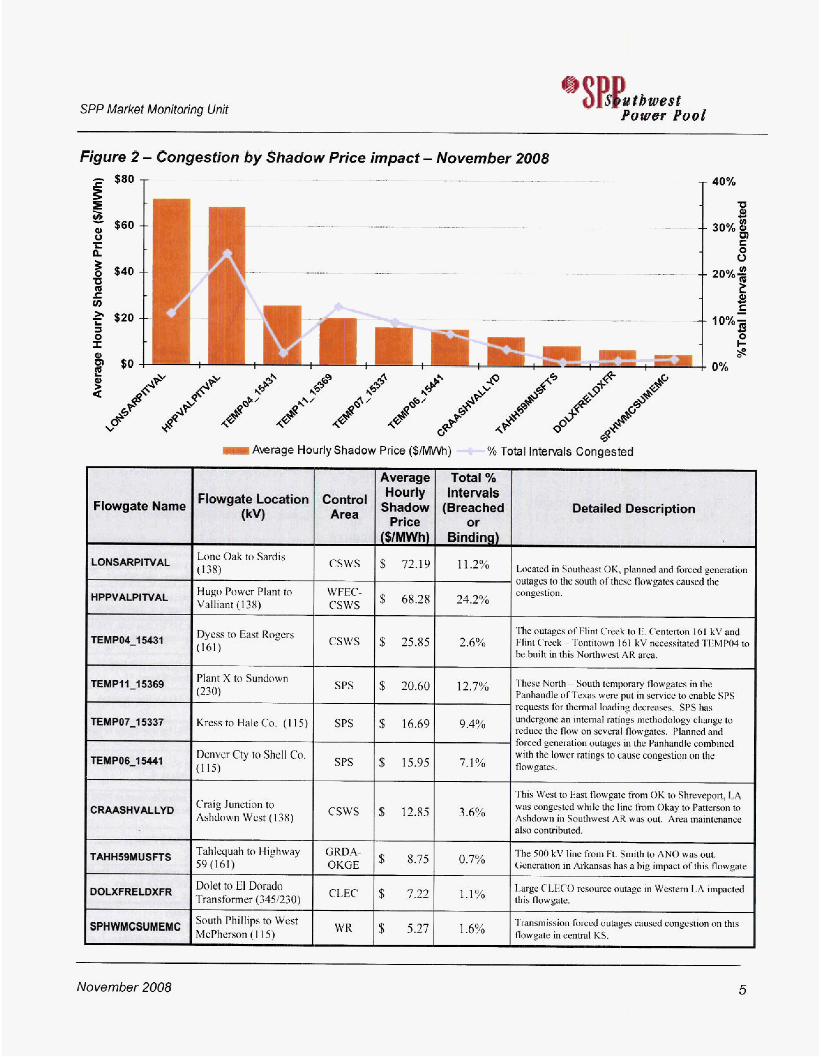
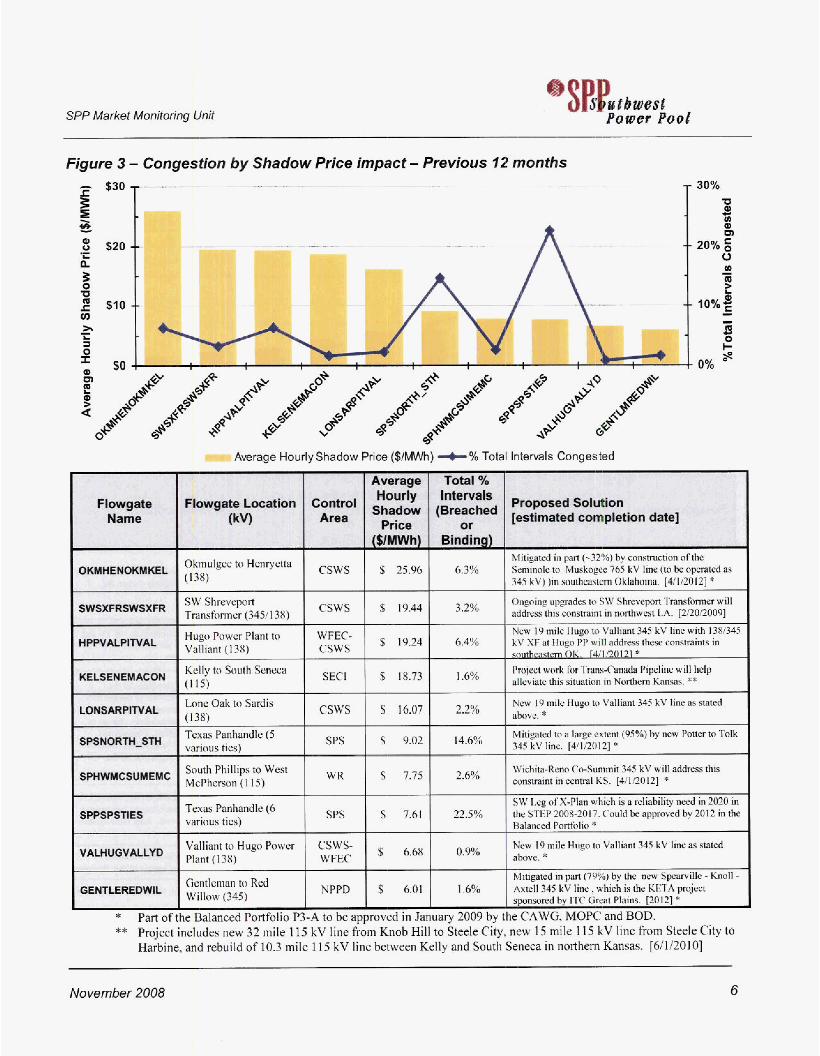
Congestion continues to be an important determinant of LIP in southeast Oklahoma, northwest Louisiana, and the panhandle of Texas (Figtirc I ) . The three congestion metrics presented in he report show an increase for the second month in a row (Figures 2 and 4). Scheduled maintenance on transmission lines and generation resources undoubtedly play a role in the congestion; however, the Market Monitoring Unit (MMU) is concerned about an increasing trend in congestion. New metrics me heing developed to track the cost of congestion and Figure 3 has been revised to inchde an additional column specifying proposed solutions to congestion problems at the top 10 congested flowgates. These proposed solutions were compiled by the SPP Transmission PIanning Group.
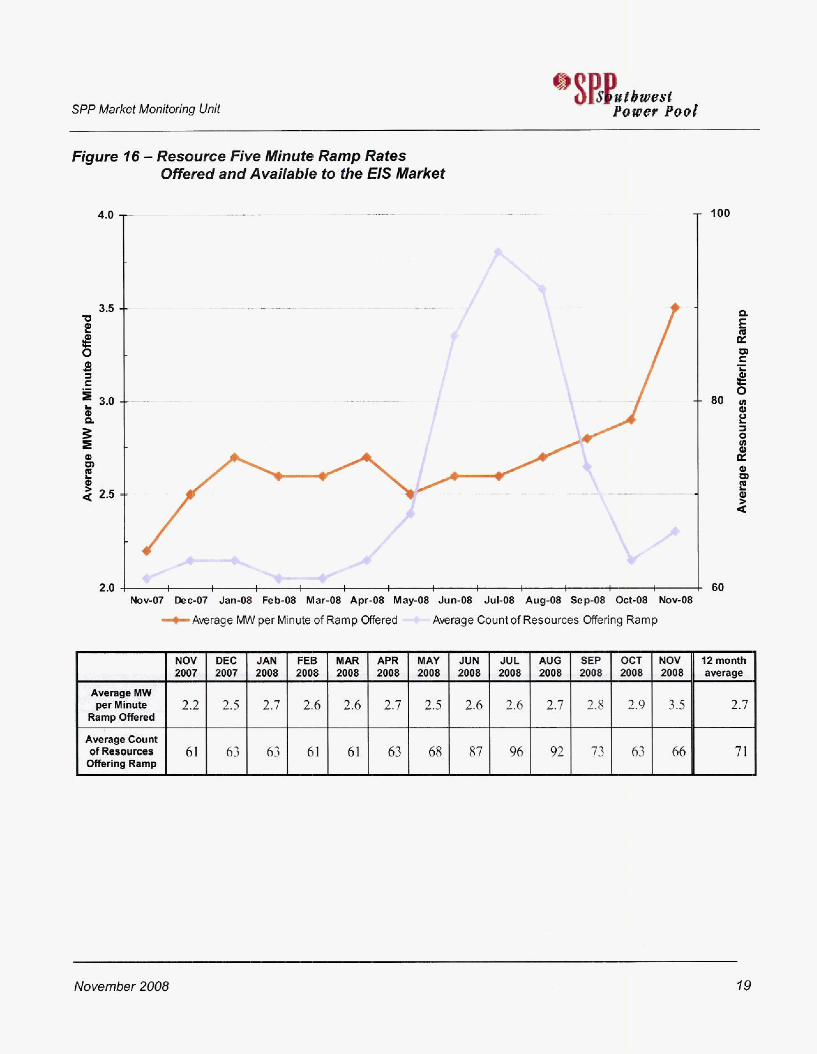
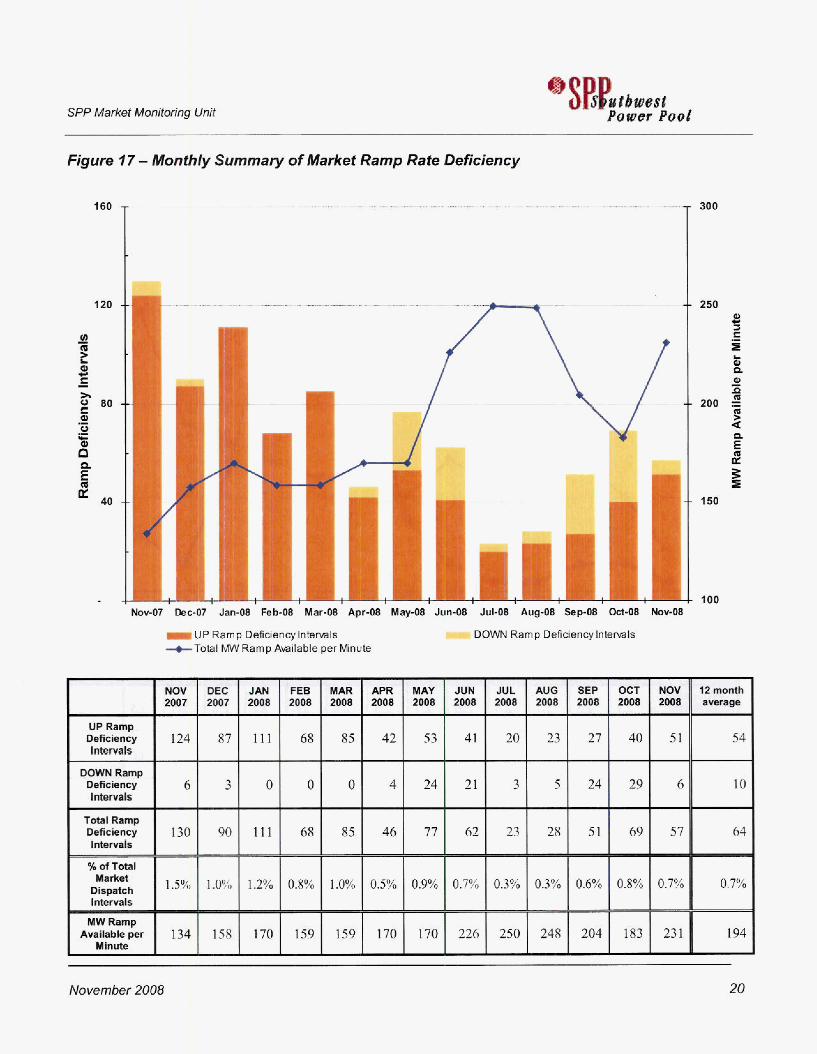
Offered ramp significantly increased in November by about 2 1 %, (Figure 19. This increase is likely to be attributed to PRRl13, which gives participants much more flexibility in setting ramp rate limits used by the market dispatch engine. Prior to implementation of this PRR, a single ramp rate limit was applied at all generation levels whether ramping up or down. With PRRll3, a resource can break its dispatchable range into as many as 10 diffcrent segments, each with a different up and down ramp rate. This allows a resource to offer more ramp rate at some generation levels and less where the resource is more restricted. The decline in m p deficiency intervals for November may be a result of this increase in offered ramp (Figwe 27).
The calculation of offered ramp rate averages the ramp rates that apply to each MW of generation level between a resource’s dispatchable minimum and maximum points. The dispatchable minimum and maximum points are determined by the resource plan adjusted for ancillary services. This process produces an average offered up ramp rate and an average offered down ramp rate. To arrive at a single figure for tracking purposes, the final step in the caiculation consists of taking a simple average of the up and down rates. This calculation method can be applied to historical data and will produce the same rcsults as posted in previous reports. it applies to current data where resources of’fer the same up and down ramp rates over their entire dispatchable range, and to resources offering different up and down rates over ail ten segments of their dispatchable range.
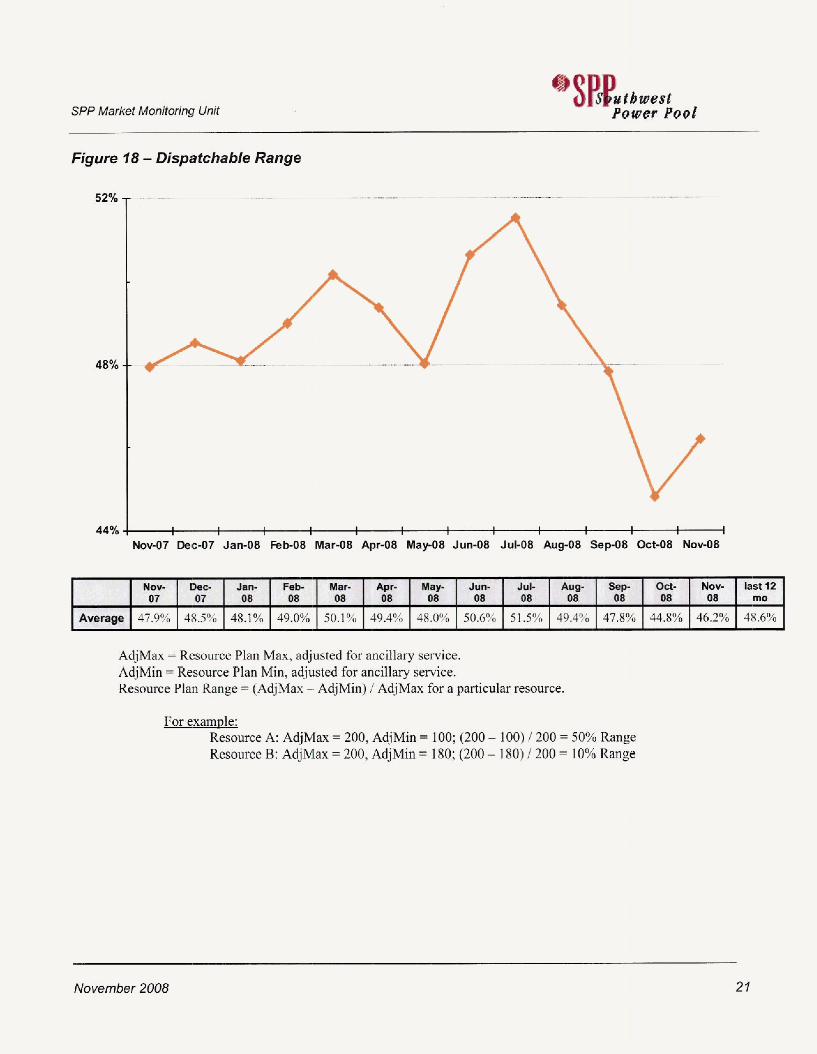
In recent months, the dispatchable range offered to the market has been declining; however the downward trend has been reversed this month by an increase to 46% (Figure 18). While this is a good indication, the metric is still below the twehe month average of 49% and the MMU wilI continue to watch this metric closely.
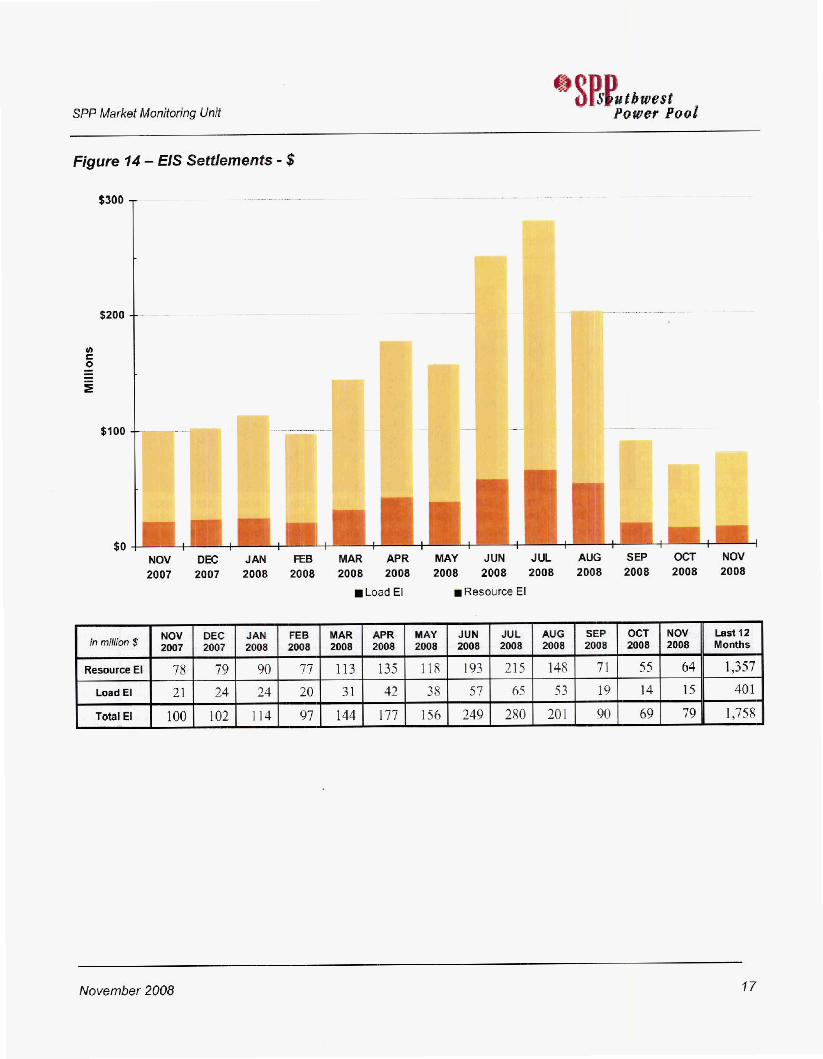
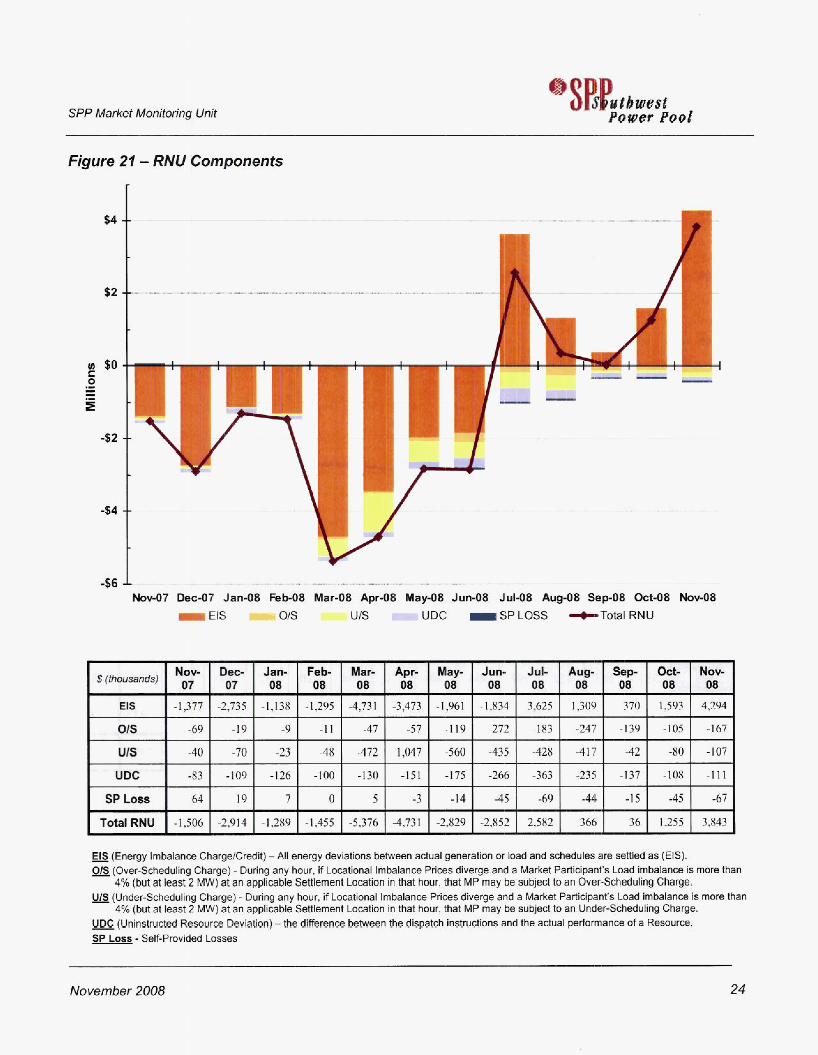
RNU continues to be a problem with an EIS RNU of $4.3 million (Figure 21). This is an indication of possible inefficiencies in the design of the EIS market and the MMU continues to work with Market Design and Market Operations in an effort to identify the principal drivers of the RNU.
November 2008 3
SPP Market Monitoring Unit L YUil
Figures
Figure i - SPP €IS Price Contour Map
November 2008
I f”ix
November 2008 4
Lone Oak to Sardis (138)
Ism Binding)
csws $ 72v1 *2% Located in Southeast OK, planned and Fomd generation
Hugo Power Plant to Vallimt (138)
WFEC- $ 68.28 24.2% congestion. csws
' 12.85
8,75
$ 7.22
$ 5.27
'Ibis Wcyr to East flwpk from OK IO Shrevepgrt, I,A was congested while the linc from Okay to Pattersun to k w w n in sou*wesi AR was out. A= maintmancr also contribuled.
Ihe 500 kV lint from Ft. Smith to A N 0 was out. Gcncration in hrkanm has a big impact of this flowgate.
Imge I'LEI'O resrrurce outage in Western 1.h impacted
3-6%
o.7yo
1.1% thisflowgaL,
Transmission forced outages c a d congestion on t h i s 1.6% flowwk in mml KS,
SPP Market Monitoring Unit
Figure 2 - Congestion by Shadow Price impact - November 2008 40%
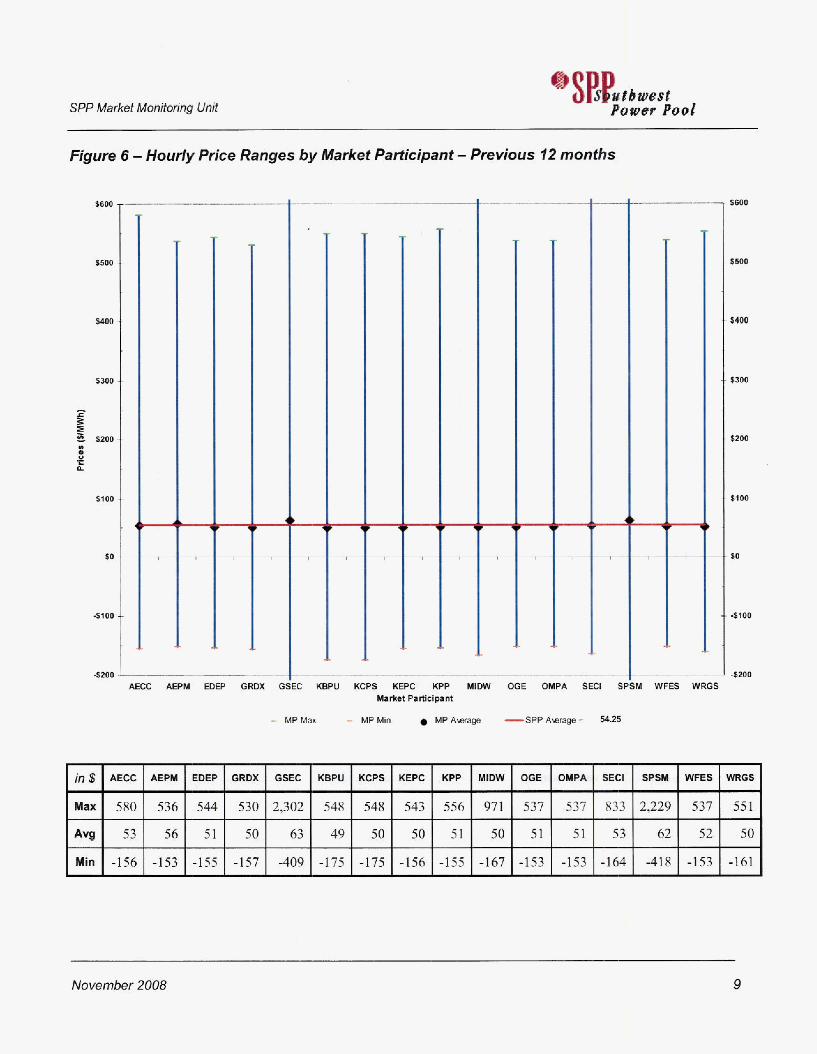
AECC W M BP GRDX GSEC KBPU KCPS KEPC KPP MlDW OGE OMPA 8ECI SPSM WFES WRGS Market Partlclpant
- M P M a - MPMin M P A q -SPPAwmp= 5A25
$600
. $300
$200
$100
' so
- 4100
November 2008 9
SPP Market Monitoring Unit
Figure 7 - Regional Monthly Prices
$100 $'"I - .-
, . , .- . , . , , , . . -. .- . .
BSPP ~ E R C O T - - . . - . . - . .
4
I
Average Average Volatility On-Peak Off-peak
Price Price
Average Maximum Prim Price Prlce Region
SPP $ 34.98 $ 146.81 $ -13.31 48% $ 43.47 $ 28.78
I MISO I $ 36.58 I !I 191.51 I $ -35.30 I 61% I $ 46.21 I $ 28.87
I ERCOT I $ 37.94 I $ 422.76 I $ 15.51 I 103% I $ 45.02 I $ 32.28
Note: This table is a "rough comparison" because of inherent differences in the structure of the three markets and also because ofthe differences in how prices for SPP, MISO, and ERCOT 3re calculated. For SPP, load weighted averages are used, while the data from MISO and ERCOT are not bad weighted. Volatility is measured by the Cmffrcient of Variation, which is the standard deviation across all hours divided by the average of all hours.
A
- .* ,
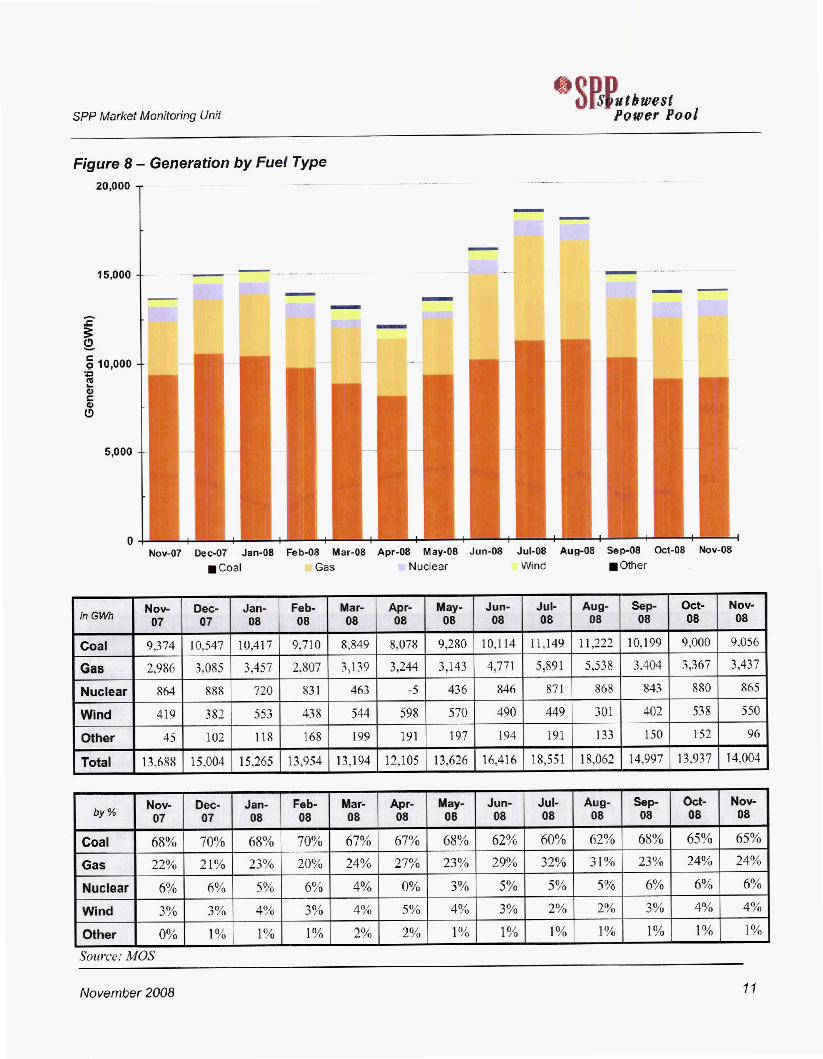
Nw-07 B c 4 7 Jan-OB FebOB Mar44 Apr- YwO8 Jun-08 JuI-08 Augd8 Sep-08 oCt98 b w . 0 8
Coal 1 68%1 70% I 68%1 70%( 67% I 67%1 68%1 62% I 6U%I 62% I 68% I 65%1 65% Gas I 22% I 21% I 23% 1 20% I 24% I 27% I 23% I 29% I 32% 1 31% I 23% I 24% I 24%
Nuclear
Wind I 3%1 3%1 4%1 3%1 4%1 5%1 4%1 3%1 2 % [ 2%1 3%1 4%1 4% Other
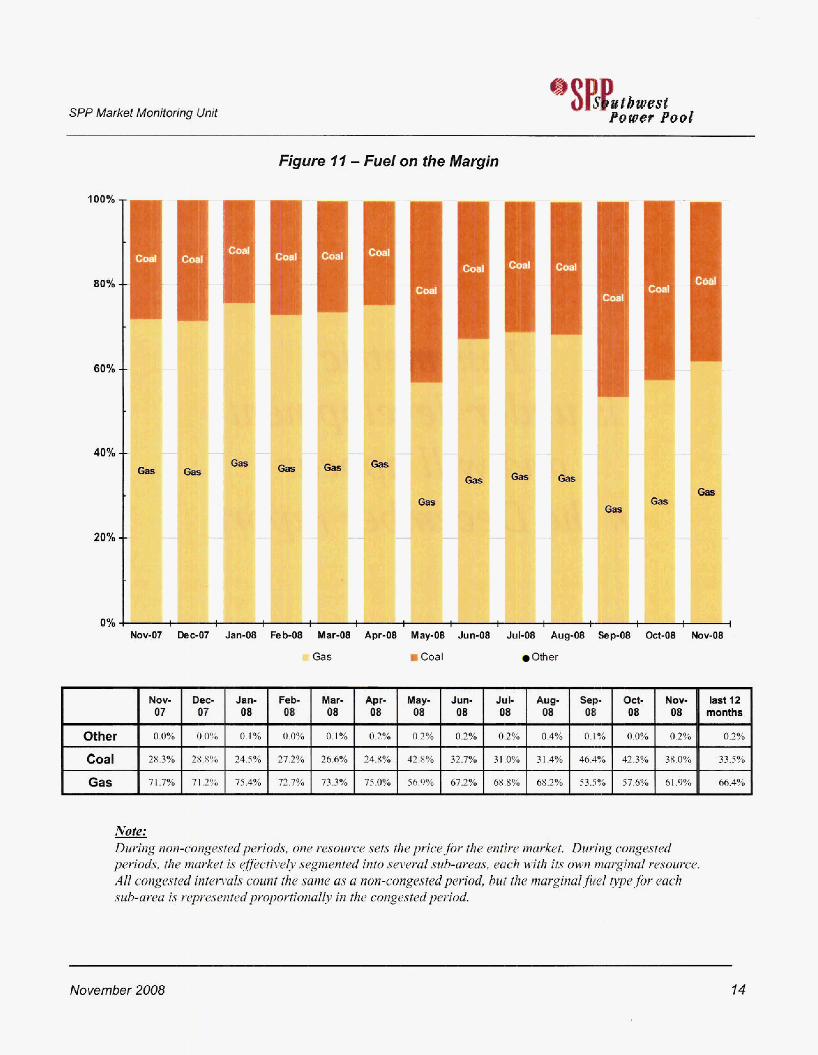
Note: During nun-congested periods, oiie resource sets the price-fir ihe entire> marktt. During congesfd periods, the muvket is <ffectiidy segmented into seawul sub-areas, each with its owti marginal rcsuurcc. All conxm6ed intends count the Same us u nun-copages fed period, hut the marginal f i e / @pe,fir wch srah-arcw is r~pr~~~entc.cdprtlpclP.ti~na~1~ in the congested pciiod.
I Market Oispatch Self-Dispatch R Supplemental only rn Wnual (other) rn k n u a l (intermittent) 2007 zoo7 2008 2008 2008 2008 2008 2008 a m 2008 m a 2008 2008
. ,
77%
13%
0%)
7%
3% I 3% I 4% I 4% -
. Muy not m a l to 100% due to :e: Mctcred Settlement &tu
November 2008
SPP Market Monitmhg Unit
NOV DEC 2007 2007
2.2 2.5
61 63
Figure 16 - Resource Five Minute Ramp Rates Ofired and Available fo the €IS Market
JAN FEB MAR APR MAY JUN JUL AUG SEP Dcf NOV 2008 2008 2008 2008 2008 2008 2008 2008 2008 2008 2008
2.7 2.6 2.6 2.7 2.5 2.6 2.6 2.7 2.8 2.9 3.5
63 61 61 63 68 87 96 92 73 ti3 A4
4.0
3.5 v
I 0 a J E ’ 3.0 k
2 .o
I00
x E 2
60 Now07 DBc-07 Jan48 Feb-08 Mar-08 Apr-08 May-OB Jun-08 J u M Aug-OS Sep-08 Oct-08 N o ~ 0 8
Average MW per Minute
Ramp offered
Average C w n t of Rasourms
Offwing Ramp
-Average M per Minute of Ramp m r e d Average Count of ReSources OPfeflng Ramp
12 month amraw
2.7
71
November 2008 19
SPP Market lwonitm'ng Unit
Figure 17 - Monthly Summary of #arket Ramp Rate Deficiency
160
120
0 s 40 '
. . .. ~ . . . I _ _ _ , . .. .. ... ...-... "
I I- I
I
I
I
.. . . . . - .- .
/
b u r wc-w Jan-08 Feo-ua m a r - l Apr-Ol May-08 Jun-08 JuC08 Aug48 Sep.08 Lmv8 Nov-bd - UP Ramp Deficiency Intemals +ToiaI MW Ramp Available per Mnub
D DOWN Ramp Deficiency Intewls
I '
I I ' .
I I '
300
250
200
150
100
$2 month -w
54
10
64
0.7%
i94
November 2008 20
SPP Market Monitoriig Unit
' Mow Dee Jam Fob- Msr- Apr- Map Juw JuC Aug S%p 8d- Nev- b t f 2
Average 47.9% 4S.5% 48.1% 49.0% 50.1% 39.4% 48.0% 50.6% 51.5% 49.4% 47.8% 44.8% 46.2% 48.6% 07 07 OB os 08 08 oa 08 08 08 08 08 08 mo ---------------
a)SP$#rbturJt Power Pool
Figure 18 - Dispatchable Range
52%
48%
44%
. - . . . . - .. , .. - , . ". , I_ . ._-I
I 1 I I I I I I I I I I I I 1 1 I I I 1 1
Now07 Dee47 Jan-08 Feb-08 Mar48 Apr-08 May08 Jun-08 Jul-OS Au@S Sep-08 Oct-08 N o d B
AdjMax = Resource Plan Max, adjusted for ancillay service. AdjMin = Resource Plan Min, adjusted for ancillary service. Resource Plan Range = (AdjMax - AdjMin) I AdjMax for a particular resource.
For example: Resource A: AdjMax = 200, AdjMin = 100; (200 - 100) I 200 = 50% Range Resource B: AdjMax = 200, AdjMin = 180; (200 - 180) / 200 = 10% Range
November 2008 27
SPP Market Monitoring Unit L)SP$#tbssst Power Pool
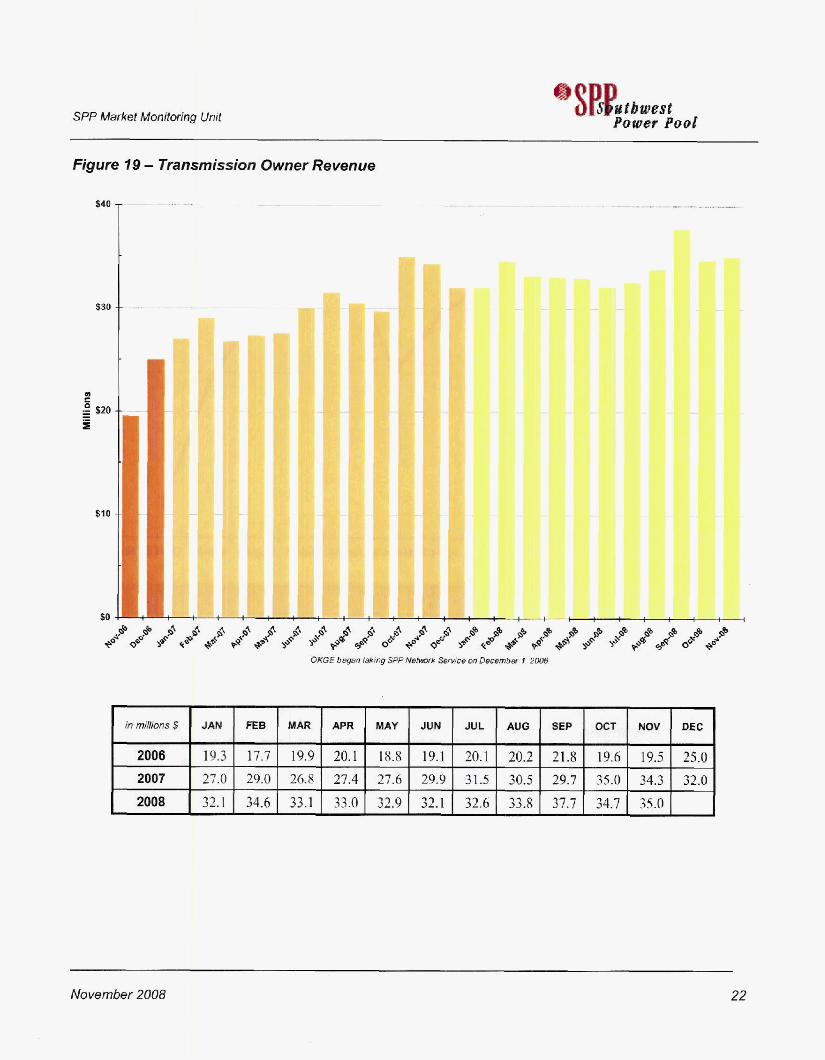
Figure I 9 - Transmission Owner Revenue
#
$30
$10
. .... - . ... . - .. -. . . . . - ..
1.
DEC - 25.0 32.0
November 20U8 22
PO WdY PO 0
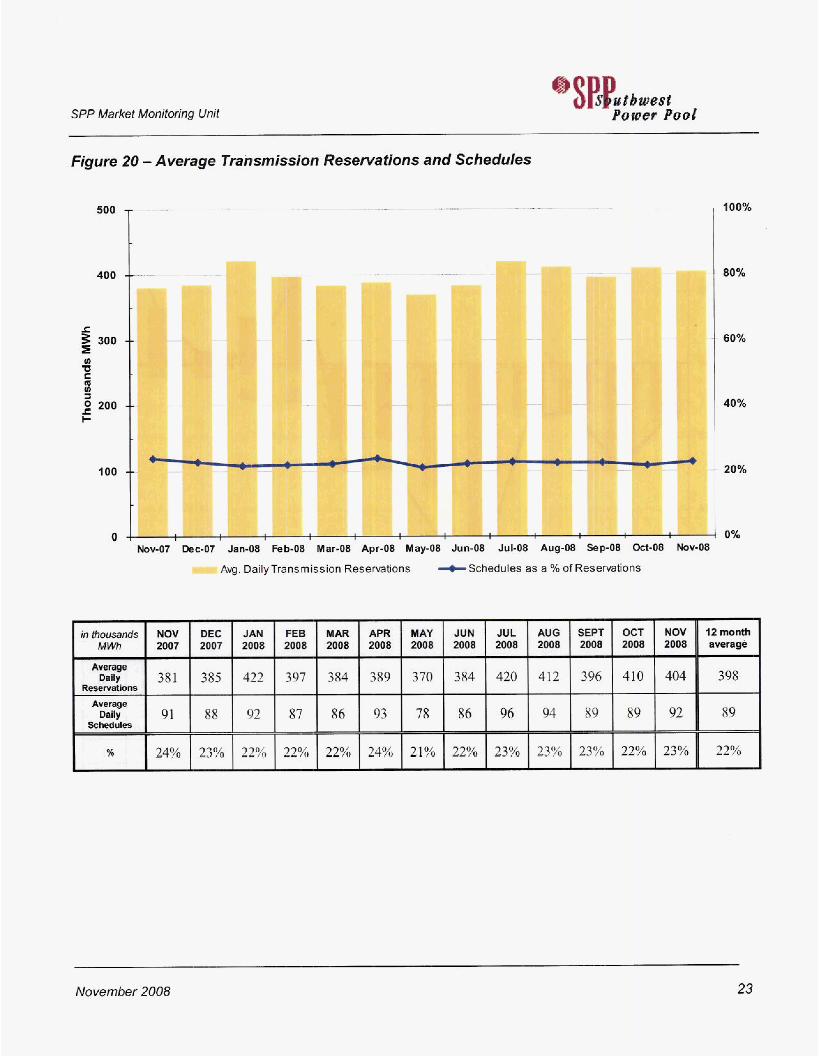
in~%#sands NOV DEC JAN FEB MAR APR YAY JUN JUL AUG MWh 2007 2007 2008 2008 2008 2008 2008 2008 2008 2008
381 385 422 397 384 389 370 384 420 412
91 88 92 87 86 93 78 86 96 94
Arerage Dally
Reoervations Average
* M U M -- -- -- % 24% 23% 22% 22% 22% 24% 21% 22% 23% 23%
SPP Market Monitoring Unit
SEW OCT NOV 2008 2008 2008
396 410 404 1 398
89 89 89 92 I d-
23% 22% 23% 22%
Figure 20 - Average Trahsmission Reservations and Schedules
I 01s I -69 I -19 I -9 I -11 I -47 I -57 I -119 I -272 I -183 I -247 I -139 1 -105 I -167 I
I I I I I I I I I I I I I
- EIS (Energy Imbalance ChargelCdZ) - All energy deviatims bsfween actual generation or bad and schedules are settled as (€IS). pLs (Over-Scheduling Charge) - During any hour, if Locational Imbalance Prices diverge and a Market Partlapant's Load imbalance is more than
- UIS (Under-Scheduling Charge) - During any hour, if Locational Imbalance P W s diverge and a Market Participant's Load imbalance is more than
- UDC (Uninstructed Resource Deviation) - the difference between the &pat& in$tWction$ and the amal performance of a Resource. SP Loss - Self-Provided Losses
4% (but at least 2 MW) at an app4icabk Settlement Location in that hwr, that MP may be subjed to an Over-Scheduling Charge.
4% (but at least 2 MW) at an applicable Settlement Lmtion in that hour, that MP may be subject to an Under-Scheduling Charge.
November 2008 24
CERTIFICATE OF SERVICE
I, Heather H. Starnes, attorne of record for Southwest Power Pool, Inc., do hereby certfl that I have, on this 1 + day of December, 2008, duly served a true and correct copy of the above and foregoing pleading upon all parties of record by electronic mail.