EVOLVING CONSUMER PREFERENCES – Challenging Opportunities Key Issues Affecting the U.S. Light Vehicle Market George M. Magliano Director of Automotive Industry Research, Americas Detroit, 6 October 2005
Key Issues Affecting the U.S. Light Vehicle Market
George M. MaglianoDirector of Automotive Industry Research, Americas
Detroit, 6 October 2005
Copyright ® 2005 Global Insight, Inc. 22005 GLOBAL AUTOMOTIVE CONFERENCE DETROIT
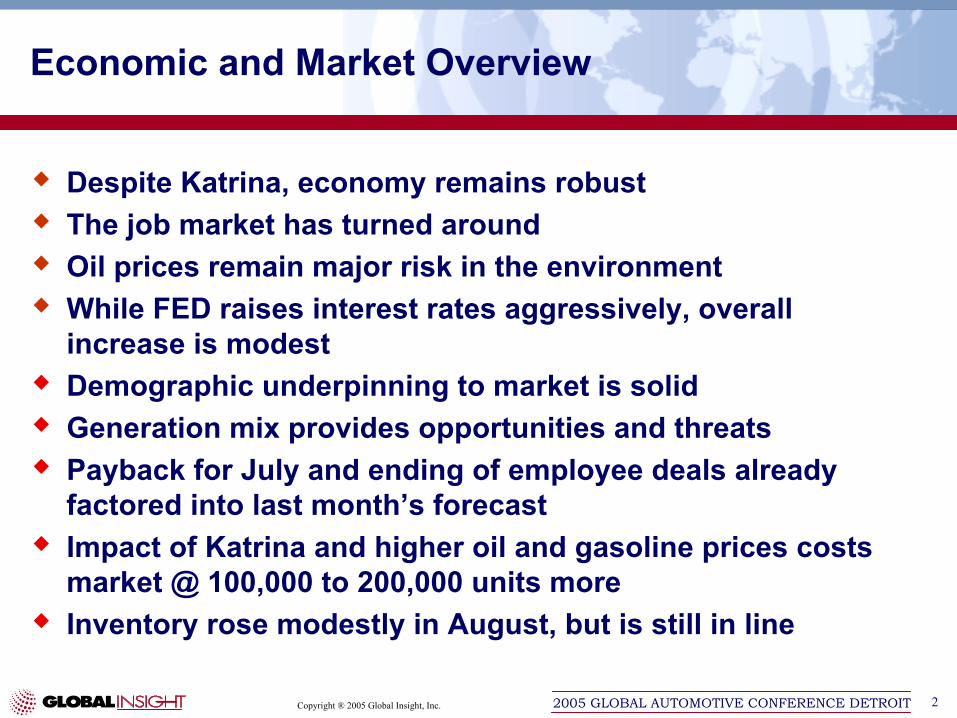
Despite Katrina, economy remains robustThe job market has turned aroundOil prices remain major risk in the environmentWhile FED raises interest rates aggressively, overall increase is modestDemographic underpinning to market is solidGeneration mix provides opportunities and threatsPayback for July and ending of employee deals already factored into last month’s forecastImpact of Katrina and higher oil and gasoline prices costs market @ 100,000 to 200,000 units moreInventory rose modestly in August, but is still in line
Economic and Market Overview
Copyright ® 2005 Global Insight, Inc. 32005 GLOBAL AUTOMOTIVE CONFERENCE DETROIT
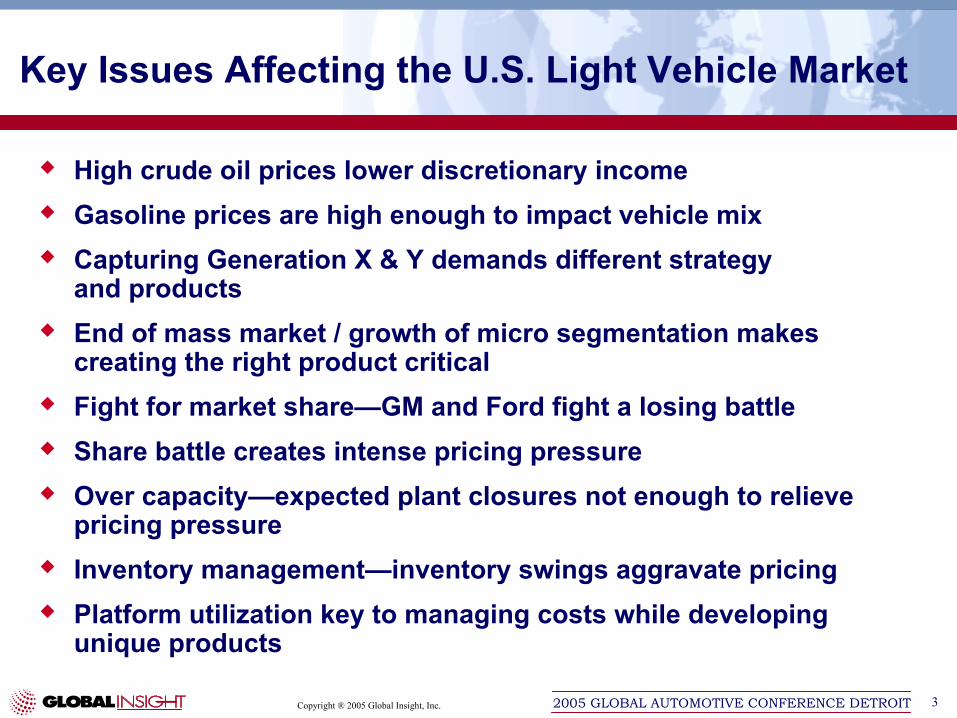
Key Issues Affecting the U.S. Light Vehicle Market
High crude oil prices lower discretionary incomeGasoline prices are high enough to impact vehicle mixCapturing Generation X & Y demands different strategy and productsEnd of mass market / growth of micro segmentation makes creating the right product criticalFight for market share—GM and Ford fight a losing battleShare battle creates intense pricing pressure Over capacity—expected plant closures not enough to relieve pricing pressure Inventory management—inventory swings aggravate pricingPlatform utilization key to managing costs while developing unique products
Copyright ® 2005 Global Insight, Inc. 42005 GLOBAL AUTOMOTIVE CONFERENCE DETROIT
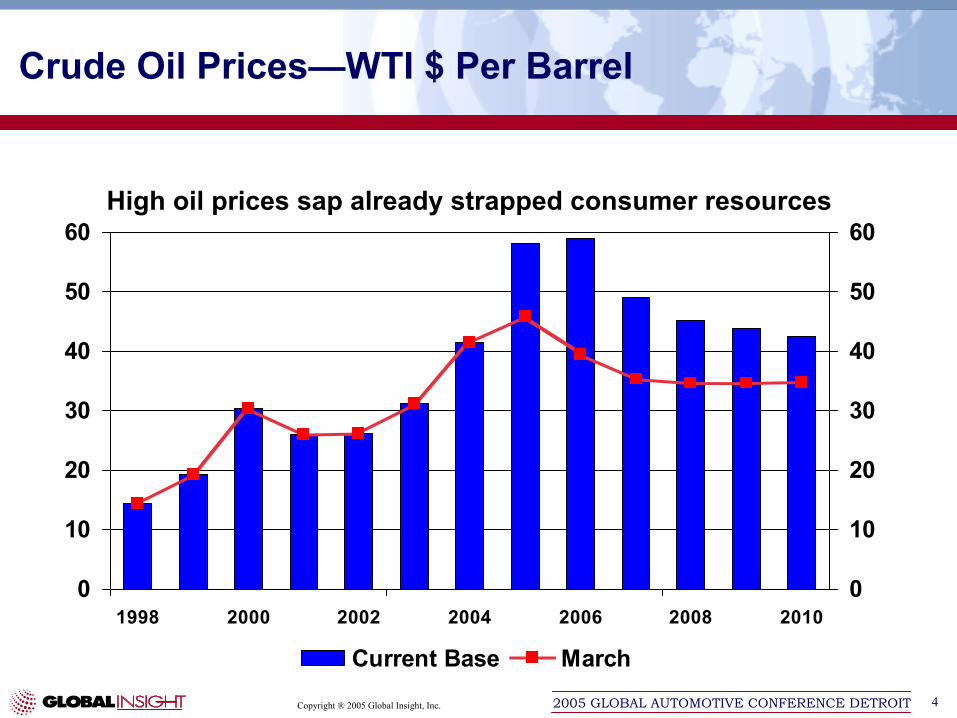
Crude Oil Prices—WTI $ Per Barrel
0
10
20
30
40
50
60
1998 2000 2002 2004 2006 2008 20100
10
20
30
40
50
60
Current Base March
High oil prices sap already strapped consumer resources
Copyright ® 2005 Global Insight, Inc. 52005 GLOBAL AUTOMOTIVE CONFERENCE DETROIT
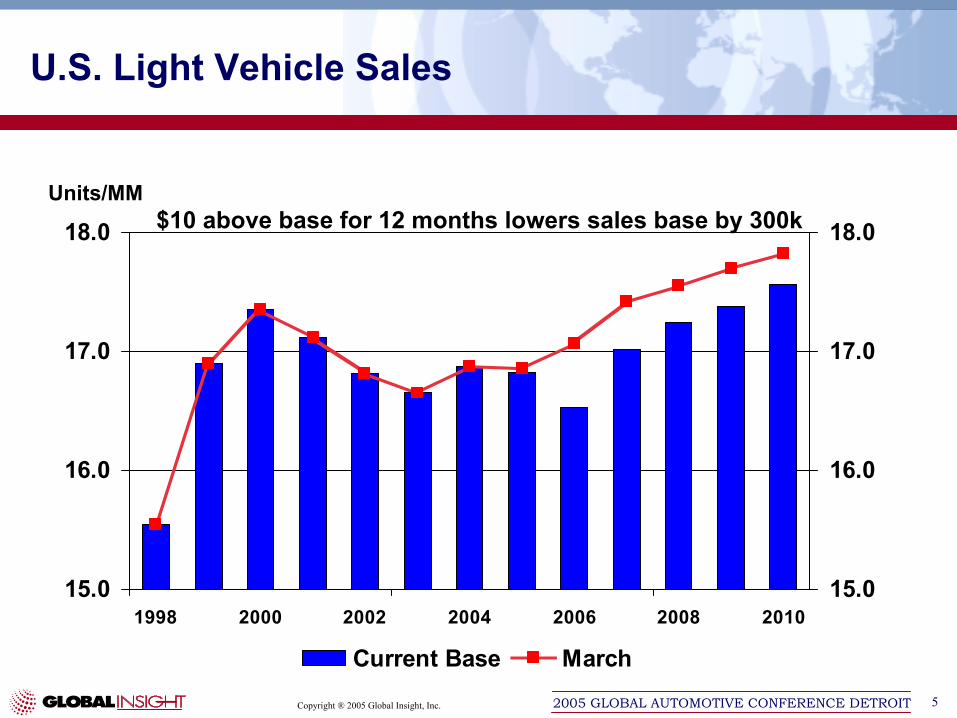
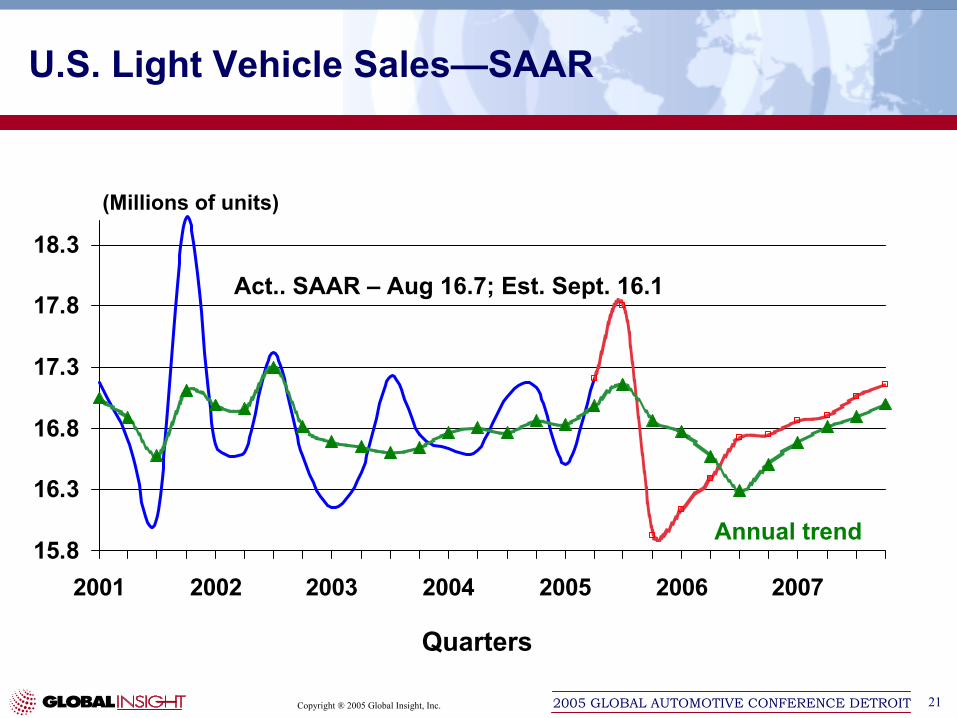
U.S. Light Vehicle Sales
15.0
16.0
17.0
18.0
1998 2000 2002 2004 2006 2008 201015.0
16.0
17.0
18.0
Current Base March
Units/MM$10 above base for 12 months lowers sales base by 300k
Copyright ® 2005 Global Insight, Inc. 62005 GLOBAL AUTOMOTIVE CONFERENCE DETROIT
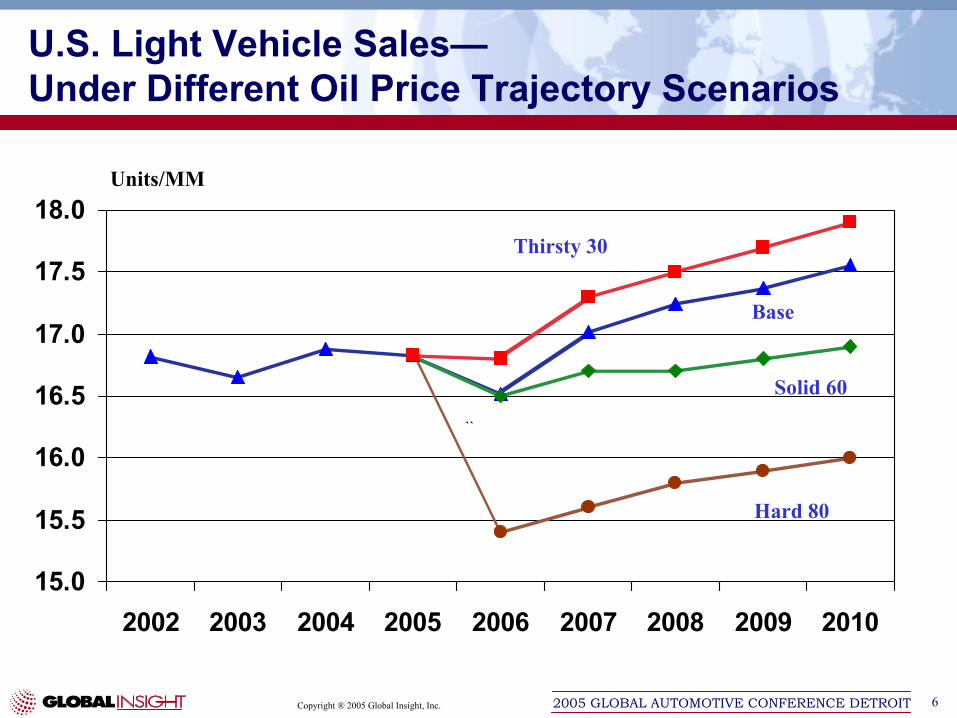
U.S. Light Vehicle Sales—Under Different Oil Price Trajectory Scenarios
15.0
15.5
16.0
16.5
17.0
17.5
18.0
2002 2003 2004 2005 2006 2007 2008 2009 2010
``
Hard 80
Thirsty 30
Solid 60
Base
Units/MM
Copyright ® 2005 Global Insight, Inc. 72005 GLOBAL AUTOMOTIVE CONFERENCE DETROIT
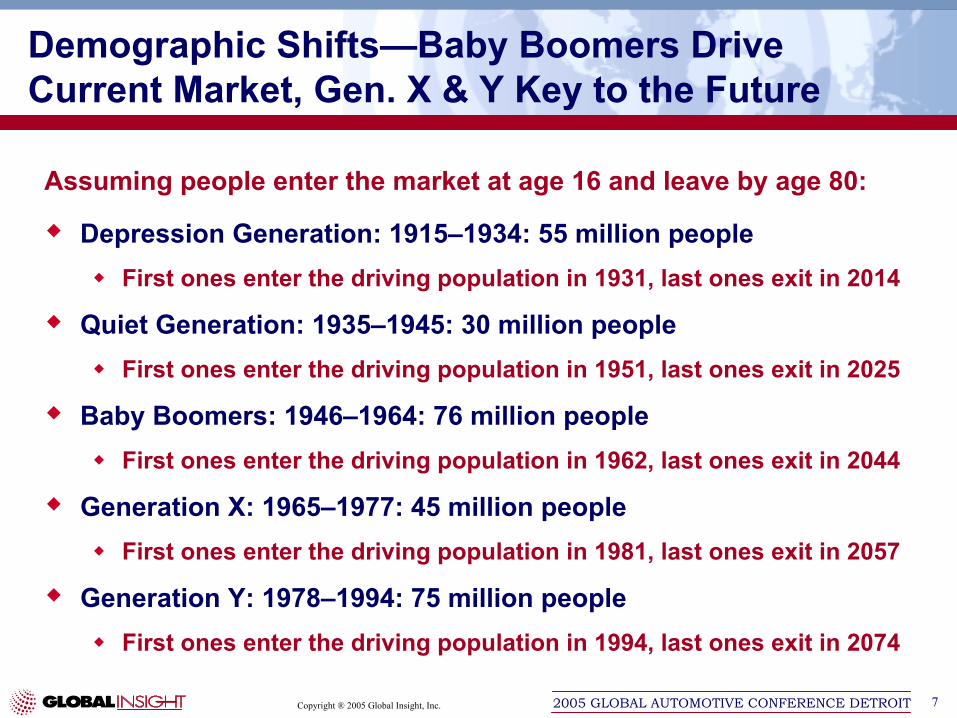
Assuming people enter the market at age 16 and leave by age 80:
Depression Generation: 1915–1934: 55 million peopleFirst ones enter the driving population in 1931, last ones exit in 2014
Quiet Generation: 1935–1945: 30 million peopleFirst ones enter the driving population in 1951, last ones exit in 2025
Baby Boomers: 1946–1964: 76 million peopleFirst ones enter the driving population in 1962, last ones exit in 2044
Generation X: 1965–1977: 45 million peopleFirst ones enter the driving population in 1981, last ones exit in 2057
Generation Y: 1978–1994: 75 million peopleFirst ones enter the driving population in 1994, last ones exit in 2074
Demographic Shifts—Baby Boomers Drive Current Market, Gen. X & Y Key to the Future
Copyright ® 2005 Global Insight, Inc. 82005 GLOBAL AUTOMOTIVE CONFERENCE DETROIT
37
39
41
43
45
47
49
1989 1991 1993 1995 1997 1999 2001 2003 2005
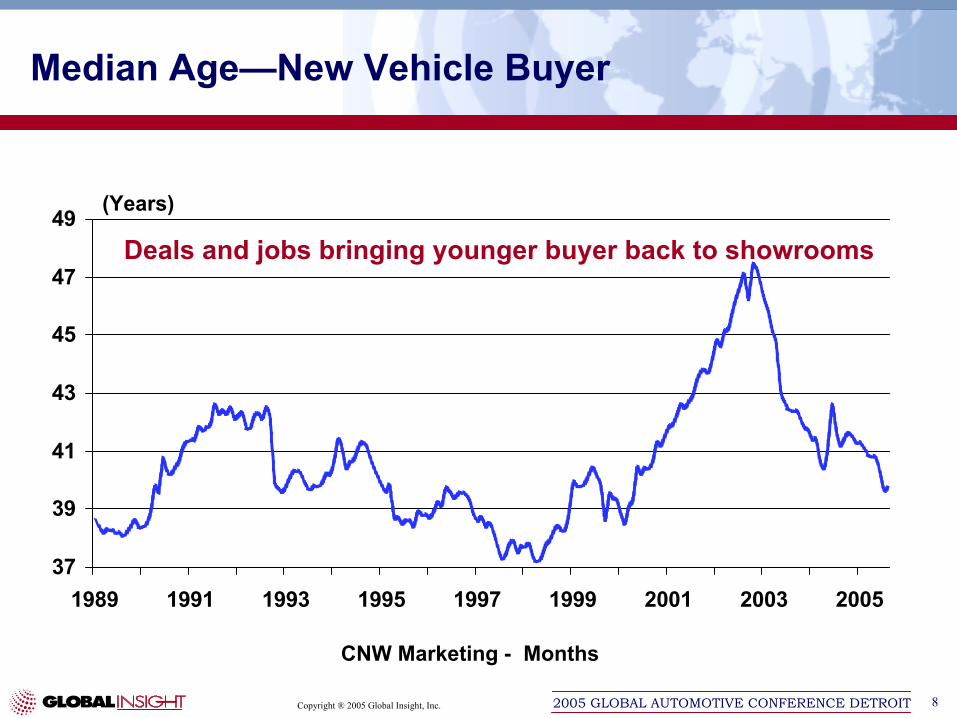
CNW Marketing - Months
(Years)
Median Age—New Vehicle Buyer
Deals and jobs bringing younger buyer back to showrooms
Copyright ® 2005 Global Insight, Inc. 92005 GLOBAL AUTOMOTIVE CONFERENCE DETROIT
NUMBER OF MICRO-SEGMENTS PER YEAR
147
208
226232 234
182
50
70
90
110
130
150
170
190
210
230
250
2000 2002 2004 2006 2008 2010
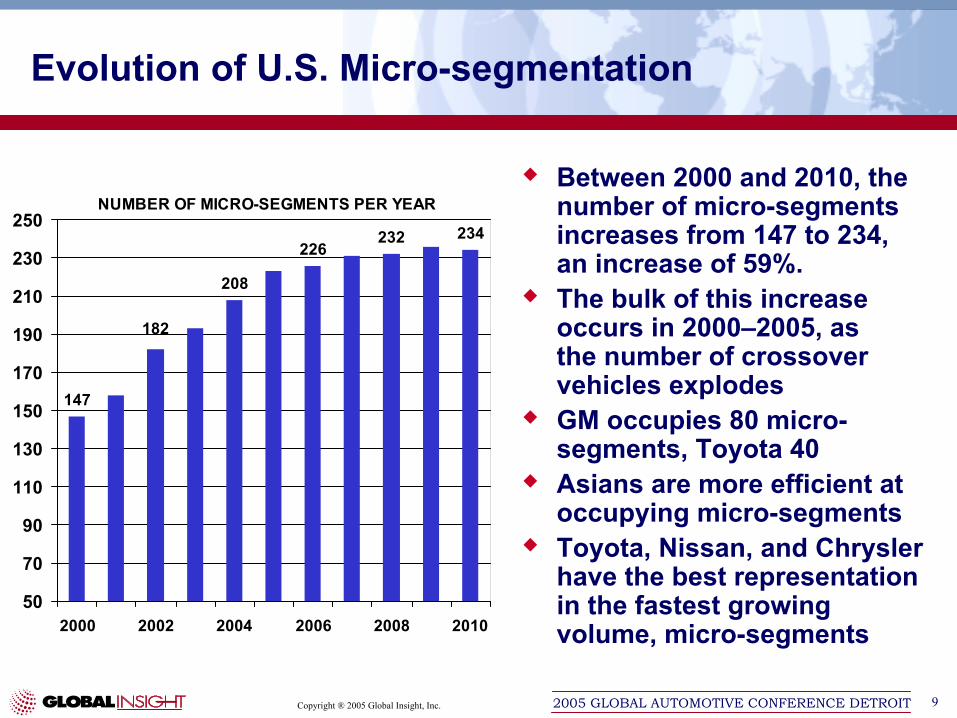
Evolution of U.S. Micro-segmentation
Between 2000 and 2010, the number of micro-segments increases from 147 to 234, an increase of 59%. The bulk of this increase occurs in 2000–2005, as the number of crossover vehicles explodesGM occupies 80 micro-segments, Toyota 40Asians are more efficient at occupying micro-segmentsToyota, Nissan, and Chrysler have the best representation in the fastest growing volume, micro-segments
Copyright ® 2005 Global Insight, Inc. 102005 GLOBAL AUTOMOTIVE CONFERENCE DETROIT
2.0
3.0
4.0
5.0
6.0
7.0
2000 2002 2004 2006 2008 201010%
15%
20%
25%
30%
35%
40%
Volume - L Market Share - R
(Units/MM) (Percent)
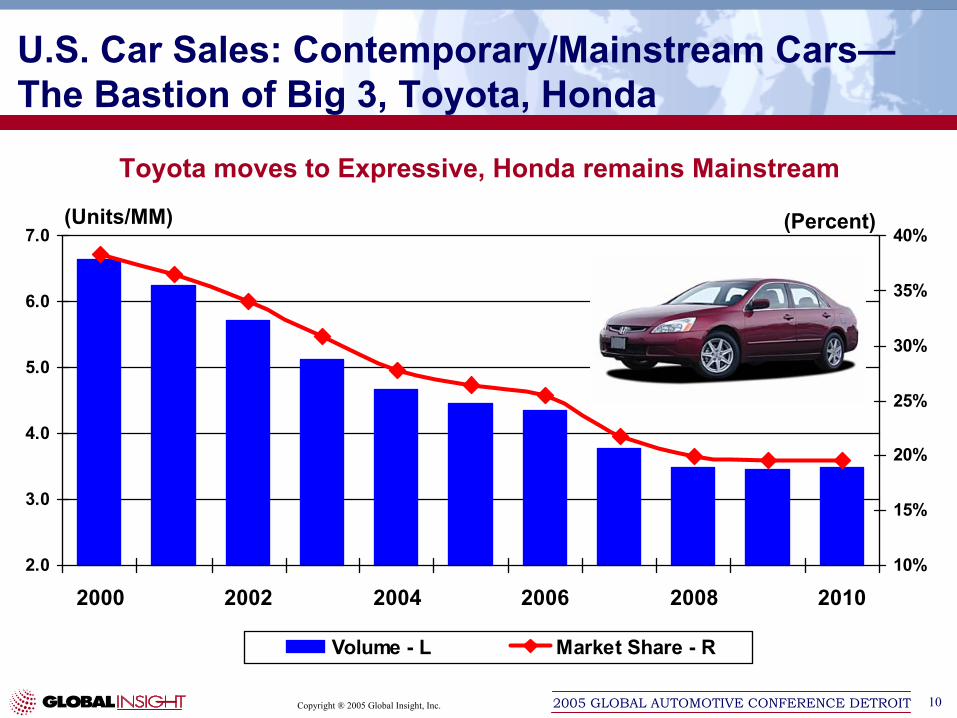
U.S. Car Sales: Contemporary/Mainstream Cars—The Bastion of Big 3, Toyota, Honda
Toyota moves to Expressive, Honda remains Mainstream
Copyright ® 2005 Global Insight, Inc. 112005 GLOBAL AUTOMOTIVE CONFERENCE DETROIT
0.000
0.050
0.100
0.150
0.200
0.250
0.300
0.350
0.400
2003 2005 2007 20090.0%
0.5%
1.0%
1.5%
2.0%
2.5%
3.0%
3.5%
4.0%
Volume - L Market Share - R
(Units/MM) (Percent)
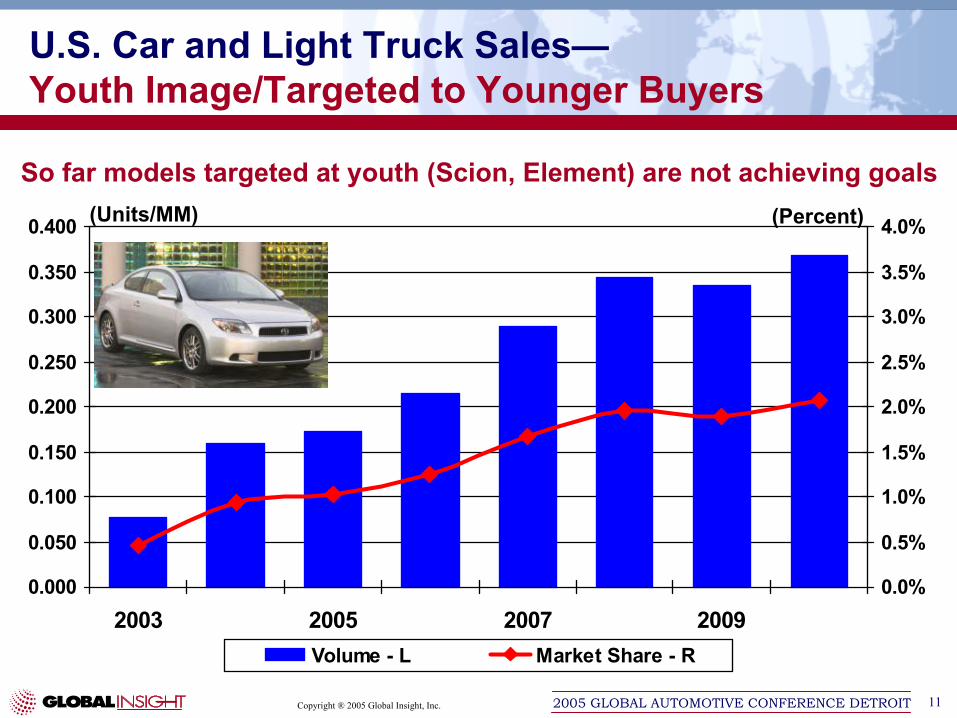
U.S. Car and Light Truck Sales—Youth Image/Targeted to Younger Buyers
So far models targeted at youth (Scion, Element) are not achieving goals
Copyright ® 2005 Global Insight, Inc. 122005 GLOBAL AUTOMOTIVE CONFERENCE DETROIT
0.0
1.0
2.0
3.0
4.0
5.0
2000 2002 2004 2006 2008 20100%
5%
10%
15%
20%
25%
30%
Volume - L Market Share - R
(Units/MM) (Percent)
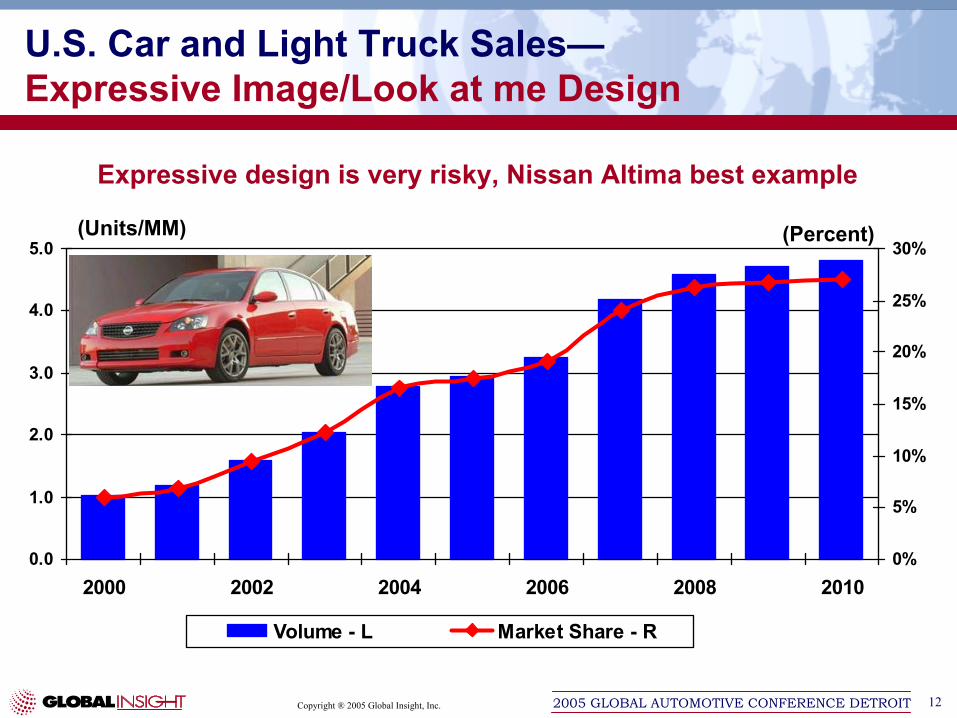
U.S. Car and Light Truck Sales—Expressive Image/Look at me Design
Expressive design is very risky, Nissan Altima best example
Copyright ® 2005 Global Insight, Inc. 132005 GLOBAL AUTOMOTIVE CONFERENCE DETROIT
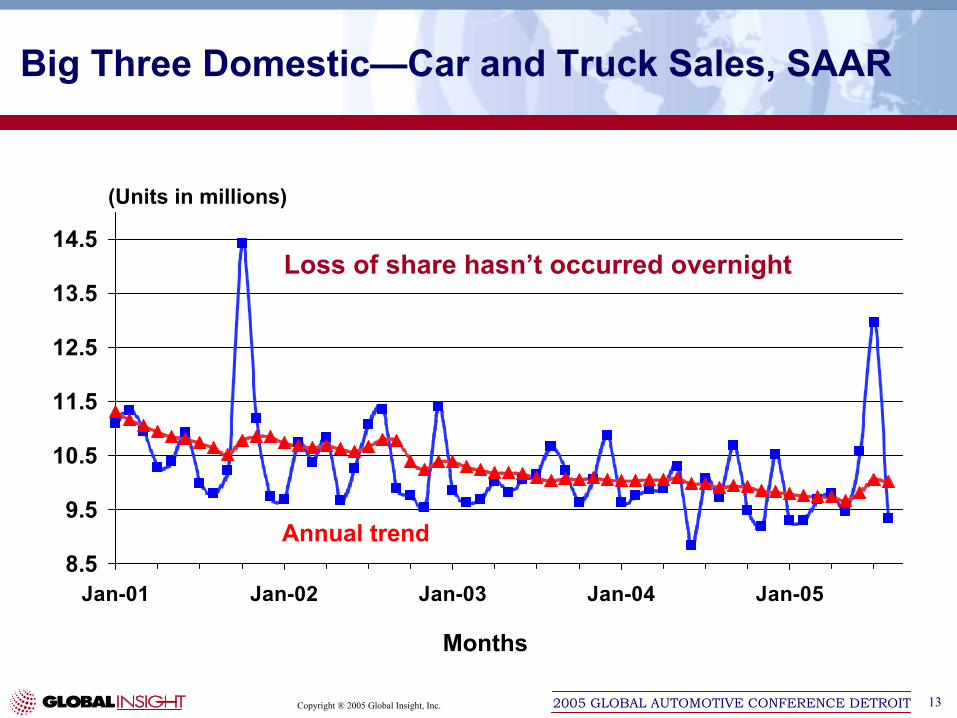
8.5
9.5
10.5
11.5
12.5
13.5
14.5
Jan-01 Jan-02 Jan-03 Jan-04 Jan-05
Months
(Units in millions)
Big Three Domestic—Car and Truck Sales, SAAR
Annual trend
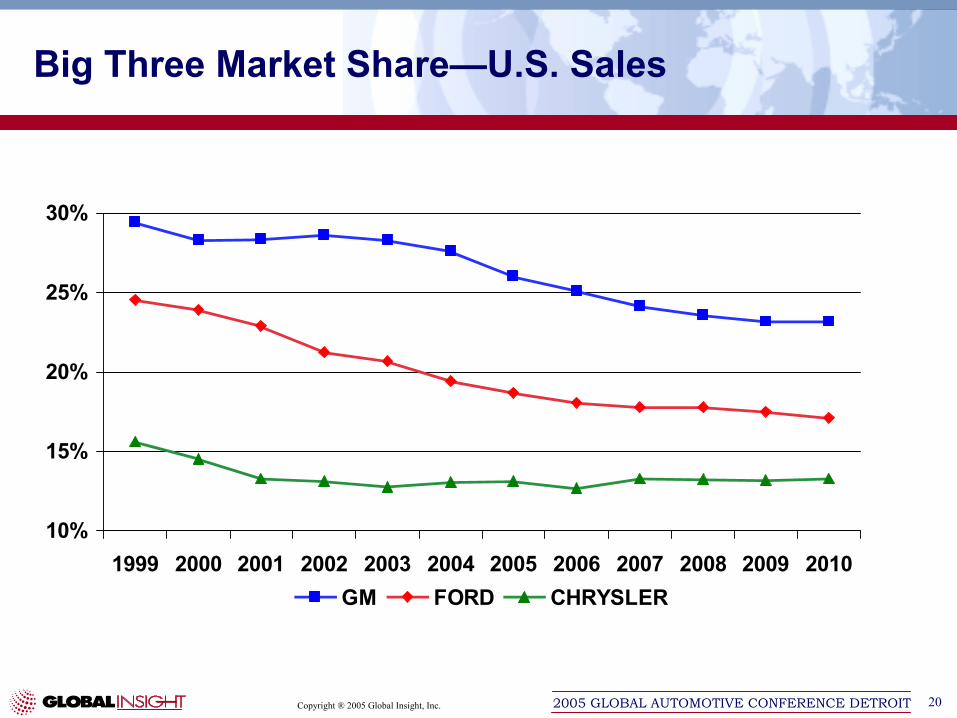
Loss of share hasn’t occurred overnight
Copyright ® 2005 Global Insight, Inc. 142005 GLOBAL AUTOMOTIVE CONFERENCE DETROIT
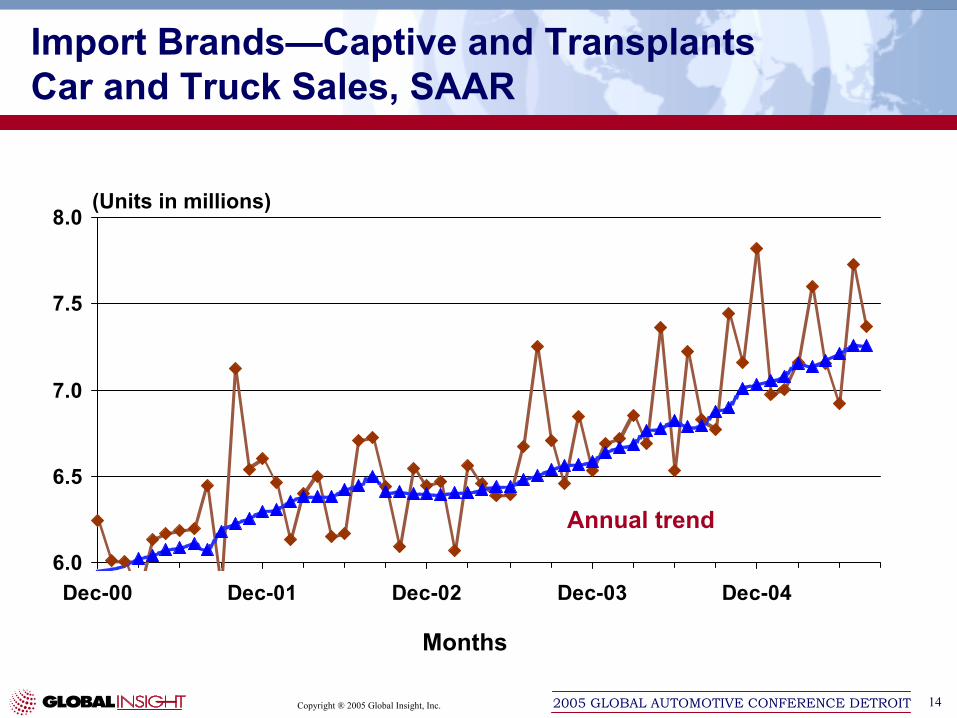
6.0
6.5
7.0
7.5
8.0
Dec-00 Dec-01 Dec-02 Dec-03 Dec-04
Months
(Units in millions)
Import Brands—Captive and TransplantsCar and Truck Sales, SAAR
Annual trend
Copyright ® 2005 Global Insight, Inc. 152005 GLOBAL AUTOMOTIVE CONFERENCE DETROIT
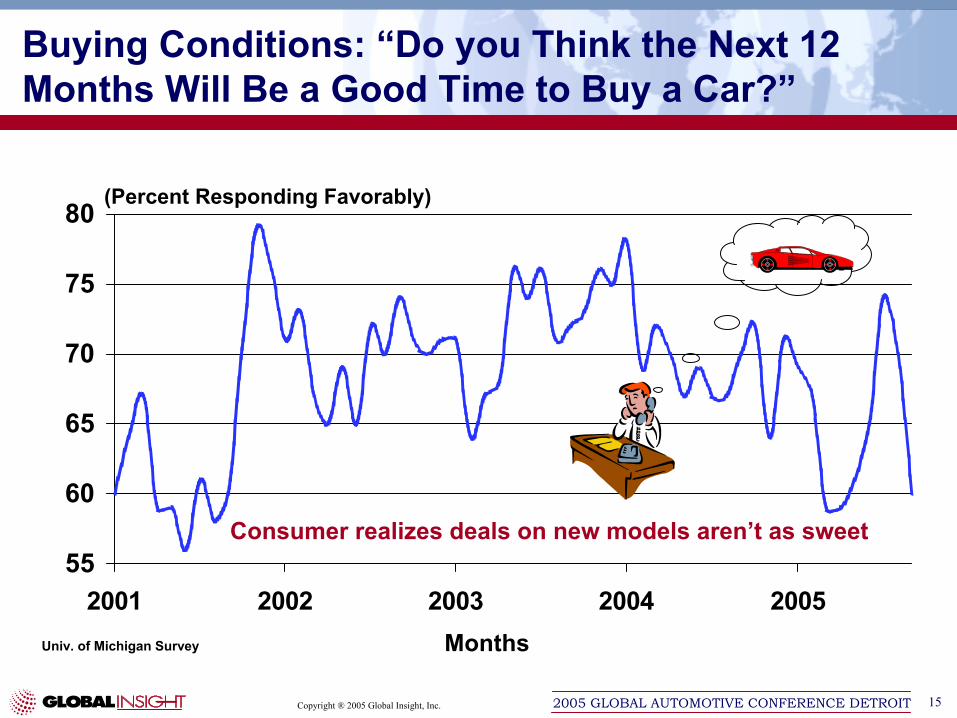
55
60
65
70
75
80
2001 2002 2003 2004 2005
(Percent Responding Favorably)
Univ. of Michigan Survey Months
Buying Conditions: “Do you Think the Next 12 Months Will Be a Good Time to Buy a Car?”
Consumer realizes deals on new models aren’t as sweet
Copyright ® 2005 Global Insight, Inc. 162005 GLOBAL AUTOMOTIVE CONFERENCE DETROIT
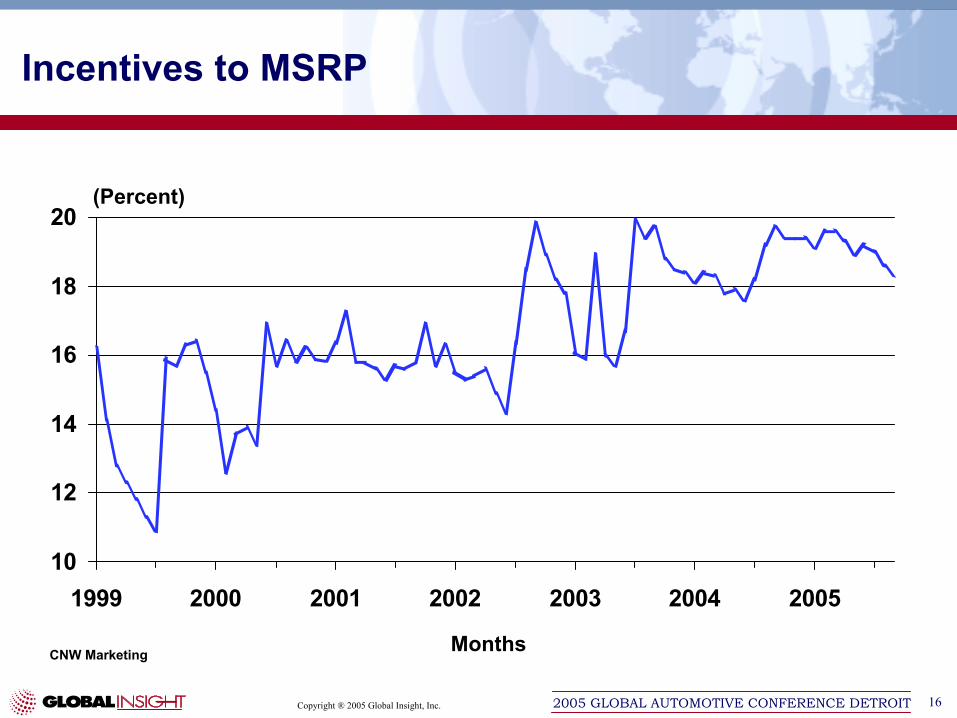
10
12
14
16
18
20
1999 2000 2001 2002 2003 2004 2005
(Percent)
CNW Marketing Months
Incentives to MSRP
Copyright ® 2005 Global Insight, Inc. 172005 GLOBAL AUTOMOTIVE CONFERENCE DETROIT
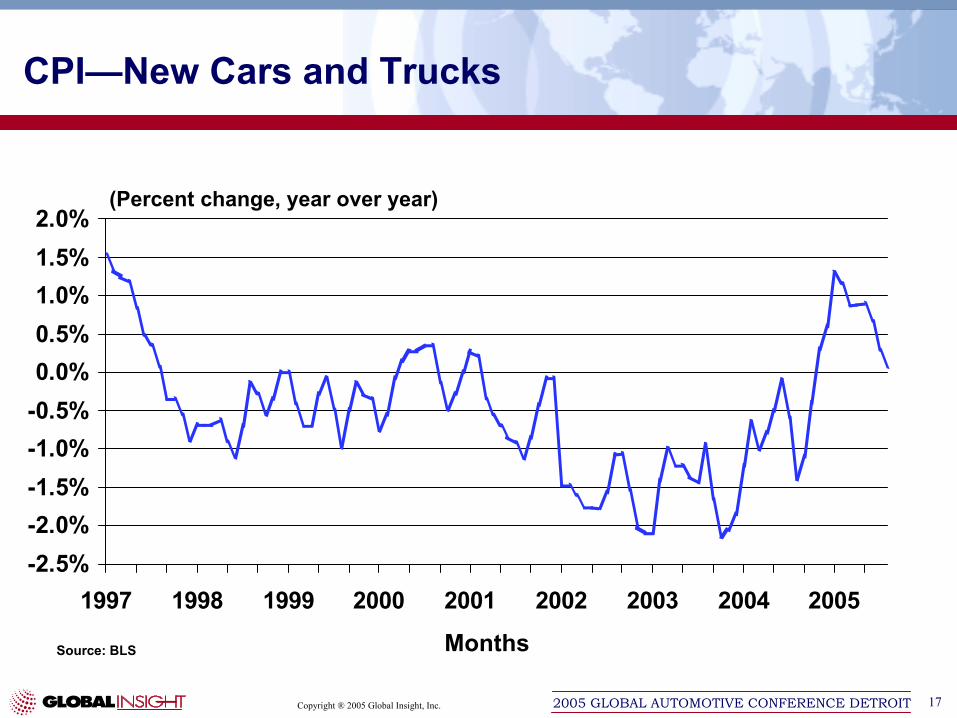
-2.5%-2.0%-1.5%-1.0%-0.5%0.0%0.5%1.0%1.5%2.0%
1997 1998 1999 2000 2001 2002 2003 2004 2005
(Percent change, year over year)
Source: BLS Months
CPI—New Cars and Trucks
Copyright ® 2005 Global Insight, Inc. 182005 GLOBAL AUTOMOTIVE CONFERENCE DETROIT
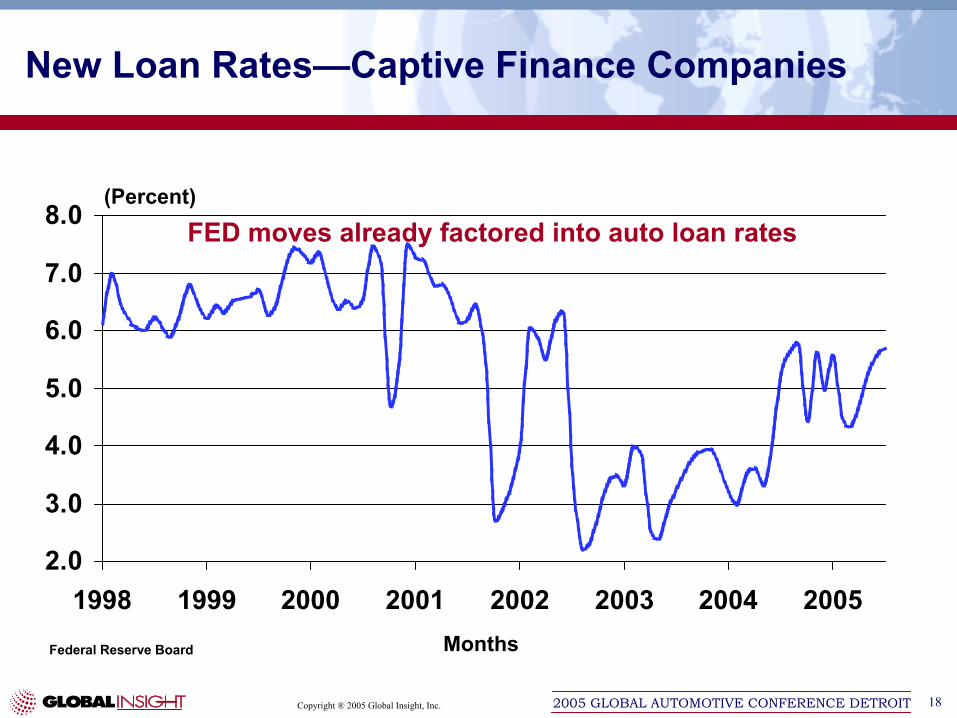
2.0
3.0
4.0
5.0
6.0
7.0
8.0
1998 1999 2000 2001 2002 2003 2004 2005
(Percent)
MonthsFederal Reserve Board
New Loan Rates—Captive Finance Companies
FED moves already factored into auto loan rates
Copyright ® 2005 Global Insight, Inc. 192005 GLOBAL AUTOMOTIVE CONFERENCE DETROIT
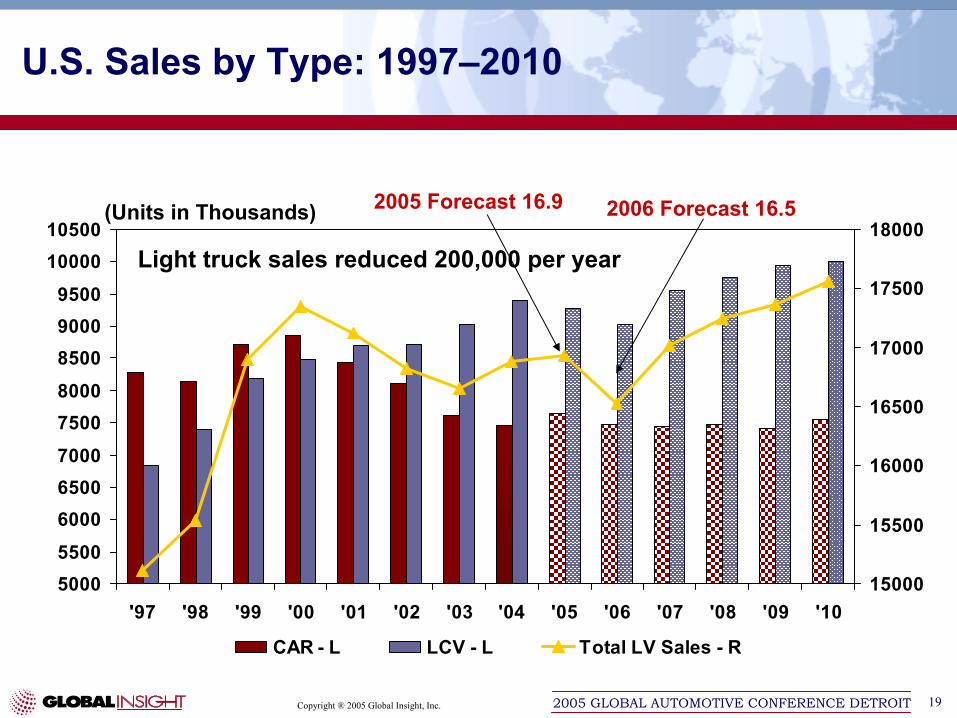
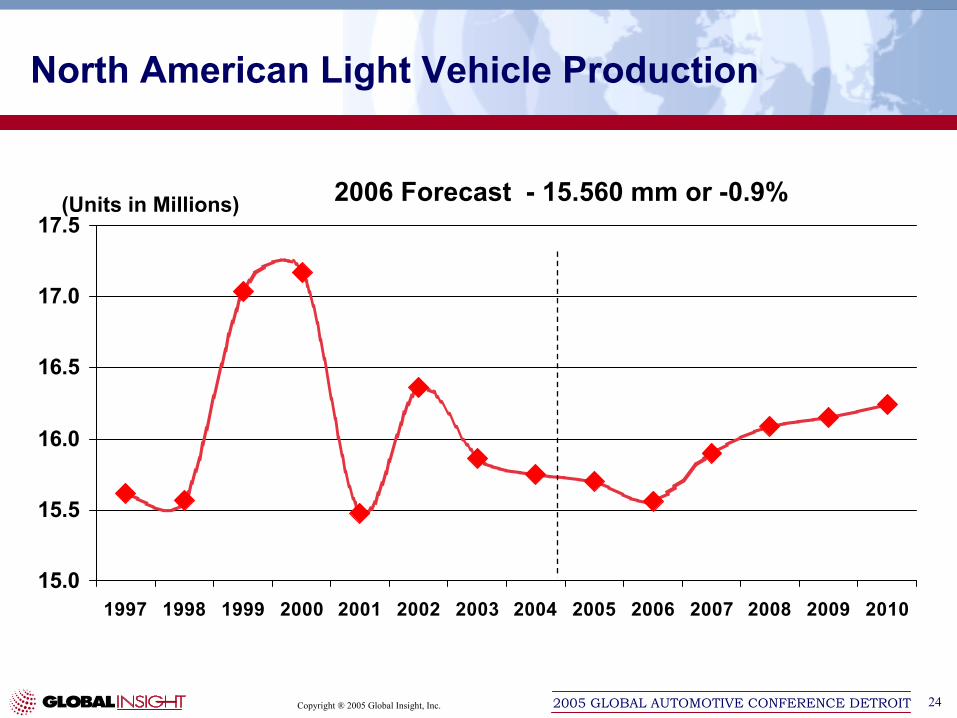
(Units in Millions) 2006 Forecast - 15.560 mm or -0.9%
Copyright ® 2005 Global Insight, Inc. 252005 GLOBAL AUTOMOTIVE CONFERENCE DETROIT
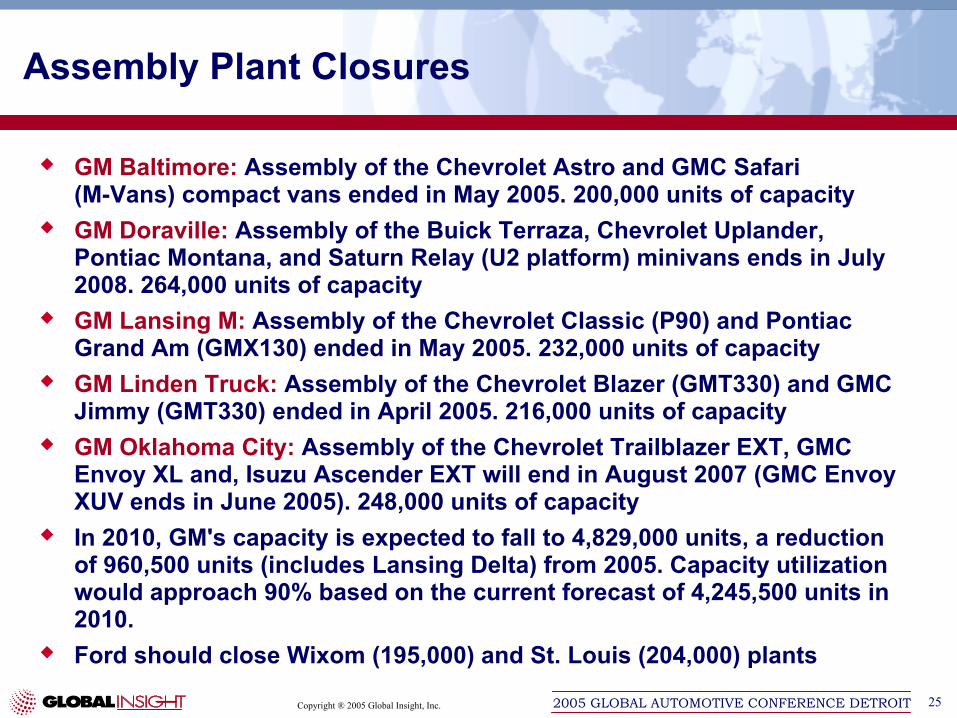
Assembly Plant Closures
GM Baltimore: Assembly of the Chevrolet Astro and GMC Safari (M-Vans) compact vans ended in May 2005. 200,000 units of capacityGM Doraville: Assembly of the Buick Terraza, Chevrolet Uplander, Pontiac Montana, and Saturn Relay (U2 platform) minivans ends in July 2008. 264,000 units of capacityGM Lansing M: Assembly of the Chevrolet Classic (P90) and Pontiac Grand Am (GMX130) ended in May 2005. 232,000 units of capacityGM Linden Truck: Assembly of the Chevrolet Blazer (GMT330) and GMC Jimmy (GMT330) ended in April 2005. 216,000 units of capacityGM Oklahoma City: Assembly of the Chevrolet Trailblazer EXT, GMC Envoy XL and, Isuzu Ascender EXT will end in August 2007 (GMC Envoy XUV ends in June 2005). 248,000 units of capacityIn 2010, GM's capacity is expected to fall to 4,829,000 units, a reduction of 960,500 units (includes Lansing Delta) from 2005. Capacity utilization would approach 90% based on the current forecast of 4,245,500 units in 2010.Ford should close Wixom (195,000) and St. Louis (204,000) plants
Copyright ® 2005 Global Insight, Inc. 262005 GLOBAL AUTOMOTIVE CONFERENCE DETROIT
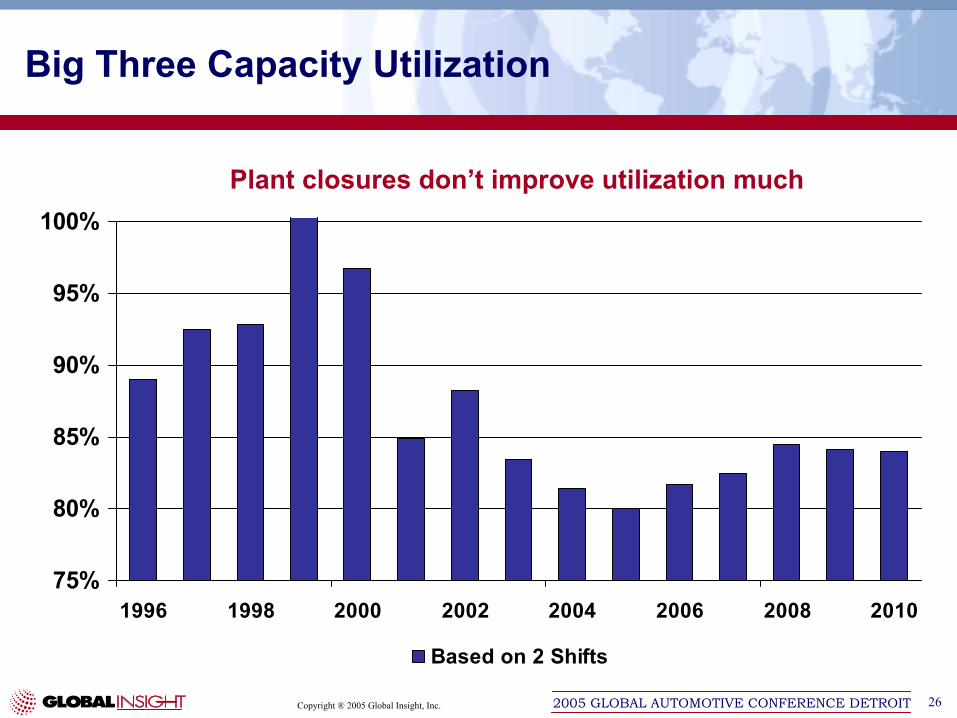
Big Three Capacity Utilization
75%
80%
85%
90%
95%
100%
1996 1998 2000 2002 2004 2006 2008 2010
Based on 2 Shifts
Plant closures don’t improve utilization much
Copyright ® 2005 Global Insight, Inc. 272005 GLOBAL AUTOMOTIVE CONFERENCE DETROIT
Employee price deals will make shift to value pricing difficultPricing on new models not aggressive enoughKatrina has made the environment that much tougher and the risk factor has risen as wellSpike in gasoline prices causes short-term disruptionsLonger term demographics and consumer tastes support and shape the marketProduct, capacity, and inventory have to be aligned to market share in order to relieve pricing pressure
Conclusion
George M. MaglianoDirector of Automotive Industry Research, Americas