16
GLOBAL GLOBAL FUND FLOWS AND ALLOCATIONS DATA Know the Flows…

GLOBAL GLOBAL FUND FLOWS AND ALLOCATIONS DATA
Know the Flows…

GLOBAL GLOBAL FUND FLOWS AND ALLOCATIONS DATA
1
EPFR Global | Company Overview
EPFR Global delivers a complete and transparent picture of institutional and individual
investor flows driving global markets. Strategists, traders, and investors use EPFR flow
and allocation data to gain the most current, global view of changing investor demand
and manager positioning. Trading and allocation strategies leverage EPFR historical and
current data to improve returns and manage risk.
• Series sourced through direct relationships with fund managers and
administrators
• The universe covers over $23.5 trillion in globally domiciled funds.
• EPFR flows are available at either the asset class aggregate, fund
group, investment manager, individual fund and share class levels to
support the most granular and informed insights.
• Comprehensive, transparent, and robust daily, weekly, monthly
updates available in addition to historical time series.

GLOBAL GLOBAL FUND FLOWS AND ALLOCATIONS DATA
EPFR Global | Main Users
2
Government/Central Banks
Asset Managers Hedge Funds
Banking and Brokerage
Strategists
Capital Markets
Research Analysts
Types of usage:
Proprietary trading
Directional calls for clients
Targeting sales efforts
Market analysis
Fund Managers
Portfolio Analysts
Marketing and Product Development
Types of usage:
Factor in investment process
Competitive analysis, product development
Asset allocation
Quantitative analysis
Regulators
Monetary Authorities
Types of usage:
Cross-border flow analysis
Flows impact on currency as well as
local equity/debt markets
Global Macro/EM /Credit trading
Quantitative strategies
Types of usage:
Technical signals/market timing
Momentum strategies
Liquidity analysis
Country/sector selection
GLOBAL GLOBAL FUND FLOWS AND ALLOCATIONS DATA
3
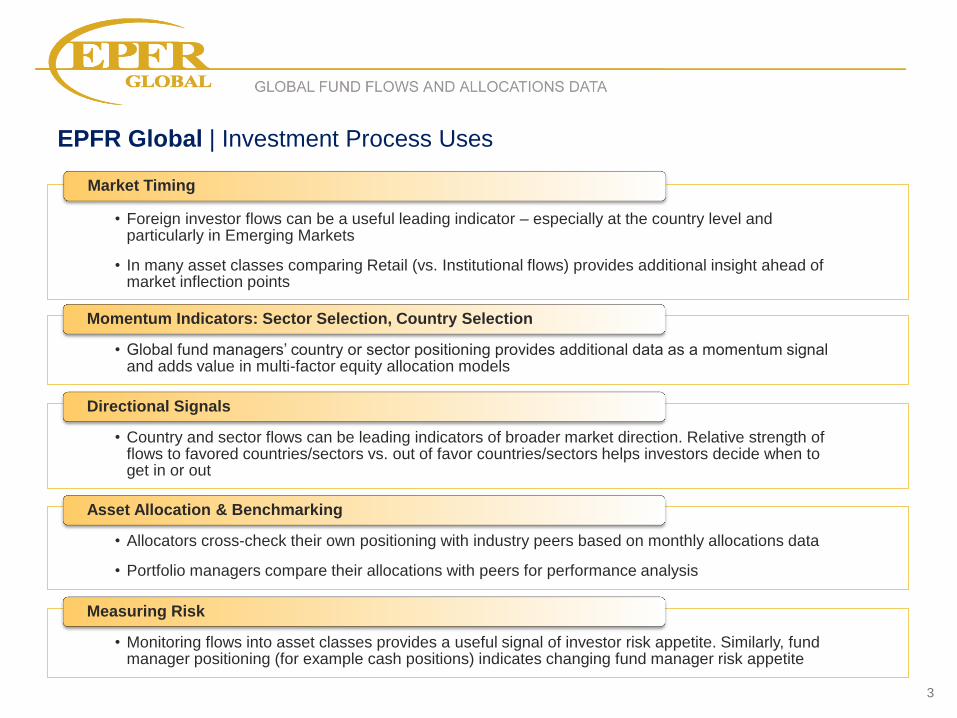
EPFR Global | Investment Process Uses
• Foreign investor flows can be a useful leading indicator – especially at the country level and particularly in Emerging Markets
• In many asset classes comparing Retail (vs. Institutional flows) provides additional insight ahead of market inflection points
Market Timing
• Global fund managers’ country or sector positioning provides additional data as a momentum signal and adds value in multi-factor equity allocation models
Momentum Indicators: Sector Selection, Country Selection
• Country and sector flows can be leading indicators of broader market direction. Relative strength of flows to favored countries/sectors vs. out of favor countries/sectors helps investors decide when to get in or out
Directional Signals
• Allocators cross-check their own positioning with industry peers based on monthly allocations data
• Portfolio managers compare their allocations with peers for performance analysis
Asset Allocation & Benchmarking
• Monitoring flows into asset classes provides a useful signal of investor risk appetite. Similarly, fund manager positioning (for example cash positions) indicates changing fund manager risk appetite
Measuring Risk

GLOBAL GLOBAL FUND FLOWS AND ALLOCATIONS DATA
4
EPFR Global | Key Datasets
Core Datasets (based on data sourced directly from managers or administrators)
Derived Datasets (based on flows and allocations data)
Fund
Flows
Fund manager
allocations at
month-end across
the countries or
sectors they invest
in.
Equity/Bond Fund Flows
Intraday/Daily/Weekly/Monthly
* also includes AUM, Performance
Country Weightings – Monthly
Sector / Industry Weightings – Monthly
Fund
Allocations
Country &
Sector Flows
The amount of
cash flowing
into and out of
funds world-
wide.
Distribution of fund
flows by country or
sector. Combines
data from fund flows
and fund allocations.
Country/Sector/Industry Flows
Daily/Weekly/Monthly
Regional packages available
Daily/Weekly/Monthly

GLOBAL GLOBAL FUND FLOWS AND ALLOCATIONS DATA
Fund Flows | Overview Leverage the transparency of the EPFR universe and the granular breakdown of flows by investor type
5
• Geographic investment focus
• Style/sector
• Bond categories
Asset Class Breakdown
• Institutional vs. Retail
• US Domiciled vs. Non-US Domiciled
Investor Types Differentiation
• Dedicated Country Funds vs. Global, GEM, and Regional Mandates
• Mutual funds vs. ETFs
• Active vs. Passive
Fund Types Differentiation
Fund
Flows
The amount
of cash
flowing into
and out of
funds world-
wide.
What are Fund Flows?
Calculates “Net Flows” (investor
contributions/redemptions) for individual
funds and then add these up by asset
class
Net Flow calculations exclude portfolio
performance and currency fluctuations
Includes funds registered globally not just
those domiciled in the US
Updated intraday/daily/weekly/monthly
Fund
Flows
The amount of
cash flowing
into and out of
funds world-
wide.
GLOBAL GLOBAL FUND FLOWS AND ALLOCATIONS DATA
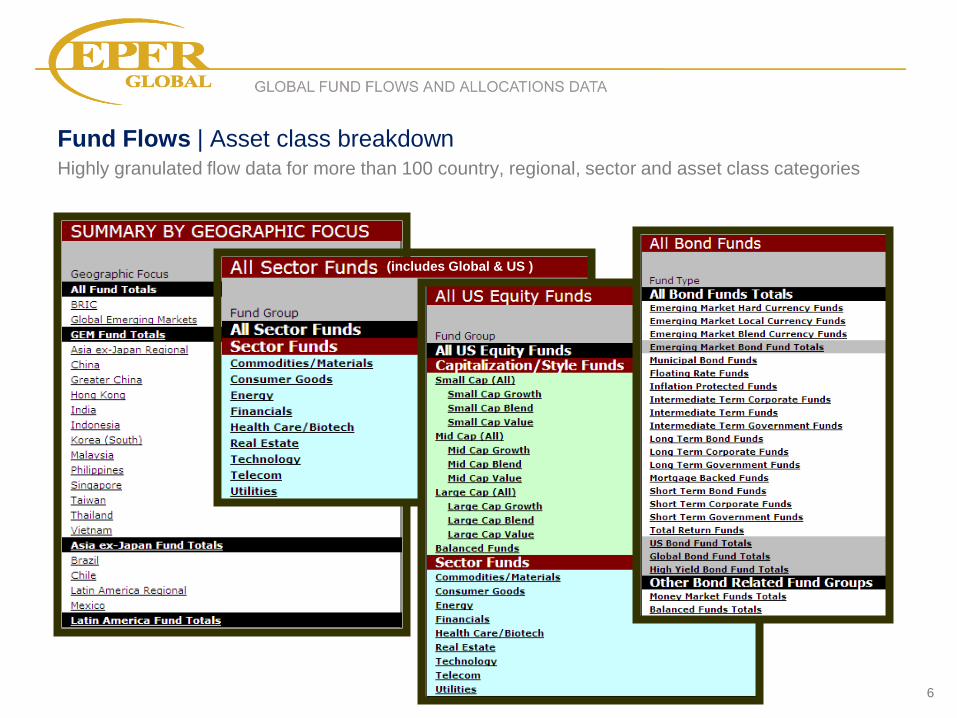
Fund Flows | Asset class breakdown Highly granulated flow data for more than 100 country, regional, sector and asset class categories
6
(includes Global & US )

GLOBAL GLOBAL FUND FLOWS AND ALLOCATIONS DATA
7
Fund Flows | Drill down to detail view ……………………………………………………………………………..………………………………………………….………….……
7

GLOBAL GLOBAL FUND FLOWS AND ALLOCATIONS DATA
Fund Flows | Investor differentiation (retail vs. institutional, local vs. foreign)
US equity fund flows since January 2009
8
All investor types US Institutional Investors
US Retail investors Non-US investors in US equity
• Only US institutional investors were the main buyers ‘at the bottom’
• US Retail investors missed the big US Equity rally between Q2/2010 and Q1/2011.
Retail investors return Jan 2011 in time for the Mar 2011 correction
• Non-US investors (US equity funds domiciled ex US) stayed away in Q2/Q3 2010

GLOBAL GLOBAL FUND FLOWS AND ALLOCATIONS DATA
9
• Using overall country weights vs benchmark as a momentum signal
• Differentiating active funds weights vs passive funds weights
Momentum Indicators
• Comparing country/sector/cash positions with peer group
Benchmarking
• Tracking the ‘smart money’ – which fund types get in/out at the optimal time. How are global managers positioned vs regional funds
Market Timing
Fund
Allocations
Fund manager
allocations at
month-end across
the countries or
sectors they invest
in.
What are Fund Allocations?
Monthly data reported by managers or
administrators (based on holdings, fund
factsheets)
Fund level detail includes total fund
assets, % weight in cash, % weight by
country
Includes funds registered globally
not just US
Country & Sector Allocations | Overview

GLOBAL GLOBAL FUND FLOWS AND ALLOCATIONS DATA
10
Actual country and regional weightings (in % of AUM)
Country Allocations | Overview
10
GLOBAL GLOBAL FUND FLOWS AND ALLOCATIONS DATA
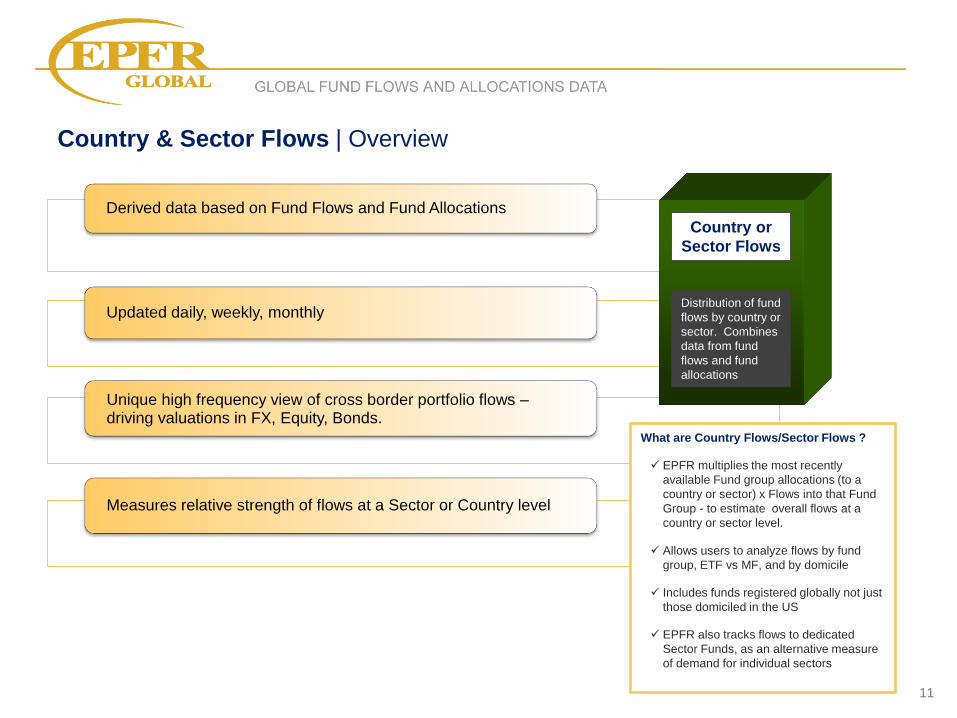
Country & Sector Flows | Overview
Derived data based on Fund Flows and Fund Allocations
Updated daily, weekly, monthly
Unique high frequency view of cross border portfolio flows – driving valuations in FX, Equity, Bonds.
Measures relative strength of flows at a Sector or Country level
11
Fund
Allocations
Fund manager
allocations at
month-end across
the countries or
sectors they invest
in.
What are Country Flows/Sector Flows ?
EPFR multiplies the most recently
available Fund group allocations (to a
country or sector) x Flows into that Fund
Group - to estimate overall flows at a
country or sector level.
Allows users to analyze flows by fund
group, ETF vs MF, and by domicile
Includes funds registered globally not just
those domiciled in the US
EPFR also tracks flows to dedicated
Sector Funds, as an alternative measure
of demand for individual sectors
Country or
Sector Flows
Distribution of fund
flows by country or
sector. Combines
data from fund
flows and fund
allocations

GLOBAL GLOBAL FUND FLOWS AND ALLOCATIONS DATA
Sector Flows | Overview
12
-0.2%
-0.1%
0.0%
0.1%
0.2%
-0.2%
-0.1%
0.0%
0.1%
0.2%
-0.4%
-0.2%
0.0%
0.2%
0.4%
-0.4%
-0.2%
0.0%
0.2%
0.4%
-0.2%
-0.1%
0.0%
0.1%
0.2%
-0.2%
-0.1%
0.0%
0.1%
0.2%
-0.3%
-0.2%
0.0%
0.2%
0.3%
-0.2%
-0.1%
0.0%
0.1%
0.2%
-0.2%
-0.1%
0.0%
0.1%
0.2%
-0.2%
-0.1%
0.0%
0.1%
0.2%
0.0%
0.5%
1.0%
1.5%
2.0%
0.0%
0.5%
1.0%
1.5%
2.0%
0.0%
0.8%
1.5%
2.3%
3.0%
0.0%
0.8%
1.5%
2.3%
3.0%
0.0%
0.3%
0.5%
0.8%
1.0%
0.0%
1.0%
2.0%
0.0%
0.5%
1.0%
1.5%
2.0%
0.0%
1.0%
2.0%
3.0%
4.0%
0.0%
1.0%
2.0%
3.0%
4.0%
-1.0%
-0.5%
0.0%
0.5%
1.0%
Consumer Discretionary Consumer Stapes
Energy
Healthcare
IT
Telecom
Financials
Industrials
Materials
Utilities
3Q11 4Q11 1Q11 2Q11 3Q12 4Q12 1Q12 2Q12 3Q11 4Q11 1Q11 2Q11 3Q12 4Q12 1Q12 2Q12
3Q11 4Q11 1Q11 2Q11 3Q12 4Q12 1Q12 2Q12 3Q11 4Q11 1Q11 2Q11 3Q12 4Q12 1Q12 2Q12
3Q11 4Q11 1Q11 2Q11 3Q12 4Q12 1Q12 2Q12 3Q11 4Q11 1Q11 2Q11 3Q12 4Q12 1Q12 2Q12
3Q11 4Q11 1Q11 2Q11 3Q12 4Q12 1Q12 2Q12 3Q11 4Q11 1Q11 2Q11 3Q12 4Q12 1Q12 2Q12
3Q11 4Q11 1Q11 2Q11 3Q12 4Q12 1Q12 2Q12 3Q11 4Q11 1Q11 2Q11 3Q12 4Q12 1Q12 2Q12
Cumulative
Flows (rhs) Weekly Flows
(% AuM)
Sustained flows are
observed as a bullish
indicator while short
term weekly fluctuations
can be contrarian
indicators

GLOBAL GLOBAL FUND FLOWS AND ALLOCATIONS DATA
13
Investment Models / Strategies
EPFR offers back-tested trading strategies combining flows, allocations and
valuation data + EPFR Analyst support as needed
• Sector rotation strategies
• Country selection (EM, also Global country selection)
• Equity Regional trading
• FX signals
Research offering
EPFR Chartbook: Regular research report highlighting recent global trends
from a flow and allocation perspective
Delivery options
• Interactive access to all EPFR datasets described above, via web-based
user interface
• FTP delivery
• Haver Analytics delivery
• Email /web delivery of EPFR Chartbook
• Premium Services:
Personalized daily/weekly/monthly charts and Excel reports
delivered by email – e.g. flows by country, sector, or asset class
Ad-hoc email delivery of EPFR research notes
Calls with EPFR macro and quant analysts
Third Party Whitepapers
• Journal of Finance (American Finance Association) December 2012
“Asset fire sales and the transmission of funding shocks”
• IMF Working Paper, Feb. 2012, “Coincident Indicators of Capital Flow”
• Institute of International Finance December 2013 ‘Fed policy and EM
Capital flows’
• HSBC, “Sector allocations data and predictive power”
• Deutsche Bank, “Predictive Power of Weekly fund flows”
EPFR Global | Product Summary
Underlying EPFR data available
Fund Flows
• Equity, Bond, Money Market, Balanced and Speciality fund groups
• Intraday/Daily/Weekly/Monthly data that track net flows (investor
contributions/redemptions) for individual funds and fund groups
• Filters to separate flows by Retail vs. Institutional investor, ETF vs. MF, Active vs.
Passive, and by Domicile (country of domicile), Currency (currency of fund), or
Benchmark
• Net flows exclude portfolio performance and currency effect
• Equity history to Jan 1995 (Monthly) , Oct 2000 (Weekly), and May 2007 (Daily)
• Bond history to Jan 2004 (Monthly), Apr 2004 (Weekly), and May 2007 (Daily)
Country Allocations
• Equity and Bond fund groups
• Monthly data tracking the aggregate country and regional weightings, in % terms,
of fund groups such as Global, GEM etc., as well as of individual asset managers
and funds
• Equity history to Jan 1995 (GEM funds) and Jan 2001 (Global funds)
• Bond history to Nov 2001 (GEM funds) and Jul 2005 (Global funds)
Sector/Industry Allocations
• Equity fund groups
• Monthly data that track the aggregate sector/industry (GICS I/II) weightings, in %
terms, of fund groups such as Global, GEM etc., as well as of individual asset
managers and funds
• History to 2006
Country Flows
• Equity and Bond fund groups
• Daily/Weekly/Monthly data that track the flow of money into (and out of) individual
countries and regions
• Equity history to March 1995 (Monthly), Oct 2000 (Weekly) , May 2007 (Daily)
• Bond history to Jan 2004 (Monthly), Apr 2004 (Weekly), May 2007 (Daily)
Sector/Industry Flows
• Equity fund groups
• Daily/Weekly/Monthly data that track the flow of money in/out of individual
sectors/industries (GICS I/II)
• History to Jan 1995 (Monthly), Oct 2000 (Weekly), May 2007 (Daily)

GLOBAL GLOBAL FUND FLOWS AND ALLOCATIONS DATA
EPFR Global | Company History
• EPFR Global founded Cambridge, Massachusetts USA 1994
• EPFR Global launches Russia Portfolio, Central Europe Portfolio and Brazil Portfolio: publications serving more than
600 institutional investor clients worldwide
1995-
1999
• EPFR Global launches Research and Analysis Services, providing independent research services for investment
management firms 2000
• EPFR Global acquires Emerging Market Funds Research, Inc., a database of global equity and fixed income funds. 2001
• EPFR Global’s client base expanded by nearly 10-fold and includes leading institutional investors, global equity and
fixed income analysts, strategists, investment managers, hedge funds, central bankers
2001-
2007
• EPFR Global launches new Web Interface, new Country/Sector flows datasets, and automated data options including
delivery via Haver Analytics (2009) 2008
• EPFR Global launches new asset allocation models and investment strategy research 2012
• EPFR Global acquired by Informa PLC 2010
• EPFR Global continues to expand global fund data coverage, add local support staff, and enhance delivery options 2013

GLOBAL GLOBAL FUND FLOWS AND ALLOCATIONS DATA
Dwight Ingalsbe Managing Director Tel: (1) 617-8864-4999 ext. 26 Email: [email protected]
Ian Wilson Managing Director, Fund Data Tel: (1) 804-217-8653 Email: [email protected]
Simon Ringrose Managing Director, Sales Tel: (1) 617-864-4999 ext. 30 Email: [email protected]
Cameron Brandt Director, Research Tel: (1) 617-864-4999 ext. 22 Email: [email protected]
Patrick Paradiso Manager, Global Accounts Tel: (1) 917-543-6181 Email: [email protected]
Jean-Claude Moos Sales Director (US) Tel: (1) 212-907-5814 Email: [email protected]
Ana-Belen Escobar F. Sales Associate (Americas) Tel: (1) 617-864-4999 ext. 21 Email: [email protected]
Rikolv Hatlehol-Desai Sales Director (EMEA) Tel: (44) 7766 805657 Email: [email protected]
Calum Byrne Business Development Manager (EMEA) Tel: (44) 20 7017 5772 Email: [email protected]
Elizabeth Badolato Sales Director (Hong Kong) Tel: (852) 2234-2063 Email: [email protected]
Robert Sheridan Sales Director (Asia/Pacific) Tel: (65) 8484 1094 Email: [email protected]
Young-il Sunwoo Sales (Korea) Tel: (821) 9608-0101 Email: [email protected]
EPFR Global | Key Contacts
Todd Willits Manager, Client Services Tel: (1) 617-864-4999 ext. 27 Email: [email protected]
Adam Longenecker Quantitative Analyst Tel: (1) 904-536-2945 Email: [email protected]
Sales Director ( China/Taiwan) Tel: (86)186.010 93836. Email: [email protected] Bin Peng


