41
Kotak Portfolio Management Services Special Situations Value Portfolio April 2018
Kotak Portfolio Management ServicesSpecial Situations Value Portfolio
April 2018
Presentation Agenda
2
Why Kotak Asset Management PMS?
Special Situations Value Strategy
Special Situations
Value Opportunities
1
2
2a:
2b:
3
Why Kotak Asset Management PMS?
Special Situations Value Strategy
Special Situations
Value Opportunities
1
2
2a:
2b:
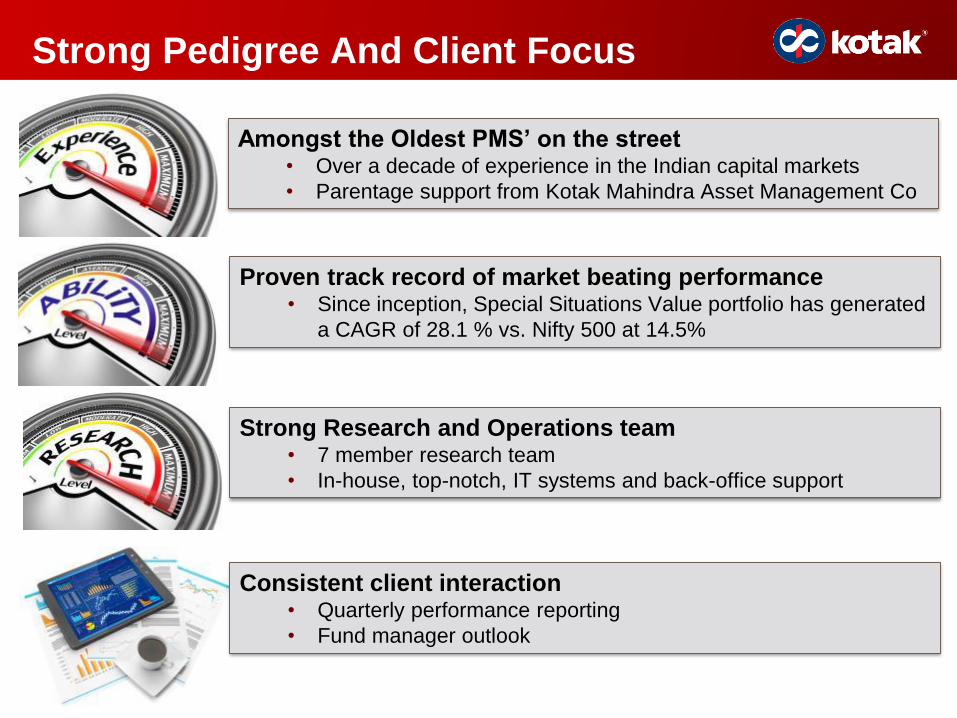
Strong Pedigree And Client Focus
4
Amongst the Oldest PMS’ on the street• Over a decade of experience in the Indian capital markets
• Parentage support from Kotak Mahindra Asset Management Co
Proven track record of market beating performance• Since inception, Special Situations Value portfolio has generated
a CAGR of 28.1 % vs. Nifty 500 at 14.5%
Strong Research and Operations team• 7 member research team
• In-house, top-notch, IT systems and back-office support
Consistent client interaction• Quarterly performance reporting
• Fund manager outlook
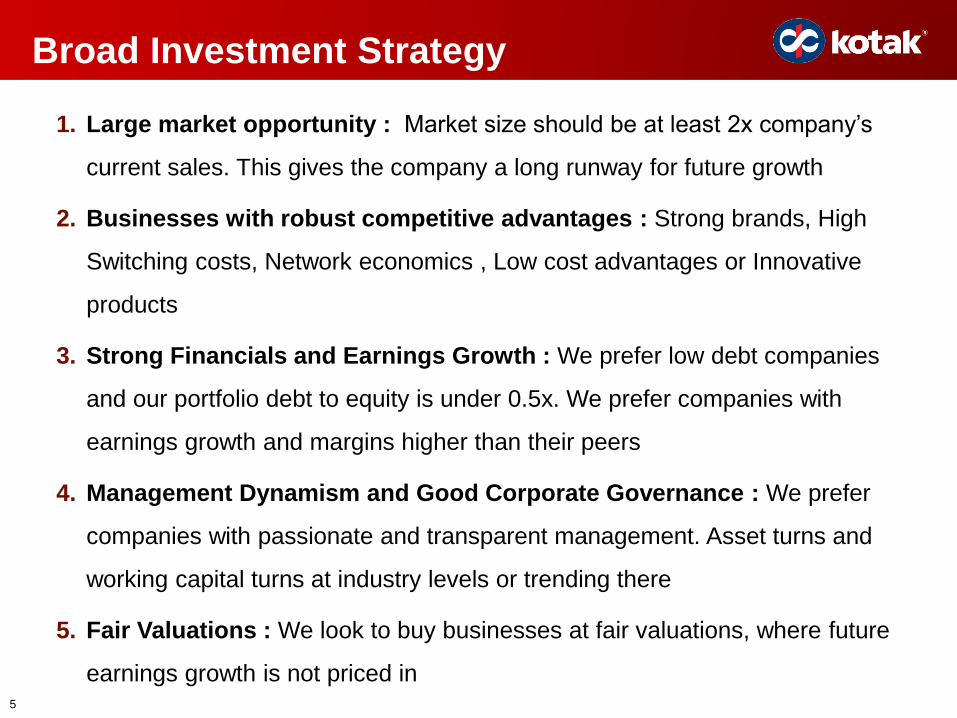
Broad Investment Strategy
1. Large market opportunity : Market size should be at least 2x company’s
current sales. This gives the company a long runway for future growth
2. Businesses with robust competitive advantages : Strong brands, High
Switching costs, Network economics , Low cost advantages or Innovative
products
3. Strong Financials and Earnings Growth : We prefer low debt companies
and our portfolio debt to equity is under 0.5x. We prefer companies with
earnings growth and margins higher than their peers
4. Management Dynamism and Good Corporate Governance : We prefer
companies with passionate and transparent management. Asset turns and
working capital turns at industry levels or trending there
5. Fair Valuations : We look to buy businesses at fair valuations, where future
earnings growth is not priced in 5
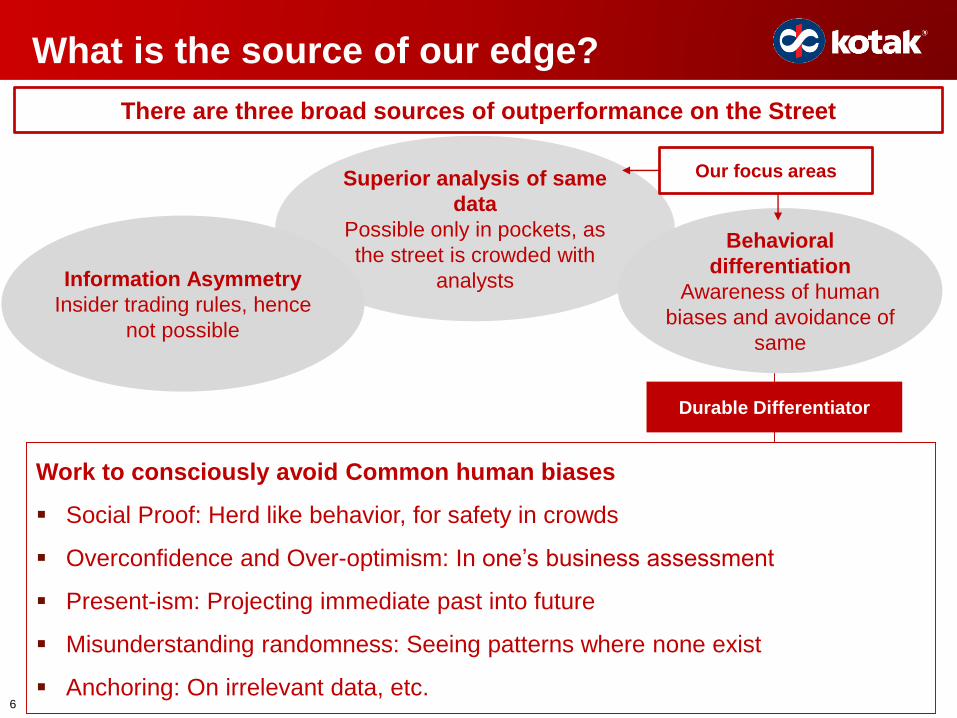
What is the source of our edge?
Information Asymmetry
Insider trading rules, hence
not possible
Superior analysis of same
data
Possible only in pockets, as
the street is crowded with
analysts
Durable Differentiator
Behavioral
differentiation
Awareness of human
biases and avoidance of
same
Work to consciously avoid Common human biases
Social Proof: Herd like behavior, for safety in crowds
Overconfidence and Over-optimism: In one’s business assessment
Present-ism: Projecting immediate past into future
Misunderstanding randomness: Seeing patterns where none exist
Anchoring: On irrelevant data, etc.
There are three broad sources of outperformance on the Street
Our focus areas
6
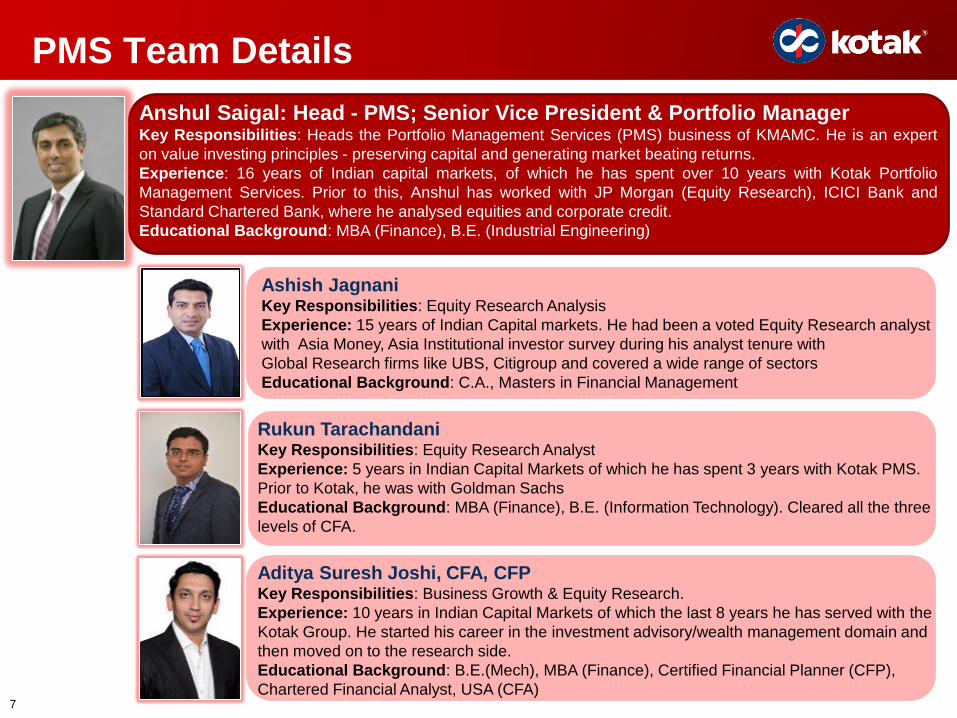
PMS Team Details
7
Anshul Saigal: Head - PMS; Senior Vice President & Portfolio ManagerKey Responsibilities: Heads the Portfolio Management Services (PMS) business of KMAMC. He is an expert
on value investing principles - preserving capital and generating market beating returns.
Experience: 16 years of Indian capital markets, of which he has spent over 10 years with Kotak Portfolio
Management Services. Prior to this, Anshul has worked with JP Morgan (Equity Research), ICICI Bank and
Standard Chartered Bank, where he analysed equities and corporate credit.
Educational Background: MBA (Finance), B.E. (Industrial Engineering)
Ashish JagnaniKey Responsibilities: Equity Research Analysis
Experience: 15 years of Indian Capital markets. He had been a voted Equity Research analyst
with Asia Money, Asia Institutional investor survey during his analyst tenure with
Global Research firms like UBS, Citigroup and covered a wide range of sectors
Educational Background: C.A., Masters in Financial Management
Rukun TarachandaniKey Responsibilities: Equity Research Analyst
Experience: 5 years in Indian Capital Markets of which he has spent 3 years with Kotak PMS.
Prior to Kotak, he was with Goldman Sachs
Educational Background: MBA (Finance), B.E. (Information Technology). Cleared all the three
levels of CFA.
Aditya Suresh Joshi, CFA, CFPKey Responsibilities: Business Growth & Equity Research.
Experience: 10 years in Indian Capital Markets of which the last 8 years he has served with the
Kotak Group. He started his career in the investment advisory/wealth management domain and
then moved on to the research side.
Educational Background: B.E.(Mech), MBA (Finance), Certified Financial Planner (CFP),
Chartered Financial Analyst, USA (CFA)
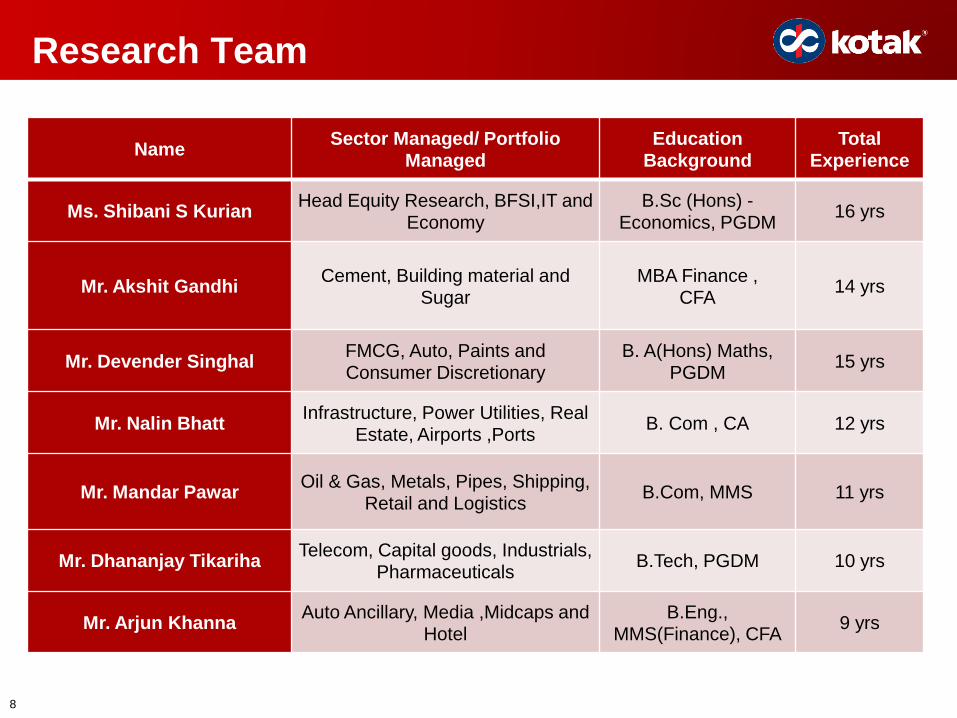
Research Team
8
NameSector Managed/ Portfolio
ManagedEducation
BackgroundTotal
Experience
Ms. Shibani S KurianHead Equity Research, BFSI,IT and
EconomyB.Sc (Hons) -
Economics, PGDM16 yrs
Mr. Akshit GandhiCement, Building material and
SugarMBA Finance ,
CFA14 yrs
Mr. Devender SinghalFMCG, Auto, Paints and Consumer Discretionary
B. A(Hons) Maths, PGDM
15 yrs
Mr. Nalin BhattInfrastructure, Power Utilities, Real
Estate, Airports ,PortsB. Com , CA 12 yrs
Mr. Mandar PawarOil & Gas, Metals, Pipes, Shipping,
Retail and LogisticsB.Com, MMS 11 yrs
Mr. Dhananjay TikarihaTelecom, Capital goods, Industrials,
PharmaceuticalsB.Tech, PGDM 10 yrs
Mr. Arjun KhannaAuto Ancillary, Media ,Midcaps and
HotelB.Eng.,
MMS(Finance), CFA9 yrs
9
Why Kotak Asset Management PMS?
Special Situations Value Strategy
Special Situations
Value Opportunities
1
2
2a:
2b:
Special Situations Value Strategy
10
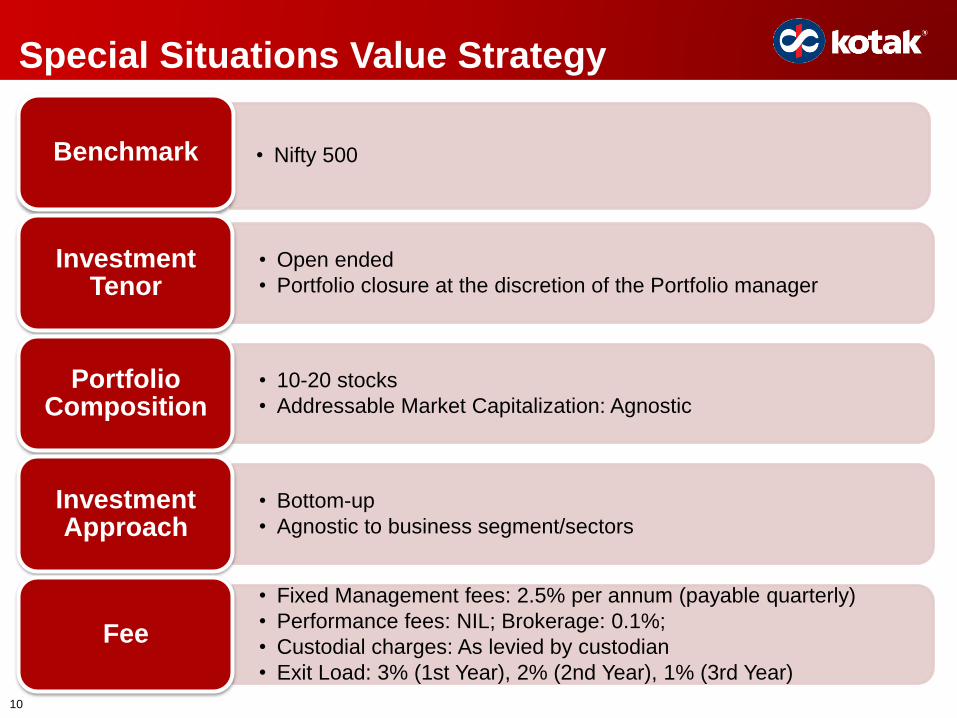
• Nifty 500Benchmark
• Open ended
• Portfolio closure at the discretion of the Portfolio manager
Investment Tenor
• 10-20 stocks
• Addressable Market Capitalization: Agnostic
Portfolio Composition
• Bottom-up
• Agnostic to business segment/sectors
InvestmentApproach
• Fixed Management fees: 2.5% per annum (payable quarterly)
• Performance fees: NIL; Brokerage: 0.1%;
• Custodial charges: As levied by custodian
• Exit Load: 3% (1st Year), 2% (2nd Year), 1% (3rd Year)
Fee
The Universe - Value Opportunities
11
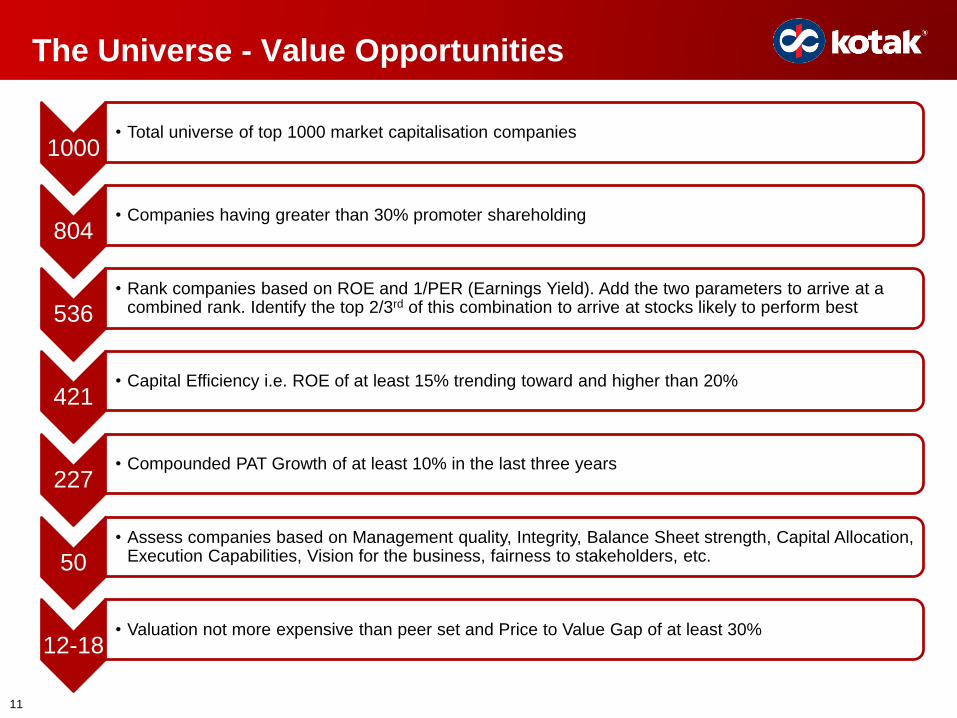
1000• Total universe of top 1000 market capitalisation companies
804• Companies having greater than 30% promoter shareholding
536• Rank companies based on ROE and 1/PER (Earnings Yield). Add the two parameters to arrive at a
combined rank. Identify the top 2/3rd of this combination to arrive at stocks likely to perform best
421• Capital Efficiency i.e. ROE of at least 15% trending toward and higher than 20%
227• Compounded PAT Growth of at least 10% in the last three years
50• Assess companies based on Management quality, Integrity, Balance Sheet strength, Capital Allocation,
Execution Capabilities, Vision for the business, fairness to stakeholders, etc.
12-18• Valuation not more expensive than peer set and Price to Value Gap of at least 30%
12
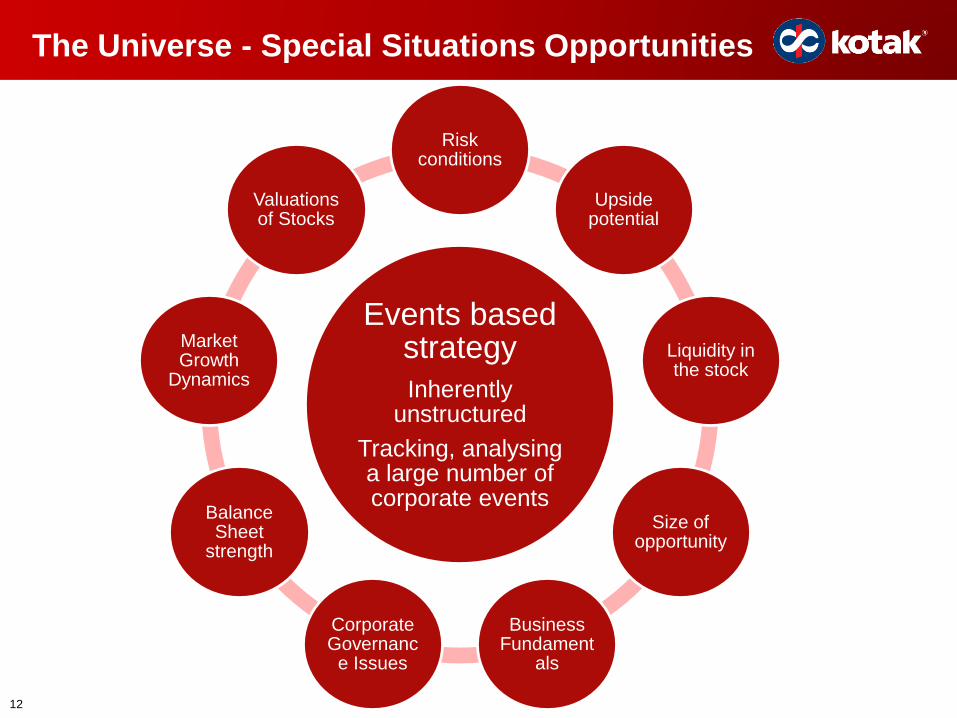
Events based strategy
Inherently unstructured
Tracking, analysing a large number of corporate events
Risk conditions
Upside potential
Liquidity in the stock
Size of opportunity
Business Fundament
als
Corporate Governanc
e Issues
Balance Sheet
strength
Market Growth
Dynamics
Valuations of Stocks
The Universe - Special Situations Opportunities
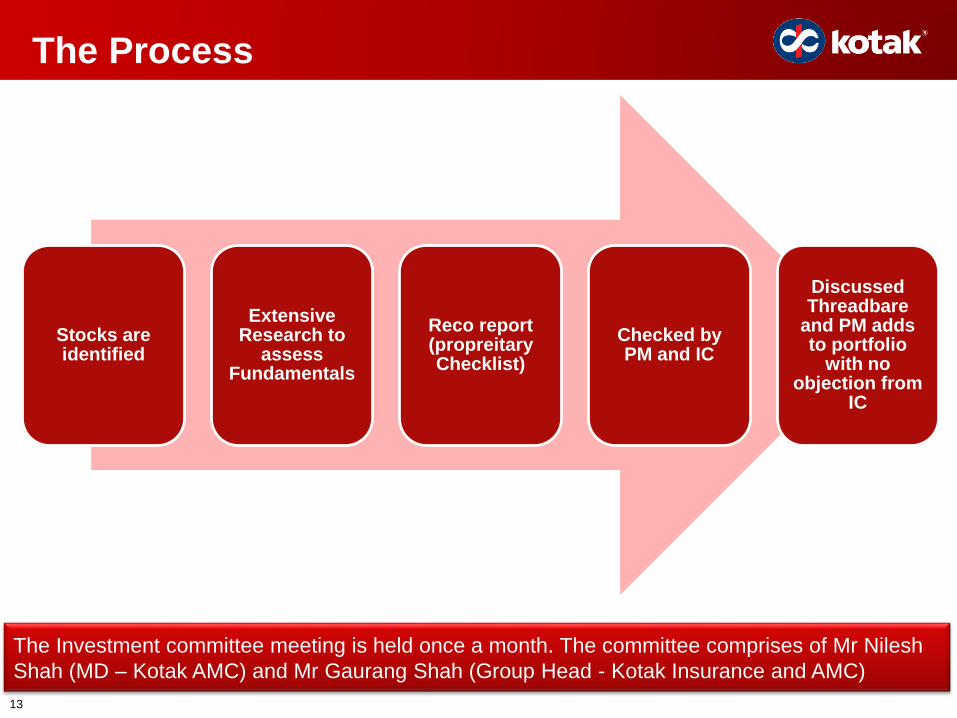
The Process
13
Stocks are identified
Extensive Research to
assess Fundamentals
Reco report (propreitaryChecklist)
Checked by PM and IC
Discussed Threadbare
and PM adds to portfolio
with no objection from
IC
The Investment committee meeting is held once a month. The committee comprises of Mr Nilesh
Shah (MD – Kotak AMC) and Mr Gaurang Shah (Group Head - Kotak Insurance and AMC)
14
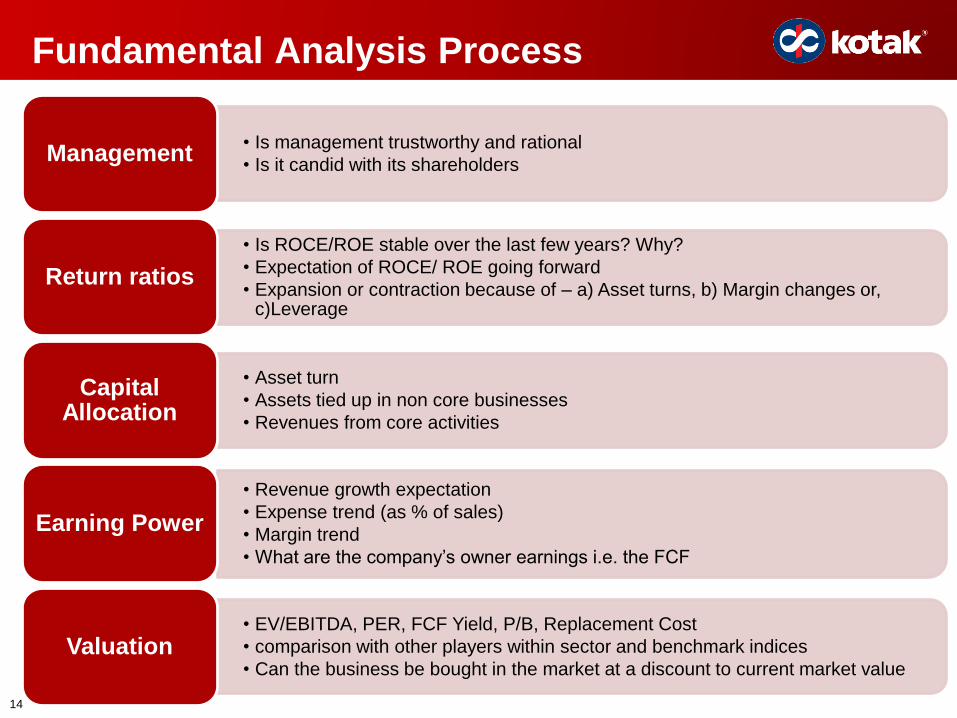
• Is management trustworthy and rational
• Is it candid with its shareholdersManagement
• Is ROCE/ROE stable over the last few years? Why?
• Expectation of ROCE/ ROE going forward
• Expansion or contraction because of – a) Asset turns, b) Margin changes or, c)Leverage
Return ratios
• Asset turn
• Assets tied up in non core businesses
• Revenues from core activities
Capital Allocation
• Revenue growth expectation
• Expense trend (as % of sales)
• Margin trend
• What are the company’s owner earnings i.e. the FCF
Earning Power
• EV/EBITDA, PER, FCF Yield, P/B, Replacement Cost
• comparison with other players within sector and benchmark indices
• Can the business be bought in the market at a discount to current market valueValuation
Fundamental Analysis Process
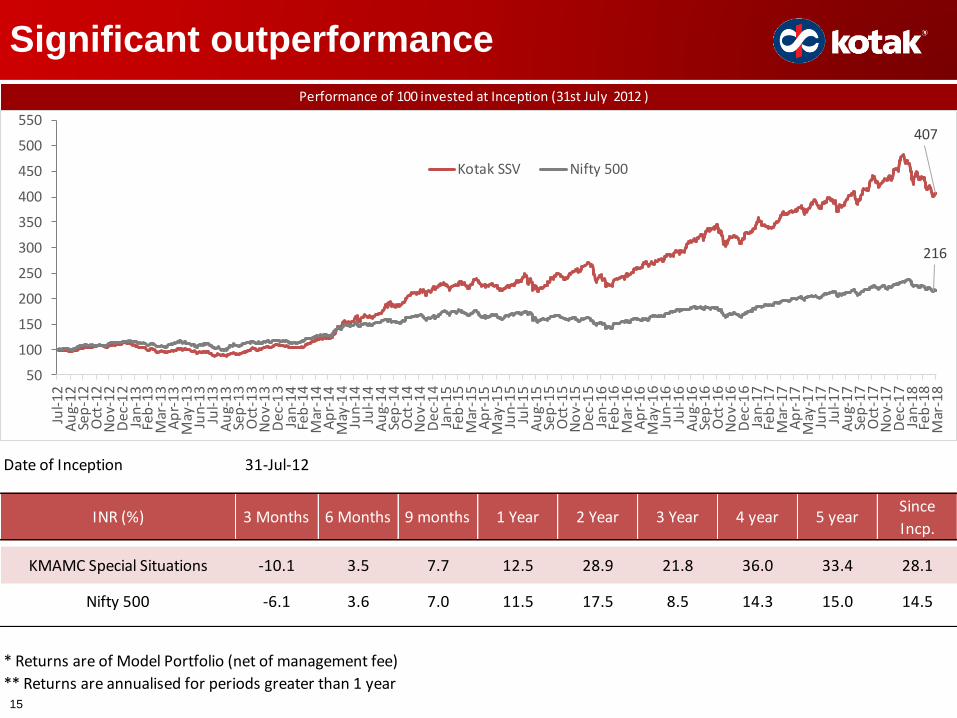
Significant outperformance
15
Date of Inception 31-Jul-12
INR (%) 3 Months 6 Months 9 months 1 Year 2 Year 3 Year 4 year 5 yearSince
Incp.
KMAMC Special Situations -10.1 3.5 7.7 12.5 28.9 21.8 36.0 33.4 28.1
Nifty 500 -6.1 3.6 7.0 11.5 17.5 8.5 14.3 15.0 14.5
* Returns are of Model Portfolio (net of management fee)
** Returns are annualised for periods greater than 1 year
Performance of 100 invested at Inception (31st July 2012 )
407
216
50
100
150
200
250
300
350
400
450
500
550
Jul-
12
Au
g-1
2Se
p-1
2O
ct-1
2N
ov-
12
Dec
-12
Jan
-13
Feb
-13
Mar
-13
Ap
r-13
May
-13
Jun
-13
Jul-
13
Au
g-1
3Se
p-1
3O
ct-1
3N
ov-
13
Dec
-13
Jan
-14
Feb
-14
Mar
-14
Ap
r-14
May
-14
Jun
-14
Jul-
14
Au
g-1
4Se
p-1
4O
ct-1
4N
ov-
14
Dec
-14
Jan
-15
Feb
-15
Mar
-15
Ap
r-15
May
-15
Jun-
15Ju
l-1
5A
ug-
15
Sep
-15
Oct
-15
No
v-1
5D
ec-1
5Ja
n-1
6Fe
b-1
6M
ar-1
6A
pr-
16
May
-16
Jun-
16Ju
l-1
6A
ug-
16
Sep
-16
Oct
-16
No
v-1
6D
ec-1
6Ja
n-1
7Fe
b-1
7M
ar-1
7A
pr-
17
May
-17
Jun-
17Ju
l-1
7A
ug-
17
Sep
-17
Oct
-17
No
v-1
7D
ec-1
7Ja
n-1
8Fe
b-1
8M
ar-1
8
Kotak SSV Nifty 500
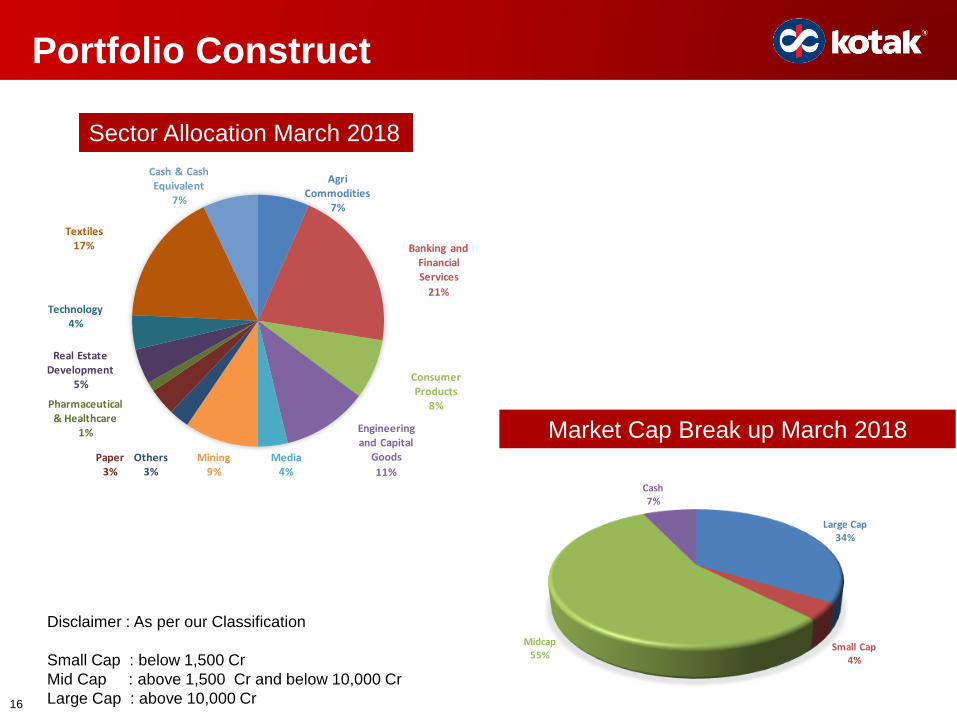
Portfolio Construct
16
Sector Allocation March 2018
Market Cap Break up March 2018
Agri Commodities
7%
Banking and Financial Services
21%
Consumer Products
8%
Engineering and Capital
Goods
11%
Media4%
Mining9%
Others3%
Paper3%
Pharmaceutical & Healthcare
1%
Real Estate Development
5%
Technology4%
Textiles17%
Cash & Cash Equivalent
7%
Disclaimer : As per our Classification
Small Cap : below 1,500 Cr
Mid Cap : above 1,500 Cr and below 10,000 Cr
Large Cap : above 10,000 Cr
Large Cap34%
Small Cap4%
Midcap55%
Cash7%
17
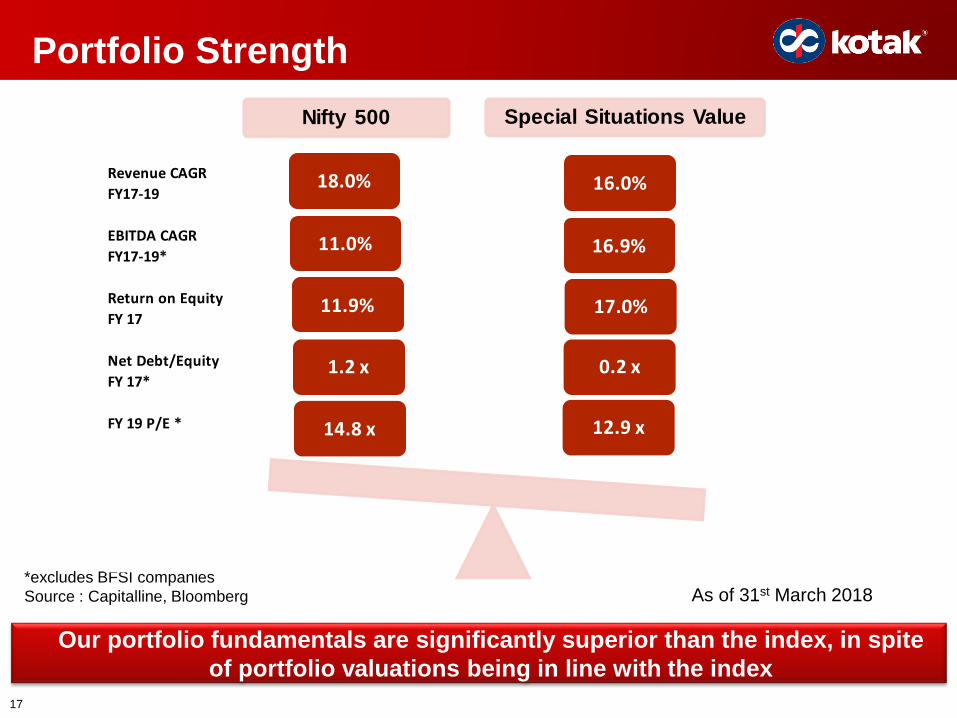
Portfolio Strength
Our portfolio fundamentals are significantly superior than the index, in spite
of portfolio valuations being in line with the index
As of 31st March 2018*excludes BFSI companies
Source : Capitalline, Bloomberg
Revenue CAGR
FY17-19
EBITDA CAGR
FY17-19*
Return on Equity
FY 17
Net Debt/Equity
FY 17*
FY 19 P/E *
Nifty 500 Special Situations Value
12.9 x
0.2 x
17.0%
14.8 x
1.2 x
11.9%
11.0% 16.9%
18.0% 16.0%
Presentation Agenda
18
Why Kotak Asset Management PMS?
Special Situations Value Strategy
Special Situations
Value Opportunities
1
2
2a:
2b:
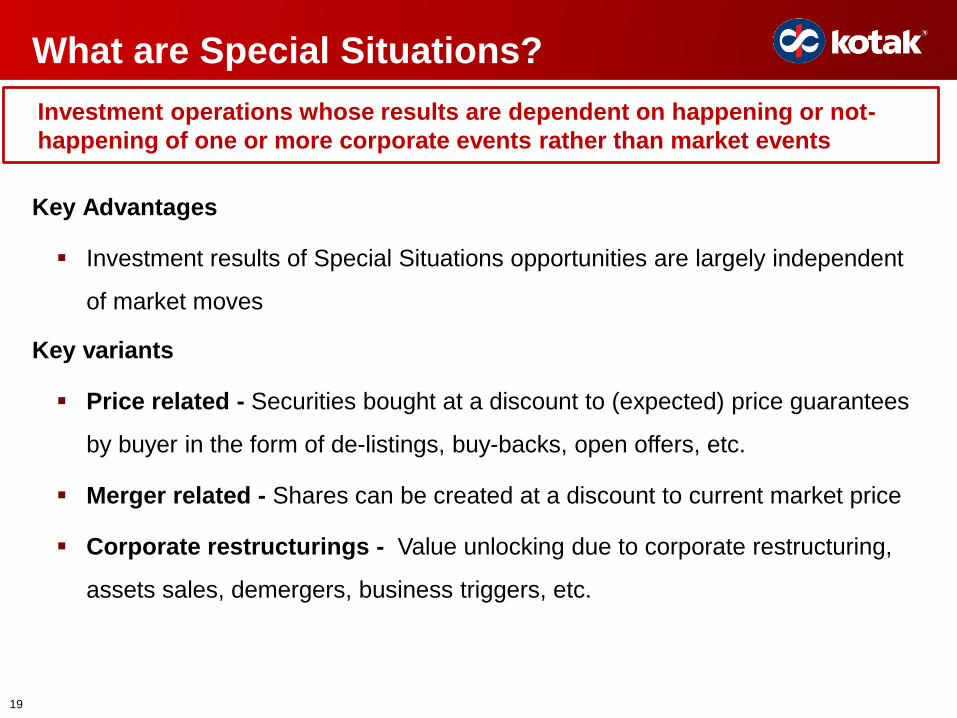
What are Special Situations?
Key Advantages
Investment results of Special Situations opportunities are largely independent
of market moves
Key variants
Price related - Securities bought at a discount to (expected) price guarantees
by buyer in the form of de-listings, buy-backs, open offers, etc.
Merger related - Shares can be created at a discount to current market price
Corporate restructurings - Value unlocking due to corporate restructuring,
assets sales, demergers, business triggers, etc.
Investment operations whose results are dependent on happening or not-
happening of one or more corporate events rather than market events
19

Case Studies:
Chambal Fertilizers and Chemicals Limited &
Marico Kaya Enterprises (MaKE) Demerger
20
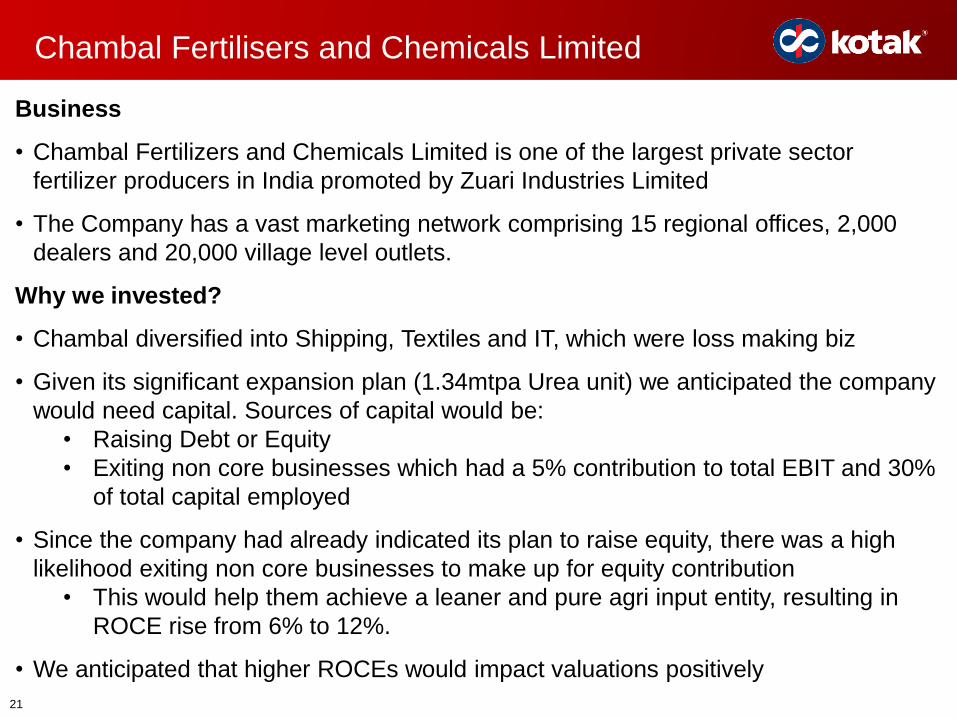
Business
• Chambal Fertilizers and Chemicals Limited is one of the largest private sector
fertilizer producers in India promoted by Zuari Industries Limited
• The Company has a vast marketing network comprising 15 regional offices, 2,000
dealers and 20,000 village level outlets.
Why we invested?
• Chambal diversified into Shipping, Textiles and IT, which were loss making biz
• Given its significant expansion plan (1.34mtpa Urea unit) we anticipated the company
would need capital. Sources of capital would be:
• Raising Debt or Equity
• Exiting non core businesses which had a 5% contribution to total EBIT and 30%
of total capital employed
• Since the company had already indicated its plan to raise equity, there was a high
likelihood exiting non core businesses to make up for equity contribution
• This would help them achieve a leaner and pure agri input entity, resulting in
ROCE rise from 6% to 12%.
• We anticipated that higher ROCEs would impact valuations positively
Chambal Fertilisers and Chemicals Limited
21
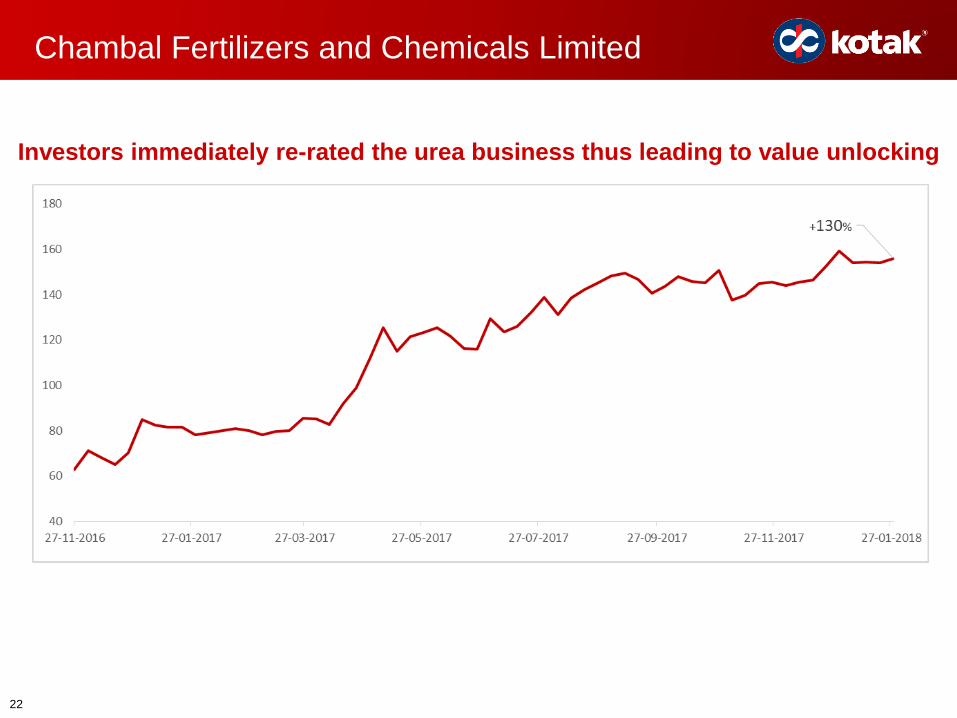
Investors immediately re-rated the urea business thus leading to value unlocking
Chambal Fertilizers and Chemicals Limited
22
MaKE demerger - an attractive opportunity
Demerger
Kaya, incubated by Marico since 2013, is a pioneer in skin care (beauty and cure)
in the country.
Marico decided to demerge Kaya. For 50 shares of Marico, 1 share of MaKE was
issued on July1, 2014
Why we invested in MaKE?
MaKE became a tiny position in portfolios of large institutional investors. On listing
these institutions sold their holdings, irrespective of valuations
Stock was trading at Rs 290 Cr market cap, with over Rs 180 Cr cash
The company was PBT positive. It has nearly 100 clinics and 140 Doctors
With a fixed cost model - all incremental revenues would flow straight to the bottom
line increasing the profits multifold
MaKE indicated its intent to grow the business with available capital and focus on
the more profitable cure rather than beauty
23 Disclaimer: The above example is for illustrative purposes only. The Portfolio Manager may or may not invest in this company
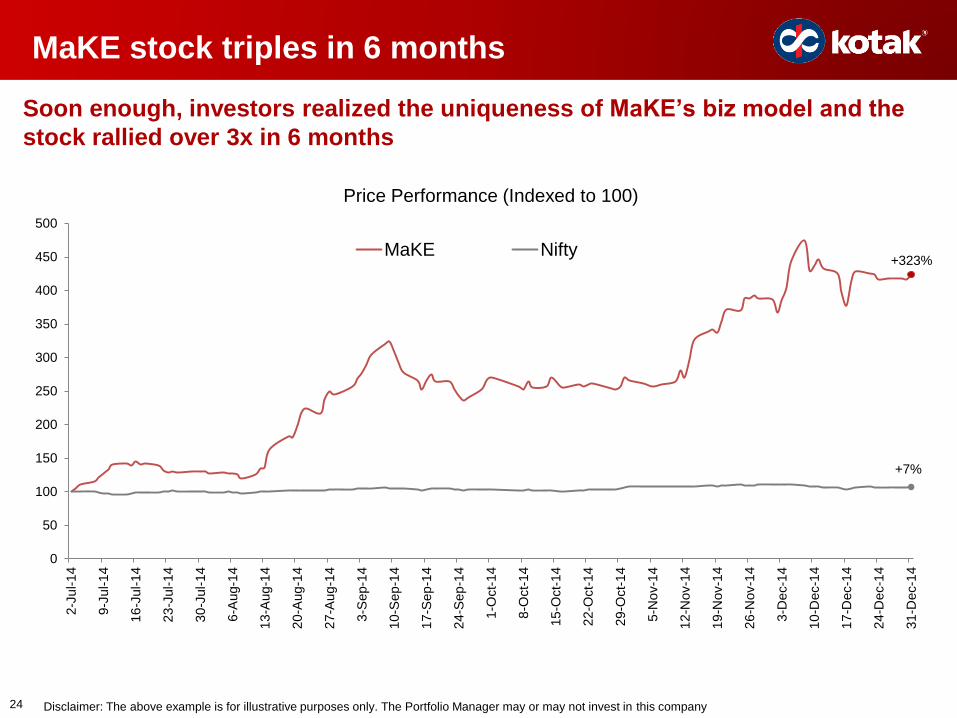
MaKE stock triples in 6 months
Soon enough, investors realized the uniqueness of MaKE’s biz model and the
stock rallied over 3x in 6 months
+323%
+7%
0
50
100
150
200
250
300
350
400
450
500
2-J
ul-1
4
9-J
ul-1
4
16
-Jul-
14
23
-Jul-
14
30
-Jul-
14
6-A
ug-1
4
13
-Aug
-14
20
-Aug
-14
27
-Aug
-14
3-S
ep-1
4
10
-Sep
-14
17
-Sep
-14
24
-Sep
-14
1-O
ct-
14
8-O
ct-
14
15
-Oct-
14
22
-Oct-
14
29
-Oct-
14
5-N
ov-1
4
12
-Nov-1
4
19
-Nov-1
4
26
-Nov-1
4
3-D
ec-1
4
10
-Dec-1
4
17
-Dec-1
4
24
-Dec-1
4
31
-Dec-1
4
Price Performance (Indexed to 100)
MaKE Nifty
24 Disclaimer: The above example is for illustrative purposes only. The Portfolio Manager may or may not invest in this company
Presentation Agenda
25
Why Kotak Asset Management PMS?
Special Situations Value Strategy
Special Situations
Value Opportunities
1
2
2a:
2b:
What is Value Investing?
“Value investing is the discipline of buying stocks at a significant discount from their
current underlying values. The element of a bargain is the key to the process.”
– Seth Klarman
Thinking as business owners
We look at stocks not as pieces of paper but as fractional ownership in
the business. If the business does well, we will do well
Downside protection
We require a significant margin of safety when we buy a stock, so that
even if things don’t work out as we expected, we don’t lose money
Concentrated Portfolios
We have significant conviction in our investments. So we have concentrated
portfolios with 10-20 stocks
Bottom Up
We believe that good quality companies will outperform the market irrespective of
the sector they are in
26

Case Study:
Polaris Consulting & Services Ltd &
National Building Construction Corporation (NBCC)
27
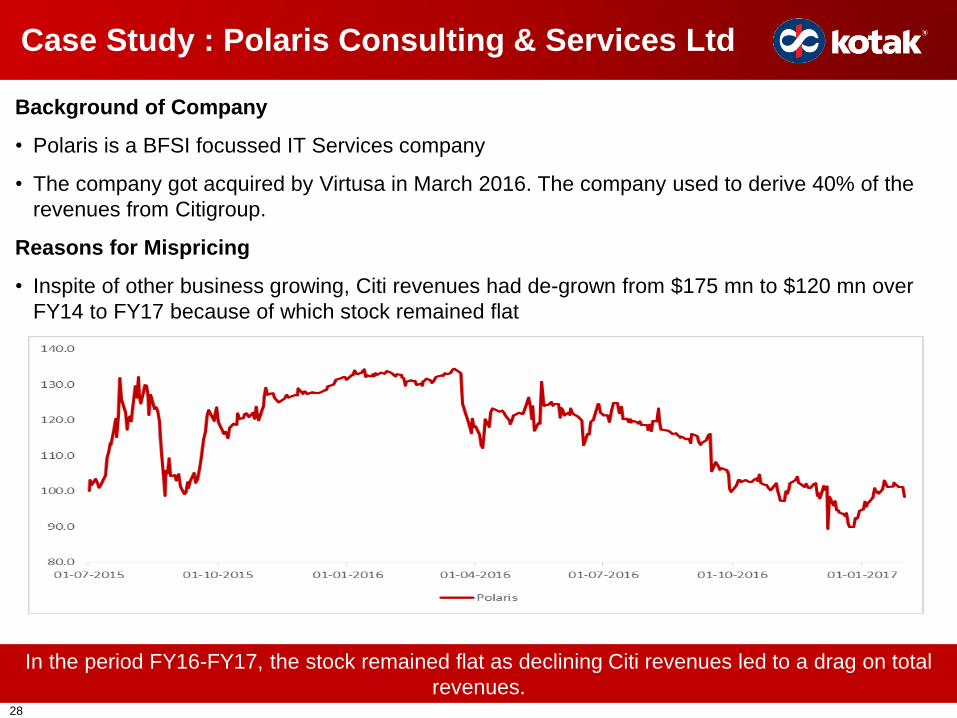
Case Study : Polaris Consulting & Services Ltd
Background of Company
• Polaris is a BFSI focussed IT Services company
• The company got acquired by Virtusa in March 2016. The company used to derive 40% of the
revenues from Citigroup.
Reasons for Mispricing
• Inspite of other business growing, Citi revenues had de-grown from $175 mn to $120 mn over
FY14 to FY17 because of which stock remained flat
In the period FY16-FY17, the stock remained flat as declining Citi revenues led to a drag on total
revenues.28
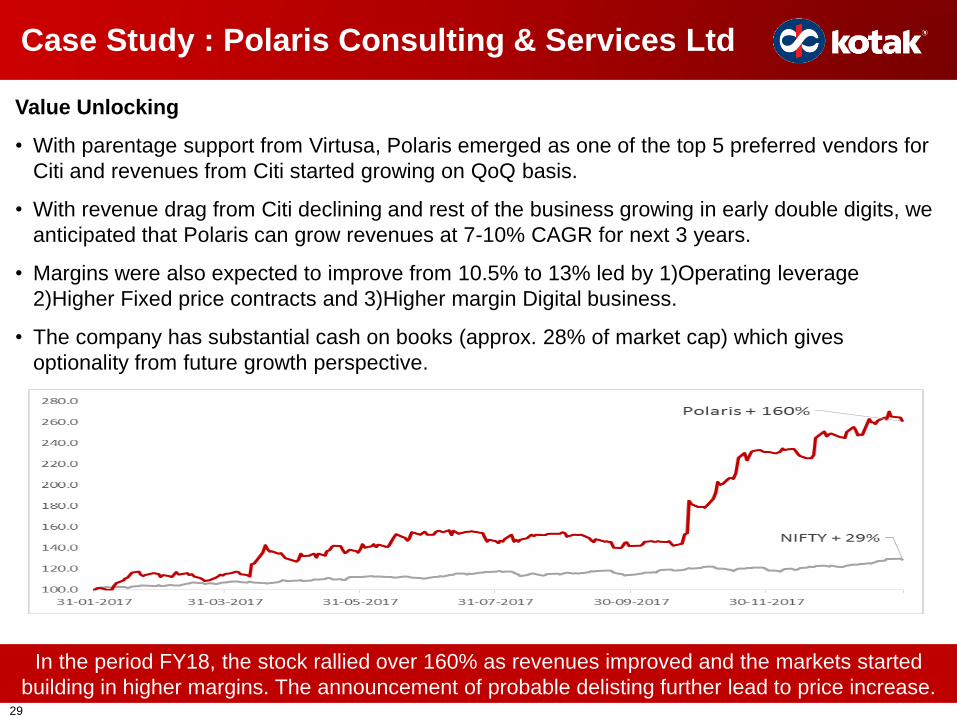
Case Study : Polaris Consulting & Services Ltd
Value Unlocking
• With parentage support from Virtusa, Polaris emerged as one of the top 5 preferred vendors for
Citi and revenues from Citi started growing on QoQ basis.
• With revenue drag from Citi declining and rest of the business growing in early double digits, we
anticipated that Polaris can grow revenues at 7-10% CAGR for next 3 years.
• Margins were also expected to improve from 10.5% to 13% led by 1)Operating leverage
2)Higher Fixed price contracts and 3)Higher margin Digital business.
• The company has substantial cash on books (approx. 28% of market cap) which gives
optionality from future growth perspective.
In the period FY18, the stock rallied over 160% as revenues improved and the markets started
building in higher margins. The announcement of probable delisting further lead to price increase.29
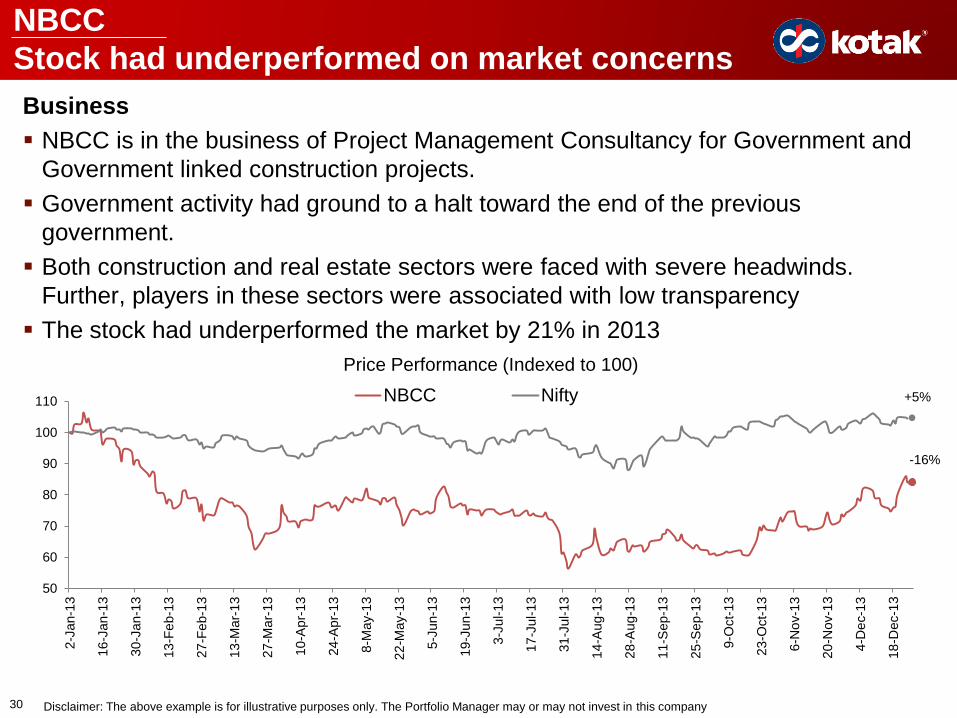
NBCC
Stock had underperformed on market concerns
Business
NBCC is in the business of Project Management Consultancy for Government and
Government linked construction projects.
Government activity had ground to a halt toward the end of the previous
government.
Both construction and real estate sectors were faced with severe headwinds.
Further, players in these sectors were associated with low transparency
The stock had underperformed the market by 21% in 2013
-16%
+5%
50
60
70
80
90
100
110
2-J
an-1
3
16
-Jan
-13
30
-Ja
n-1
3
13
-Fe
b-1
3
27
-Fe
b-1
3
13
-Ma
r-1
3
27
-Ma
r-1
3
10
-Ap
r-1
3
24
-Ap
r-1
3
8-M
ay-1
3
22
-Ma
y-1
3
5-J
un-1
3
19
-Ju
n-1
3
3-J
ul-1
3
17
-Ju
l-1
3
31
-Ju
l-1
3
14
-Au
g-1
3
28
-Au
g-1
3
11
-Se
p-1
3
25
-Se
p-1
3
9-O
ct-
13
23
-Oct-
13
6-N
ov-1
3
20
-No
v-1
3
4-D
ec-1
3
18
-De
c-1
3
Price Performance (Indexed to 100)
NBCC Nifty
30 Disclaimer: The above example is for illustrative purposes only. The Portfolio Manager may or may not invest in this company
NBCC
Why was it a good investment opportunity?
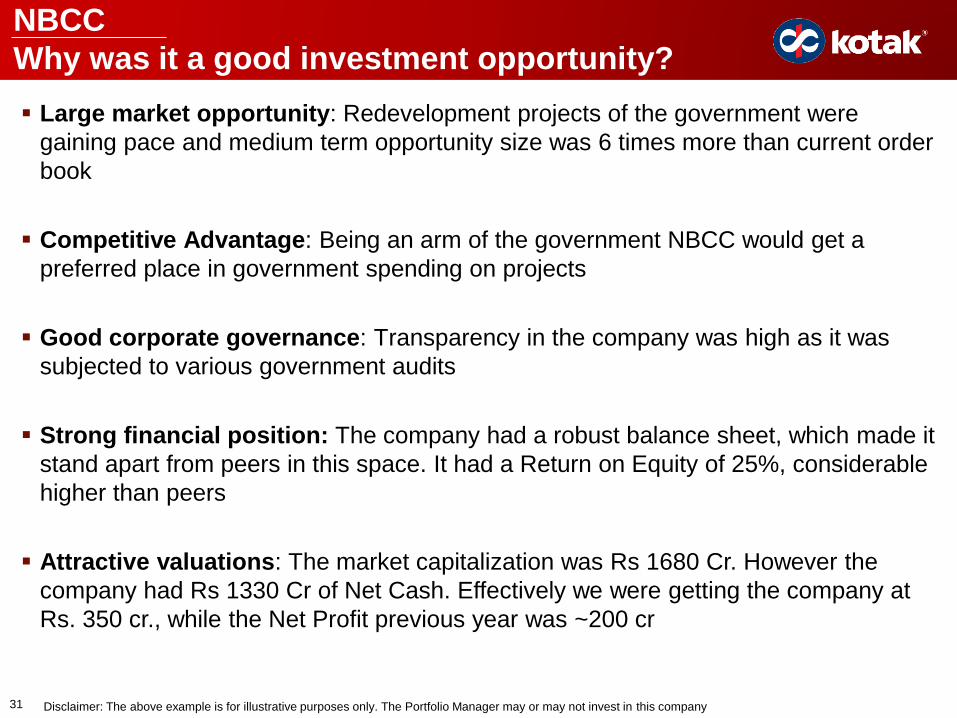
Large market opportunity: Redevelopment projects of the government were
gaining pace and medium term opportunity size was 6 times more than current order
book
Competitive Advantage: Being an arm of the government NBCC would get a
preferred place in government spending on projects
Good corporate governance: Transparency in the company was high as it was
subjected to various government audits
Strong financial position: The company had a robust balance sheet, which made it
stand apart from peers in this space. It had a Return on Equity of 25%, considerable
higher than peers
Attractive valuations: The market capitalization was Rs 1680 Cr. However the
company had Rs 1330 Cr of Net Cash. Effectively we were getting the company at
Rs. 350 cr., while the Net Profit previous year was ~200 cr
31 Disclaimer: The above example is for illustrative purposes only. The Portfolio Manager may or may not invest in this company
NBCC
Stock outperformed massively in coming months
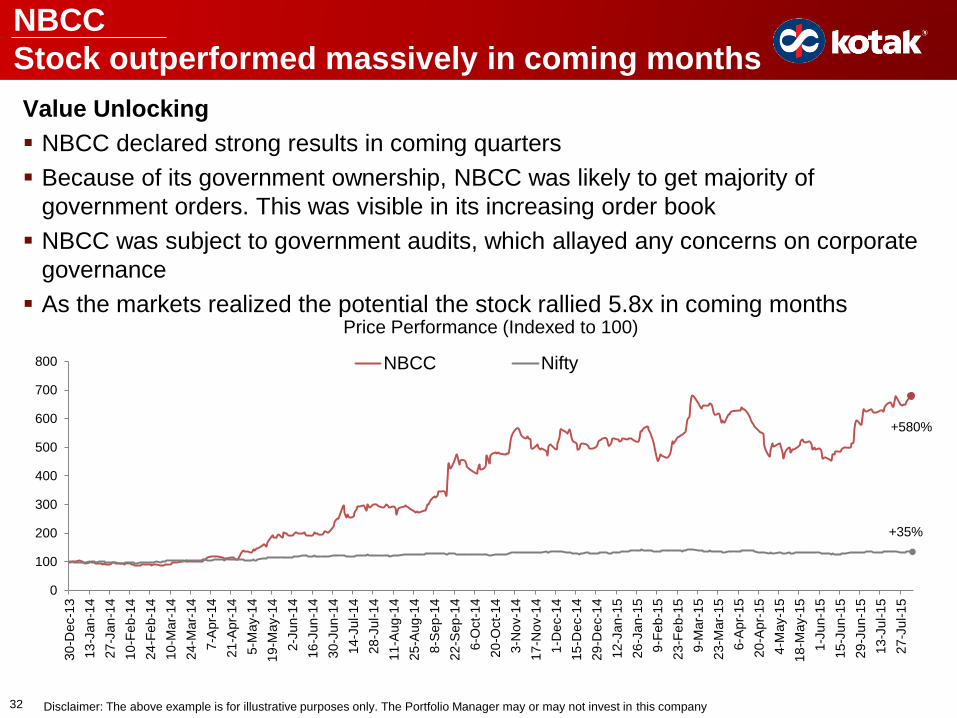
Value Unlocking
NBCC declared strong results in coming quarters
Because of its government ownership, NBCC was likely to get majority of
government orders. This was visible in its increasing order book
NBCC was subject to government audits, which allayed any concerns on corporate
governance
As the markets realized the potential the stock rallied 5.8x in coming months
+580%
+35%
0
100
200
300
400
500
600
700
800
30
-De
c-1
3
13
-Ja
n-1
4
27
-Ja
n-1
4
10
-Fe
b-1
4
24
-Fe
b-1
4
10
-Ma
r-1
4
24
-Ma
r-1
4
7-A
pr-
14
21
-Ap
r-1
4
5-M
ay-1
4
19
-Ma
y-1
4
2-J
un-1
4
16
-Ju
n-1
4
30
-Ju
n-1
4
14
-Ju
l-1
4
28
-Ju
l-1
4
11
-Au
g-1
4
25
-Au
g-1
4
8-S
ep-1
4
22
-Se
p-1
4
6-O
ct-
14
20
-Oct-
14
3-N
ov-1
4
17
-No
v-1
4
1-D
ec-1
4
15
-De
c-1
4
29
-De
c-1
4
12
-Ja
n-1
5
26
-Ja
n-1
5
9-F
eb
-15
23
-Fe
b-1
5
9-M
ar-
15
23
-Ma
r-1
5
6-A
pr-
15
20
-Ap
r-1
5
4-M
ay-1
5
18
-Ma
y-1
5
1-J
un-1
5
15
-Ju
n-1
5
29
-Ju
n-1
5
13
-Ju
l-1
5
27
-Ju
l-1
5
Price Performance (Indexed to 100)
NBCC Nifty
32 Disclaimer: The above example is for illustrative purposes only. The Portfolio Manager may or may not invest in this company

Annexure
33
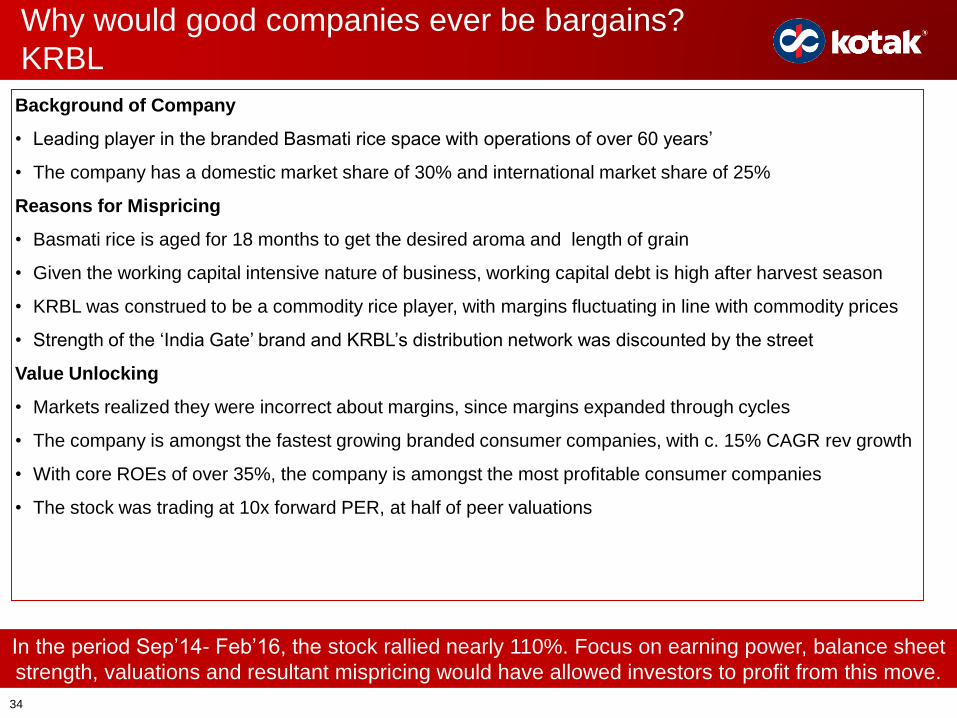
Background of Company
• Leading player in the branded Basmati rice space with operations of over 60 years’
• The company has a domestic market share of 30% and international market share of 25%
Reasons for Mispricing
• Basmati rice is aged for 18 months to get the desired aroma and length of grain
• Given the working capital intensive nature of business, working capital debt is high after harvest season
• KRBL was construed to be a commodity rice player, with margins fluctuating in line with commodity prices
• Strength of the ‘India Gate’ brand and KRBL’s distribution network was discounted by the street
Value Unlocking
• Markets realized they were incorrect about margins, since margins expanded through cycles
• The company is amongst the fastest growing branded consumer companies, with c. 15% CAGR rev growth
• With core ROEs of over 35%, the company is amongst the most profitable consumer companies
• The stock was trading at 10x forward PER, at half of peer valuations
Why would good companies ever be bargains?
KRBL
In the period Sep’14- Feb’16, the stock rallied nearly 110%. Focus on earning power, balance sheet
strength, valuations and resultant mispricing would have allowed investors to profit from this move.
34
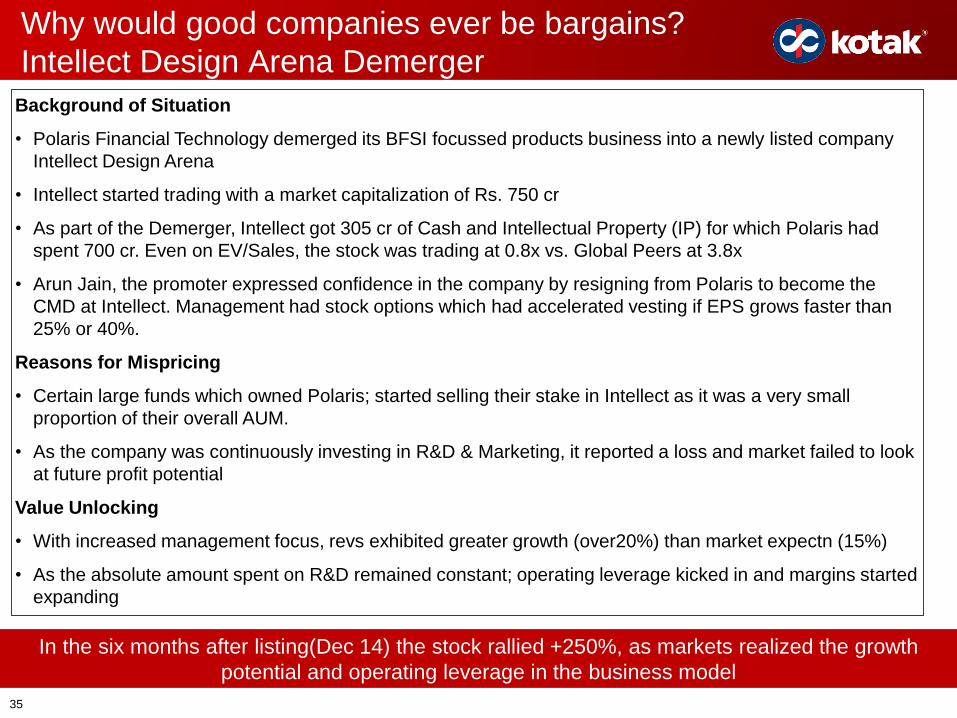
Background of Situation
• Polaris Financial Technology demerged its BFSI focussed products business into a newly listed company
Intellect Design Arena
• Intellect started trading with a market capitalization of Rs. 750 cr
• As part of the Demerger, Intellect got 305 cr of Cash and Intellectual Property (IP) for which Polaris had
spent 700 cr. Even on EV/Sales, the stock was trading at 0.8x vs. Global Peers at 3.8x
• Arun Jain, the promoter expressed confidence in the company by resigning from Polaris to become the
CMD at Intellect. Management had stock options which had accelerated vesting if EPS grows faster than
25% or 40%.
Reasons for Mispricing
• Certain large funds which owned Polaris; started selling their stake in Intellect as it was a very small
proportion of their overall AUM.
• As the company was continuously investing in R&D & Marketing, it reported a loss and market failed to look
at future profit potential
Value Unlocking
• With increased management focus, revs exhibited greater growth (over20%) than market expectn (15%)
• As the absolute amount spent on R&D remained constant; operating leverage kicked in and margins started
expanding
Why would good companies ever be bargains?
Intellect Design Arena Demerger
In the six months after listing(Dec 14) the stock rallied +250%, as markets realized the growth
potential and operating leverage in the business model
35
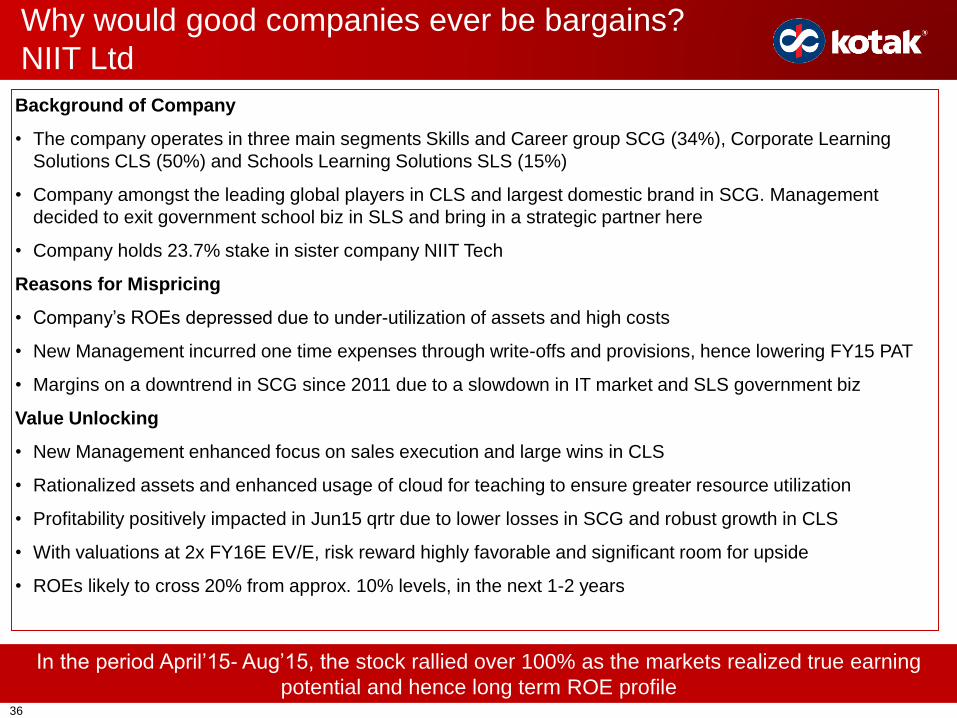
Why would good companies ever be bargains?
NIIT Ltd
Background of Company
• The company operates in three main segments Skills and Career group SCG (34%), Corporate Learning
Solutions CLS (50%) and Schools Learning Solutions SLS (15%)
• Company amongst the leading global players in CLS and largest domestic brand in SCG. Management
decided to exit government school biz in SLS and bring in a strategic partner here
• Company holds 23.7% stake in sister company NIIT Tech
Reasons for Mispricing
• Company’s ROEs depressed due to under-utilization of assets and high costs
• New Management incurred one time expenses through write-offs and provisions, hence lowering FY15 PAT
• Margins on a downtrend in SCG since 2011 due to a slowdown in IT market and SLS government biz
Value Unlocking
• New Management enhanced focus on sales execution and large wins in CLS
• Rationalized assets and enhanced usage of cloud for teaching to ensure greater resource utilization
• Profitability positively impacted in Jun15 qrtr due to lower losses in SCG and robust growth in CLS
• With valuations at 2x FY16E EV/E, risk reward highly favorable and significant room for upside
• ROEs likely to cross 20% from approx. 10% levels, in the next 1-2 years
In the period April’15- Aug’15, the stock rallied over 100% as the markets realized true earning
potential and hence long term ROE profile36
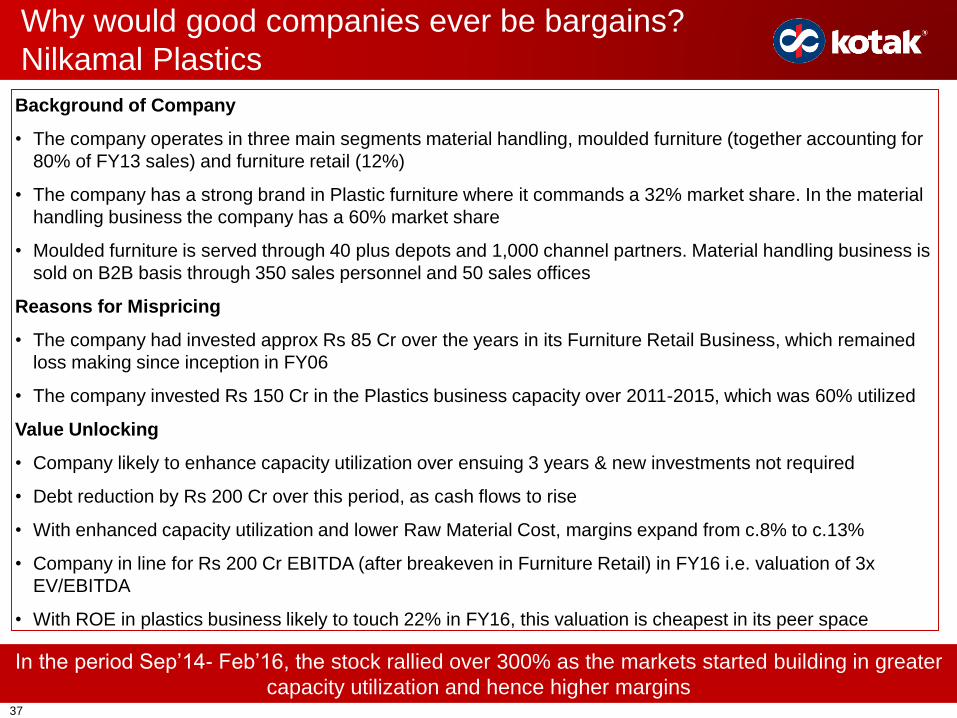
Why would good companies ever be bargains?
Nilkamal Plastics
Background of Company
• The company operates in three main segments material handling, moulded furniture (together accounting for
80% of FY13 sales) and furniture retail (12%)
• The company has a strong brand in Plastic furniture where it commands a 32% market share. In the material
handling business the company has a 60% market share
• Moulded furniture is served through 40 plus depots and 1,000 channel partners. Material handling business is
sold on B2B basis through 350 sales personnel and 50 sales offices
Reasons for Mispricing
• The company had invested approx Rs 85 Cr over the years in its Furniture Retail Business, which remained
loss making since inception in FY06
• The company invested Rs 150 Cr in the Plastics business capacity over 2011-2015, which was 60% utilized
Value Unlocking
• Company likely to enhance capacity utilization over ensuing 3 years & new investments not required
• Debt reduction by Rs 200 Cr over this period, as cash flows to rise
• With enhanced capacity utilization and lower Raw Material Cost, margins expand from c.8% to c.13%
• Company in line for Rs 200 Cr EBITDA (after breakeven in Furniture Retail) in FY16 i.e. valuation of 3x
EV/EBITDA
• With ROE in plastics business likely to touch 22% in FY16, this valuation is cheapest in its peer space
In the period Sep’14- Feb’16, the stock rallied over 300% as the markets started building in greater
capacity utilization and hence higher margins37
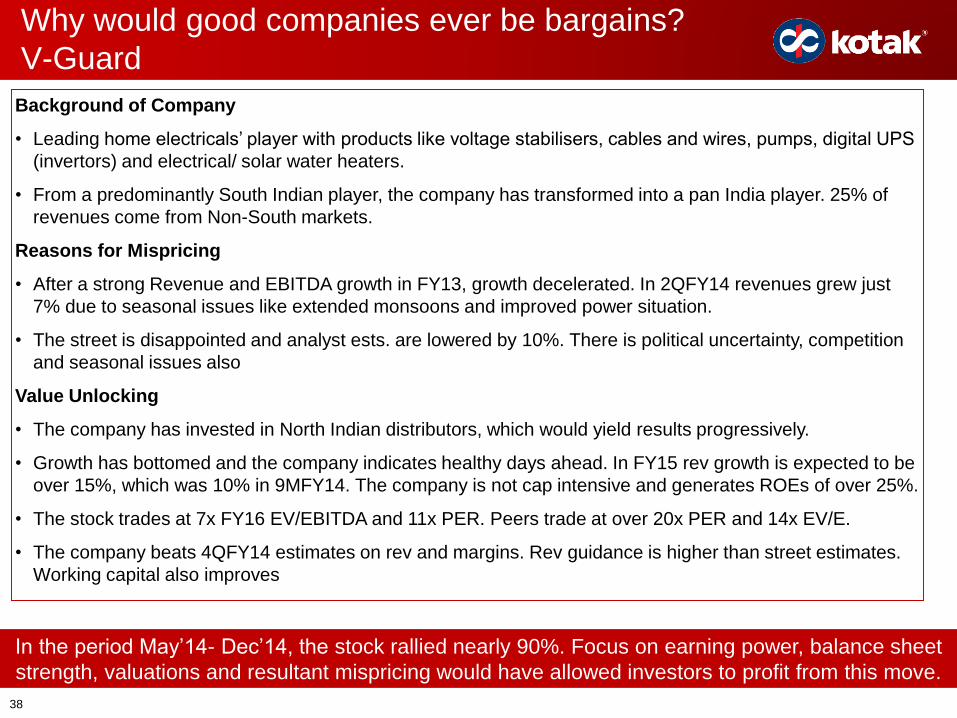
Background of Company
• Leading home electricals’ player with products like voltage stabilisers, cables and wires, pumps, digital UPS
(invertors) and electrical/ solar water heaters.
• From a predominantly South Indian player, the company has transformed into a pan India player. 25% of
revenues come from Non-South markets.
Reasons for Mispricing
• After a strong Revenue and EBITDA growth in FY13, growth decelerated. In 2QFY14 revenues grew just
7% due to seasonal issues like extended monsoons and improved power situation.
• The street is disappointed and analyst ests. are lowered by 10%. There is political uncertainty, competition
and seasonal issues also
Value Unlocking
• The company has invested in North Indian distributors, which would yield results progressively.
• Growth has bottomed and the company indicates healthy days ahead. In FY15 rev growth is expected to be
over 15%, which was 10% in 9MFY14. The company is not cap intensive and generates ROEs of over 25%.
• The stock trades at 7x FY16 EV/EBITDA and 11x PER. Peers trade at over 20x PER and 14x EV/E.
• The company beats 4QFY14 estimates on rev and margins. Rev guidance is higher than street estimates.
Working capital also improves
Why would good companies ever be bargains?
V-Guard
In the period May’14- Dec’14, the stock rallied nearly 90%. Focus on earning power, balance sheet
strength, valuations and resultant mispricing would have allowed investors to profit from this move.
38
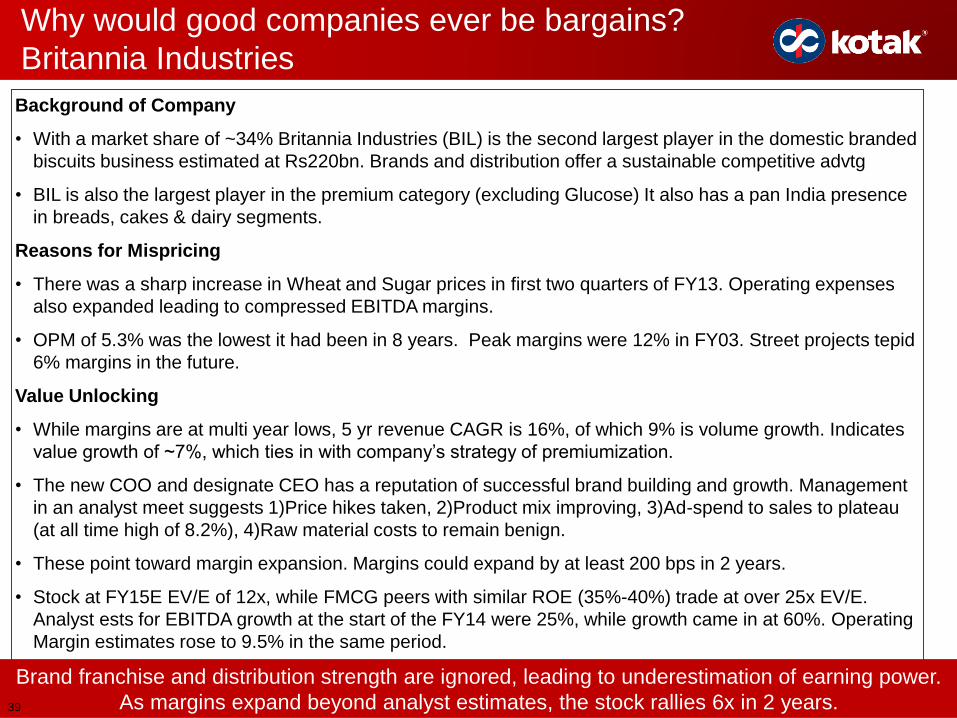
Background of Company
• With a market share of ~34% Britannia Industries (BIL) is the second largest player in the domestic branded
biscuits business estimated at Rs220bn. Brands and distribution offer a sustainable competitive advtg
• BIL is also the largest player in the premium category (excluding Glucose) It also has a pan India presence
in breads, cakes & dairy segments.
Reasons for Mispricing
• There was a sharp increase in Wheat and Sugar prices in first two quarters of FY13. Operating expenses
also expanded leading to compressed EBITDA margins.
• OPM of 5.3% was the lowest it had been in 8 years. Peak margins were 12% in FY03. Street projects tepid
6% margins in the future.
Value Unlocking
• While margins are at multi year lows, 5 yr revenue CAGR is 16%, of which 9% is volume growth. Indicates
value growth of ~7%, which ties in with company’s strategy of premiumization.
• The new COO and designate CEO has a reputation of successful brand building and growth. Management
in an analyst meet suggests 1)Price hikes taken, 2)Product mix improving, 3)Ad-spend to sales to plateau
(at all time high of 8.2%), 4)Raw material costs to remain benign.
• These point toward margin expansion. Margins could expand by at least 200 bps in 2 years.
• Stock at FY15E EV/E of 12x, while FMCG peers with similar ROE (35%-40%) trade at over 25x EV/E.
Analyst ests for EBITDA growth at the start of the FY14 were 25%, while growth came in at 60%. Operating
Margin estimates rose to 9.5% in the same period.
Why would good companies ever be bargains?
Britannia Industries
Brand franchise and distribution strength are ignored, leading to underestimation of earning power.
As margins expand beyond analyst estimates, the stock rallies 6x in 2 years.39
Key risks
• Country risk: Investments are subject to the geographical, political, economic and social issues specific to India.
• Volatility risk: The Indian stock markets are more volatile than the stock markets of the developed economies of Western Europe and North
America.
• Tax risk: Tax treatment of foreign investments in India may be varied by the Indian Government without notice.
• Regulatory risk: Investments may be restricted from investing in certain sectors or companies, or be subject to investment limits.
• Liquidity risk: There may be investments in companies where market liquidity is thin.
• Performance risk : Past investment performance should not be viewed as a guide to, or indicator of, future performance and the value of
investments and the income derived from them can go down as well as up.
• Interest rate risk: The risk posed by increases in interest rate. This risk increases as the period to maturity increases.
• Capital risk: All or some of the initial capital investment may be lost.
40
Important Notice
41
Investments in securities are subject to market risk and there is no assurance or guarantee of the objectives of the Portfolio beingachieved or safety of corpus. Past performance does not guarantee future performance. Investors must keep in mind that theaforementioned statements/presentation cannot disclose all the risks and characteristics. Investors are requested to read andunderstand the investment strategy, and take into consideration all the risk factors including their financial condition, suitability torisk return profile, and the like and take professional advice before investing. Opinions expressed are our current opinions as ofthe date appearing on this material only.
We have reviewed the document though its accuracy or completeness cannot be guaranteed. Neither the company, nor anyperson connected with it, accepts any liability arising from the use of this document. The recipients of this material should rely ontheir own investigations and take their own independent professional advice. While we endeavor to update on a reasonable basisthe information discussed in this material, there may be regulatory, compliance, or other reasons that prevent us from doing so.Investors and others are cautioned that any forward - looking statements are not predictions and may be subject to changewithout notice.
This document is not for public distribution and has been furnished to you solely for your information and must not bereproduced or redistributed to any other person. Persons into whose possession this document may come are required toobserve this restriction. This material is for the personal information of the authorized recipient, and we are not soliciting anyaction based upon it. This document is not to be construed as an offer to sell or the solicitation of an offer to buy any security inany jurisdiction where such an offer or solicitation would be illegal. It does not constitute a personal recommendation or take intoaccount the particular investment objectives, financial situations, or needs of individual clients.
Statutory Details: Portfolio Manager: Kotak Mahindra Asset Management Company Ltd. SEBI Reg No: INP000000837- RegisteredOffice: 27 BKC, C-27, G Block, Bandra Kurla Complex, Bandra (E), Mumbai - 400 051, Principal Place of Business: 2nd Floor, 12BKC, Plot No. C-12, ‘G’ Block, Bandra Kurla Complex, Bandra East, Mumbai – 400 051,India. Address of correspondence:6th FloorKotak Towers, Building No 21 Infinity Park, Off W. E. Highway, Gen A K. Vaidya Marg, Malad (E), Mumbai 400097. - Contactdetails:02266056825
41


![[Kotak] India Daily, September 22, 2014 Bank Banks/Financial Institutions KOTAK INSTITUTIONAL EQUITIES RESEARCH 3 Retail and SME segments drive overall loan portfolio – trend likely](https://static.documents.pub/doc/80x56/5b1903a27f8b9a23258c4a19/kotak-india-daily-september-22-bank-banksfinancial-institutions-kotak-institutional.jpg)

