STAT 350 (Spring 2015) Lab 7: SAS Solution 1 Lab 7 (100 pts.): One-Way ANOVA Objectives: Analyze data via the One-Way ANOVA A. (50 pts.) Do isoflavones increase bone mineral density? (ex12-45bmd.txt) Kudzu is a plant that was imported to the United States from Japan and now covers over seven million acres in the South. The plant contains chemicals called isoflavones that have been shown to have beneficial effects on bones. One study used three groups of rats to compare a control group with rats that were fed either a low dose or a high dose of isoflavones from kudzu. One of the outcomes examined was the bone mineral density in the femur (in grams per square centimeter). Here are the data: Solution: data bmd; infile 'W:\PCText\Chapter 12\ex1245bmd.txt' firstobs = 2 delimiter = '09'x; input Treatment $ Group BMD; run; proc print data = bmd; run; proc sort data = bmd; *you may also sort by Group; by Treatment; run; proc means data=bmd; var BMD; by Treatment; *This needs to be the same as you sorted by above; output out=means mean=average; run; symbol1 v=dot i=join; proc gplot data=means; plot average*Treatment; *This needs to be the same as in proc means; run; proc sgplot data=bmd; By Treatment; *This needs to be the same as you sorted by above; histogram BMD; density BMD; density BMD/type=kernel; run;
Transcript
STAT 350 (Spring 2015) Lab 7: SAS Solution 1
Lab 7 (100 pts.): One-Way ANOVA Objectives: Analyze data via the One-Way ANOVA A. (50 pts.) Do isoflavones increase bone mineral density? (ex12-45bmd.txt) Kudzu is a plant that was imported to the United States from Japan and now covers over seven million acres in the South. The plant contains chemicals called isoflavones that have been shown to have beneficial effects on bones. One study used three groups of rats to compare a control group with rats that were fed either a low dose or a high dose of isoflavones from kudzu. One of the outcomes examined was the bone mineral density in the femur (in grams per square centimeter). Here are the data:
Solution: data bmd; infile 'W:\PCText\Chapter 12\ex1245bmd.txt' firstobs = 2 delimiter = '09'x; input Treatment $ Group BMD; run; proc print data = bmd; run; proc sort data = bmd; *you may also sort by Group; by Treatment; run; proc means data=bmd; var BMD; by Treatment; *This needs to be the same as you sorted by above; output out=means mean=average; run; symbol1 v=dot i=join; proc gplot data=means; plot average*Treatment; *This needs to be the same as in proc means; run; proc sgplot data=bmd; By Treatment; *This needs to be the same as you sorted by above; histogram BMD; density BMD; density BMD/type=kernel; run;
STAT 350 (Spring 2015) Lab 7: SAS Solution 2
proc univariate data=bmd noprint; By Group; QQplot BMD/normal (mu=est sigma=est); run; proc glm data=bmd alpha=0.05; class Treatment; *This needs to be the same as you sorted by above; model BMD = Treatment; *This needs to be the same as you sorted; *If you run both the Bonferroni and the Tukey method, you will loose points. Also only one of the following means statements should be included.; means Treatment /Bon Tukey; *This needs to be the same as you sorted; means Treatment /cldiff Bon Tukey; *This needs to be the same as you sorted by above; run; 1. (10 pts.) Make side-by-side boxplots and an effects plot of the data. Also, make a table
giving the sample size, mean, and standard deviation for each treatment group. From this information, do you think that all of the means are the same? Be sure to comment on each of the plots.
Solution:
We can see that although the means are different, we cannot say that they are significantly different since the boxplots overlap each other.
Here the means look different with HiDose being larger than the rest.
STAT 350 (Spring 2015) Lab 7: SAS Solution 3
Treatment n sample mean sample standard deviation Control 15 0.2188667 0.0115873
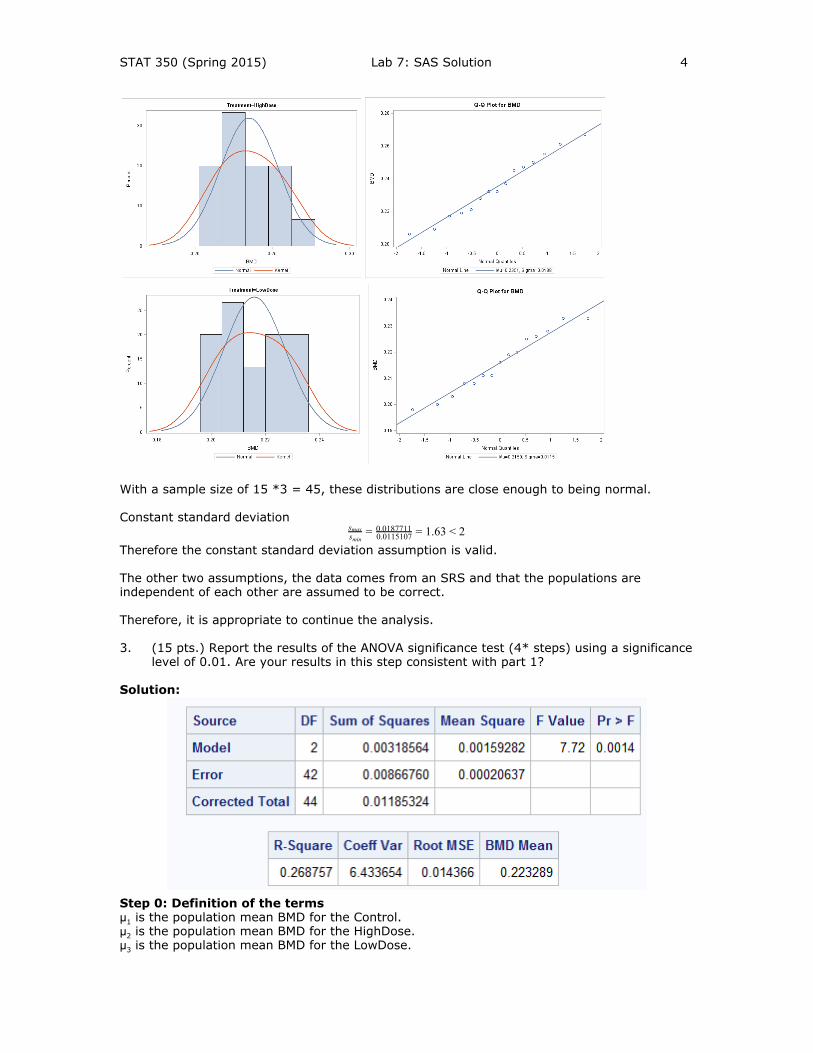
It is hard to see if HighDose is large than the other two based on the means and the standard deviations. All reasonable answers are acceptable as long as there is a comment for each plot/table. 2. (10 pts.) Examine the assumptions necessary for ANOVA. Is it appropriate to continue
the analysis? Be sure to state each of the assumptions and comment on each of them using the appropriate plots/data. Remember, you need to generate the normal probability plots and histograms for each population.
Solution: Normality:
STAT 350 (Spring 2015) Lab 7: SAS Solution 4
With a sample size of 15 *3 = 45, these distributions are close enough to being normal. Constant standard deviation
.63sminsmax = 0.0115107
0.0187711 = 1 < 2
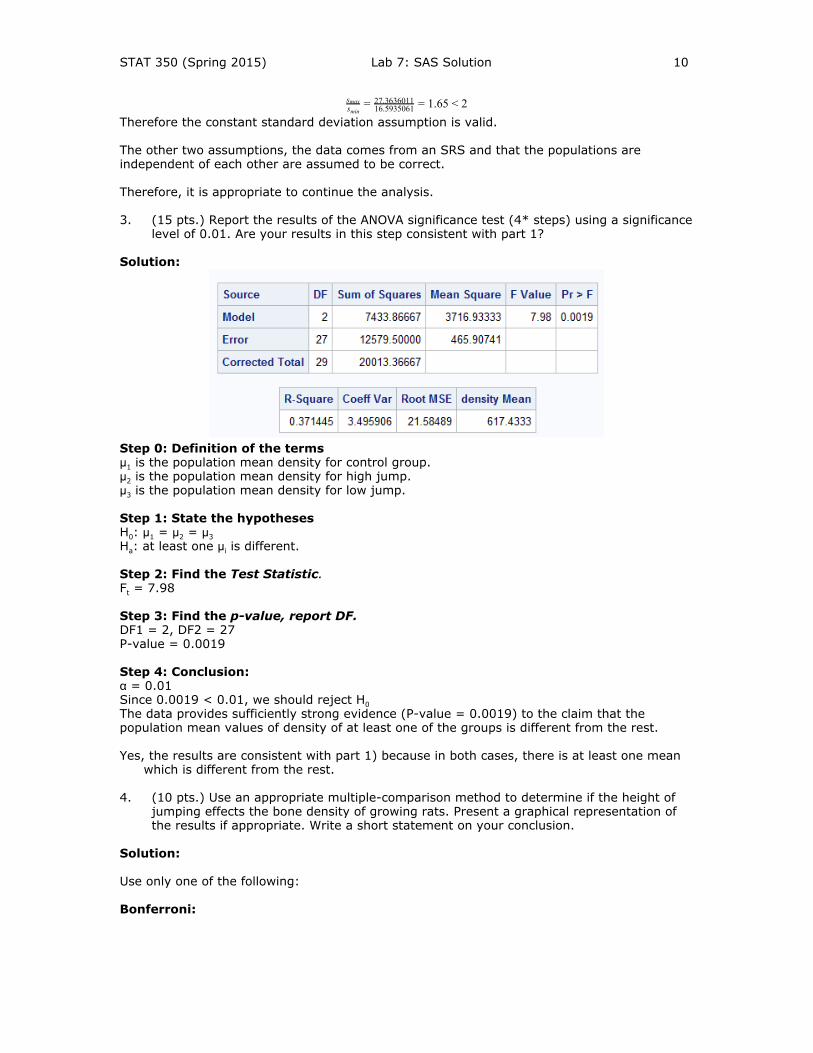
Therefore the constant standard deviation assumption is valid. The other two assumptions, the data comes from an SRS and that the populations are independent of each other are assumed to be correct. Therefore, it is appropriate to continue the analysis. 3. (15 pts.) Report the results of the ANOVA significance test (4* steps) using a significance
level of 0.01. Are your results in this step consistent with part 1? Solution:
Step 0: Definition of the terms μ1 is the population mean BMD for the Control. μ2 is the population mean BMD for the HighDose. μ3 is the population mean BMD for the LowDose.
STAT 350 (Spring 2015) Lab 7: SAS Solution 5
Step 1: State the hypotheses H0: μ1 = μ2 = μ3 Ha: at least one μi is different. Step 2: Find the Test Statistic. Ft = 7.72 Step 3: Find the p-value, report DF. DF1 = 2, DF2 = 42 P-value = 0.0014 Step 4: Conclusion: α = 0.05 Since 0.0014 < 0.05, we should reject H0 The data provides sufficiently strong evidence (P-value = 0.0014) to the claim that the population mean values of BDM of at least one of the groups is different from the rest. This answer depends on what you stated in part 1. However, I did state that the means were a little different but probably not significantly different. Therefore the results are not consistent. 4. (10 pts.) Use an appropriate multiple-comparison method to determine if isoflavones
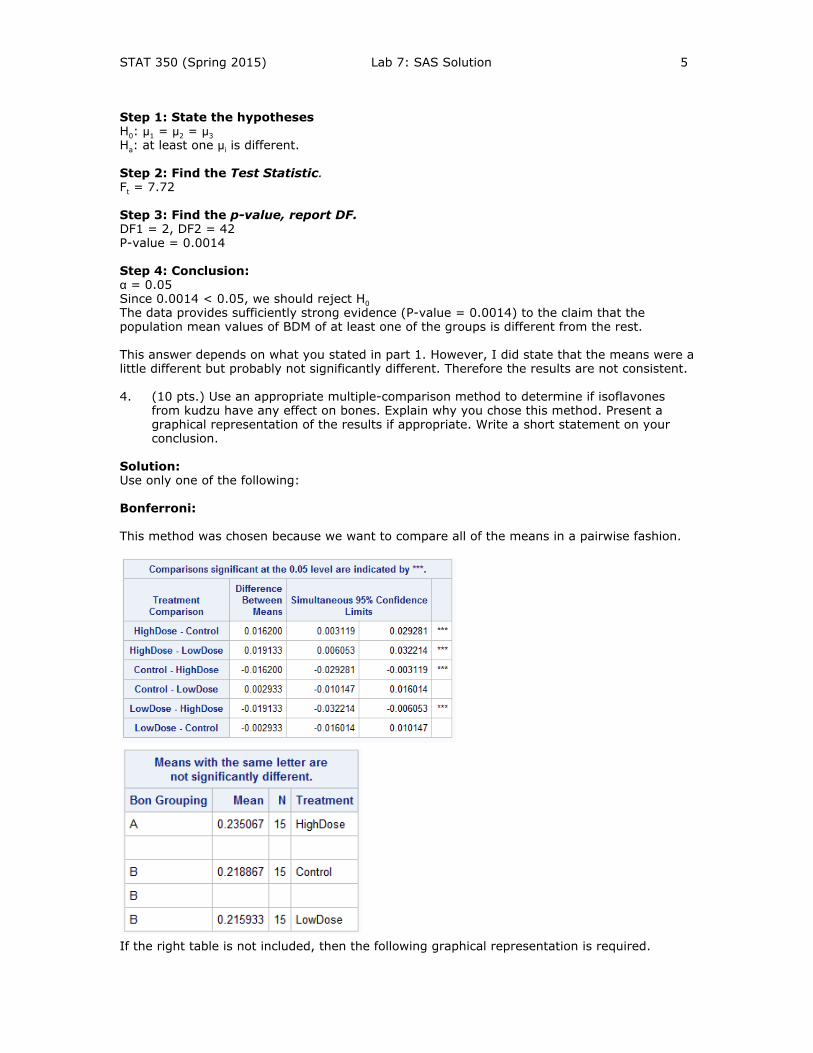
from kudzu have any effect on bones. Explain why you chose this method. Present a graphical representation of the results if appropriate. Write a short statement on your conclusion.
Solution: Use only one of the following: Bonferroni: This method was chosen because we want to compare all of the means in a pairwise fashion.
If the right table is not included, then the following graphical representation is required.
STAT 350 (Spring 2015) Lab 7: SAS Solution 6
LowDose Control HighDose 0.2159333 0.2188667 0.2350667
The above results show that the Control and low dose level have similar effect on bones while high dose does increase BMD. Tukey: This method was chosen because we want to compare all of the means in a pairwise fashion.
If the right table is not included, then the following graphical representation is required.
LowDose Control HighDose 0.2159333 0.2188667 0.2350667
The above results show that the Control and low dose level have similar effect on bones while high dose does increase BMD. 5. (5 pts.) Write a short report explaining the effect of kudzu isoflavones on the femur of
the rat. Be sure to answer the question posed in the initial statement and whether this data can be generalized to humans or not with a reason. This paragraph should be written in complete English sentences and should be understandable to someone who has not taken a course in Statistics.
Solution: From the original question, we want to determine the effect of kudzu isoflavones on the bone density of femus of the rat. From the study above, we can conclude that it is appropriate to use ANOVA for this data and ANOVA does suggest that not all the means of the three groups are the same. Further analysis shows that a high dosage of kudzu isoflavones has a significant effect on the femur bone density of the rat. In addition, a low dosage doesn’t have a significant effect on the femur bone density of the rat. Therefore, high doses of kudzu
STAT 350 (Spring 2015) Lab 7: SAS Solution 7
isoflavones do increase BMD. Knowing that the bones of rats and the bones of humans are similar, I would expect that kudzu isoflavones would have a similar effect on humans; however further studies would be warranted to be sure that this is true. B. (50 pts.) Exercise and healthy bones. (ex12-47jump.txt) Many studies have suggested that there is a link between exercise and healthy bones. Exercise stresses the bones and this causes them to get stronger. One study examined the effect of jumping on the bone density of growing rats. There were three treatments: a control with no jumping, a low-jump condition (the jump height was 30 centimeters), and a high-jump condition (60 centimeters). After 8 weeks of 10 jumps per day, 5 days per week, the bone density of the rats (expressed in milligrams per cubic centimeter) was measured. Here are the data:
Solution: data jump; infile 'W:\PCText\Chapter 12\ex1247jump.txt' firstobs = 2 delimiter = '09'x; input obs Group $ g density; run; proc print data = jump; run; proc sort data = jump; by Group; run; proc means data=jump; var density; by Group; output out=means mean=average; run; symbol1 v=dot i=join; proc gplot data=means; plot average*Group; run; proc sgplot data=jump; By Group; histogram density; density density; density density/type=kernel; run; proc univariate data=jump noprint; By Group; QQplot density/normal (mu=est sigma=est); run;
STAT 350 (Spring 2015) Lab 7: SAS Solution 8
proc glm data=jump alpha=0.01; class Group; model density = Group; means Group /Bon Tukey; means Group/cldiff Bon Tukey; run; 1. (10 pts.) Make side-by-side boxplots and an effects plot of the data. Also, make a table
giving the sample size, mean, and standard deviation for each group of rats. From this information, do you think that all of the means are the same? Be sure to comment on each of the plots.
Solution:
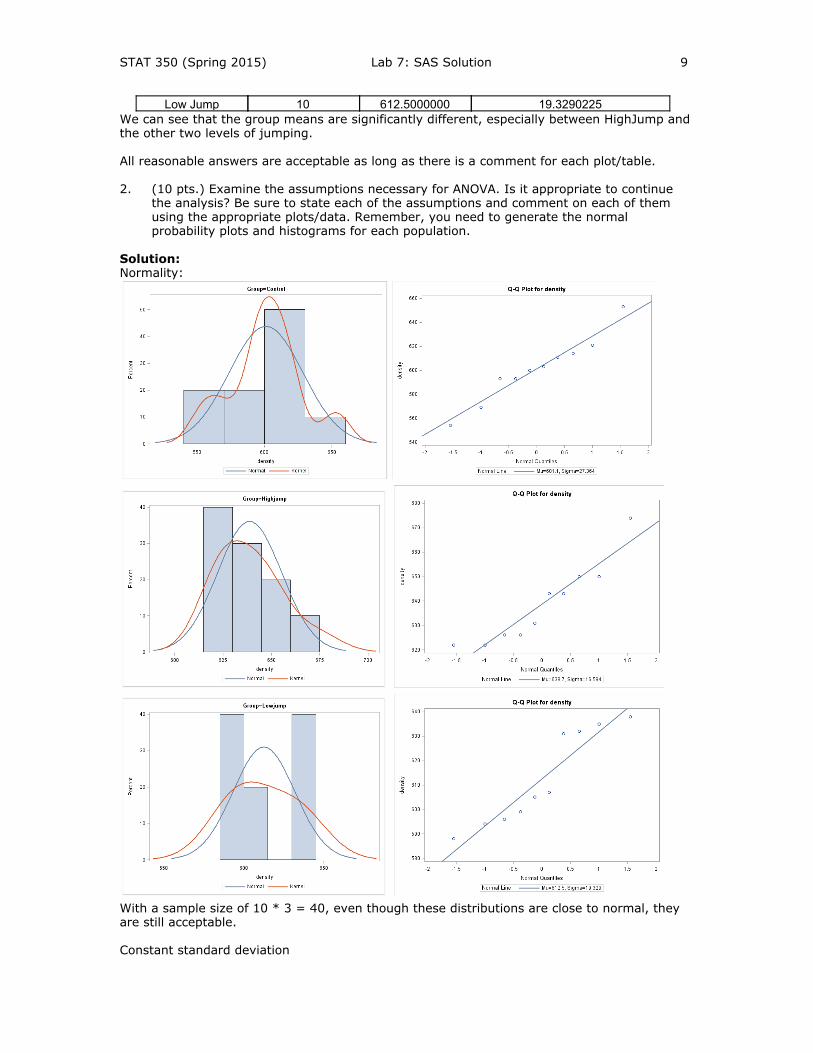
We can see that the group means are significantly different, especially between HighJump and the other two levels of jumping.
We can see that the group means are significantly different, especially between HighJump and the other two levels of jumping.
Group n sample mean sample standard deviation Control 10 601.1000000 27.3636011
High Jump 10 638.7000000 16.5935061
STAT 350 (Spring 2015) Lab 7: SAS Solution 9
Low Jump 10 612.5000000 19.3290225 We can see that the group means are significantly different, especially between HighJump and the other two levels of jumping.
All reasonable answers are acceptable as long as there is a comment for each plot/table. 2. (10 pts.) Examine the assumptions necessary for ANOVA. Is it appropriate to continue
the analysis? Be sure to state each of the assumptions and comment on each of them using the appropriate plots/data. Remember, you need to generate the normal probability plots and histograms for each population.
Solution: Normality:
With a sample size of 10 * 3 = 40, even though these distributions are close to normal, they are still acceptable. Constant standard deviation
STAT 350 (Spring 2015) Lab 7: SAS Solution 10
.65sminsmax = 16.5935061
27.3636011 = 1 < 2
Therefore the constant standard deviation assumption is valid. The other two assumptions, the data comes from an SRS and that the populations are independent of each other are assumed to be correct. Therefore, it is appropriate to continue the analysis. 3. (15 pts.) Report the results of the ANOVA significance test (4* steps) using a significance
level of 0.01. Are your results in this step consistent with part 1? Solution:
Step 0: Definition of the terms μ1 is the population mean density for control group. μ2 is the population mean density for high jump. μ3 is the population mean density for low jump. Step 1: State the hypotheses H0: μ1 = μ2 = μ3 Ha: at least one μi is different. Step 2: Find the Test Statistic. Ft = 7.98 Step 3: Find the p-value, report DF. DF1 = 2, DF2 = 27 P-value = 0.0019 Step 4: Conclusion: α = 0.01 Since 0.0019 < 0.01, we should reject H0 The data provides sufficiently strong evidence (P-value = 0.0019) to the claim that the population mean values of density of at least one of the groups is different from the rest. Yes, the results are consistent with part 1) because in both cases, there is at least one mean
which is different from the rest. 4. (10 pts.) Use an appropriate multiple-comparison method to determine if the height of
jumping effects the bone density of growing rats. Present a graphical representation of the results if appropriate. Write a short statement on your conclusion.
Solution: Use only one of the following: Bonferroni:
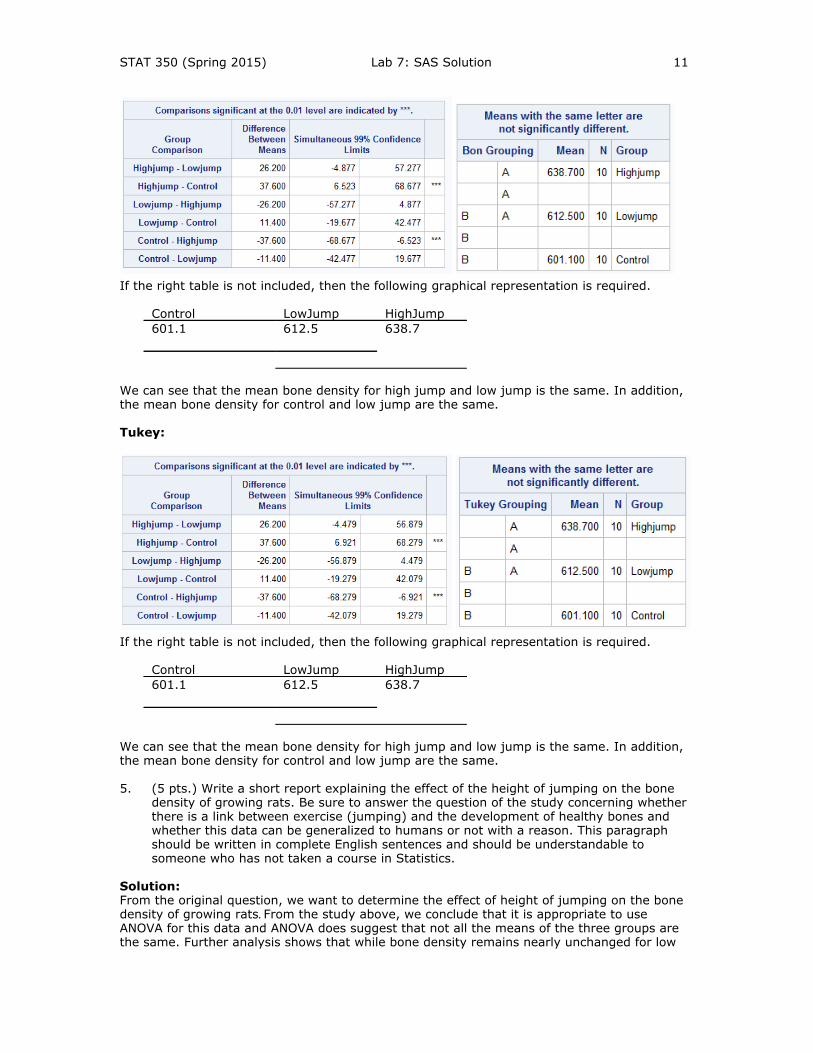
STAT 350 (Spring 2015) Lab 7: SAS Solution 11
If the right table is not included, then the following graphical representation is required.
Control LowJump HighJump 601.1 612.5 638.7
We can see that the mean bone density for high jump and low jump is the same. In addition, the mean bone density for control and low jump are the same. Tukey:
If the right table is not included, then the following graphical representation is required.
Control LowJump HighJump 601.1 612.5 638.7
We can see that the mean bone density for high jump and low jump is the same. In addition, the mean bone density for control and low jump are the same. 5. (5 pts.) Write a short report explaining the effect of the height of jumping on the bone
density of growing rats. Be sure to answer the question of the study concerning whether there is a link between exercise (jumping) and the development of healthy bones and whether this data can be generalized to humans or not with a reason. This paragraph should be written in complete English sentences and should be understandable to someone who has not taken a course in Statistics.
Solution: From the original question, we want to determine the effect of height of jumping on the bone density of growing rats. From the study above, we conclude that it is appropriate to use ANOVA for this data and ANOVA does suggest that not all the means of the three groups are the same. Further analysis shows that while bone density remains nearly unchanged for low
STAT 350 (Spring 2015) Lab 7: SAS Solution 12
jump and control group, the high jump does increase bone density. Even though the bones of rats and humans are similar, I do not know if the growth dynamics are the same. Therefore, further tests would need to be performed to determine if there is a similar effect in humans.