82
1 Lab Center - Hands on Lab Creating IBM Cognos Visualizations with RAVE Session Number LCB-6963 Stephen Gibson, IBM Ivan Leishman, IBM Steve McDougall, IBM Craig Taylor, IBM

1
Lab Center - Hands on Lab Creating IBM Cognos Visualizations with RAVE Session Number LCB-6963 Stephen Gibson, IBM Ivan Leishman, IBM Steve McDougall, IBM Craig Taylor, IBM

2
Table of Contents
Table of Figures .................................................................................................................. 4 Introduction ......................................................................................................................... 7 Environment ........................................................................................................................ 8 Overview ............................................................................................................................. 9
Extensible Visualization Capabilities in IBM Cognos BI .............................................. 9 Visualization “Bundles” ............................................................................................... 10
The IBM Cognos Visualization Customizer Tool ................................................... 12 The IBM Rapidly Adaptive Visualization Engine ....................................................... 13 About visJSON ............................................................................................................. 16
Recommended Practices .......................................................................................... 17 Data in visJSON ...................................................................................................... 18
Structure of a RAVE Spec ........................................................................................... 19 Sample Chart Layouts ............................................................................................. 19 Main Regions of a Typical Chart ............................................................................ 21 Version Information ................................................................................................ 21
Creating Visualizations Using RAVE .............................................................................. 22 Logon to the VMWare image ....................................................................................... 22 Launching IBM Cognos Visualization Customizer ..................................................... 23
Exercise 1: Hello RAVE ......................................................................................... 24 Understanding Data ...................................................................................................... 26
Exercise 2: Working with Data ............................................................................... 27 Grammar – Coordinates Overview .............................................................................. 28 Coordinates – Dimensions and Axis Overview ........................................................... 28 Axis Style Options ....................................................................................................... 30 Titles ............................................................................................................................. 31
Exercise 3: Coordinates and Axes ........................................................................... 32 Labels on Elements ...................................................................................................... 34 Symbols as Elements .................................................................................................... 35 Element Positioning ..................................................................................................... 36
Tag Cloud Example ................................................................................................. 36 Exercise 4: Elements and Labels ............................................................................. 37
Legends Overview ........................................................................................................ 38 Legend Types and Methods ......................................................................................... 38
Exercise 5A: Legends .............................................................................................. 39 Exercise 5B: Continuous Legends ........................................................................... 40
Visualization Size ......................................................................................................... 41

3
Specifying Sizes ........................................................................................................... 41 Exercise 6: Sizes ...................................................................................................... 42
Setting Style for Entire Visualization ........................................................................... 43 Style - Padding ............................................................................................................. 43 Style – Solid “fill” Options .......................................................................................... 44
Named Colors .......................................................................................................... 44 RGB Colors ............................................................................................................. 45 HSL and HSV Colors .............................................................................................. 46 Fill – Linear Gradients ............................................................................................. 47 Radial Gradients ...................................................................................................... 49 Color Selection Tips ................................................................................................ 50 Style Options – “font” ............................................................................................. 50
Style Options – “stroke” ............................................................................................... 51 Exercise 7: Style and Color ..................................................................................... 52
Palettes and Aesthetics ................................................................................................. 54 Using “styleBy” for Aesthetics .................................................................................... 55 Mapping ....................................................................................................................... 55 Size Aesthetics ............................................................................................................. 57 Color Aesthetics ........................................................................................................... 57
Categorical Color Aesthetics ................................................................................... 57 Non-Categorical Color Aesthetics ........................................................................... 58 Technique: Value by Color ..................................................................................... 58 Technique: Change Transparency but not Color ..................................................... 59 Symmetric Upper/Lower ......................................................................................... 59 Mapping “visibility” ................................................................................................ 60 Aesthetics Availability ............................................................................................ 60 Exercise 8: Aesthetics .............................................................................................. 61
Extensible Visualization Property Model .................................................................... 62 RAVE Templates ......................................................................................................... 63
Parameter Values ..................................................................................................... 70 IBM Cognos Visualization Customizer Tool Limitations ........................................... 72 RAVE font Datatype .................................................................................................... 75 RAVE Color Datatype ................................................................................................. 76 Workflow for Adding Parameters ................................................................................ 77 RAVE Palette Datatype ................................................................................................ 79
Exercise 9: Adding a Parameter .............................................................................. 80

4
Table of Figures Figure 1: Unique Visualizations enabled by RAVE ........................................................... 9 Figure 2: Components of a Visualization Bundle ............................................................. 10 Figure 3: Admin Interface for Adding Bundles ................................................................ 11 Figure 4: Report Studio Interfac for Report Authors ........................................................ 11 Figure 5: Report Studio - Using a Visualization ............................................................... 12 Figure 6: IBM Cognos Visualization Customizer ............................................................ 12 Figure 7 - Visualization Process with RAVE ................................................................... 13 Figure 8: Composable Chart Features ............................................................................... 14 Figure 9: Different Visual representations composed using common features ................ 15 Figure 10: Combining Visualization Layouts ................................................................... 15 Figure 11: JSON Syntax ................................................................................................... 16 Figure 12: Sample Data Array .......................................................................................... 18 Figure 13: Sample Chart 1 ................................................................................................ 19 Figure 14: Sample Chart 1 Specification Structure .......................................................... 19 Figure 15: Sample Chart 2 ................................................................................................ 20 Figure 16: Sample Chart 2 Specification Structure .......................................................... 20 Figure 17: IBM Cognos Visualization Customizer (aka VisBundler) .............................. 23 Figure 18: Opening a RAVE Specification ...................................................................... 24 Figure 19: Select features in visBundler ........................................................................... 24 Figure 20: Report Studio Error when data ID is not provided .......................................... 26 Figure 21: Sample Data section in visJSON ..................................................................... 27 Figure 22: Demo.json ........................................................................................................ 27 Figure 23: Different coordinate representations ............................................................... 28 Figure 24: Axes ................................................................................................................. 28 Figure 25: Axes Defaults .................................................................................................. 29 Figure 26: Sample visJSON for an Axis ........................................................................... 30 Figure 27: Axis Options .................................................................................................... 30 Figure 28: Y Axis Title with Variable Text ...................................................................... 31 Figure 29: Sample Axis visJSON ..................................................................................... 32 Figure 30: LayeredLine.json ............................................................................................. 32 Figure 31: Change Palette Feature .................................................................................... 33 Figure 32: Labels Sample ................................................................................................. 34 Figure 33: Sample visJSON using mapping with Labels ................................................. 34 Figure 34: Sample using Mapping .................................................................................... 35 Figure 35: Sample with 16-point star symbol ................................................................... 35 Figure 36: Elements using a Variety of Positionings ........................................................ 36 Figure 37: Tag Cloud Sample ........................................................................................... 37
5
Figure 38: demo2.json ...................................................................................................... 37 Figure 39: Legend Types and Methods ............................................................................ 38 Figure 40: Ex 3 - part A complete Stacked Bar with Legend.json ................................... 39 Figure 41: Icicle_Continuous.json .................................................................................... 40 Figure 42: HelloRave.json ................................................................................................ 42 Figure 43: Setting "lightblue" background ....................................................................... 43 Figure 44: Solid fill using named color: "azure" .............................................................. 44 Figure 45: Sample visJSON for Color "azure" ................................................................. 45 Figure 46: Calculating Hue Value .................................................................................... 46 Figure 47: visJSON for hsv background of "azure" ......................................................... 46 Figure 48: Sample Column Chart with Linear Gradient Background .............................. 47 Figure 49:visJSON for Linear Gradient ............................................................................ 47 Figure 50: visJSON Gradient fill with hsv lightness ........................................................ 48 Figure 51: Lightness Gradient .......................................................................................... 48 Figure 52: Sample Chart with Radial Gradient ................................................................. 49 Figure 53: visJSON for Radial Gradient ........................................................................... 50 Figure 54: visJSON for Stroke Styling ............................................................................. 51 Figure 55: Stroke names ................................................................................................... 51 Figure 56: demo2.json ...................................................................................................... 52 Figure 57: visJSON for a Color Aesthetic ........................................................................ 53 Figure 58: visJSON for a 2-Color Palette ......................................................................... 54 Figure 59: 2-Color Palette with more than 2 Categories .................................................. 54 Figure 60: visJSON using "styleBy" ................................................................................. 55 Figure 61: visJSON for size mapping ............................................................................... 56 Figure 62: Sample of Bubbles with Size Mapping ........................................................... 56 Figure 63: visJSON for Symmetric Upper/Lower ............................................................ 59 Figure 64: Area_Threshold.json ....................................................................................... 61 Figure 65: Properties in Report Studio ............................................................................. 62 Figure 66: Parameter Attributes - id, type ........................................................................ 63 Figure 67: Parameter Attributes - label, description, defaultValue .................................. 64 Figure 68: Parameter Atributes - required ........................................................................ 64 Figure 69: Parameter Attributes - resolution .................................................................... 65 Figure 70: Resolution - Mechanism to define action ........................................................ 65 Figure 71: xpath Syntax .................................................................................................... 66 Figure 72: xpath Syntax Examples ................................................................................... 66 Figure 73: Resolution - Method ........................................................................................ 66 Figure 74: Resolution - Method Example ......................................................................... 67 Figure 75: Resolution - Mechanism to define action ........................................................ 67 Figure 76: Resolution - SourceValue Example ................................................................ 68 Figure 77: Resolution - SourceParameter Example .......................................................... 68 Figure 78: Resolution - SourcePath Example ................................................................... 69 Figure 79: Parameter Attributes - resolutionCases ........................................................... 69 Figure 80: Parameters Attributes - resolveOrder .............................................................. 70 Figure 81: Parameter Values ............................................................................................. 71 Figure 82: Parameter Values Example ............................................................................. 71 Figure 83: Parameter Values - id, value ............................................................................ 72

6
Figure 84: Defined enumProperty results in Report Studio .............................................. 74 Figure 85: Font Dialog box in Report Studio ................................................................... 75 Figure 86: Color Dialog Box in Report Studio ................................................................. 76 Figure 87: Sample of Parameters in visJSON ................................................................... 77 Figure 88: Adding Parameters to the XML ...................................................................... 78 Figure 89: Results in Report Studio .................................................................................. 78 Figure 90: airline shape.json ............................................................................................. 80

7
Introduction This lab will introduce the participants to the Extensible Visualization capabilities within IBM Cognos BI 10.2.1 and later releases. A key part of that capability is powered by the IBM Rapidly Adaptive Visualization Engine (RAVE), and the associated declarative visualization language, which, for the sake of simplicity, we call visJSON. At the end of the session, each participant should have a better understanding of the visualization concepts used in RAVE, and understand how a visualization can be edited by modifying the specification, included in a “Visualization Bundle” and used within Report Studio. The session also introduces the new support for properties/parameters in extensible visualizations, which helps streamline the report authoring process using RAVE visualizations.

8
Environment The following software has been installed and successfully configured in a VMWare image for this lab exercise:
• IBM Cognos Visualization Customizer, which includes the IBM Rapidly Adaptive Visualization Engine and sample visualizations

9
Overview
Extensible Visualization Capabilities in IBM Cognos BI Visualization is well understood as a valuable means to understand complex data. In fact, standard or well-known business charts, like bar, pie, line, and area charts have been part of leading BI applications for years. Recently, however, the need to summarize vast amounts of data in consumable ways has become even more important as the volumes and variety of data available increases at astounding rates. At IBM we have recognized that data visualization is the key to making data more consumable to end users, exemplified by the popularity of the IBM Many Eyes application. We have also heard from customers that there are often industry-specific or company specific visualization requirements that no boxed application has been able to provide in an extensible way. To address those needs, IBM Cognos BI 10.2.1 and later releases introduced a capability described as “Extensible Visualization”. They key objectives were to enable organizations to extend their BI application with new and unique visualizations at any time, un-tethered from the BI product delivery schedule, and without having to be experts in software product development.
Figure 1: Unique Visualizations enabled by RAVE

10
Visualization “Bundles”
Figure 2: Components of a Visualization Bundle

11
Figure 3: Admin Interface for Adding Bundles
Figure 4: Report Studio Interfac for Report Authors

12
Figure 5: Report Studio - Using a Visualization
The IBM Cognos Visualization Customizer Tool
Figure 6: IBM Cognos Visualization Customizer

13
The IBM Rapidly Adaptive Visualization Engine RAVE (the IBM Rapidly Adaptive Visualization Engine) was built to provide IBM software developers with unmatched flexibility in creating visualizations in their applications. The visualization engine had to work in various environments (e.g. web/mobile/desktop), provide developers with the ability to control the visual presentation and make great looking charts, support interactivity and animation, and be portable across various applications from IBM. What sets RAVE apart from other visualization technologies is the declarative language approach, described in “The Grammar of Graphics” (Wilkinson, 2005). This approach provides a highly adaptive framework that allows for the creation of customized visualizations. The visualization description is then interpreted by the RAVE Engine in the target platform (e.g. Java) and renders the described visualization.
Figure 7 - Visualization Process with RAVE

14
The fundamental concept underlying this approach is that visualizations share many common “features” that can be combined in many ways to create different charts. For example, axes are common across bar charts, line charts, scatter plots. The RAVE language enables the visualization creator to declare that the chart has an axis, and the rendering engine interprets that instruction and draws an axis. Listed below are some additional common chart features (this is not exhaustive):
Figure 8: Composable Chart Features The following images show how combining visualization features in different ways can yield unique, yet understandable visualizations. The first 3 charts show how the “space-filling tree” or “icicle” layout can be shared across quite different looking visualizations with categorical data, continuous data, and horizontal or polar structures:

15
Figure 9: Different Visual representations composed using common features Combining a well-known stacked bar chart layout with the popular treemap layout yields a new visualization that is new to most users, yet still understandable.
Figure 10: Combining Visualization Layouts

16
About visJSON Please note that we are using the term “visJSON” in this document as a short-form for “visualization description expressed in JSON” – it is not an official name in any respect. JSON is an acronym for “JavaScript Object Notation”, which is a standard described at http://www.json.org. For the purposes of this Hands-on-Labs session, all that is important to know is that there is a consistent syntax used for describing “things” in JSON that becomes fairly self-evident as you work with the specification. The following provides a high-level reference as a starting point:
Figure 11: JSON Syntax

17
Recommended Practices

18
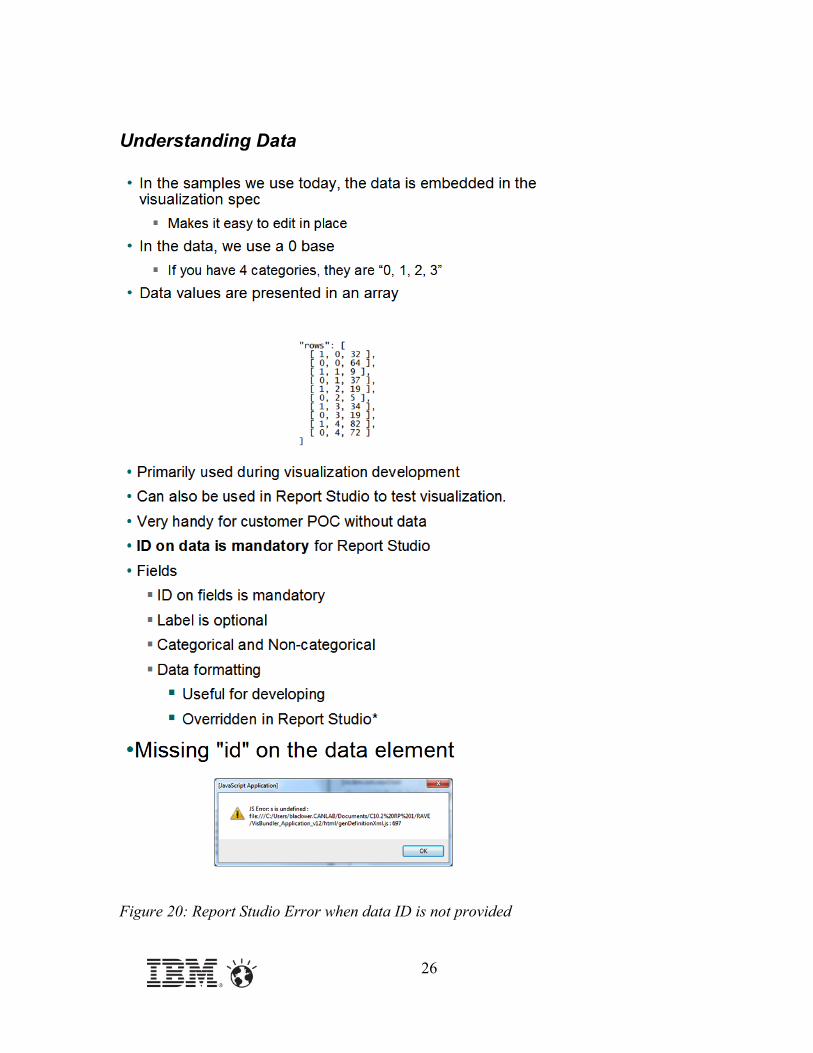
Data in visJSON When the RAVE component is implemented in a software product, it can be hooked to data in a number of ways. For the sake of this Hands-on-Labs session, all of the data is embedded directly in the visualization specification (visJSON). This has the advantage of enabling you to edit the data within the visualization and see the data in the visualization at the same time. Please note that in ordered number lists in RAVE, we use a 0 base. In other words, if you have 4 categories, they would be listed in the specification as “0, 1, 2, 3”. In each of the visJSON specs you’ll be using, the data is presented in a javascript array. A sample of the syntax is as shown below, where there are 2 categories (0 and 1), 5 sub-categories (0, 1, 2, 3, and 4) and the data values (32, 64, … ):
Figure 12: Sample Data Array
19
Structure of a RAVE Spec
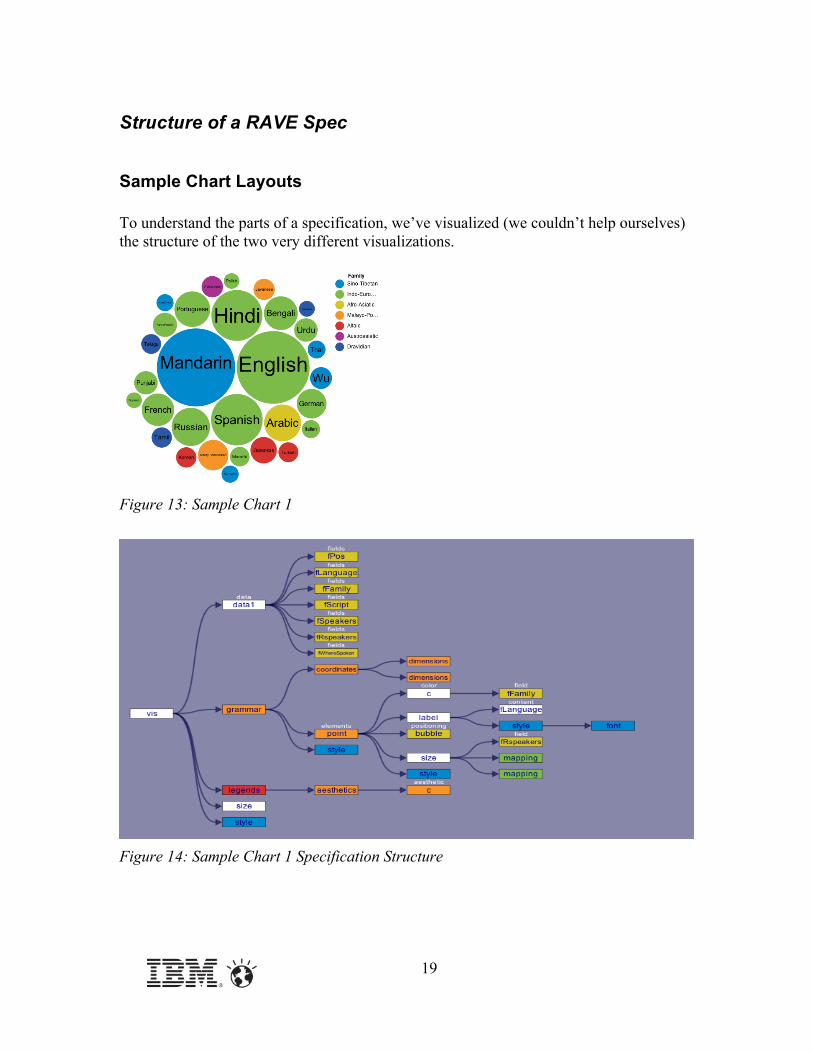
Sample Chart Layouts To understand the parts of a specification, we’ve visualized (we couldn’t help ourselves) the structure of the two very different visualizations.
Figure 13: Sample Chart 1
Figure 14: Sample Chart 1 Specification Structure
20
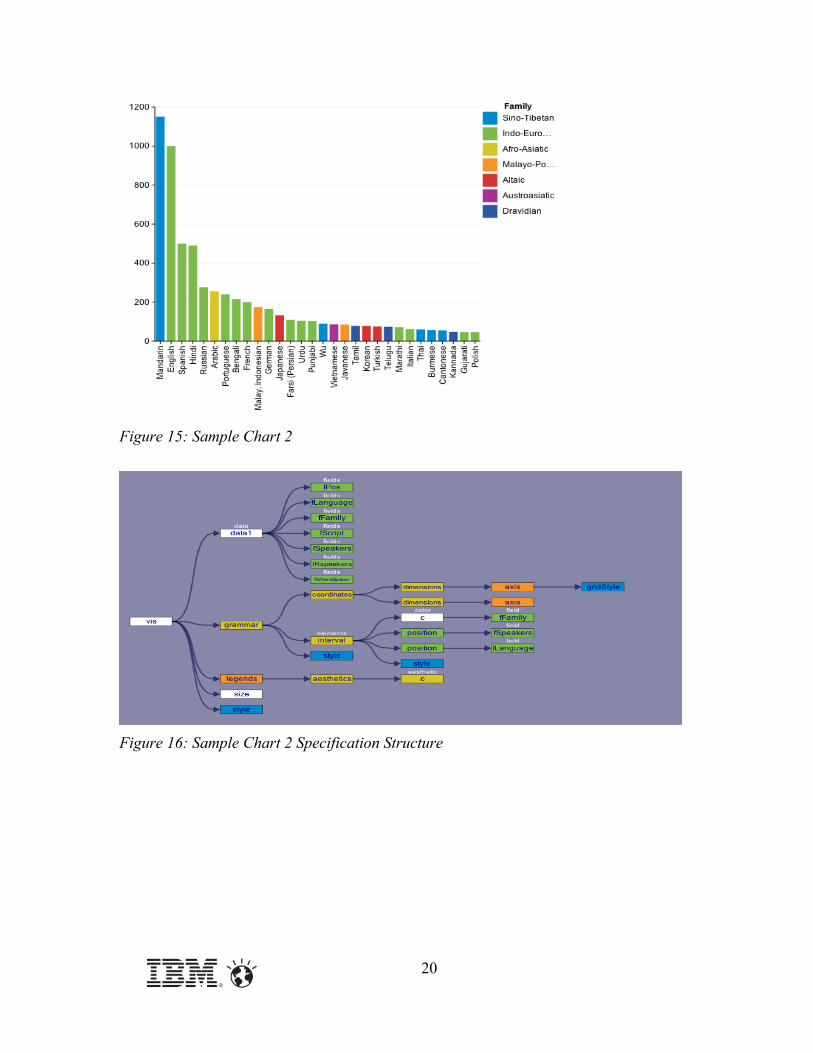
Figure 15: Sample Chart 2
Figure 16: Sample Chart 2 Specification Structure

21
Main Regions of a Typical Chart
Version Information

22
Creating Visualizations Using RAVE
Logon to the VMWare image Please Note: This entire lab is built around a VMWare image. If you are unfamiliar with VMWare, please consult one of the instructors.
a) Start the VMWare image associated with this lab – please consult with an instructor for details.
b) The image is set up for auto-login. You should get logged in once the image starts up.
c) It is recommended that once the image is up and running, you go into Full screen by pressing CTRL + ALT + Enter. You can press these same keys again to return to the default view.
Note: Once you are in the image in Full screen, the rest of the instructions/exercises will be easier to follow.

23
Launching IBM Cognos Visualization Customizer Once the VMWare image is full-screen, you should see the VM “desktop”.
a) Open “Notepad” in the Start/All Programs/Accessories location in Windows. Notepad will be helpful during exercises for copying and pasting.
b) Locate the “visBundler” icon on the desktop. c) Double-click on the icon to launch the application. d) Adjust the widths of the Preview and Editing panes as needed by dragging the
center divider.
Figure 17: IBM Cognos Visualization Customizer (aka VisBundler)
24
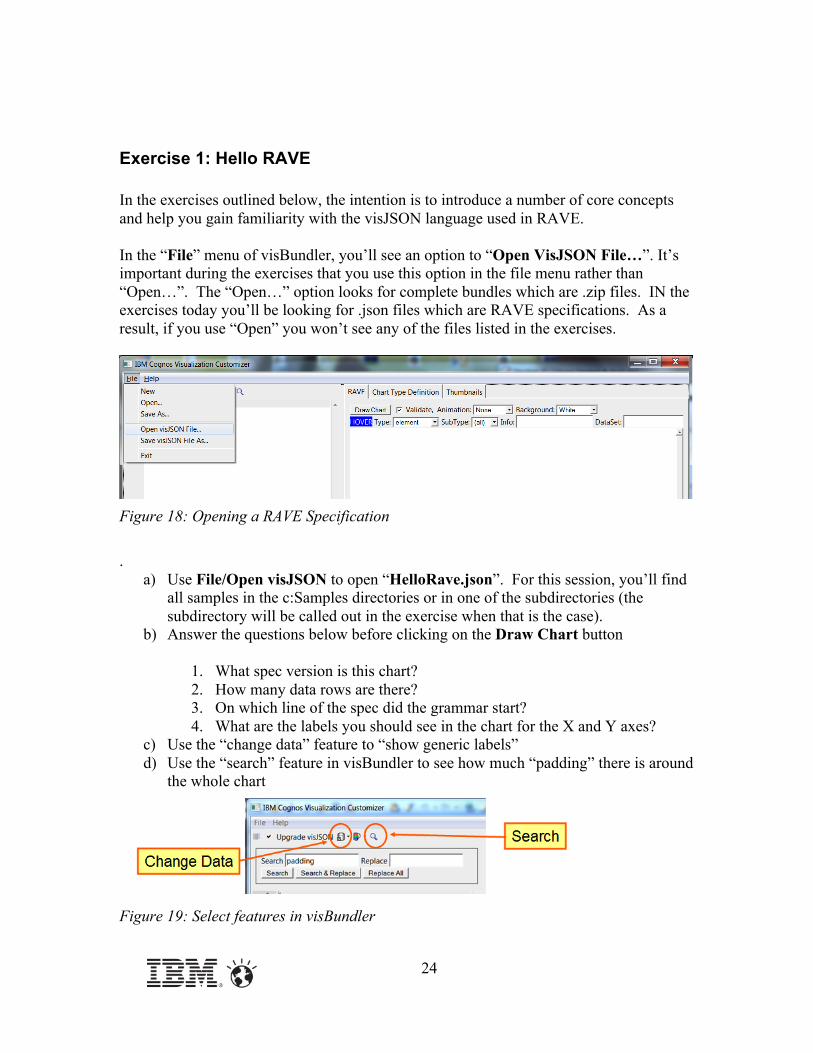
Exercise 1: Hello RAVE In the exercises outlined below, the intention is to introduce a number of core concepts and help you gain familiarity with the visJSON language used in RAVE. In the “File” menu of visBundler, you’ll see an option to “Open VisJSON File…”. It’s important during the exercises that you use this option in the file menu rather than “Open…”. The “Open…” option looks for complete bundles which are .zip files. IN the exercises today you’ll be looking for .json files which are RAVE specifications. As a result, if you use “Open” you won’t see any of the files listed in the exercises.
Figure 18: Opening a RAVE Specification
.
a) Use File/Open visJSON to open “HelloRave.json”. For this session, you’ll find all samples in the c:Samples directories or in one of the subdirectories (the subdirectory will be called out in the exercise when that is the case).
b) Answer the questions below before clicking on the Draw Chart button
1. What spec version is this chart? 2. How many data rows are there? 3. On which line of the spec did the grammar start? 4. What are the labels you should see in the chart for the X and Y axes?
c) Use the “change data” feature to “show generic labels” d) Use the “search” feature in visBundler to see how much “padding” there is around
the whole chart
Figure 19: Select features in visBundler

25
26
Understanding Data
Figure 20: Report Studio Error when data ID is not provided

27
Figure 21: Sample Data section in visJSON
Exercise 2: Working with Data
Figure 22: Demo.json

28
Coordinates and Axes
Grammar – Coordinates Overview The grammar defines a Coordinates System – an area into which data will be plotted. These come in different forms:
Figure 23: Different coordinate representations
Coordinates – Dimensions and Axis Overview
Figure 24: Axes

29
Figure 25: Axes Defaults

30
Figure 26: Sample visJSON for an Axis
Axis Style Options
Figure 27: Axis Options

31
Titles
Figure 28: Y Axis Title with Variable Text

32
Figure 29: Sample Axis visJSON
Exercise 3: Coordinates and Axes
Figure 30: LayeredLine.json

33
Figure 31: Change Palette Feature
Elements and Labels

34
Labels on Elements
Figure 32: Labels Sample
Figure 33: Sample visJSON using mapping with Labels

35
Figure 34: Sample using Mapping
Symbols as Elements
Figure 35: Sample with 16-point star symbol

36
Element Positioning
Figure 36: Elements using a Variety of Positionings
Tag Cloud Example

37
Figure 37: Tag Cloud Sample
Exercise 4: Elements and Labels
Figure 38: demo2.json

38
Legends
Legends Overview
Legend Types and Methods
Figure 39: Legend Types and Methods

39
Exercise 5A: Legends
Figure 40: Ex 3 - part A complete Stacked Bar with Legend.json

40
Exercise 5B: Continuous Legends
Figure 41: Icicle_Continuous.json

41
Sizes
Visualization Size
Specifying Sizes

42
Exercise 6: Sizes
Figure 42: HelloRave.json
43
Style and Colors
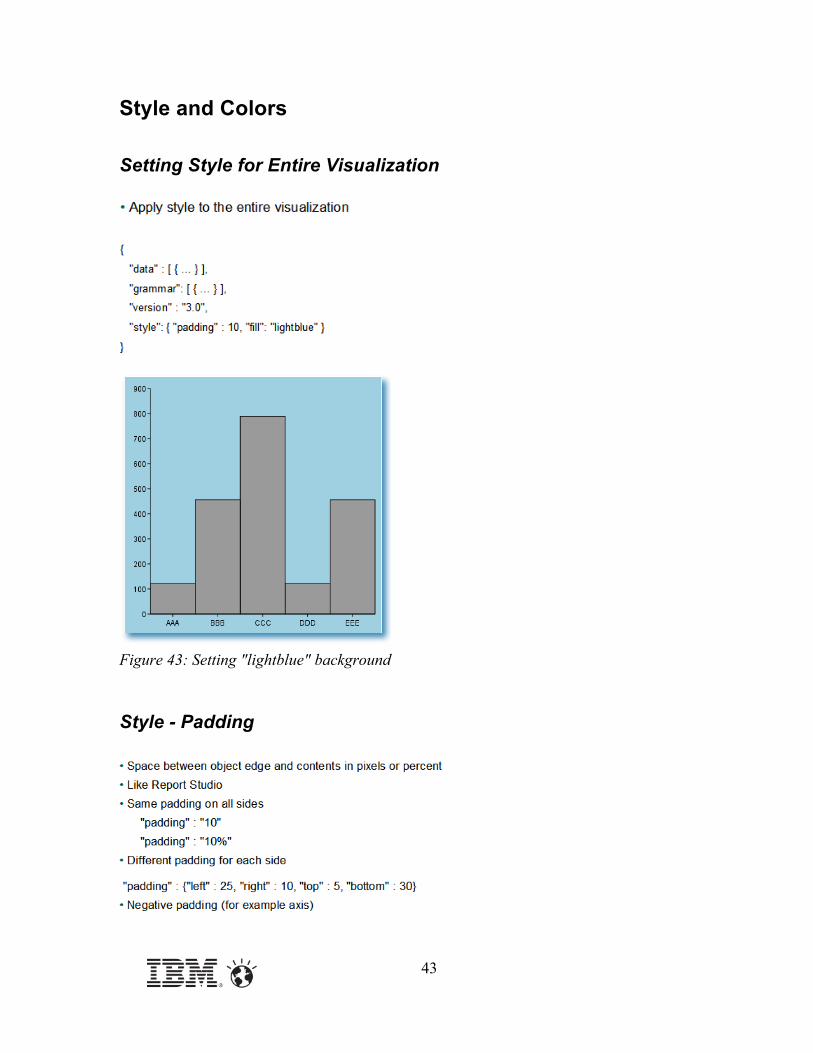
Setting Style for Entire Visualization
Figure 43: Setting "lightblue" background
Style - Padding

44
Style – Solid “fill” Options
Named Colors
Figure 44: Solid fill using named color: "azure"

45
RGB Colors
Figure 45: Sample visJSON for Color "azure"

46
HSL and HSV Colors
Figure 46: Calculating Hue Value
Figure 47: visJSON for hsv background of "azure"

47
Fill – Linear Gradients
Figure 48: Sample Column Chart with Linear Gradient Background
Figure 49:visJSON for Linear Gradient

48
Figure 50: visJSON Gradient fill with hsv lightness
Figure 51: Lightness Gradient

49
Radial Gradients
Figure 52: Sample Chart with Radial Gradient

50
Figure 53: visJSON for Radial Gradient
Color Selection Tips
Style Options – “font”
51
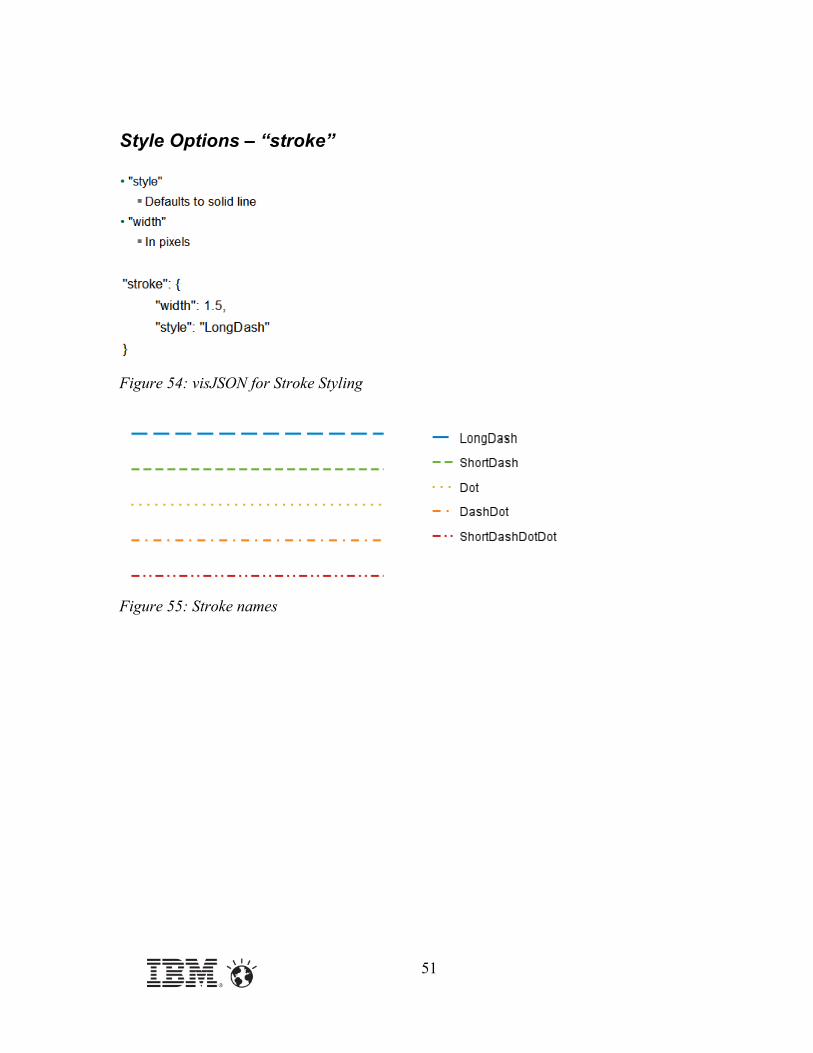
Style Options – “stroke”
Figure 54: visJSON for Stroke Styling
Figure 55: Stroke names

52
Exercise 7: Style and Color
Figure 56: demo2.json
53
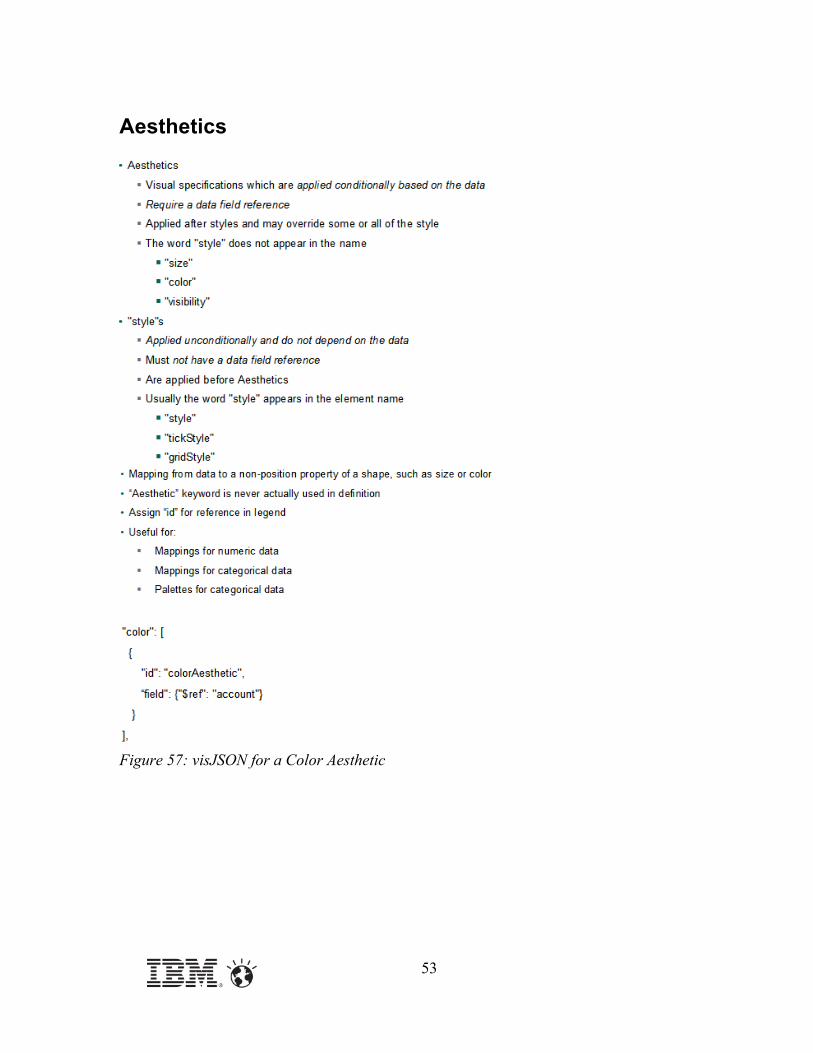
Aesthetics
Figure 57: visJSON for a Color Aesthetic

54
Palettes and Aesthetics
Figure 58: visJSON for a 2-Color Palette
Figure 59: 2-Color Palette with more than 2 Categories

55
Using “styleBy” for Aesthetics
Figure 60: visJSON using "styleBy"
Mapping

56
Explicit Mapping
Figure 61: visJSON for size mapping
Figure 62: Sample of Bubbles with Size Mapping

57
Size Aesthetics
Color Aesthetics
Categorical Color Aesthetics

58
Non-Categorical Color Aesthetics
Technique: Value by Color

59
Technique: Change Transparency but not Color
Symmetric Upper/Lower
Figure 63: visJSON for Symmetric Upper/Lower
60
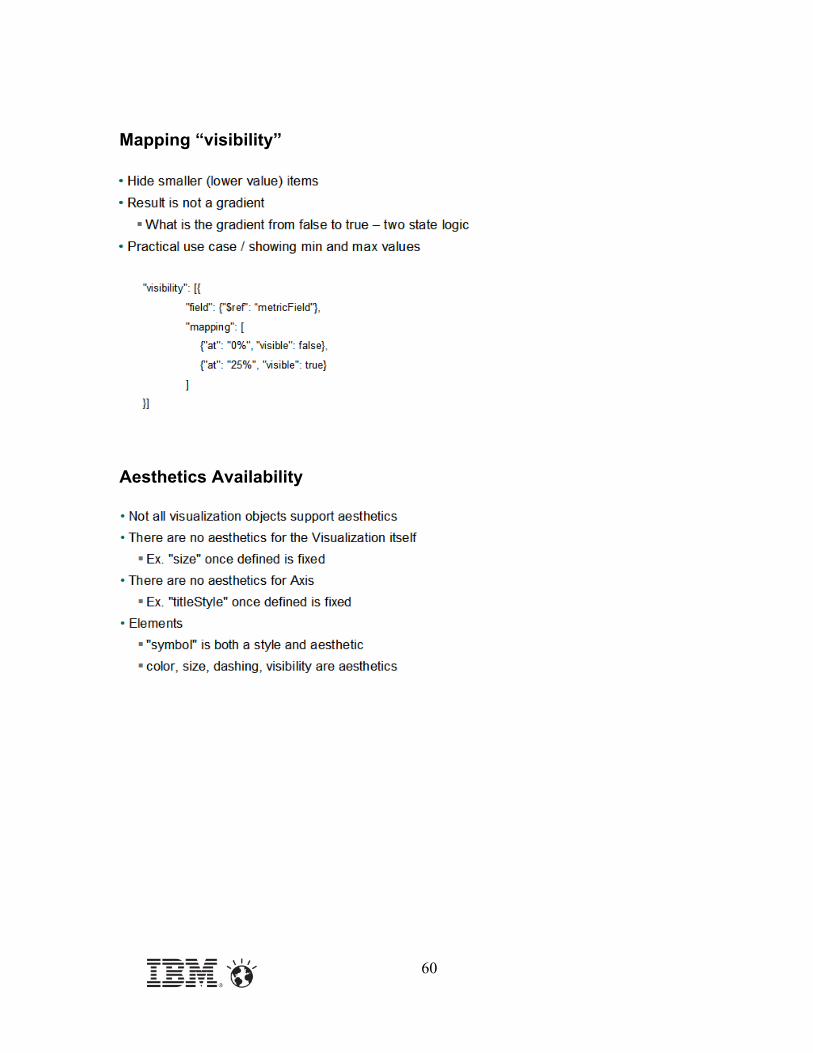
Mapping “visibility”
Aesthetics Availability

61
Exercise 8: Aesthetics
Figure 64: Area_Threshold.json

62
Templates and Parameters
Extensible Visualization Property Model
Figure 65: Properties in Report Studio

63
RAVE Templates
Figure 66: Parameter Attributes - id, type

64
Figure 67: Parameter Attributes - label, description, defaultValue
Figure 68: Parameter Atributes - required

65
Figure 69: Parameter Attributes - resolution
Figure 70: Resolution - Mechanism to define action

66
Figure 71: xpath Syntax
Figure 72: xpath Syntax Examples
Figure 73: Resolution - Method

67
Figure 74: Resolution - Method Example
Figure 75: Resolution - Mechanism to define action

68
Figure 76: Resolution - SourceValue Example
Figure 77: Resolution - SourceParameter Example

69
Figure 78: Resolution - SourcePath Example
Figure 79: Parameter Attributes - resolutionCases

70
Figure 80: Parameters Attributes - resolveOrder
Parameter Values

71
Figure 81: Parameter Values
Figure 82: Parameter Values Example

72
Figure 83: Parameter Values - id, value
IBM Cognos Visualization Customizer Tool Limitations

73

74
Figure 84: Defined enumProperty results in Report Studio

75
RAVE font Datatype
Figure 85: Font Dialog box in Report Studio

76
RAVE Color Datatype
Figure 86: Color Dialog Box in Report Studio

77
Workflow for Adding Parameters
Figure 87: Sample of Parameters in visJSON

78
Figure 88: Adding Parameters to the XML
Figure 89: Results in Report Studio

79
RAVE Palette Datatype

80
Exercise 9: Adding a Parameter
Figure 90: airline shape.json

81
We Value Your Feedback!
• Don’t forget to submit your Insight session and speaker feedback! Your feedback is very important to us – we use it to continually improve the conference.
• Access the Insight Conference Connect tool to quickly submit your surveys from your smartphone, laptop or conference kiosk.

82
Availability. References in this presentation to IBM products, programs, or services do not imply that they will be available in all countries in which IBM operates.
The workshops, sessions and materials have been prepared by IBM or the session speakers and reflect their own views. They are provided for informational purposes only, and are neither intended to, nor shall have the effect of being, legal or other guidance or advice to any participant. While efforts were made to verify the completeness and accuracy of the information contained in this presentation, it is provided AS-IS without warranty of any kind, express or implied. IBM shall not be responsible for any damages arising out of the use of, or otherwise related to, this presentation or any other materials. Nothing contained in this presentation is intended to, nor shall have the effect of, creating any warranties or representations from IBM or its suppliers or licensors, or altering the terms and conditions of the applicable license agreement governing the use of IBM software.
All customer examples described are presented as illustrations of how those customers have used IBM products and the results they may have achieved. Actual environmental costs and performance characteristics may vary by customer. Nothing contained in these materials is intended to, nor shall have the effect of, stating or implying that any activities undertaken by you will result in any specific sales, revenue growth or other results.
© Copyright IBM Corporation 2014. All rights reserved.
— U.S. Government Users Restricted Rights – Use, duplication or disclosure restricted by GSA ADP Schedule Contract with IBM Corp.
IBM, the IBM logo, ibm.com and Cognos are trademarks or registered trademarks of International Business Machines Corporation in the United States, other countries, or both. If these and other IBM trademarked terms are marked on their first occurrence in this information with a trademark symbol (® or TM), these symbols indicate U.S. registered or common law trademarks owned by IBM at the time this information was published. Such trademarks may also be registered or common law trademarks in other countries. A current list of IBM trademarks is available on the Web at
• “Copyright and trademark information” at www.ibm.com/legal/copytrade.shtml
• Other company, product, or service names may be trademarks or service marks of others.
Acknowledgements and Disclaimers


