98
Laboratory Evaluation of Bond Between Bituminous Paving Layers Jyoti Prakash Giri Department of Civil Engineering National Institute of Technology Rourkela – 769 008, India May 2013

Laboratory Evaluation of Bond Between
Bituminous Paving Layers
Jyoti Prakash Giri
Department of Civil Engineering National Institute of Technology
Rourkela – 769 008, India
May 2013

Laboratory Evaluation of Bond between Bituminous Paving Layers
Thesis Submitted To the
Department of Civil Engineering
of National Institute of Technology Rourkela
In partial fulfillment of the requirements for
the award of the degree
of
Master of Technology
by
Jyoti Prakash Giri (Roll No. 211CE3243)
Under the supervision of Prof. Mahabir Panda
DEPARTMENT OF CIVIL ENGINEERING NATIONAL INSTITUTE OF TECHNOLOGY
ROURKELA 769008 May 2013

May 30, 2013
Certificate
This is to certify that the work in the thesis entitled “Laboratory Evaluation of Bond
between Bituminous Paving Layers” by Jyoti Prakash Giri is a record of an original
work carried out by him under my supervision and guidance in partial fulfillment of the
requirements for the award of the degree of Master of Technology in Department of Civil
Engineering with specialization in Transportation Engineering. Neither this project nor any
part of it has been submitted for any degree or academic award elsewhere.
Prof. Mahabir Panda
Professor
Department of Civil Engineering
NIT Rourkela
Department of Civil Engineering National Institute of Technology Rourkela Rourkela-769 008, India. www.nitrkl.ac.in

Dedicated to my
(Late) Grandfather and (Late) Grandmother

ACKNOWLEDGEMENT
First and foremost, praise and thanks go to my God Sai Baba for the blessing that has
been bestowed upon me in all my endeavors.
I would like to express my deep gratitude to my advisor, Prof. Mahabir Panda for
providing me with a platform to work on a very exciting field of Improvement in Pavement
Construction. His untiring effort, commitment, encouragement, guidance and support helped me
in understanding and giving word to my research.
I express my sincere thanks to Prof. S. K. Sarangi (Director) , Prof. N. Roy (HOD), Prof.
U. Chattaraj, Prof. P. K. Bhuyan and all other faculties of Dept. of Civil Engineering, for their
help and cooperation during the progress of this work.
I am highly grateful to my senior Mr. Bidyut Bikash Sutradhar (Ex-M. Tech student) of
Dept. of Civil Engineering who was kind enough to help me in my research work.
I am very grateful to Mr. S. C. Xess, Mr. H. M. Garnayak, Sambhu and Rahul staff of
Highway and Concrete Laboratory whom guidance and cooperation helped me to finish this
research.
It gives me great pleasure to acknowledging Prof. Sitaram panda (my B. Tech HOD) and
Er. S. C. Choudhury for their encouragement, inspiration and suggestions for my research.
I acknowledge with thanks to Amit, Achuta, Ashish, Mohit Bhai, Madan, Rajendra and
Ambuj for all the help, moral and intellectual over the year. Also, I especially want to thank my
B. Tech friends Lisa, Abhisek, Rajkumar and Prabhupada for their support.
Most importantly, this would not have been possible without the love and support of my
Parents and my sister Akasmika. My family has been a constant source of love, concern, support
and strength all these years. I would like to express my heart-felt gratitude to them.
Jyoti Prakash Giri

i
Abstract
A bituminous pavement is a multi-layered structure generally made up of surfacing, base and
sub base courses on a sub grade. An interface is said to be a boundary between any two
consecutive layers. So an adequate bond between the layers at the interfaces must be ensured so
that multiple layers perform as a single composite structure. In case of non-bituminous layers or
bituminous-non bituminous layers, adequate bond is established as such due to the mechanical
interlocking between the aggregate surfaces. However, the state of bond at the interface between
any two bituminous layers has a significant influence on the stress distribution across pavement
layers under traffic loads and hence on the overall performance of the pavement. To increase the
adhesion or bonding between two bituminous layers, bituminous tack coats are applied prior to
overlay. This study is an attempt to evaluate the interface bond strength between two types of
bituminous layer combinations in the laboratory. The cylindrical specimens have been tested for
bond strength at four normal service temperatures, namely 250, 300, 350 and 400C by applying
different types of tack coat at varying application rates. The specimens have been prepared
using normal Marshall Procedure first for the underlying layer, followed by application of tack
coat and finally overlaying with the top layer in the same mould in an appropriate manner. Two
types of layer combinations have been tried, namely (i) Bituminous Concrete (BC) layer on
Dense Bituminous Macadam (DBM) samples and (ii) Semi Dense Bituminous Concrete
(SDBC) layer on Bituminous Macadam (BM) samples. Similarly, different types of tack coat
materials namely bitumen, Cationic Rapid Setting with low viscosity (CRS-1) and Cationic
Medium Setting with high viscosity (CMS-2) emulsions have been used for the interface bond
between the said bituminous layers. The samples thus prepared have then been tested on a
specially fabricated attachment (named bond strength device) fixed to the loading frame of the

ii
Modified Marshall Testing Apparatus. It is observed that the interlayer bond strength depends
on the test temperature and this decreases with increase in test temperature. It is also observed
that the bond strength depends on the type of tack coat used and conditions of the type of
combinations. The optimum amount of tack coat has been found to vary for tack coat type and
layer combination type.
Key words: Interlayer Bond strength, Tack coat, Bituminous layer combination, Bond strength
device.

iii
TABLE OF CONTENTS
Title Page No.
Certificate
Acknowledgements
Abstract i
Table of contents iii
List of tables vii
List of figures ix
Abbreviations xiii
CHAPTER I INTRODUCTION 1
1.1. General 2
1.2. Failures arise due to inadequate bond 3
1.3. Background of Tack coat 4
1.4. Objectives 6
1.5. Organizations of the Thesis 7
CHAPTER II REVIEW OF LITERATURE 8
2.1 Introduction 9
2.2. Past Studies on Evaluation of Pavement Interlayer Bond Strength 9
2.3. Factors affecting the interlayer bond strength of pavement 24
2.3.1. Influence of rate of displacement 24
2.3.2. Influence of tack coat type 25

iv
2.3.3. Influence of tack coat application rate 26
2.3.4. Influence of testing temperature 28
2.3.5. Influence of normal pressure 29
2.3.6. Influence of tack coat curing time 29
2.4. Critical Review 30
CHAPTER III EXPERIMENTAL METHODOLOGY 31
3.1. Introduction 32
3.2. Methodology 32
3.3 .Materials Used 34
3.3.1. Aggregates 34
3.3.2. Filler 35
3.3.3. Binder 38
3.3.4. Tack Coat 38
3.4. Preparation of Samples 40
3.5. Fabrication of simple attachment to measure the Interlayer Bond Strength 42
CHAPTER IV RESULTS AND DISCUSSIONS 44
4.1. Introduction 45
4.2. Laboratory Test Results 46
4.2.1. Interlayer Bond Strength for DBM and BC Combination 46
4.2.1.1. Variation of ILBS with rate of application for CRS-1 type tack coat at
various setting time 46

v
4.2.1.2. Comparisons of average ILBS and tack coat application rates at different
test temperatures with various setting times of the CRS-1 type 49
4.2.1.3. Various of ILBS with rate of application for CMS-2 type tack coat at
various setting times 52
4.2.1.4. Comparisons of average ILBS and tack coat application rates at different
test temperatures with various setting times of CMS-2 type. 55
4.2.1.5. Variation of ILBS with rate of application when VG 30 bitumen focused
as a tack coat considering various setting time 58
4.2.1.6. Comparisons of average ILBS and application rates at different test
temperatures with various setting times of VG 30 bitumen 61
4.2.1.7. Variation of ILBS considering various duration of compaction between
DBM and BC bituminous paving layers 64
4.2.2. Interlayer Bond Strength for BM and SDBC Combinations 65
4.2.2.1. Variation of ILBS with rate of application for a CRS-1 type tack coat
considering 1 hour setting time 65
4.2.2.2. Variation of ILBS with rate of application for a CMS-2 type tack coat
considering 9 hours setting times 67
4.2.2.3. Comparisons of average ILBS and tack coat application rates of CMS-2
and CRS-1 type tack coat at different test temperatures 68
4.3. Overall Performance of Interlayer Bond Strength 70
4.3.1. ILBS comparisons between two types tack coat, bitumen as tack coat and with no
tack coat at different test temperatures for DBM and BC 70

vi
4.3.2. ILBS comparisons between two types tack coat at different test temperatures for
BM and SDBC type 71
CHAPTER V CONCLUSIONS AND FUTURE SCOPE 72
5.1. Introduction 73
5.2. Conclusions 73
5.3. Future Scope of Works 75
REFERENCES 76

vii
List of Tables
Table No Title Page No
2.1 Recommended tack coat application rates in Ohio 27
2.2 Recommended Tack Coat Application Rates Used in California 28
3.1 MORTH gradation for DBM (NMAS 25mm) 35
3.2 MORTH gradation for BC (NMAS 13 mm) 36
3.3 MORTH gradations for BM (NMAS 19 mm) 37
3.4 MORTH gradations for SDBC (NMAS 13 mm) 37
3.5 Physical properties of aggregates 38
3.6 Physical properties of VG 30 bitumen binder 39
3.7 Physical properties of Tack Coats 39
3.8 Rate of application of Tack Coat as per MORT&H Specification 41
4.1 ILBS of CRS-1 type tack coat (Considering 0.5 hour setting time) 46
4.2 ILBS of CRS-1 type tack coat (Considering 1 hour setting time) 47
4.3 ILBS of CRS-1 type tack coat (Considering 1.5 hour setting time) 48
4.4 ILBS of CMS-2 type tack coat (Considering 6 hour setting time) 52
4.5 ILBS of CMS-2 type tack coat (Considering 9 hour setting time) 53
4.6 ILBS of CMS-2 type tack coat (Considering 12 hour setting time) 54
4.7 ILBS of VG 30 as a tack coat (Considering 0 hour setting time) 58
4.8 ILBS of VG 30 as a tack coat (Considering 0.5 hour setting time) 59
4.9 ILBS of VG 30 as a tack coat (Considering 1 hour setting time) 60

viii
4.10 ILBS without using any tack coat 64
4.11 ILBS of CRS-1 type tack coat 66
4.12 ILBS of CMS-2 type tack coat 67

ix
List of Figures
Figure No Titles Page No
1.1 Slippage failure 3
1.2 Surface layer Delamination 4
1.3 Composition of Bituminous Emulsion 5
2.1 Superpave Shear Tester 11
2.2 Leutner Shear Strength Tester 12
2.3 Simple Shear Test Device 13
2.4 Schematic views of the LPDS (Layer-Parallel Direct Shear) test device with pneumatic clamping
14
2.5 Swiss LPDS Tester 15
2.6 FDOT Shear Tester Device inside an MTS 16
2.7 Schematic view of ASTRA device 17
2.8 NCAT Bond Strength Device 20
2.9 Torque Bond Tester with procedure 21
2.10 Schematic and actual view of LCB shear test 22
2.11 KSU shear tester 23
2.12 Shear-Testing device developed at McAsphalt Lab 24
3.1 Methodology of the experimental work 33
3.2 Schematic diagrams of the fabricated Interlayer Bond Strength device 43
3.3 Photographic views of the fabricated Interlayer Bond Strength device 43
4.1 Relationship between Average ILBS and Tack Coat Application Rate
at different test temperature when setting time is 0.5 hours for the
CRS-1 type of tack coat
47
4.2 Relationship between Average ILBS and Tack Coat Application Rates 48

x
at different test temperature when setting time is 1 hour for CRS-1 type
of tack coat
4.3 Relationship between Average ILBS and Tack Coat Application Rates
at different test temperature when setting time is 1 hour for CRS-1 type
of tack coat
49
4.4 Relationships between Average ILBS and Tack Coat Application Rates
at 250C for the CRS-1type of tack coat
49
4.5 Relationships between Average ILBS and Tack Coat Application Rates
at 300C for the CRS-1 type of tack coat
50
4.6 Relationships between Average ILBS and Tack Coat
Application Rates at 350C for the CRS-1 type of tack coat
51
4.7 Relationships between Average ILBS and Tack Coat Application Rates
at 400C for the CRS-1 type of tack coat
51
4.8 Relationships between Average ILBS and Tack Coat Application Rates
at different test temperature when setting time is 6 hours
53
4.9 Relationships between Average ILBS and Tack Coat Application Rates
at different test temperature when setting time is 9 hours
54
4.10 Relationships between Average ILBS and Tack Coat Application Rates
at different test temperature when setting time is 12 hours
55
4.11 Relationships between Average ILBS and Tack Coat Application Rates
at 250C for the CMS-2 type of tack coat
55
4.12 Relationships between Average ILBS and Tack Coat Application Rates
at 300C for the CMS-2 type of tack coat
56
4.13 Relationships between Average ILBS and Tack Coat Application Rates 57
xi
at 350C for the CMS-2 type of tack coat
4.14 Relationships between Average ILBS and Tack Coat Application Rates
at 400C for the CMS-2 type of tack coat
57
4.15 Relationship between Average ILBS and Application Rates of
bitumen at different test temperature considering 0 hour setting time
59
4.16 Relationship between Average ILBS and Application Rates of
bitumen at different test temperature considering 0.5 hour setting time
60
4.17 Relationship between Average ILBS and Application Rates of
bitumen at different test temperature considering 1 hour setting time
61
4.18 Relationship between Aerage ILBS and Application Rates of bitumen
at 250C test temperature considering all setting time
61
4.19 Relationship between Average ILBS and Application Rates of
bitumen at 300C test temperature considering all setting time
62
4.20 Relationship between Average ILBS and Application Rates of
bitumen at 350C test temperature considering all setting time
63
4.21 Relationship between Average ILBS and Application Rates of
bitumen at 400C test temperature considering all setting time
63
4.22 Relationship between Average ILBS and Duration of Compaction of
overlay at different test temperature with no tack coat used
65
4.23 Relationship between Average ILBS and Tack Coat Application Rates
at different test temperature for the CRS-1 type of tack coat
66
4.24 Relationship between Average ILBS and Tack Coat Application Rates
at different test temperature for the CMS-2 type of tack coat
67
4.25 Relationships between Average ILBS and Application Rates at 250C 68
4.26 Relationships between Average ILBS and Application Rates at 300C 68
4.27 Relationships between Average ILBS and Application Rates at 350C 69
4.28 Relationships between Average ILBS and Application Rates at 400C 69
4.29 Comparisons of ILBS at different test temperature made 70
4.30 Comparisons of ILBS at different test temperature made 71

xiii
Abbreviations
RS - Rapid Setting
MS - Medium Setting
SS - Slow Setting
RC - Rapid Curing
MC - Medium Curing
CRS - Cationic Rapid Setting
CMS - Cationic Medium Setting
CSS - Cationic Slow Setting
HMA - Hot Mix Asphalt
ILBS - Interlayer Bond Strength
DBM - Dense Bituminous Macadam
BC - Bituminous Concrete
BM - Bituminous Macadam
SDBC - Semi Dense Bituminous Concrete
MORT&H - Ministry Of Road Transport and Highways
IS - Indian Standard
ASTM - American Society for Testing and Materials
M - Meter
mm - Millimeter
kN - Kilo newton
cm - Centimeter

xiv
in - Inch
MTS - Material Testing System
psi - Pound-force per square inch
AC - Asphalt Cement
PG - Performance Graded
PCC - Portland Cement Concrete
gal - Gallon
yd - Yard
Kg - Kilogram
g - Gram
Sec - Second
kPa - Kilopascal
R - Radius

1
Chapter I
Introduction
General
Failures arise due to inadequate bond
Background of Tack coat
Objectives
Organizations of Thesis
Chapter I Introduction
2
1.1 General
Highways are considered to be the backbone of a country’s growth and development. All
developed as well as developing countries normally have a continuous program of sustaining and
building road infrastructures or developing the existing road. To improve the existing road
infrastructure in view of increased traffic is to strengthen the existing pavement layer by
overlaying with another layer of appropriate material composition and thickness. The flexible
pavement is generally designed and constructed in several layers for effective stress distribution
across the pavement layers under the varying heavy traffic loads. The viscous nature of
the flexible pavement, allows its different layers to sustain significant plastic deformation,
although distresses due to repeated heavy loading over time which is the most common failure
mechanism. The flexible pavement works as a single structure due to good bonding between the
different layers interface of it. It is generally believed that, the pavement stress distribution is
extremely influenced by the adhesion conditions at the layer interface. Poor adhesion at layer
interface may cause adverse effects on the structural strength of the pavement system and form
numbers of premature failures. To increase bonding between layers, bituminous tack coats are
applied prior to overlay. Bituminous emulsions are normally used as tack coats. In spite of their
extensive application, the thoughts among pavement engineers differ regarding the effectiveness
of tack coat in enhancing the adhesion between the two layers. This tack coat also made of a thin
layer of bitumen residue and its objective is to provide adequate adherence between the layers. If
the quantity of bituminous emulsions used is in excess or less than the required one, the interface
bonding will not be satisfactory.

Chapter I Introduction
3
1.2 Failures arise due to inadequate bond
A Number of premature pavement failures can be attributed due to loss of bond between two
layers of hot mix asphalt (HMA). It has been generally observed that poor adhesion between
pavement layers contributes to major pavement overlay distresses and numbers of premature
failures. Such are Slippage failure and Surface layer Delamination.
Slippage failure grows when the pavement layers begin to slide on one another and generally the
top layer separating from the lower layer. This type of failure develops due to lack of bond
between two top important pavement layers and it’s mainly seen at high horizontal force at
points where traffic is accelerating or decelerating, such as at traffic signals and within horizontal
curves.
Figure 1.1 Slippage failure [www.pavementinteractive.org]
Delamination is a section of a surface layer that has come loose from the pavement. The causes
of this type of failure are slippage between layers and poor interlayer bond between the
pavement layers. Other pavement problems that have been linked to poorer bond strength
between pavement layers shape of a crescent are shown in figure.

Chapter I Introduction
4
Figure 1.2 Surface layer Delamination [www.roadscience.net]
1.3 Background of Tack coat
The word tack relates to a sort of stickiness. The coat is a small thickness of layer. So tack coat is
a light application of a bituminous emulsion between pavement layers, most probably applied in
a thin layer between an existing and a newly constructed bituminous surface. The importance of
glue or sticky material like tack coat is to provide appropriate adhesive interlock between paving
layers so that they react as a monolithic structure. Emulsified bitumen is a mixture of bituminous
binder, water and emulsifying agent. The emulsifying agent might be soap, dust or colloidal
clays. The structural view as reported by Roberts et al. (1996) is shown in figure1.3. Bituminous
particles are kept in suspension in the water by the emulsifying agent and thus bitumen
consistency is reduced at ambient temperature from a semi-solid to an applicable liquid form. So
this liquefied bitumen is easier to distribute over a surface at ambient temperatures. When this
liquid bitumen is applied to a clean bitumen surface, the water evaporates from the emulsion and
leaving behind a thin layer of residual bituminous on the pavement surface.
Usually, hot bituminous binder, cutback bitumen or bituminous emulsions are used as tack coat
materials for construction purpose. The use of bituminous emulsions as a tack coat material is
escalating instead of cutback asphalt or hot bituminous binder. It can be applied at lower

Chapter I Introduction
5
application temperatures compared to cutback bitumen or hot bituminous binder so it is easy to
handle in field condition. Emulsified bitumen do not contain any harmful volatile chemicals
comparatively pollution free and an environmentally friendly.
Figure 1.3 Composition of Bituminous Emulsion [Roberts et. al. 1996]
The type of emulsifying agent used in the bituminous emulsion would determine whether the
emulsion anionic, or cationic. Cationic emulsions have bituminous droplets which carry a
positive charge and anionic having negatively charged bituminous droplets. Also emulsified
bitumen is graded as per their setting rate, which indicates how quickly the water evaporates
from the emulsion such are rapid setting (RS), medium setting (MS), and slow setting (SS). The
main difference between anionic and cationic emulsions is that the cationic emulsion evaporates
water faster than the anionic emulsion. The anionic grades are RS-1, RS-2, MS-1, MS-2, MS-2h,
SS-1 and SS-1h. The cationic grades named as CRS-1, CRS-2, CMS-2, CMS-2h, CSS-1, and
CSS-1h. The absence of letter “C” in an emulsion denotes an anionic one and vice-versa. The
letter “h” stands for hard grade bitumen binder (low penetration) and the numbers “1” and “2”
indicates low and high viscosity respectively (Patel, 2010).

Chapter I Introduction
6
Cutback bitumen is also liquid bitumen produced by adding petroleum solvents like gasoline and
kerosene to bituminous binder. The use of cutback bitumen as a tack coat material has declined
rapidly over the years due to environmental anxieties and the health risk due to gas evaporate
into the atmosphere from solvents. It is divided into two groupings, Rapid Curing (RC) and
Medium Curing (MC) based on the type of solvent used. Rapid curing cutback uses solvent
gasoline while medium curing cutback uses kerosene. Hot bituminous binders are obtained from
the distillation of crude oil also used as tack coat. Unlike emulsions, bituminous binder particles
do not carry any charge. Any grade of bituminous binder is acceptable as a tack coat material,
even if it is generally preferable to use the same grade of bituminous binder used in the HMA for
tack coat (CPB 03-1, Tack Coat Guidelines, 2003 ).
1.4 Objectives
Based on the discussions as mentioned above, the objectives of the present study have been
identified as follows
Fabrication of a simple testing arrangement to be used in a conventional Modified
Marshall test apparatus to determine directly the interlayer bond strength between two
layers.
Experimentation using the fabricated device in respect of various material combinations.
Preparation of samples under varying conditions, such are temperature, percentage of
emulsions, with no tack coat use, by using bitumen as tack coat and setting time.

Chapter I Introduction
7
1.5 Organizations of the Thesis
The thesis has been presented as per following chapters.
(i) Chapter-I, general information about the interface bond strength between
bituminous paving layers and objectives of the present studies is described.
(ii) Chapter-II, a brief review of the recent past studies carried out in laboratories
to evaluation of the bond strength.
(iii) Chapter-III, described the experimental methodology carried out in this study
for observing the interlayer bond strength between bituminous paving layers.
(iv) Chapter-IV, analyzed the results and discussion about the experimental
investigations.
(v) Finally in Chapter-V a summary of the present study and the major
conclusions are explained here with recommendation for future work.

8
Chapter II
Review of Literature
Introduction
Past Studies on Evaluation of Pavement Interlayer Bond Strength
Factors affecting the interlayer bond strength of pavement
Critical Review

Chapter II Review of Literature
9
2.1 Introduction
This chapter focused on an extensive literature review on some field and laboratory studies that
were conducted in the recent past to observe the pavement interlayer bond strength. It also
elaborates on the various factors that affect pavement interlayer bond strength.
2.2 Past Studies on Evaluation of Pavement Interlayer Bond Strength
Bituminous pavements are generally constructed in several layers and proper bonding between
adjacent layers is required to ensure good performance. But, this is not always achieved and a
number of premature pavement failures have been developed due to poor bonding condition. The
interface bond failure paving layers is due to mainly shear force only. In the recent past,
interlayer shear performance has been broadly investigated. These studies have typically
developed a unique test method or instrument for analysis of the interface bond strength. Various
organizations and numbers of researchers have used various test methods for observing the
pavement interlayer bond strength performance.
Uzan et al. (1978) used a direct shear test device to test with a 60-70 penetration asphalt
binder as a tack coat at five different application rates. The tests were conducted in two different
temperature 77 and 1310F (25 and 550C). The tack coat was applied on the bottom layer and 3cm
(1.8inch) of mix compacted on top. The direct shear device was developed considering the
specimen size with a constant displacement rate of 2.5 mm/min (0.098 in/min). The shear
strength was evaluated at five different normal loading pressures of 0.05, 0.5, 1.0, 2.5 and 5
Kg/cm2. The shear strength increased when the test temperature decreases and the normal

Chapter II Review of Literature
10
pressure increases. The observed optimum tack coat application rate for this studied was 1.0
Kg/m2 at 250C.
In Delft University of Technology Molenaar et al. (1986) used a shear test device to
determine the shear resistance of the tack coat at the interface of the asphalt layers. The device
was mounted on a standard Marshall Stability loading press for applied a load at a rate of 0.85
mm/Sec. This device held bottom part of the compacted cylindrical specimens and shear load
was applied perpendicular to the axis of the specimens of the top layer.
In Canada, Mrawira and Damude (1999) observed the bond strength of the interface by
direct shear test. The specimens were collected as field cores from in-service pavements. Cores
were assembled in six subsets varying with pavement age. All specimens were the same type of
mix and the same type of materials used. The cores were trimmed to a height of 8cm (3.15 inch)
and at the top surface of the layer 0.2 to 0.3 L/m2 of SS1 emulsion was applied with set times left
less than one hour. When the tack coat cured, 16mm nominal maximum aggregate size
compacted on the core in two lifts with 75 Marshall blows per lift as a overlays. The specimen
were left to cure for two weeks at room temperature, then cut into rectangular size and placed in
a water bath at 220C (750F) for thirty minutes. The specimens were sheared on a guillotine style
machine at a constant displacement rate of 1 mm/min.
Mohammad et al. (2002) evaluated the bond strength of tack coat used in the interface of
the bituminous paving layers by using the Superpave shear tester shown in figure 2.2, which
consists of a shear box set up for 150 mm (6 inch) diameter specimens. The specimens were
compacted up to 50 mm and tack coat applied in five different application rates (0.0 to 0.9 L/m2),
the samples were allowed to cure and second lift is placed on top and compacted. The tack coat

Chapter II Review of Literature
11
bond strength evaluated with two PG asphalt binders (PG 64-2P and PG 76-22M) and four
emulsified asphalts (CRS-2P, CSS-1, SS-1 and SS-1h). The test was conducted on two test
temperatures 25 and 550C (77 and 1310F). They observed CRS-2P emulsion as the best
performer and 250C (770F) test temperature gives five times more shear strength then 550C
(1310C).
(a) Shear box in SST (b) Shear Box with Prepared Sample
Figure 2.1 Superpave Shear Tester (Mohammad et al. 2002)
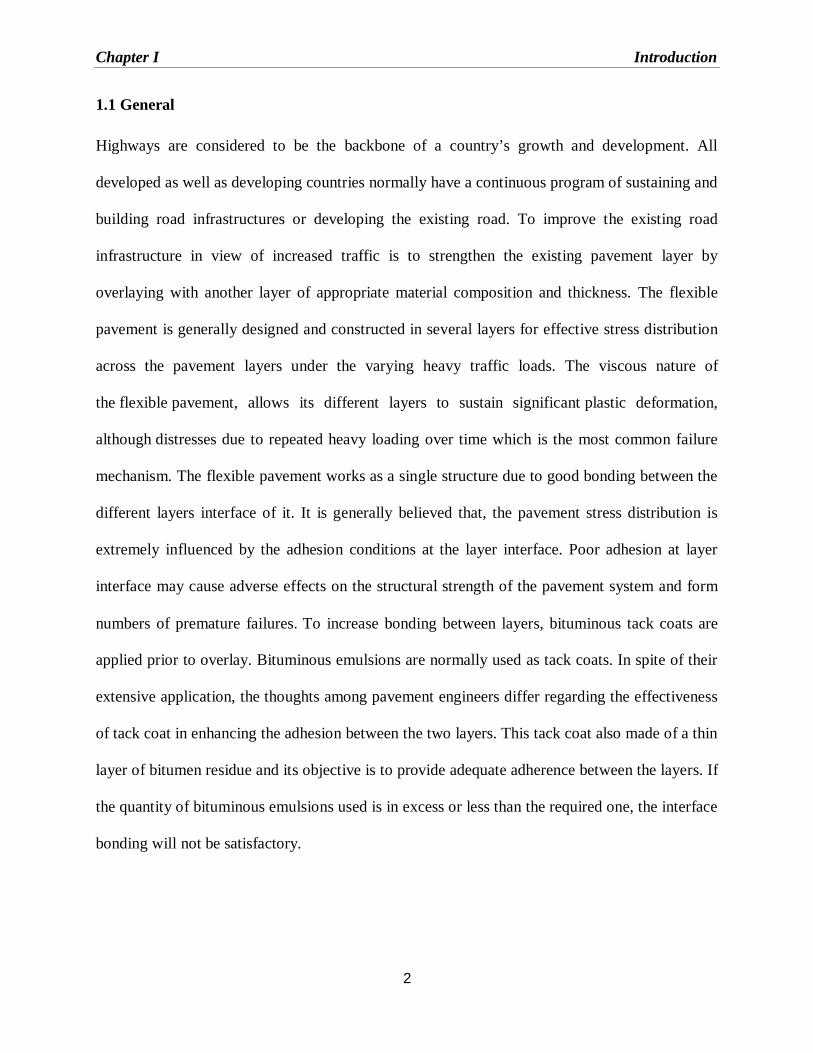
The Leuter shear strength test device was modified by Sangiorgi et al. (2002) in Germany
for evaluating the interlayer bond strength based on a simple means of undertaking the direct
shear test. The device was mounted on Marshall and CBR loading press. The specimens were
used for test having 150 mm diameter, may be field cores or laboratories fabricated. The load
was transferred to the specimen at a constant displacement rate of 50 mm/min with maintaining a
temperature of 200C. A gap of 4.8mm provided between the shearing planes to minimize the
friction. This testing device is standard in Austria, has also been adopted in the UK. Three
Chapter II Review of Literature
12
different interfaces treatments were considered to simulate actual conditions: (i) with tack coat
emulsion, (ii) contaminated by dirt and without tack coat emulsion, and (iii) with tack coat
emulsion and a thin film of dirt. The results observed that the best interface bond strength was
attained with an interface treatment prepared using an emulsified tack coat, while the poorest
bond conditions were observed on a dirty surface without emulsion.
Figure 2.2 Leutner Shear Strength Tester (Sangiorgi et al., 2002)
Sholar et al. (2002) was developed a simple direct shear test device to measure the shear
strength of field cores at their interface. The test was performed at 25oC (77oF), with a constant
rate of loading 50.8 mm/min (2in/min). The field cores were obtained from test sections with no
tack, and with 0.091, 0.266 and 0.362 l/m2 (0.02, 0.06, 0.08gal/yd2) tack coat application rate.

Chapter II Review of Literature
13
Figure 2.3 Simple Shear Test Device (Sholar et al., 2002)
The Layer-Parallel Direct Shear test device was an EMPA (Swiss Federal Laboratories
for Materials Testing and Research) modified version of the device developed by Leutner (1979)
in Germany. Raab and Partl (2004) were modified it and one part of the 150 mm diameter
cylindrical specimen placed on a circular u-bearing and held with a well-defined clamp. The
other part was suspended to allow for transferring the shear force, induced by a semicircular
shear yoke with a constant deformation rate of 50.8 mm/min. This modified device was easily
fitted to an ordinary servo-hydraulic Marshall testing machine or any standard universal testing
machine. The tests were conducted at a temperature of 200C by keeping the specimens in a
climate chamber for 8 hours. The shear strength of the interface was evaluated by using the
following equation.
휏 = = (2.1)
Where 휏= Maximum shear strength
A = Cross sectional area of specimen.
d = Diameter of the specimen
Fmax= Maximum load

Chapter II Review of Literature
14
Figure 2.4 Schematic view of the LPDS (Layer-Parallel Direct Shear) test device with pneumatic clamping (Raab and Partl, 2004)
Swiss Federal Laboratories for Materials Testing and Research was developed a testing
device for evaluating the bond strength of the HMA layers interface called Swiss LPDS Tester.
The tests on this device was conducted on 150mm (6 inch) diameter field cores or laboratories
fabricated samples with a constant loading rate of 50.8 mm/min (2 in/min). The minimum shear
force required 15 kN for the bond between thin surface layers and the binder course.

Chapter II Review of Literature
15
Figure 2.5 Swiss LPDS Tester (Buchanan and Woods 2004 )
Florida Department of Transportation (FDOT) developed a device for evaluating the
shear bond strength of tack coat at the interface of the asphalt layers. This shear tester was an
attachment device which can be used in a universal testing machine or a Marshall Press. The
specimens used for FDOT shear tester device having 150 mm diameter compacted in two
composite layers or field core samples. Before performing the test, the specimens were
conditioned at a temperature of 25±1°C for a minimum of 2 hours. The load application is strain
controlled at a rate of 50.8-mm/min, which can be easily achieved in the Marshall Stability test
apparatus. The specimens were placed inside the two ring attachment and a gap of 4.76 mm was
provided between two rings. The shear strength was calculated by
푆 = (2.2)
Where
SB = shear strength (psi)

Chapter II Review of Literature
16
Pmax = Maximum load applied (lbf)
D = Diameter of specimen (inches)
The observation was involved evaluation of several variables which affect the tack coat bonding
strength such as application rate, surface condition, surface texture, and mixture type of field
core specimens. The specimens were prepared by applying 0.0, 0.02, 0.05 and 0.08gal/yd.2 (0.00,
0.091, 0.226 and 0.362 L/m2) as tack coat application rates. Based on their investigations, an
application rate of 0.05 gal/yd.2 (0.266 l/m2) was found to an optimum rate of application where
the bond strength maximum. Also significant reduction of shear strengths was observed due to
the presence of moisture at the interface. The shear strengths for fine graded mixtures were
significantly lower as compared to coarse graded mixtures.
Figure 2.6 FDOT Shear Tester Device inside an MTS (Sutradhar, B. B., 2012 )

Chapter II Review of Literature
17
In Italy Univarsita Politecnica Delle Marche Santagata et al. (1993) designed the ASTRA
(Ancona Shear Testing research and Analysis apparatus) for observing the interlayer bond shear
strength of bituminous paving layers. The system consist of a direct shear box to hold the
cylindrical specimens of 100 mm diameter placed in two independent half-box and mounted on a
movable table. A horizontal load is applied along the interface of double-layered specimens at a
constant displacement rate of 2.5 mm/min until failure; in the meantime, a constant normal load
is applied on top of the specimen as shown in figure. During the test process, the shear force,
vertical displacement and the horizontal displacement were recorded. The study was conducted
to observe the influence of tack coat type, temperature, and applied normal load, on the interlayer
shear resistance. The study was concluded that the interface shear strength increased with an
increase in normal stress for a given temperature and shear strength was found to increase with a
decrease in temperature for a given normal stress. The square cross section of 100×100mm
specimens was also tested on ASTRA.
Figure 2.7 Schematic view of ASTRA device (Santagata et al., 2005)

Chapter II Review of Literature
18
National Center for Asphalt Technology (NCAT) developed a bond strength device was a
shear type test and loading could be performed with a universal testing machine or a Marshall
Press. There were a few modifications were made to the original version of the NCAT test
device for improvement the capability of applying horizontal load as a normal pressure to the test
specimens. The bond strength, SB is calculated based on the maximum load as follows:
SB = (2.3)
Where
SB = bond strength (psi)
Pmax = maximum load applied to the specimen (lbf)
A = cross-sectional area of test specimen (in2)
West et al. (2005) conducted a two-phase observation included both laboratory and field phases
for evaluating the bond strength between pavement layers. In the laboratory one, the following
conditions were observed: two types of emulsion (CRS-2 and CSS-1) and a PG 64-22 asphalt
binder; three residual application rates (0.02, 0.05, and 0.08 gal/yd2) and two mix types [19 mm
nominal maximum aggregate size (NMAS) coarse-graded and 4.75 mm NMAS fine-graded].
Interface bond strengths were evaluated using normal Superpave mix design specimens at three
temperatures (10, 25, and 60°C) and three normal pressure levels (0, 10, and 20 psi). The main
observations drawn from the laboratory study were as the temperature increased; bond strength
decreased significantly for all tack coat types, application rates, and mixture types at all normal
pressure levels. PG 64-22 exhibited higher bond strength as compared to the two emulsions,

Chapter II Review of Literature
19
especially for the fine-graded mixture tested at high temperature. For the application rates
observation, tack coats with low application rates generally provided high bond strength for the
fine-graded mixture; however, for the coarse graded mixture, bond strength did not change much
when application rate varied.
In the second phase, seven field observations were performed to evaluate the bond strength test
with considering the same tack coat material used in phase one. Tack coat was sprayed on milled
or un-milled pavement surface before the HMA overlay was placed and compacted. For the
study using an emulsified asphalt tack coat material, the residual application rates were 0.03,
0.045, and 0.06 gal/yd2 (0.15, 0.23 and 0.30 L/m2). The tack coats were applied by three
methods; hand wand sprayer, distributor truck spray bar and Novachip spreader. The main
observations of the field study were milled HMA surfaces appeared to significantly enhance
bond strength with a subsequent asphalt pavement layer and bond strengths in sections that used
the Novachip spreader for application of tack coat were significantly higher than the other
application method.

Chapter II Review of Literature
20
Figure 2.8 NCAT Bond Strength Device (West et al., 2005)
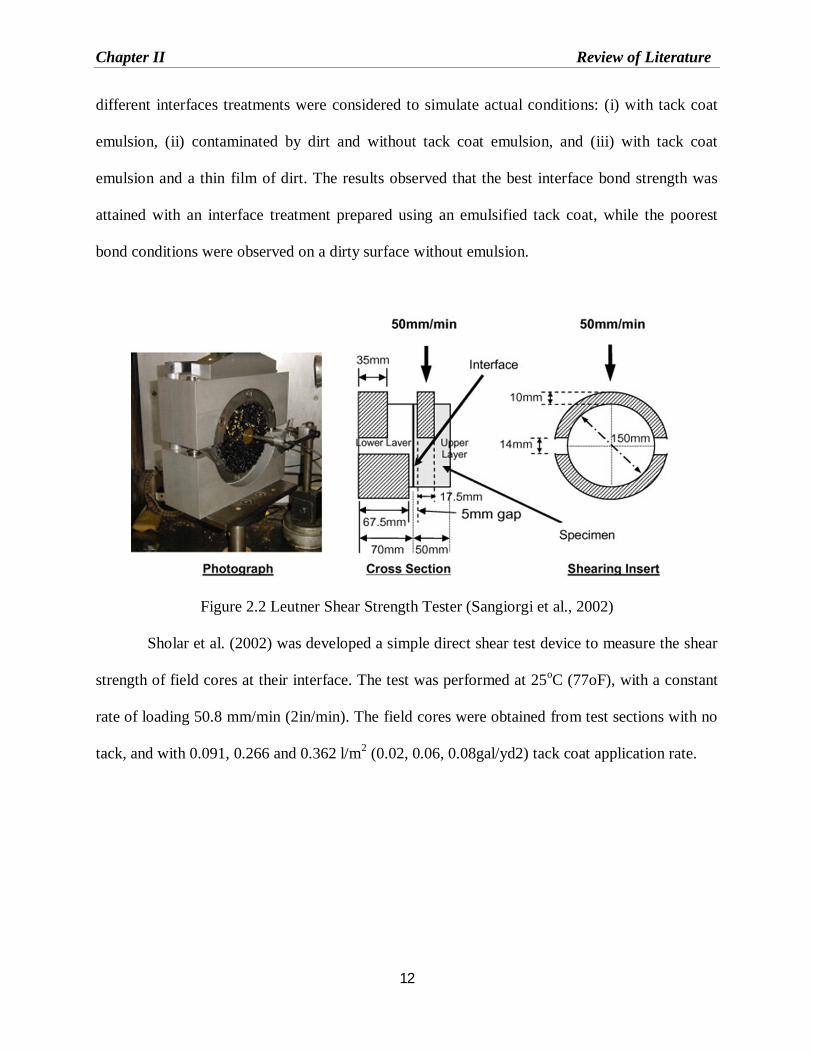
A Modified Torque Bond Tester was a relatively simple test device for evaluating the
interface bond strength of bituminous paving layers was developed by Tashman et.al. (2006).
Originally it was developed in Sweden for in-situ testing of asphalt interfaces. The pavement is
cored deeper than the interface and a metal plate is glued to the top of the core specimen. A
torque is applied to the top of the core until failure of interface because introducing of a twisting
shear failure force at that place. The force/torque required to failure would indicate the strength
of tack coat. The bond strength of the cored specimen is calculated using the following equation.
휏 = 12푀푥106
휋퐷3 (2.4)
Where
휏= Interface bond strength (kpa)
M= Maximum torque required to failure (N-m)
Chapter II Review of Literature
21
D= Diameter of the core (mm)
Figure 2.9 Torque Bond Tester with procedure (Tashman et al. 2006)
Miro et al. (2006) developed a device named as Laboratorio de Caminos de Barcelona
(LCB) in the Road Research Laboratory of the Departament of Transportation of the Technical
University of Catalonia. It was intended to measure the tangential stress resistance of tack coat.
A cylindrical mould of 177.8mm height and 101.6mm internal diameter was used for LCB test.
The asphalt layer was compacted about 100 or 110mm as first layer by using Marshall
Compactor applying 100 compaction blows and allowed to be cool. On the upper of the
specimen, tack coat was applied and the second layer was compacted. The test was conducted by
placing the mould with the specimen horizontally over a base prepared with two supports
200mm apart. The cylindrical specimen is considered as a beam located over two supports such
that the bonded interface is very close to one of the supports in order to avoid the formation of
bending stress and the specimen fails due to shear stress only. The one part of the mould was
resting on one support and upper layer of the specimen rests on other support proved a 5 mm gap
to interface from mould top edge and supports shown in figure. The loading piston was placed

Chapter II Review of Literature
22
over the mould, 100mm apart from the two supports by applying a constant deformation rate of
1.27mm/min. The load-deflection data were recorded by using a suitable data acquisition system.
휏 =( )
(2.5)
Where
τ = Shear strength
P = Maximum failure load
S = Cross section of specimen
Figure 2.10 Schematic and actual view of LCB shear test (Miro et al., 2006)
Wheat M. (2007), in Kansas State University was developed a testing apparatus to
investigate the influence of shear stress in different planes of the tack coat interface. The device
consist of two supports, one hold the bottom part of the specimen and other one take
responsibility for holding the top portion of the specimen. The test was performed under a
sinusoidal loading at six different frequencies (25, 10, 5, 1, 0.5 and 0.1 Hz). The deflection
between the two layers of specimens measured by two LVDTs which were connected to a
suitable data acquisition system.

Chapter II Review of Literature
23
Figure 2.11 KSU shear tester (Wheat M., 2007)
In 2009, the Pennsylvania Department of Transportation fabricated a modified Marshall
jig which consists of two hollow cylinders aligned horizontally from which one of the cylinders
was fixed at the bottom of a base plate of the machine, while another one move vertically with
minimal friction along four columns. During the test, a load was applied on a smooth horizontal
strip located at the top of the movable cylinder of the attachment. The direct shear force applied
vertically to the movable cylinder of the attachment. The direct shear force applied vertically to
the movable cylinder at a constant rate of 50.8 mm/min until failure of the specimen. In this test,
the specimen was placed in such a way that shearing of the specimen occurred along the
interface of the two asphalt layers. The applied load and displacement of the moving cylinder
were measured by a load cell and LVDT which were recorded by a data acquisition system.
Tony Kucharek et al. (2011) developed a Modified Marshall stability mould at Mcasphalt
lab. One part of the mould is fixed at its bottom to a base plate, while the other semicircular
sleeve can move vertically with minimum friction along the two guiding rods. A load of constant
deformation at a rate of 50.8 mm/min is applied on a smooth horizontal stripe located on the top
of the shear sleeve adjacent to the interface as shown in figure. This laboratory study was
conducted on double-layered specimens prepared using 16 emulsions applied at 0.05, 0.1 and

Chapter II Review of Literature
24
0.15 Kg/m2 to evaluate the influence of substrate characteristics . The study concluded that the
rougher substrate revealed higher shear strength compared to the smooth surface.
Figure 2.12 Shear-Testing device developed at McAsphalt Lab (Sutradhar, B. B., 2012 )
2.3 Factors affecting the interlayer bond strength of pavement
Bituminous pavement structures are built in several layers with a certain degree of bonding at the
interface, which is affected by different factors which could be either material related, or
construction related. Existing literature clearly discloses the important factors which affecting
the interlayer bond strength of the pavement layers including rate of displacement, tack coat
type, tack coat application rate, testing temperature, normal pressure acts at the interface and
setting time of it.
2.3.1 Influence of rate of displacement
The samples were tested at greater displacement/strain rates require a greater load to fail the joint
of two layers because of the viscoelastic nature of a bituminous binder. Sholar et al. (2004)

Chapter II Review of Literature
25
concluded from the experiments that the core samples which tested an at a greater displacement
rate exhibited a higher average failure shear strength (60 psi) compared to the samples tested at
0.75 in/min (38 psi).
2.3.2 Influence of tack coat type
Review of the above literature clearly specifies the use of hot bituminous binder, cutback
bitumen or bituminous emulsions as tack coat materials. But now a day bitumen emulsion is
most widely used as the tack coat material all over the world. Emulsified bitumen (bituminous
emulsion) is a mixture of bituminous binder, water and emulsifying agent. The emulsifying agent
can be soap, dust or colloidal clays.
The type of emulsifying agent used in the asphalt emulsion will determine whether the emulsion
will be anionic or cationic. If the emulsifying agent is anionic, the asphalt droplet bears a
negative charge. On the other hand, for a cationic emulsion, the asphalt droplet bears a positive
charge. According to the Unified Facilities Guide Specification (UFGS) 02744N, the advantage
of the slow-setting grades over the rapid-setting grades is that they can be diluted. Diluted
emulsions are reported to give better results because of the following reasons
i. Diluted emulsion provides the extra volume required for the tack coat distributor to
function at normal speed especially at lower application rates.
ii. Diluted emulsion allows for a more uniform application as it flows easily from the
distributor at ambient temperatures. However, for a longer setting period of slow setting
emulsions compared to rapid setting emulsions, it is not desirable to use slow setting
emulsions as a tack coat in relatively cool weather, at night, or when there is a narrow
construction window.

Chapter II Review of Literature
26
The International Bitumen Emulsion Federation (IBEF, 1999) conducted a world-wide survey of
the use of tack coats. The survey reported that cationic emulsions are the most common tack coat
material, with some use of anionic emulsions.
Paul and Scherocman (1998) in the United States, made a survey on use of tack coat and
gather information that the most common among them are SS-1, SS-1h, CSS-1, and CSS-1h.
Some states like California, Florida, and Vermont used the rapid setting type of emulsions such
as RS-1 and RS-2. Florida and Georgia were the only states those used paving grade asphalts
(AC-5, AC-20, and AC-30) as tack coats at the time of the survey.
2.3.3 Influence of tack coat application rate
The tack coat application rate refers to the quantity of tack coat material applied per unit surface
area. An excessive tack coat may promote to slippage at the interface while too little may result
in de-bonding problems between two bituminous paving layers. Therefore, it is important to
estimate the optimum amount of tack coat that will produce the best performance in the bonding
at the joint. To achieve a proper interface bond, pavement surfaces with different conditions
(e.g., new, old, or milled) requires different tack coat application rates. Normally, a slow - setting
grade of emulsions required higher application rates than a rapid-setting grade of emulsions, and
rapid-setting grade emulsions required higher application rates than paving grade bituminous
binders. Besides, that dense and gap-graded HMA overlay requires less tack coat as compares to
open-graded overlays.
An international survey, conducted by the International Bitumen Emulsion Federation
(1999) indicated that the residual bitumen content varied from 0.026 to 0.089gal/yd2 for tack
coats applied over conventional bituminous surfaces.

Chapter II Review of Literature
27
In the United States, a survey conducted by Paul and Scherocman (1998), reported that
the residual application rates of the emulsions varied between 0.01 and 0.06 gal/yd2, depending
on the type of surface for application. The residual bitumen contents, as specified in The Hot-
Mix Asphalt Paving Handbook (1989) should range from 0.04 to 0.06 gal/yd2. As compare to
open-textured surfaces, the requirement of tack coat is less for tight or dense graded surfaces.
Also bleeding or flushed surfaces require less tack coat than surfaces that are dry and aged. The
requirement of residual asphalt is even more for a milled surface because of the increased
specific surface area, up to 0.08gal/yd2. The requirement is only half as much residual asphalt
typically for new HMA layers, 0.02gal/yd2.
Mohammad et al. (2002) recommended an optimum residual rate of 0.02gal/yd2 by
conducting an experiment over interface of the two bituminous layers using the Simple Shear
Test on one type of HMA pavement.
As per the section “Proper Tack Coat Application (2001)” of the Technical Bulletin published by
the Flexible Pavements of Ohio, the recommended typical tack coat application rates for various
pavement types using a slow-setting asphalt emulsions (SS1, SS1-h) are shown in Table 2.1.
Table 2.1 Recommended tack coat application rates in Ohio
Pavement Condition Application Rate (gal/yd2)
Residual Undiluted Diluted (1:1)
New HMA 0.03-0.04 0.05-0.07 0.10-0.13
Oxidized HMA 0.04-0.06 0.07-0.10 0.13-0.20
Milled Surface (HMA) 0.06-0.08 0.10-0.13 0.20-0.27
Milled Surface (PCC) 0.06-0.08 0.10-0.13 0.20-0.27
Portland Cement Concrete 0.04-0.06 0.07-0.10 0.13-0.20

Chapter II Review of Literature
28
According to the tack coat guidelines of the Construction Procedure Bulletin (2003) of the
California Department of Transportation, the recommended application rates for different types
of tack coats and pavement conditions, which are used in the state of California as shown in
Table 2.2
Table 2.2 Recommended Tack Coat Application Rates Used in California
Type of Overlay Type of Surface Slow Setting
(gal/yd2)
Rapid Setting
(gal/yd2)
Paving Asphalt
(gal/yd2)
HMA
Dense, Tight Surface (e.g., Between lifts)
0.044-0.077 0.022-0.044 0.011-0.022
Open Textured or Dry, Aged Surface
(e.g., Milled surface)
0.077-0.199 0.044-0.088 0.022-0.055
Open Graded
HMA
Dense, Tight Surface (e.g., Between lifts)
0.055-0.110 0.022-0.055 0.011-0.033
Open Textured or Dry, Aged Surface
(e.g., Milled surface)
0.110-0.243 0.055-0.121 0.033-0.066
2.3.4 Influence of testing temperature
It was observed from the review of the laboratory studies conducted by various Researchers and
Highway agencies that the testing temperature had given the most significant impact on the bond
strength. As test temperature increases interlayer bond strength decreases due to reduced
stiffness of tack coat material. The study conducted by West et al. (2005), reported that, the

Chapter II Review of Literature
29
average bond strength values were 2.3 times greater at 10º C compared to 25º C; while the
average bond strength values were 1/6 times lesser at 60º C compared to 25º C.
2.3.5 Influence of normal pressure
Numbers of laboratory studies were conducted by varied the normal pressure application to
samples; all concluded that as normal pressure increases interlayer bond strength increases
especially at higher temperature. At higher temperatures, the effect of internal friction on bond
strengths were more than the tack coat materials and application rates, and the internal friction is
dependent on normal load and surface texture of the layers. At intermediate and low
temperatures, bond strength was not very sensitive to the normal pressure levels.
2.3.6 Influence of tack coat curing time
When water separates from the emulsion due to evaporation and the color of the tack coat begins
to change from brown to black, the tack coat is set to break. Normally the color of bituminous
emulsions is brown. When water evaporates from it, it becomes deep black. Moreover, when the
water has completely separated from the emulsion, what remains behind is a thin film of bitumen
binder on the pavement surface.
Paul and Scherocman (1998) obserced from their survey of state DOTs on tack coat
practices that curing period between tack coat application and overlay paving was generally after
the emulsions had broken. The majority of the states had no specifications on maximum setting
time. Some of the states had a minimum setting time criteria which varies from 15 minutes to
some hour depending upon the tack coat type.

Chapter II Review of Literature
30
2.4 Critical Reviews
Several organizations and several researchers were reported in the preceding paragraphs had
developed and studied on various devices with various testing methodologies and evaluated the
bond strengths of the interlayer of the bituminous pavement. Tack coats should be applied in an
optimum quantity in a thin layer and should uniformly cover the entire surface of application
area. Too little amount of tack coat would be as good as no tack coat and would fail to provide a
sound interface bond. On the other hand, excess tack coat can cause slippage failure. The
application rate must be selected based on the texture of the surface receiving the tack coat.

31
Chapter III
Experimental Methodology
Introduction
Methodology
Materials Used
Preparation of Samples
Fabrication of simple attachment to measure the Interlayer Bond Strength

Chapter III Experimental Methodology
32
3.1 Introduction
This chapter describes the experimental works carried out for this study of interlayer bond
strength between two bituminous paving layers. This chapter has been divided into two parts.
First part discusses the collection of materials which are used for preparing the composite
cylindrical specimens (aggregates, bitumen, and emulsions) and second part described by the
testing of the specimens by using a fabricated simple attachment which has been easily mounted
on Modified Marshall Apparatus. For the study two different types of bituminous layer
specimens were prepared with 100 mm total height and 101 mm in diameter. The specimens
were prepared with varying different types of tack coat, bitumen as a tack coat also without using
any tack coat. This investigation also observed dissimilarities in bond strength due to variations
in their setting time and duration of compaction between two layers.
3.2 Methodology
The experimental methodology adopted in the study consisted of evaluating the maximum
interlayer bond strength of the two types of bituminous layer combinations (DBM/BC and
BM/SDBC). In this experimental method, the specimens were subjected to direct shear force
applied at a constant rate of displacement of 50.8 mm/min until the failure of the specimens. A
customized simple device referred to the modified Marshall test apparatus was fabricated for the
testing of the double layer composite bituminous samples for evaluation of interlayer bond
strength. The methodology adopted for this project is shown in figure 3.1.

Chapter III Experimental Methodology
33
Figure 3.1 Methodology of the experimental work

Chapter III Experimental Methodology
34
3.3 Materials Used
3.3.1 Aggregates
This laboratory case study consists of two types bituminous layer of cylindrical specimens. One
has been prepared with composite of, lower layer as dense bituminous macadam (DBM) and
upper one bituminous concrete (BC). Another type has been prepared with bituminous macadam
(BM) as a base course (lower layer) with semi dense bituminous concrete (SDBC) as an overlay.
For preparing two bituminous composed layers aggregates were graded as per Ministry of Road
Transport and Highways (2001) given in Table 3.1, Table 3.2, Table 3.3 and Table.3.4
respectively. The DBM and BM mixes, which use relatively larger size aggregate, are not only
stiff or stable but also are economical because they use relatively lower bitumen contents and
need less breaking and crushing energy or effort. BC and SDBC mix with smaller aggregate in
the other way having relatively higher bitumen contents, which not only impart high flexibility
but also increase their durability. The aggregates shall be clean, hard, durable, cubical shape, free
from dust and friable matter, organic or other deleterious matter. The coarse aggregates are
crushed gravel hard material must be retained on 4.75 mm sieve and fine aggregates must be
passed in 4.75 mm sieve and retained on a 75 micron sieve. MORT&H recommended 25 mm
nominal maximum aggregate size (NMAS) for DBM Base Course and 13 mm NMAS for BC
Binder Course. It also recommended 19 mm NMAS for BM base course and 13 mm NMAS for
SDBC course. The specific gravity of aggregates used for preparing the specimens in the
laboratory has been found 2.80. The physical properties of the aggregates which found in
laboratory were given in below table 3.5 .

Chapter III Experimental Methodology
35
3.3.2 Filler
Portland slag cement (Grade 43) collected from local market passing 0.075 mm IS sieve was
used as filler material to increase the binding property between the aggregates in the preparation
of specimens. Its specific gravity has been found in laboratory 3.0.
Table 3.1 MORTH gradation for DBM (NMAS 25mm)
BIS Sieve (mm)
Percent Passing
Specification Grading Grading adopted
37.5 100 -
26.5 90-100 95
19.0 71-95 83
13.2 56-80 68
4.75 38-54 46
2.36 28-42 35
0.300 7-21 14
0.075 2-8 4
Binder Content % by weight Min. 4.5 5

Chapter III Experimental Methodology
36
Table 3.2 MORTH gradation for BC (NMAS 13 mm)
BIS Sieve (mm) Percent Passing
Specification Grading Grading adopted
19.0 100 -
13.2 79-100 89.5
9.5 70-88 79
4.75 53-71 62
2.36 42-58 50
1.18 34-48 41
0.600 26-38 32
0.300 18-28 23
0.150 12-20 16
0.075 4-10 7
Binder Content % by weight 5-7 7

Chapter III Experimental Methodology
37
Table: 3.3 MORTH gradations for BM (NMAS 19 mm)
BIS Sieve (mm) Percent Passing
Specification Grading Grading adopted
26.5 100 -
19.0 90-100 95
13.2 56-88 72
4.75 16-36 26
2.36 4-19 11.5
0.300 2-10 6
0.075 0-8 4
Binder Content % by weight 3.3-3.5 3.5
Table: 3.4 MORTH gradations for SDBC (NMAS 13 mm)
BIS Sieve (mm) Percent Passing
Specification Grading Grading adopted
19.0 100 -
13.2 90-100 95
9.5 70-90 80
4.75 35-51 43
2.36 24-39 31.5
1.18 15-30 22.5
0.300 9-19 14
0.075 3-8 5.5
Binder Content % by weight Min. 4.5 5

Chapter III Experimental Methodology
38
Table 3.5 Physical properties of aggregates
Property Test Method Test Result
Aggregate Impact Value (%) IS: 2386 (Part-IV) 14.28
Aggregate Crushing Value (%) IS: 2386 (Part-IV) 13.02
Los Angeles Abrasion Value (%) IS: 2386 (Part-IV) 18
Flakiness Index (%) IS: 2386 (Part-I)
18.83
Elongation Index (%) 21.50
Specific Gravity IS: 2386 (Part-III) 2.75
Water Absorption (%) IS: 2386 (Part-III) 0.13
3.3.3 Binder
During this investigation VG 30 bitumen collected from local source used as binder for preparing
the specimens. Some common types of tests were performed to determine the important physical
properties of these binders. The physical properties thus obtained are summarized in Table 3.6
(Sutradhar, B. B.. 2012).
3.3.4 Tack Coat
The tack coat materials selected for this study include two emulsions CMS-2 and CRS-1.
Standardized tests were conducted to determine their physical properties as summarized in Table
3.7 (Sutradhar, B. B.. 2012).

Chapter III Experimental Methodology
39
Table 3.6: Physical properties of VG 30 bitumen binder
Property Test Method Test Result
Penetration at 25°C IS : 1203-1978 67.7
Softening Point
(R&B), °C IS : 1205-1978 48.5
Viscosity (Brookfield)
At 160°C, CP ASTM D 4402 200
Table 3.7 Physical properties of Tack Coats
Property Test Method Emulsion Type Test Results
Viscosity by Saybolt Furol
Viscometer, seconds:
At 500 C
ASTM D 6934
CRS-1 37
CMS-2 114
Density in g/cm3 As per Chehab
et al. (2008)
CRS-1 0.986
CMS-2 0.986
Residue by evaporation,
percent ASTM D 244
CRS-1 61.33
CMS-2 67.59
Residue Penetration
250 C/100 g/5 Sec IS : 1203-1978
CRS-1 86.7
CMS-2 106.7
Residue Ductility 270 C cm IS : 1208-1978 CRS-1 100+
CMS-2 79

Chapter III Experimental Methodology
40
3.4 Preparation of Samples
The specimens were prepared to evaluate the interlayer bond strength between the bituminous
paving layers either be made in the laboratories or collect from the field as a core. The
laboratories prepared samples were mixed according to the Marshall procedure specified in
ASTM D1559 and follows MORT&H grading of coarse and fine aggregate for both two types
of composite specimens. The specimens are prepared for evaluation of bond strength having
101 mm diameter and total height of 100 mm with the help of a special fabricated mold. These
samples were compacted into two layers; DBM and BM have 60mm as base course and top layer
as BC and SDBC of 40mm height respectively. In between these two layers a layer of tack coat
has applied. VG-30 binder has used for mixing of the base and surface courses in 0.075mm
passing cement was used as filler to increase the binding property .
The specimens consisted of two layers and the tack coat are applied between them. The study
also carried out with bitumen used as tack coat material and with no tack coat used in between
the two bituminous layers. Graded aggregates were sampled and kept them in an oven at 1600C
for at least two hours before mix with a binder to form a design mix. The lower half of the
specimen called as base course was prepared by compacted the design mix to a required height
of 60 mm giving 75 blows with Marshall Hammer . Once the lower layer compacted by the same
number of blows on both sides; it allowed to cool at room temperature for a few days. Then a
layer of stiky material (tack coat and bitumen) has been applied at one surface of the previously
compacted specimen. The amount of emulsions was calculated multiplying the application rates
with the surface area of the specimen. The rate of application of tack coat was selected as per
MORT&H (2001) specified as given in Table.3.8 .

Chapter III Experimental Methodology
41
Table 3.8 Rate of application of Tack Coat as per MORT&H Specification
Type of Surface Quantity in Kg/m2 area
Normal bituminous surface 0.20 to 0.25
Dry and hungry bituminous surface 0.25 to 0.30
Granular surface treated with primer 0.25 to 0.30
Non bituminous surface -
Granular base (not primed) 0.35 to 0.40
Cement Concrete pavement 0.30 to 0.35
When the specimens have been tacked, they were allowed to cure until setting/breaking
completed in a dust-free environment. The minimum setting period of emulsions is generally
estimated by visual observation. Normally tack coat was brown in color, but when the water
evaporates from it; its color became deep black. This process is called setting of emulsion. After
setting of emulsions, it left a thin layer of bitumen residue which work as a glue between two
layers as result good bond was formed. In the study two types of emulsions have been used,
CRS-1 and CMS-2. CRS means cationic rapid setting and CMS means cationic medium setting
emulsion. Normally rapid setting emulsion set very fast, less than half an hour. When bitumen
used as sticky material in the place of tack coat, application rates consider as per MORTH
specification and setting of its normally varied from half an hour to one hour maximum for
creating a better bonding between two layers.
Once the application and curing of the tack coat was completed on one surface of the lower layer
of specimens, the loose design mix for top layer was placed over it. Total required height for the
samples was deserved by compacted the loose mix with the help of Marshall Hammer applied

Chapter III Experimental Methodology
42
100 numbers of blows. All prepared specimens were allowed to cure at room temperature for a
few days before testing. The specimens prepared without any tack coat, the top layer was
compacted as soon as possible after the lower layer compaction. For observing the variation in
bond strength without using any tack coat some time gap may be maintained between
compaction of two layers.
After a few days of curing at room temperature specimens have been fully prepared for the test.
Before the testing procedure was carried out these specimens were cured in an oven at different
temperature (250, 300, 350 and 400C) for two hours. The specimens were tested on fabricated
bond strength attachment mounted on a modified Marshall test apparatus.
3.5 Fabrication of simple attachment to measure the Interlayer Bond Strength
In the study, the laboratory prepared specimens were tested by using a fabricated attachment
fitted to modified Marshall apparatus. This device was designed based on the shearing apparatus
at McAsphalt Lab (Kucharek,T et. Al., 2011). The device was designed for 101 mm diameter
field core or laboratory prepared samples. The device consisted of two parts for holding the
specimen’s at upper and lower. One was a U-shape for hold the upper part (40 mm) could move
freely with minimum friction along with two guiding rods fixed on the top of the base plate and
another one clamping the lower half of the specimen. The schematic diagrams of the fabricated
Interlayer Bond Strength device has shown in the figure 3.2 and the photographic views shown
in figure 3.3. The vertical load was transferred to the U shape plate for shear the specimens at a
constant rate of 50.8 mm/min (2 in/min).

Chapter III Experimental Methodology
43
Figure 3.2 Schematic diagrams of the fabricated Interlayer Bond Strength device
Figure 3.3 Photographic views of the fabricated Interlayer Bond Strength device
(a) Front view (b) Side view

44
Chapter IV
Results and Discussions
Introduction
Laboratory Test Results
Overall performance of Interlayer Bond Strength
Chapter IV Results and Discussions
45
4.1Introduction
The experimental test was conducted for observing the interface bond strength between two
types of bituminous paving layers carried out in the cylindrical laboratory prepared specimens
having 100 mm diameter and 100 mm total height which was tested on a fabricated attachment
fitted to the Marshall Loading frame. The results were obtained at four different test temperature
250, 300, 350, and 400C with two type tack coat CMS-2 and CRS-1 varying with different
application rate. Also the bond strength was evaluated by using bitumen as a tack coat with
various application rates and without using any tack coat. The CMS-2 type emulsion was
observed considering three setting time 6, 9 and 12 hours and in CRS-1 type 0.5, 1 and 1.5 hours.
The curing time for bitumen used in place of tack coat, before applying the overlay taken as no
curing time, half an hour and one hour. In the study shear strength was evaluated at the interface
between bituminous macadam (BM) and semi dense bituminous concrete (SDBM) type flexible
paving layers considered with CMS-2 and CRS-1 bitumen emulsions.
The interface bond shear strength was calculated by (Sutradhar, B. B., 2012)
IBSS = ౣ౮
(4.1)
Where IBSS: Interface bond shear strength (kPa)
Fmax: Maximum load required to shear the specimens (kN)
A: Cross sectional area of the specimen (m2) = ߨ × Rଶ
R: Radius of the specimens (m)

Chapter IV Results and Discussions
46
4.2 Laboratory Test Results
The results of various tests conducted to evaluate the interlayer bond strength in various types of
combinations are presented below.
4.2.1 Interlayer Bond Strength for Dense Bituminous Macadam (DBM) and Bituminous
Concrete (BC) Combination
4.2.1.1 Variation of ILBS with rate of application for CRS-1 type tack coat at various
setting times
The test results of bond strength with various application rates in case of CRS-I type tack coat
cured at different setting times are presented in the following paragraphs.
In Table 4.1 present the average interlayer bond strength when setting time is 0.5 hours. The
highest bond strength values are observed at application rate of 0.25 Kg/m2 at all test
temperatures for te CRS-1 type of tack coat.
Table 4.1 ILBS of CRS-1 type tack coat (Considering 0.5 hour setting time)
Type of Tack Coat
Application rate (Kg/m2)
Average ILBS at different test temperature (kPa) 250C 300C 350C 400C
CRS-1
0.2 691.37 530.09 411.26 286.90 0.25 716.83 635.35 460.49 323.83
0.3 609.88 511.42 332.31 249.55

Chapter IV Results and Discussions
47
Figure 4.1 Relationship between Average ILBS and Tack Coat Application Rate at different test
temperature when setting time is 0.5 hours for the CRS-1 type of tack coat.
From the figure 4.1 it is observed that the maximum interlayer bond strength was found at a 0.25
Kg/m2 application rate in all test temperatures when the setting time considered as 0.5 hours and
the bond strength was decreased when test temperature and application rate increased.
In Table 4.2 present the average interlayer bond strength when setting time is 1 hour. The highest
bond strength values are observed at application rate of 0.25 Kg/m2 at all test temperatures for
the CRS-1 type of tack coat.
Table 4.2 ILBS of CRS-1 type tack coat (Considering 1 hour setting time)
Type of Tack Coat
Application rate (Kg/m2)
Average ILBS at different test temperature (kPa)
250C 300C 350C 400C
CRS-1 0.2 874.71 556.40 443.51 311.94
0.25 892.96 773.28 543.25 344.20 0.3 805.11 548.76 378.15 293.27
200
300
400
500
600
700
800
0.2 0.25 0.3 0.35
Aver
age
ILBS
(kPa
)
Tack Coat Application Rate (Kg/m²)
25
30
35
40

Chapter IV Results and Discussions
48
Figure 4.2 Relationship between Average ILBS and Tack Coat Application Rate at different test
temperature when setting time is 1 hour for the CRS-1 type of tack coat.
From the figure 4.2 it is observed that the maximum interlayer bond strength was found at a
0.25 Kg/m2 application rate in all test temperatures when the setting time considered as 1 an
hour and the bond strength was decreased when test temperature and application rate increased.
In Table 4.3 present the average interlayer bond strength when setting time is 1.5 hours. The
highest bond strength values are observed at application rate of 0.25 Kg/m2 at all test
temperatures for the CRS-1 type of tack coat.
Table 4.3 ILBS of CRS-1 type tack coat (Considering 1.5 hour setting time)
Type of Tack Coat
Application rate (Kg/m2)
Average ILBS at different test temperature (kPa)
250C 300C 350C 400C
CRS-1
0.2 760.97 535.61 423.99 293.27 0.25 842.88 662.93 499.53 337.41
0.3 748.66 522.88 361.60 287.33
200
300
400
500
600
700
800
900
1000
0.2 0.25 0.3 0.35
Aver
age
ILBS
(kPa
)
Tack Coat Application Rate (Kg/m²)
25
30
35
40

Chapter IV Results and Discussions
49
Figure 4.3 Relationship between Average ILBS and Tack Coat Application Rate at different test
temperature when setting time is 1.5 hours for the CRS-1 type of tack coat.
From the figure 4.3 it has been observed that the maximum interlayer bond strength was found at
a 0.25 Kg/m2 application rate in all test temperatures when the setting time considered as 1.5
hour and bond strength was decreased when test temperature and application rate increased.
4.2.1.2 Comparisons of Average ILBS and Tack Coat Application Rates at different test
temperatures with various setting times of the CRS-1 type of tack coat.
Figure 4.4 Relationships between Average ILBS and Tack Coat Application Rates at 250C for
the CRS-1 type of tack coat.
200
300
400
500
600
700
800
900
0.2 0.25 0.3 0.35
Aver
age
ILBS
(kPa
)
Tack Coat Application Rate (Kg/m²)
25
30
35
40
550
600
650
700
750
800
850
900
0.2 0.25 0.3 0.35
Aver
age
ILBS
(kPa
)
Tack Coat Application Rate (Kg/m²)
0.5 Hr
1 Hr
1.5 Hr

Chapter IV Results and Discussions
50
Figure 4.4 presents the variation in the mean interlayer bond strength with application rates and
variation in setting times obtained for CRS-1 type tack coat applied over a clean DBM surface.
The highest bond strength was observed in setting time of 1 hour as compared to others at test
temperature 250C with an application rate of 0.25 Kg/m2.
Figure 4.5 Relationships between Average ILBS and Tack Coat Application Rates at 300C for
the CRS-1 type of tack coat.
Figure 4.5 presents the variation in the mean interlayer bond strength with application rates and
variation in setting times obtained for CRS-1 type tack coat applied over a clean DBM surface.
The highest bond strength was observed in setting time of 1 hour as compared to others at test
temperature 300C with an application rate of 0.25 Kg/m2.
500
550
600
650
700
750
800
850
0.2 0.25 0.3 0.35
Aver
age
ILBS
(kPa
)
Tack Coat Application Rate (Kg/m²)
0.5 Hr
1 Hr
1.5 Hr

Chapter IV Results and Discussions
51
Figure 4.6 Relationships between Average ILBS and Tack Coat Application Rates at 350C for
the CRS-1 type of tack coat.
Figure 4.6 presents the variation in the mean interlayer bond strength with application rates and
variation in setting times obtained for CRS-1 type tack coat applied over a clean DBM surface.
The highest bond strength was observed in setting time of 1 hour as compared to others at test
temperature 350C with an application rate of 0.25 Kg/m2.
Figure 4.7 Relationships between Average ILBS and Tack Coat Application Rates at 400C for
the CRS-1 type of tack coat.
300
350
400
450
500
550
0.2 0.25 0.3 0.35
Aver
age
ILBS
(kPa
)
Tack Coat Application Rate (Kg/m²)
.5 Hr
1 Hr
1.5 Hr
200
220
240
260
280
300
320
340
360
380
0.2 0.25 0.3 0.35
Aver
age
ILBS
(kPa
)
Tack Coat Application Rate (Kg/m²)
0.5 Hr
1 Hr
1.5 Hr

Chapter IV Results and Discussions
52
Figure 4.7 presents the variation in the mean interlayer bond strength with application rates and
variation in setting times obtained for CRS-1 type tack coat applied over a clean DBM surface.
The highest bond strength was observed in setting time of 1 hour as compared to others at test
temperature 400C with an application rate of 0.25 Kg/m2.
From the figures 4.4 to 4.7 it is observed that in all test temperatures the maximum interlayer
bond strength was found at 0.25 Kg/m2 application rate when setting time for rapid setting
emulsions (CRS-1) taken 1 hour as compared to 0.5 and 1.5 hours. The highest bond strength
was obtained at 250C and the strength was decreased when the test temperature increases.
4.2.1.3 Variation of ILBS with rate of application for CMS-2 type tack coat at various
setting times
In Table 4.4 present the average interlayer bond strength when setting time is 6 hours. The
highest bond strength values are observed at application rate of 0.15 Kg/m2 at all test
temperatures for the CMS-2 type of tack coat.
Table 4.4 ILBS of CMS-2 type tack coat (Considering 6 hour setting time)
Type of Tack Coat
Application rate (Kg/m2)
Average ILBS at different test temperature (kPa) 250C 300C 350C 400C
CMS-2
0.1 962.57 691.37 479.16 318.01 0.15 1013.50 704.10 535.16 342.93 0.2 918.43 697.73 497.84 311.94
0.25 887.45 672.27 423.56 255.92 0.3 729.14 616.67 392.58 230.88

Chapter IV Results and Discussions
53
Figure 4.8 Relationship between Average ILBS and Tack Coat Application Rate at different test
temperature when setting time is 6 hours.
From the figure 4.8 it is observed that in 6 hours setting time of CMS-2 type tack coat, the
maximum interlayer bond strength was found with an application rate of 0.15 Kg/m2 and it
decreased when test temperature and application rate increased.
In Table 4.5 present the average interlayer bond strength when setting time is 9 hours. The
highest bond strength values are observed at application rate of 0.15 Kg/m2 at all test
temperatures for the CMS-2 type of tack coat.
Table 4.5 ILBS of CMS-2 type tack coat (Considering 9 hour setting time)
Type of Tack Coat
Application rate (Kg/m2)
Average ILBS at different test temperature (kPa) 250C 300C 350C 400C
CMS-2
0.1 1000.76 949.83 635.35 423.14 0.15 1045.75 968.93 659.96 441.81 0.2 975.30 874.29 578.47 386.64
0.25 924.37 811.05 516.93 330.62 0.3 812.32 767.34 498.26 317.88
200
300
400
500
600
700
800
900
1000
1100
0.1 0.15 0.2 0.25 0.3 0.35
Aver
age
ILBS
(kPa
)
Tack Coat Application Rate (Kg/m²)
25
30
35
40

Chapter IV Results and Discussions
54
Figure 4.9 Relationship between Average ILBS and Tack Coat Application Rate at different test
temperature when setting time is 9 hours.
From the figure 4.9 it is observed that in 9 hours setting time of CMS-2 type tack coat, the
maximum interlayer bond strength was found with an application rate of 0.15 Kg/m2 and it
decreased when test temperature and application rate increased.
In Table 4.6 present the average interlayer bond strength when setting time is 6 hours. The
highest bond strength value is observed at application rate of 0.15 Kg/m2 at all test temperatures
for the CMS-2 type of tack coat.
Table 4.6 ILBS of CMS-2 type tack coat (Considering 12 hour setting time)
Type of Tack Coat
Application rate (Kg/m2)
Average ILBS at different test temperature (kPa)
250C 300C 350C 400C
CMS-2
0.1 760.68 566.15 348.69 293.27 0.15 798.57 584.84 373.7 318.01 0.2 754.60 534.21 356.73 293.34
0.25 729.14 496.60 332.03 224.40 0.3 628.56 474.01 274.18 212.00
200
300
400
500
600
700
800
900
1000
1100
0.1 0.15 0.2 0.25 0.3 0.35
Aver
age
ILBS
(kPa
)
Tack Coat Application Rate (Kg/m²)
25
30
35
40

Chapter IV Results and Discussions
55
Figure 4.10 Relationship between Average ILBS and Tack Coat Application Rates at different
test temperature when setting time is 12 hours.
From the figure 4.10 it is observed that in 12 hours setting time of CMS-2 type tack coat, the
maximum interlayer bond strength was found with an application rate of 0.15 Kg/m2 and it
decreased when test temperature and application rate increased.
4.2.1.4 Comparisons of Average ILBS and Tack Coat Application Rates at different test
temperatures with various setting times of CMS-2 type tack coat.
Figure 4.11 Relationship between Average ILBS and Tack Coat Application Rates at 250C for
the CMS-2 type of tack coat.
200
300
400
500
600
700
800
900
0.1 0.15 0.2 0.25 0.3 0.35
Aver
age
ILBS
(kPa
)
Tack Coat Application Rtae (Kg/m²)
25
30
35
40
600650700750800850900950
100010501100
0.1 0.15 0.2 0.25 0.3 0.35
Aver
age
ILBS
(kPa
)
Tack Coat Application Rate (Kg/m²)
6
9
12

Chapter IV Results and Discussions
56
Figure 4.11 shows the variation in the mean interlayer bond strength with application rates and
variation in setting times obtained for CMS-2 type tack coat applied over a clean DBM surface.
The highest bond strength was observed in setting time of 9 hours as compared to others at test
temperature 250C with an application rate of 0.15 Kg/m2.
Figure 4.12 Relationship between Average ILBS and Tack Coat Application Rates at 300C for
the CMS-2 type of tack coat
Figure 4.12 shows the variation in the mean interlayer bond strength with application rates and
variation in setting times obtained for CMS-2 type tack coat applied over a clean DBM surface.
The highest bond strength was observed in setting time of 9 hours as compared to others at test
temperature 300C with an application rate of 0.15 Kg/m2.
400
500
600
700
800
900
1000
0.1 0.15 0.2 0.25 0.3 0.35
Aver
age
ILBS
(kPa
)
Tack Coat Application Rate (Kg/m²)
6
9
12
30cms

Chapter IV Results and Discussions
57
Figure 4.13 Relationship between Average ILBS and Tack Coat Application Rates at 350C for
the CMS-2 type of tack coat.
Figure 4.13 shows the variation in the mean interlayer bond strength with application rates and
variation in setting times obtained for CMS-2 type tack coat applied over a clean DBM surface.
The highest bond strength was observed in setting time of 9 hours as compared to others at test
temperature 350C with an application rate of 0.15 Kg/m2.
Figure 4.14 Relationship between Average ILBS and Tack Coat Application Rates at 400C for
the CMS-2 type of tack coat.
200250300350400450500550600650700
0.1 0.15 0.2 0.25 0.3 0.35
Aver
age
ILBS
(kPa
)
Tack Coat Application Rate (Kg/m²)
6
9
12
35cms
200
250
300
350
400
450
500
0.1 0.15 0.2 0.25 0.3 0.35
Aver
age
ILBS
(kPa
)
Tack Coat Application Rate (Kg/m²)
6
9
12

Chapter IV Results and Discussions
58
Figure 4.14 shows the variation in the mean interlayer bond strength with application rates and
variation in setting times obtained for CMS-2 type tack coat applied over a clean DBM surface.
The highest bond strength was observed in setting time of 9 hours as compared to others at test
temperature 400C with an application rate of 0.15 Kg/m2.
From the above figures 4.11 to 4.14 it is observed that in all test temperatures the maximum
bond strength was found out at 0.15 Kg/m2 application rate when setting time for medium setting
emulsions (CMS-2) considered as 9 hours as compared to 6 and 12 hours. The highest bond
strength was obtained at 250C and the strength was decreased when the test temperature
increases.
4.2.1.5 Variation of ILBS with rate of application when VG 30 bitumen focused as a tack
coat considering various setting times.
In Table 4.7 present the interlayer bond strength when the upper layer has been compacted
immediately after application of binding material (VG 30). The highest interlayer bond strength
values are observed at application rate of 0.2 Kg/m2 at all test temperatures for bitumen as a tack
coat.
Table 4.7 ILBS of VG 30 as a tack coat (Considering 0 hour setting time)
Type of Tack Coat
Application rate (Kg/m2)
Average ILBS at different test temperature (kPa)
250C 300C 350C 400C
VG 30 0.1 672.27 600.12 392.58 355.66 0.2 723.20 653.17 497.84 428.56 0.3 628.13 491.47 355.66 280.96

Chapter IV Results and Discussions
59
Figure 4.15 Relationship between Average ILBS and Application Rates of bitumen at different
test temperature considering 0 hour setting time.
From figure 4.15 it is observed that when bitumen is focused as a tack coat, the maximum
interlayer bond shear strength was found at 0.2 Kg/m2 rate of application at all test temperatures
when the upper layer has been compacted immediately after application of bitumen and the
strength decreased when test temperature and application rate increased.
In Table 4.8 present the interlayer bond strength when setting time is 0.5 hours. The highest bond
strength values are observed at application rate of 0.2 Kg/m2 at all test temperatures for bitumen
as a tack coat.
Table 4.8 ILBS of VG 30 as a tack coat (Considering 0.5 hour setting time)
Type of Tack Coat
Application rate (Kg/m2)
Average ILBS at different test temperature (kPa) 250C 300C 350C 400C
VG 30 0.1 773.28 672.27 642.14 435.45 0.2 868.35 798.74 691.37 572.11 0.3 811.05 640.86 560.65 367.97
250
300
350
400
450
500
550
600
650
700
750
0.1 0.15 0.2 0.25 0.3 0.35
Aver
age
ILBS
(kPa
)
Bitumen Application Rate (Kg/m²)
25
30
35
40

Chapter IV Results and Discussions
60
Figure 4.16 Relationship between Average ILBS and Application Rates of bitumen at different
test temperature considering 0.5 hour setting time.
From figure 4.16 it is observed that when bitumen is focused as a tack coat, the maximum
interlayer bond shear strength was found at 0.2 Kg/m2 rate of application at all test temperatures
when the upper layer has been compacted 0.5 hours after application of bitumen and the strength
decreased when test temperature and application rate increased.
In Table 4.9 present the interlayer bond strength when setting time is 1 hour. The highest bond
strength value is observed at application rate of 0.2 Kg/m2 at all test temperatures for bitumen as
a tack coat.
Table 4.9 ILBS of VG 30 as a tack coat (Considering 1 hour setting time)
Type of Tack Coat
Application rate (Kg/m2)
Average ILBS at different test temperature (kPa) 250C 300C 350C 400C
VG 30 0.1 760.97 653.17 522.45 392.16 0.2 836.94 723.20 628.55 491.47 0.3 735.51 610.30 491.47 324.25
300
400
500
600
700
800
900
0.1 0.15 0.2 0.25 0.3 0.35
Aver
age
ILBS
(kPa
)
Bitumen Application Rate (Kg/m²)
25
30
35
40

Chapter IV Results and Discussions
61
Figure 4.17 Relationship between Average ILBS and Application Rates of bitumen at different
test temperature considering 1 hour setting time.
From figure 4.17 it is observed that when bitumen is focused as a tack coat, the maximum
interlayer bond shear strength was found at 0.2 Kg/m2 rate of application at all test temperatures
when the upper layer has been compacted 1 hour after application of bitumen and the strength
decreased when test temperature and application rate increased.
4.2.1.6 Comparisons of Average ILBS and Application Rates at different test temperatures
with various setting times of VG 30 bitumen as a tack coat.
Figure 4.18 Relationship between Aerage ILBS and Application Rates of bitumen at 250C test
temperature considering all setting time.
200
300
400
500
600
700
800
900
0.1 0.15 0.2 0.25 0.3 0.35
Aver
age
ILBS
(kPa
)
Bitumen Application Rate (Kg/m²)
25
30
35
40
600
650
700
750
800
850
900
0.1 0.2 0.3 0.4
Aver
age
ILBS
(kPa
)
Bitumen Application Rate (Kg/m²)
1 hr
0 hr
0.5 hr

Chapter IV Results and Discussions
62
Figure 4.18 shows the variation in the mean interlayer bond strength with application rates and
variation in setting times obtained for VG 30 binder as a tack coat applied over a clean DBM
surface. The highest bond strength was observed in setting time of 0.5 hours at test temperature
250C with an application rate of 0.2 Kg/m2.
Figure 4.19 Relationship between Average ILBS and Application Rates of bitumen at 300C test
temperature considering all setting time.
Figure 4.19 shows the variation in the mean interlayer bond strength with application rates and
variation in setting times obtained for VG 30 binder as a tack coat applied over a clean DBM
surface. The highest bond strength was observed in setting time of 0.5 hours at test temperature
300C with an application rate of 0.2 Kg/m2.
400
450
500
550
600
650
700
750
800
850
0.1 0.2 0.3 0.4
Aver
age
ILBS
(kPa
)
Bitumen Application Rate (Kg/m²)
1 hr
0 hr
0.5 hr

Chapter IV Results and Discussions
63
Figure 4.20 Relationship between Average ILBS and Application Rates of bitumen at 350C test temperature considering all setting time.
Figure 4.20 shows the variation in the mean interlayer bond strength with application rates and
variation in setting times obtained for VG 30 binder as a tack coat applied over a clean DBM
surface. The highest bond strength was observed in setting time of 0.5 hours at test temperature
350C with an application rate of 0.2 Kg/m2.
Figure 4.21 Relationship between Average ILBS and Application Rates of bitumen at 400C test temperature considering all setting time.
300
350
400
450
500
550
600
650
700
750
0.1 0.2 0.3 0.4
Aver
age
ILBS
(kPa
)
Bitumen Application Rate (Kg/m²)
1 hr
0 hr
0.5 hr
200
250
300
350
400
450
500
550
600
0.1 0.2 0.3 0.4
Aver
age
ILBS
(kPa
)
Bitumen Application Rate (Kg/m²)
1 hr
0 hr
0.5 hr

Chapter IV Results and Discussions
64
Figure 4.21 shows the variation in the mean interlayer bond strength with application rates and
variation in setting times obtained for VG 30 binder as a tack coat applied over a clean DBM
surface. The highest bond strength was observed in setting time of 0.5 hours at test temperature
400C with an application rate of 0.2 Kg/m2.
From above figures 4.18 to 4.21, when bitumen focused as a bonding material the average
maximum interlayer bond strength was observed at 250C compared to other three test
temperatures with an application rate 0.2 Kg/m2 at 0.5 hours setting time for it. The bond strength
was decreased when the test temperatures and the application rate increased.
4.2.1.7 Variation of ILBS considering various time interval between successive laying
between DBM and BC bituminous paving layers.
In Table 4.10 present interlayer bond strength when there is no tack coat used for creating bonds
between DBM and BC layer with varying the time interval between successive laying between
them.
Table 4.10 ILBS without using any tack coat
Type of Tack Coat
Time interval between
Successive laying (Hour)
Average ILBS at different test temperature (kPa)
250C 300C 350C 400C
No Tack Coat
0 1038.9 994.40 729.56 578.47 1 836.52 760.97 616.67 466.85 2 760.97 628.98 553.86 417.20 3 689.25 572.53 504.63 398.95 6 572.53 435.87 348.87 305.58

Chapter IV Results and Discussions
65
Figure 4.22 Relationship between Average ILBS and Time interval between successive laying of
overlay at different test temperature with no tack coat used.
From the figure 4.22 it is observed that the maximum interlayer bond strength was found out at
different test temperatures when the overlay placed over the freshly compacted DBM layer and
the strength decreased when test temperature and duration of compaction increased.
4.2.2 Interlayer Bond Strength for Bituminous Macadam (BM) and Semi Dense
Bituminous Concrete (SDBC) Combination.
4.2.2.1 Variation of ILBS with rate of application for a CRS-1 type tack coat considering a
1 hour setting time.
In Table 4.11 present the interlayer bond strength when setting time is 1 hour. The highest
interlayer bond strength value is observed at application rate of 0.15 Kg/m2 at all test
temperatures for CRS-I type tack coat for BM/SDBC combination.
250
350
450
550
650
750
850
950
1050
0 1 2 3 4 5 6 7
Aver
age
ILBS
(kPa
)
Time interval between successive laying (Hours)
25
30
35
40

Chapter IV Results and Discussions
66
Table 5.11 ILBS of CRS-1 type tack coat
Type of Tack Coat
Application rate (Kg/m2)
Average ILBS at different test temperature (kPa) 250C 300C 350C 400C
CRS-1
0.1 773.28 665.90 523.30 367.97 0.15 930.74 786.01 597.15 448.18 0.2 862.41 635.35 492.32 348.87
0.25 754.60 566.17 423.56 293.27 0.3 665.90 460.91 386.64 255.50
Figure 4.23 Relationship between Average ILBS and Tack Coat Application Rates at different
test temperature for the CRS-1 type of tack coat.
From the figure 4.23 it is observed that in the CRS-1 type of tack coat, the maximum interlayer
bond strength was found at all test temperatures with an application rate of 0.15 Kg/m2 and the
strength was decreased when test temperature and application rate increased.
200
300
400
500
600
700
800
900
1000
0.1 0.15 0.2 0.25 0.3 0.35
Aver
age
ILBS
(kPa
)
Tack Coat Application Rate (Kg/m²)
25
30
35
40

Chapter IV Results and Discussions
67
4.2.2.2 Variation of ILBS with rate of application for a CMS-2 type tack coat considering 9
hours setting times.
In Table 4.12 present the interlayer bond strength when setting time is 9 hours. The highest
interlayer bond strength values are observed at application rate of 0.15 Kg/m2 at all test
temperatures for a CMS-2 type tack coat for BM/SDBC combination.
Table 4.12 ILBS of CMS-2 type tack coat
Type of Tack Coat
Application rate (Kg/m2)
Average ILBS at different test temperature (kPa) 250C 300C 350C 400C
CMS-2
0.1 760.97 578.47 491.47 305.58 0.15 918.00 748.24 587.81 411.26 0.2 855.19 597.15 448.60 274.59
0.25 760.55 553.86 404.89 243.19 0.3 654.02 448.18 361.60 211.78
Figure 4.24 Relationship between Average ILBS and Tack Coat Application Rates at different
test temperature for the CMS-2 type of tack coat.
200
300
400
500
600
700
800
900
1000
0.1 0.15 0.2 0.25 0.3 0.35
Aver
age
ILBS
(kPa
)
Tack Coat Application Rate (Kg/m²)
25
30
35
40

Chapter IV Results and Discussions
68
From the figure 4.24 it is observed that in the CMS-2 type of tack coat, the maximum interlayer
bond strength found at all test temperatures with application rate 0.15 Kg/m2 and the strength
was decreased when test temperature and application rate increased.
4.2.2.3 Comparisons of Average ILBS and Tack Coat Application Rates of CMS-2 and
CRS-1 type tack coat at different test temperatures.
Figure 4.25 Relationships between Average ILBS and Application Rates at 250C
Figure 4.26 Relationships between Average ILBS and Application Rates at 300C
650
700
750
800
850
900
950
0.1 0.15 0.2 0.25 0.3 0.35
Aver
age
ILBS
(kPa
)
Tack Coat Application Rate (Kg/m²)
CRS-1
CMS-2
400
450
500
550
600
650
700
750
800
850
0.1 0.15 0.2 0.25 0.3 0.35
Aver
age
ILBS
(kPa
)
Tack Coat Application Rate (Kg/m²)
CRS-1
CMS-2
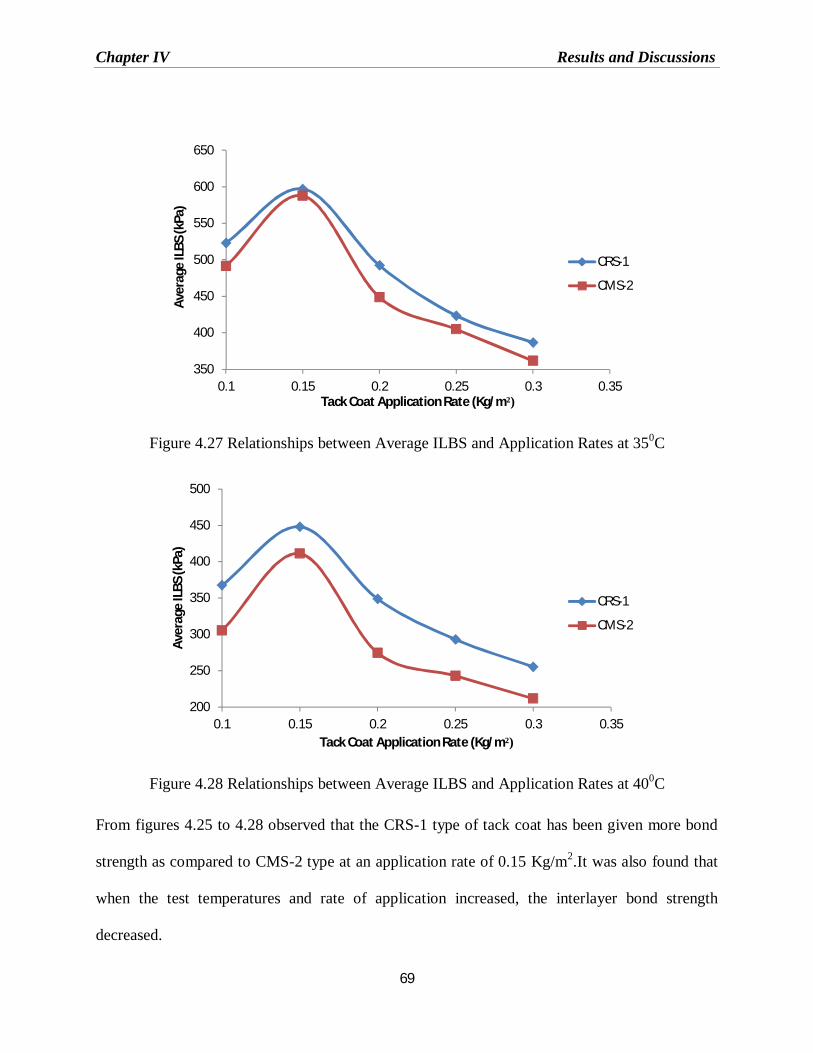
Chapter IV Results and Discussions
69
Figure 4.27 Relationships between Average ILBS and Application Rates at 350C
Figure 4.28 Relationships between Average ILBS and Application Rates at 400C
From figures 4.25 to 4.28 observed that the CRS-1 type of tack coat has been given more bond
strength as compared to CMS-2 type at an application rate of 0.15 Kg/m2.It was also found that
when the test temperatures and rate of application increased, the interlayer bond strength
decreased.
350
400
450
500
550
600
650
0.1 0.15 0.2 0.25 0.3 0.35
Aver
age
ILBS
(kPa
)
Tack Coat Application Rate (Kg/m²)
CRS-1
CMS-2
200
250
300
350
400
450
500
0.1 0.15 0.2 0.25 0.3 0.35
Aver
age
ILBS
(kPa
)
Tack Coat Application Rate (Kg/m²)
CRS-1
CMS-2

Chapter IV Results and Discussions
70
4.3 Overall Performance of Inter Layer Bond Strength
4.3.1 ILBS comparisons between two types of tack coat, bitumen as tack coat and with no
tack coat at different test temperature for the Interface of DBM and BC type of
combination.
Figure 4.29 Comparisons of ILBS at different test temperature made
From the figure 4.29, the maximum bond strength was found at 250C among all others three
cases considered as bonding materials for DBM and BC type of combination of the bituminous
paving layer. When the bituminous concrete (BC) considered as upper layer placed immediately
over the freshly compacted dense bitumen macadam (DBM) layer was given maximum
interlayer bond strength as compared to all others. The interlayer strength decreased when the
test temperatures, rate of applications and time interval between successive laying increased.
200
300
400
500
600
700
800
900
1000
1100
25 30 35 40
Aver
age
ILBS
(kPa
)
Test temperature (0C)
CRS
CMS
BITUMEN
WT TC

Chapter IV Results and Discussions
71
4.3.2 ILBS comparisons between two types of tack coat at different test temperature for Interface of BM and SDBC type of combination.
Figure 4.30 Comparisons of ILBS at different test temperature made
From the figure 4.30, the maximum mean interlayer bond strength was found at 250C among all
other three test temperatures considered for the BM and SDBC type of combination for the
bituminous paving layer. In all cases the CRS-1 type emulsion results more as compared to
CMS-2 type of tack coat. The interlayer strength decreased when the test temperatures, rate of
applications and durations of compaction increased
200
300
400
500
600
700
800
900
1000
25 30 35 40
Aver
age
ILBS
(kPa
)
Test Temperature (ºC)
CRS-1
CMS-2

72
Chapter V
Conclusions and Future Scope
Introduction
Conclusions
Futures scope of works

Chapter V Conclusions and Future Scope
73
5.1 Introduction
In this chapter the conclusions of the laboratory study carried out for evaluating the interlayer
bond strength between two types of bituminous paving layer have been summarized. The scopes
and recommendation for the future research work are also discussed in this chapter.
5.2 Conclusions
A study has been made in this project to evaluate the interlayer bond strength in the laboratory
for different types of tack coat using laboratory prepared samples for DBM/BC and BM/SDBC
layer combinations. A special device has been designed and fabricated, which can be fitted to the
loading frame of the Modified Marshall Test apparatus to determine the interlayer bond strength
of two-layered bituminous specimens. The specimens have been tested at four different test
temperatures, namely 250, 300, 350 and 400C, which are very common in our country. A
specimen basically consists of two bituminous layers, bonded together by emulsion or bitumen.
The upper and lower layer combination is either DBM or BC or BM and SDBC respectively.
Various application rates have been tried and in case of emulsion, different setting times have
been tried. All such variations in materials and sample casting methods have been attempted to
explore the optimum condition for appropriate bond strength in a particular situation. The
following conclusions are drawn from the results of the tests conducted.
DBM/BC Combination
It is observed that for CRS-1, maximum interlayer bond strength results at 0.25 Kg/m2
application rate in all test temperature conditions used and for CMS-2, at 0.15 Kg/m2
application rate irrespective of different test temperatures. These optimum application
rates are also found for all setting times considered for both types of emulsions.

Chapter V Conclusions and Future Scope
74
In the cationic medium setting type of emulsion used as tack coat, the maximum
interlayer bond strength was found when setting time was at 9 hours and in the cationic
rapid setting type of emulsion, maximum interlayer strength was observed when setting
was at 1 an hour.
When conventional VG 30 bitumen is used as a tack coat, the maximum interlayer bond
strength is observed at 0.2 Kg/m2 application rate when setting time was at 0.5 hours in
all test temperatures used.
When no tack coat is used, maximum bond strength at the interface available when the
upper layer mix is laid and compacted immediately after the lower layer compaction
was completed. If the duration of compaction increased between two layers, the
interlayer bond strength decreased.
At a test temperature 250C, all types of tack coat used and other considerations taken
for observing the interlayer bond strength have been found maximum value as compared
to other test temperatures.
BM/SDBC Combination
It is determined that for CRS-1, maximum interlayer bond strength results at a 0.15
Kg/m2 application rate in all test temperature conditions used and for CMS-2, at the
0.15 Kg/m2 application rate irrespective of different test temperatures.
The interlayer bond strength is decreased when the test temperature increased for both
types of tack coat used. The maximum bond strength has been found out at 250C for
both types of tack coat used.

Chapter V Conclusions and Future Scope
75
5.3 Future Scope of Works
Analysis the bond strength using finite element method and comparison of laboratory
results with theoretical work.
Experimentation using the fabricated device in respect of various loading combinations.
Comparison of the experimental results with that given in the literature and experiments
conducted earlier.
Testing of field core samples and comparison with laboratory prepared ones.

References
76
[1] ASTM D 88 (1994). “Standard Test Method for Saybolt Viscosity”. American Society
for Testing and Materials, Philadelphia, USA
[2] ASTM D244 (2004). “Standard Test Method for Residue by Evaporation of Emulsified
Asphalt”. American Society for Testing and Materials, Philadelphia, USA
[3] ASTM D 4402 (2006). “Standard Test Method for Viscosity Determination of Asphalt at
Elevated Temperatures Using a Rotational Viscometer”. American Society for Testing
and Materials, Philadelphia, USA
[4] Buchanan, M. S. and Woods, M. E. (2004). Mississippi Transportation Research Center.
[5] Chehab, G., Medeiros, M., and Solaimanian, M. (2008). “Evaluation of bond
performance of Fast Tack Emulsion for Tack Coat applications.” Pennsylvania
Department Of Transportation, Report No. FHWA-PA-2008-017-PSU021, Pennsylvania
Transportation Institute.
[6] CPB 03-1 Paint Binder (Tack Coat) Guidelines (2003), California Department of
Transportation, Construction Procedure Bulletin.
[7] Giri, J. P., Panda, M. and Chattaraj, U. (2013). “Inter- Layer Strength of Bituminous
Paving Layers– A Laboratory Case Study.” 2nd workshop on Indian water management
in 21st century & symposium on sustainable infrastructure development (IWMSID-
2013) , IIT Bhubaneswar, Odisha
[8] IS: 2386 (1963), “Methods of Test for Aggregates for Concrete (Part- I): Particle Size
and Shape”, Bureau of Indian Standards, New Delhi.
[9] IS: 2386 (1963), “Methods of Test for Aggregates for Concrete (Part-III): Specific
Gravity, Density, Voids, Absorption, Bulking”, Bureau of Indian Standards, New Delhi.
[10] IS: 2386 (1963), “Methods of Test for Aggregates for Concrete (Part-IV): Mechanical

References
77
Properties”, Bureau of Indian Standards, New Delhi.
[11] IS: 1203 (1978), “Methods for Testing Tar and Bituminous Materials: Determination of
Penetration”, Bureau of Indian Standards, New Delhi.
[12] IS: 1205 (1978), “Methods for Testing Tar and Bituminous Materials: Determination of
Softening Point”, Bureau of Indian Standards, New Delhi.
[13] IS: 1208 (1978), “Methods for Testing Tar and Bituminous Materials: Determination of
Ductility (First Revision)”, Bureau of Indian Standards, New Delhi.
[14] IS: 8887 (2004), “Bitumen Emulsion for Roads (Cationic Type) - Specification (Second
Revision)”, Bureau of Indian Standards, New Delhi.
[15] Kucharek,T., Esenwa, M. and Davidson, J.K. (2011), “Determination of factors affecting
shear testing performance of Bituminous emulsion tack coats.” 7e congrès annuel de
Bitume Québec, Saint-Hyacinthe, Canada.
[16] Junior, M. S. M. (2009). “Evaluation of Bond Performance of an Ultra-rapid Setting
Emulsion for Tack Coat Applications”. (Doctoral dissertation, The Pennsylvania State
University).
[17] Ministry of Road Transport and Highways (2001), ‘’Manual for Construction and
Supervision of Bituminous Works’’, New Delhi.
[18] Miro, R., Martínez, A., & Perez, F. (2006). “Evaluation of Effect of Heat-Adhesive
Emulsions for Tack Coats with Shear Test: From the Road Research Laboratory of
Barcelona.” Transportation Research Record: Journal of the Transportation Research
Board, 1970 (1), 64-70.
[19] Mohammad, L.N., Raqib, M.A., and Huang, B. (2002), “Influence of Bituminous Tack
Coat Materials on Interface Shear Strength,” Transportation Research Record: Journal of

References
78
the Transportation Research Board, No. 1789, pp. 56-65, Washington, D.C.,
Transportation Research Board of the National Academies.
[20] Mohammad, L. N., Bae, A., Elseifi, M. A., Button, J., & Scherocman, J. A. (2009).
“Evaluation of Bond Strength of Tack Coat Materials in Field”. Transportation Research
Record: Journal of the Transportation Research Board, 2126 (1), 1-11.
[21] Molenaar A.A.A., Heerkens, J.C.P., and Veroeven, J.H.M. (1986) “Effects of Stress
Absorbing Membrane Interlayers.” Asphalt Paving Technology, Vol.55, Proceedings of
the Association of Asphalt Paving Technologies.
[22] Paul, H. R., & Scherocman, J. A. (1998). “Friction testing of tack coat surfaces”.
Transportation Research Record: Journal of the Transportation Research Board, 1616
(1), 6-12.
[23] Patel, N. B. (2010). “Factors affecting the interface shear strength of pavement layers”.
Master’s Thesis, Department of Civil and Environmental Engineering, The Louisiana
State University and Agricultural and Mechanical College.
[24] “Proper Tack Coat Application (2001).” Technical Bulletin, Flexible Pavement of Ohio,
Columbus, OH.
[25] Raab, C., & Partl, M. N. (2004). “Interlayer shear performance: experience with different
pavement structures”. In proceedings of the 3rd Eurasphalt and Eurobitume Congress
held Vienna, MAY 2004 (Vol. 1).
[26] Roffe, Jean-Claude, and Chaignon, F. (2002) "Characterisation tests on bond coats:
worldwide study, impact, tests, recommendations." proceedings of the 3rd international
conference on bituminous mixtures and pavements, held thessaloniki, greece, november
2002. Vol. 1.

References
79
[27] Roberts, F.L., Kandhal, P.S., Brown, E.R., Lee, D., and Kennedy, T.W. (1996). “Hot Mix
Bituminous Materials, Mixture Design, Construction.” 2nd Edition, Lanham, Maryland,
National Bituminous Pavement Association and Research Education Foundation.
[28] Sangiorgi, C., Collop, A. C., & Thom, N. H. (2002). “Laboratory assessment of bond
condition using the Leutner shear test”. In proceedings of the 3rd international
conference on bituminous mixtures and pavements, held thessaloniki, greece, november
2002. (vol. 1).
[29] Santagata, E., and Canestari, F. (1994). “Tensile and Shear tests of Interfaces in Asphalt
Mixtures: a New Perspective on Their Failure Criteria,” Proceedings of the 2nd
International of Symposium on Highway Surfacing, Ulster, Ireland.
[30] Santagata, E., and Canestari, F. (2005). “Temperature effects on the Shear Behaviour of
tack Coat Emulsion used in flexible Pavements.” International Journal of Pavement
Engineering, Volume 6, Issue 1, pp 39-46.
[31] Sholar, G. A., Page, G. C., Musselman, J. A., Upshaw, P. B., & Moseley, H. L. (2004).
“Preliminary investigation of a test method to evaluate bond strength of bituminous tack
coats (with discussion)”. Journal of the Association of Asphalt Paving Technologists,
Vol. 73.
[32] Sutradhar, B. B. (2012). “Evaluation of bond between bituminous pavement layers”
(Doctoral dissertation).
[33] Tashman, L., Nam, K., & Papagiannakis, A. T. (2006). “Evaluation of the influence of
tack coat construction factors on the bond strength between pavement layers.” (No. WA-
RD 645.1). Washington State Department of Transportation.
References
80
[34] Tandon, V., & Deysarkar, I. (2005). “Field Evaluation of Tack Coat Quality
Measurement Equipments”. International Journal of Pavements, 4 (1-2).
[35] The Asphalt Handbook (1989) Manual Series No. 4 (MS-4), The Asphalt Institute,
Lexington, KY.
[36] The Hot-Mix Asphalt Paving Handbook (2000). AC 150/5370-14A, U.S. Army Corps of
Engineers, Washington D.C.
[37] Uzan, J., Liveneh, M., and Eshed, Y.(1978), “Investigation of Adhesion Propeties
Between Asphaltic-Concrete Layers” Proceedings of the Association of Asphalt Paving
79 Technologists Technical Sessions. Vol. 47, Lake Buena Vista, FL, pp. 495 – 521.
[38] West, R. C., Zhang, J., & Moore, J. (2005). “Evaluation of bond strength between
pavement layers”. NCAT report, 05-08.
[39] Wheat, M. (2007). “Evalutation Of Bond Strength At Asphalt Interfaces” (Doctoral
dissertation, Kansas State University).
[40] www.roadscience.net/services/distress-guide.
[41] www.pavementinteractive.org/article/general-guidancepavement-distress.


